
Evaluation Metrics CS229 Yining Chen (Adapted from


Description: Evaluation Metrics CS229 Yining Chen (Adapted from slides by Anand Avati) May 1, 2020 Topics Why are metrics important? Binary classifiers Rank view, Thresholding Metrics Confusion Matrix Point metrics: Accuracy, Precision, Recall
Related Topics
Download Presentation
"Evaluation Metrics CS229 Yining Chen (Adapted from" is the property of its rightful owner. Permission is granted to download and print the materials on this website for personal, non-commercial use only, and to display it on your personal computer provided you do not modify the materials and that you retain all copyright notices contained in the materials. By downloading content from our website, you accept the terms of this agreement.
Presentation Transcript
slide1. Evaluation Metrics
CS229 Yining Chen
(Adapted from slides by Anand Avati)
May 1, 2020<br>
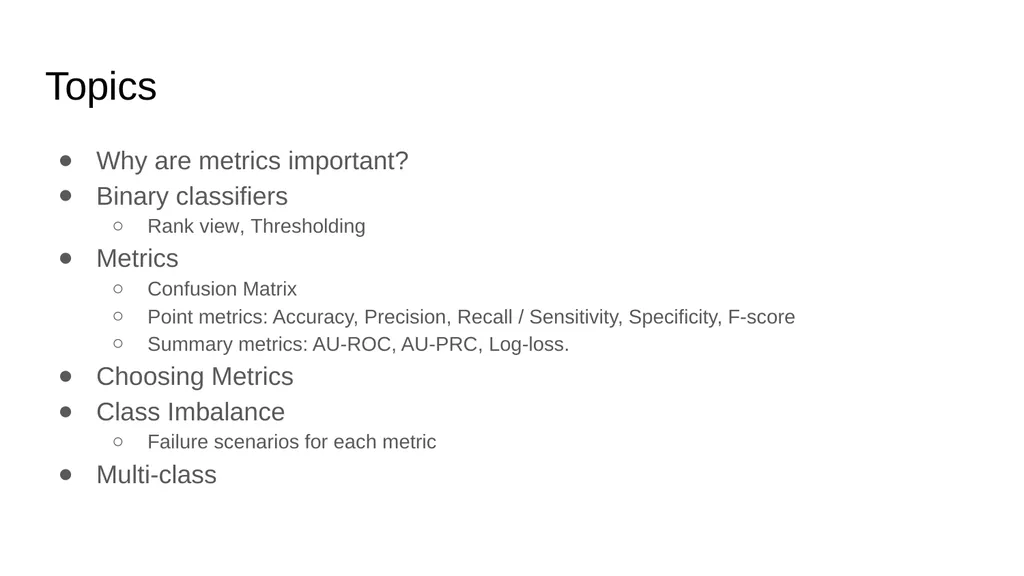
slide2. Topics Why are metrics important?
Binary classifiers
Rank view, Thresholding
Metrics
Confusion Matrix
Point metrics: Accuracy, Precision, Recall / Sensitivity, Specificity, F-score
Summary metrics: AU-ROC, AU-PRC, Log-loss.
Choosing Metrics
Class Imbalance
Failure scenarios for each metric
Multi-class<br>
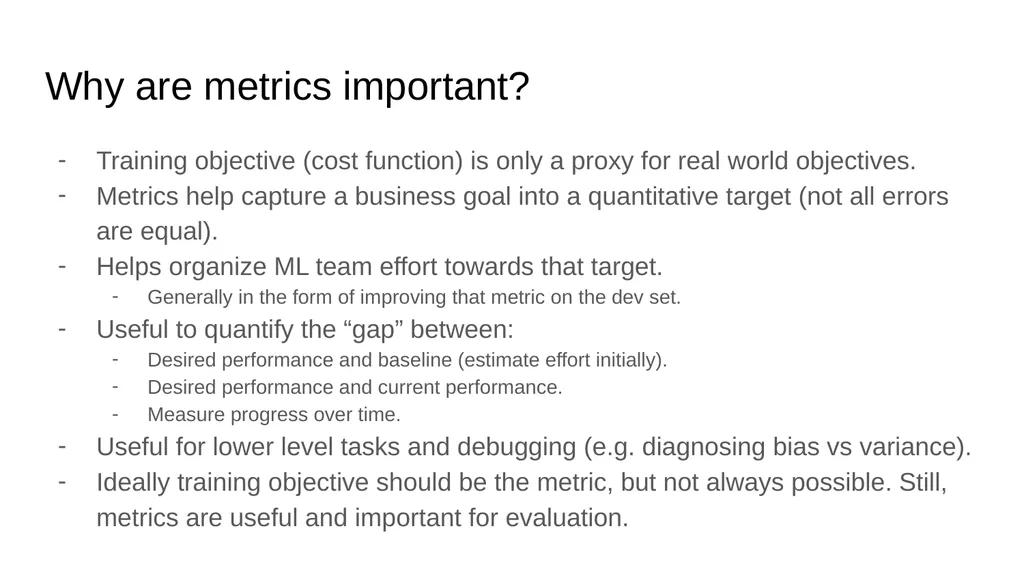
slide3. Why are metrics important? Training objective (cost function) is only a proxy for real world objectives.
Metrics help capture a business goal into a quantitative target (not all errors are equal).
Helps organize ML team effort towards that target.
Generally in the form of improving that metric on the dev set.
Useful to quantify the “gap” between:
Desired performance and baseline (estimate effort initially).
Desired performance and current performance.
Measure progress over time.
Useful for lower level tasks and debugging (e.g. diagnosing bias vs variance).
Ideally training objective should be the metric, but not always possible. Still, metrics are useful and important for evaluation.<br>
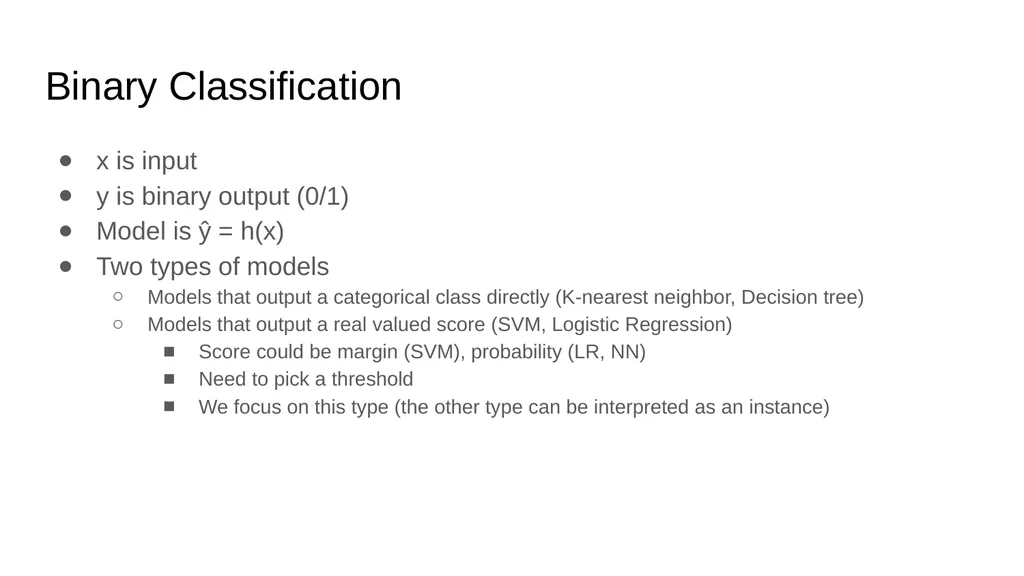
slide4. Binary Classification x is input
y is binary output (0/1)
Model is ŷ = h(x)
Two types of models
Models that output a categorical class directly (K-nearest neighbor, Decision tree)
Models that output a real valued score (SVM, Logistic Regression)
Score could be margin (SVM), probability (LR, NN)
Need to pick a threshold
We focus on this type (the other type can be interpreted as an instance)<br>
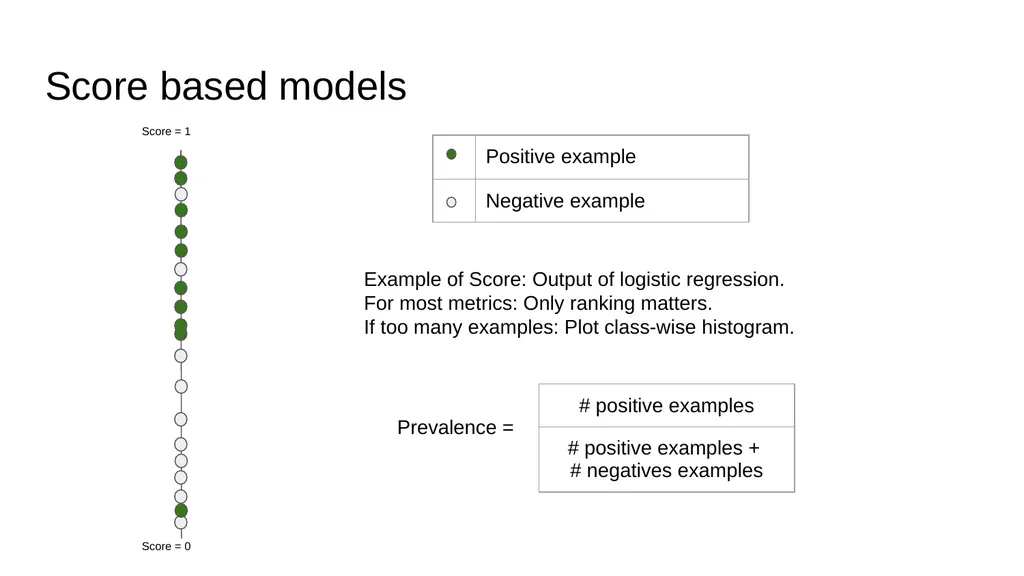
slide5. Score based models Example of Score: Output of logistic regression.
For most metrics: Only ranking matters.
If too many examples: Plot class-wise histogram.<br>
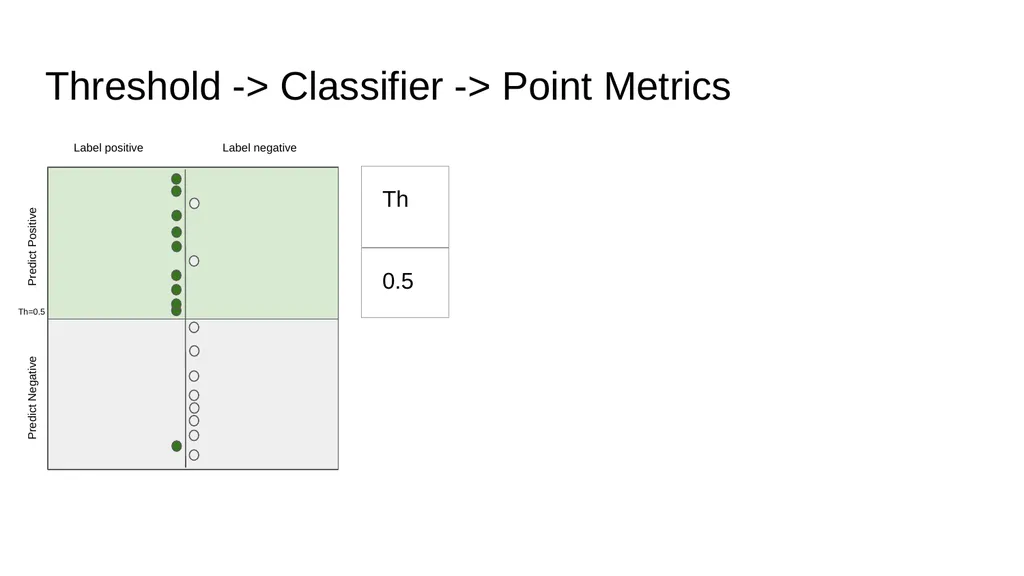
slide6. Threshold -> Classifier -> Point Metrics Th=0.5<br>
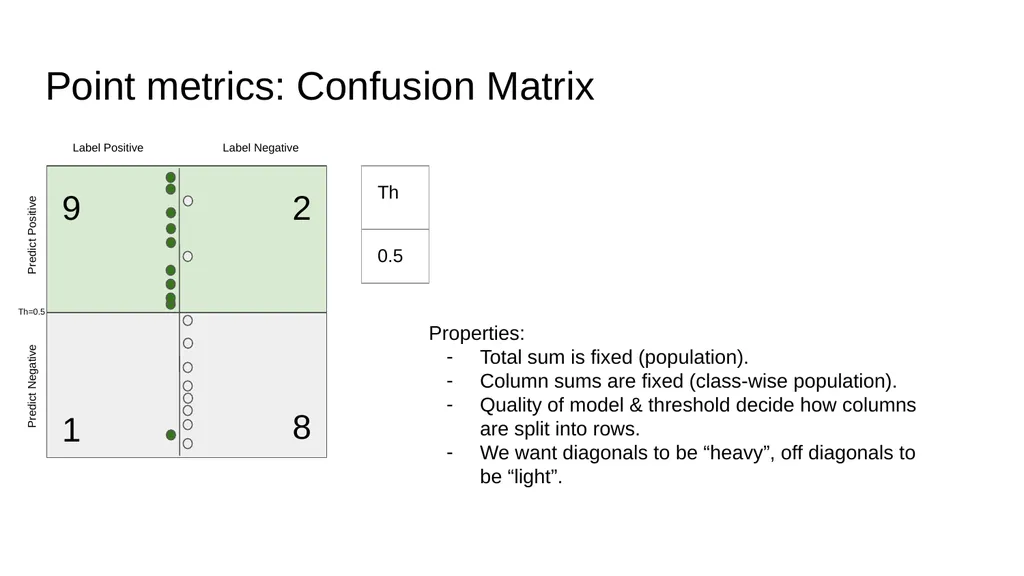
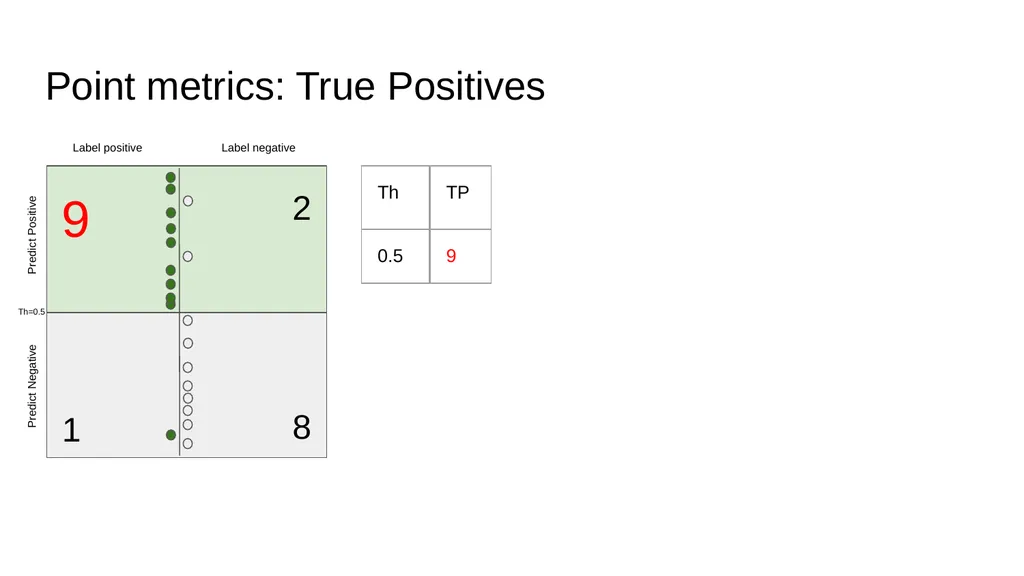
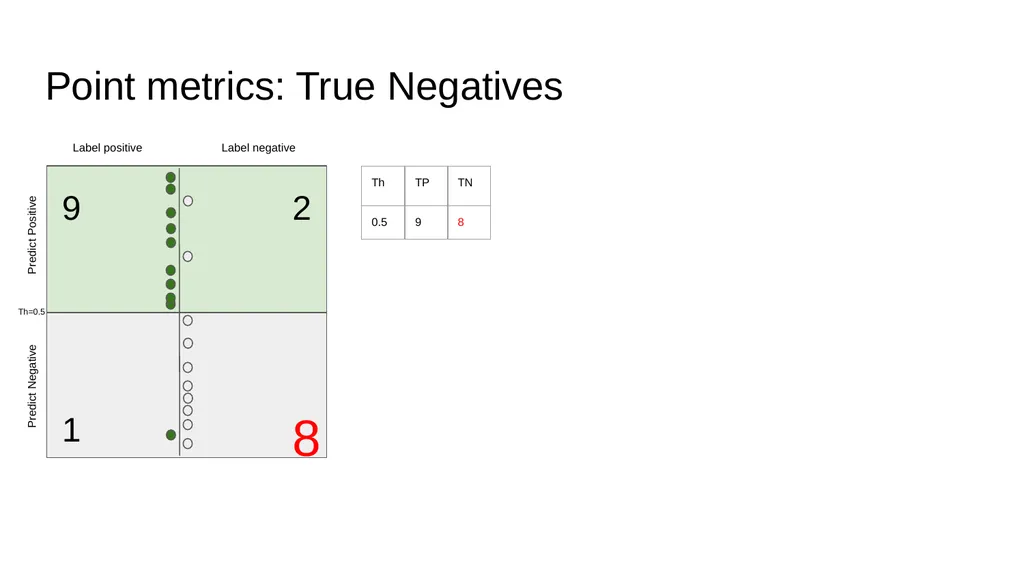
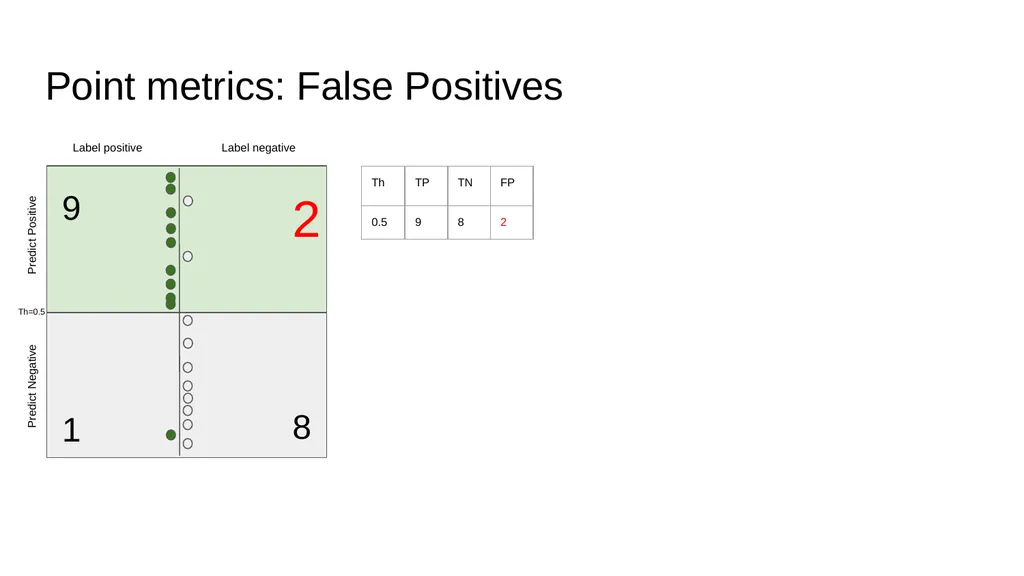
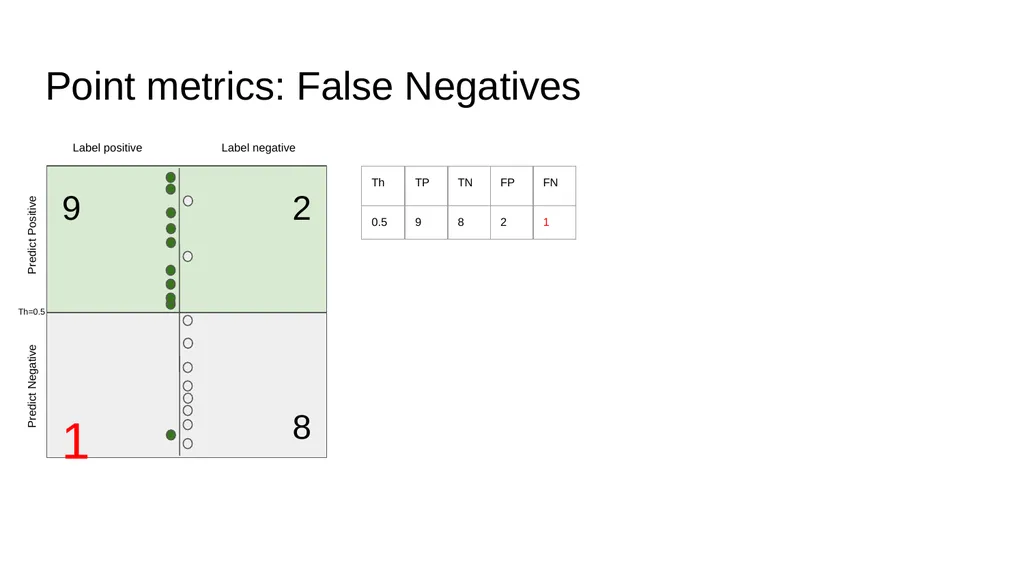
slide7. Point metrics: Confusion Matrix Label Positive Label Negative Predict Negative Predict Positive 9 8 2 1 Th=0.5 Properties:
Total sum is fixed (population).
Column sums are fixed (class-wise population).
Quality of model & threshold decide how columns are split into rows.
We want diagonals to be “heavy”, off diagonals to be “light”.<br>
slide8. Point metrics: True Positives Label positive Label negative 9 8 2 1 Th=0.5 Predict Negative Predict Positive<br>
slide9. Point metrics: True Negatives Label positive Label negative 9 8 2 1 Th=0.5 Predict Negative Predict Positive<br>
slide10. Point metrics: False Positives Label positive Label negative 9 8 2 1 Th=0.5 Predict Negative Predict Positive<br>
slide11. Point metrics: False Negatives Label positive Label negative 9 8 2 1 Th=0.5 Predict Negative Predict Positive<br>
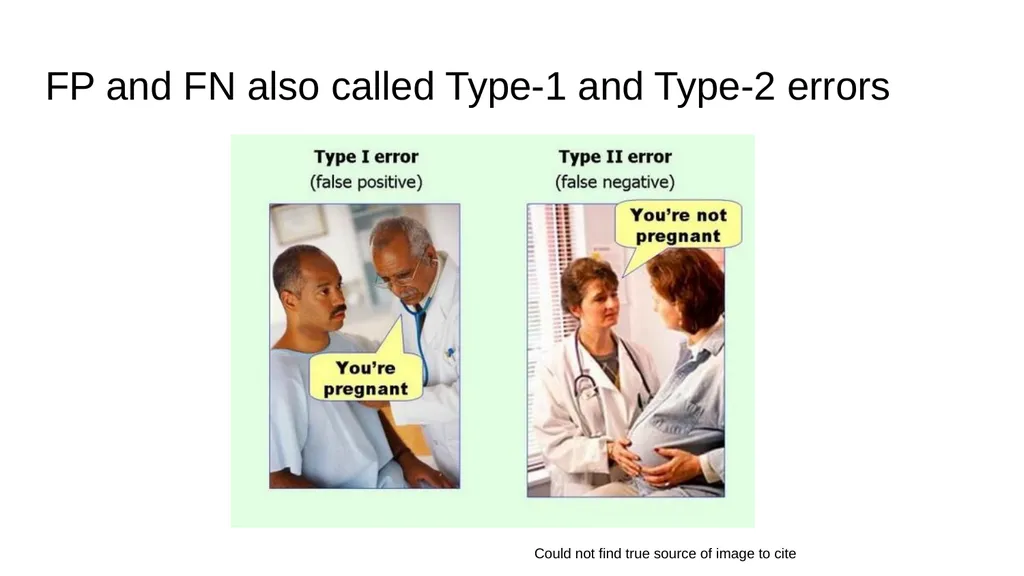
slide12. FP and FN also called Type-1 and Type-2 errors Could not find true source of image to cite<br>
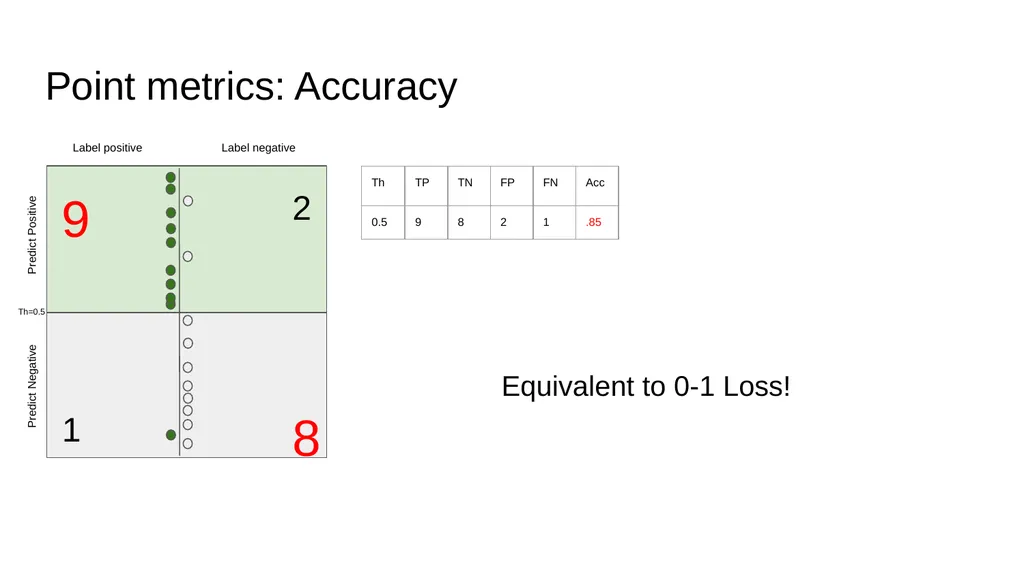
slide13. Point metrics: Accuracy Label positive Label negative 9 8 2 1 Th=0.5 Predict Negative Predict Positive Equivalent to 0-1 Loss!<br>
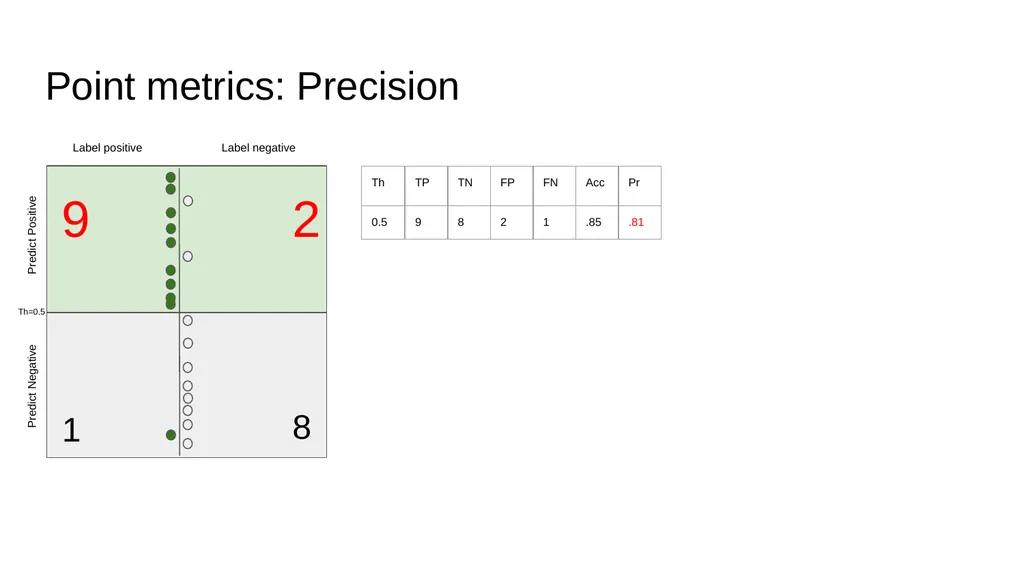
slide14. Point metrics: Precision Label positive Label negative 9 8 2 1 Th=0.5 Predict Negative Predict Positive<br>
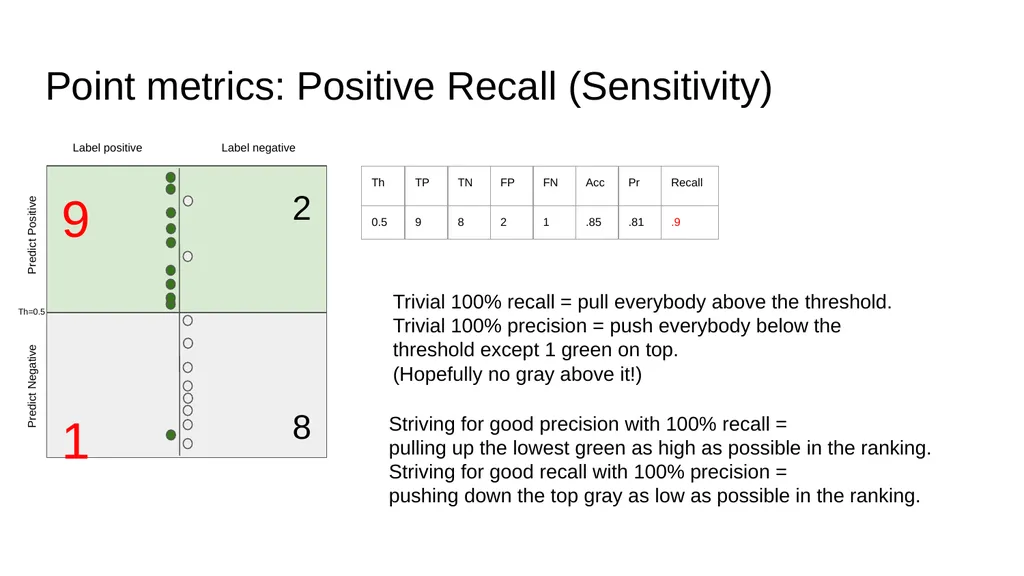
slide15. Point metrics: Positive Recall (Sensitivity) Label positive Label negative 9 8 2 1 Th=0.5 Predict Negative Predict Positive Trivial 100% recall = pull everybody above the threshold.
Trivial 100% precision = push everybody below the threshold except 1 green on top.
(Hopefully no gray above it!) Striving for good precision with 100% recall =
pulling up the lowest green as high as possible in the ranking.
Striving for good recall with 100% precision =
pushing down the top gray as low as possible in the ranking.<br>
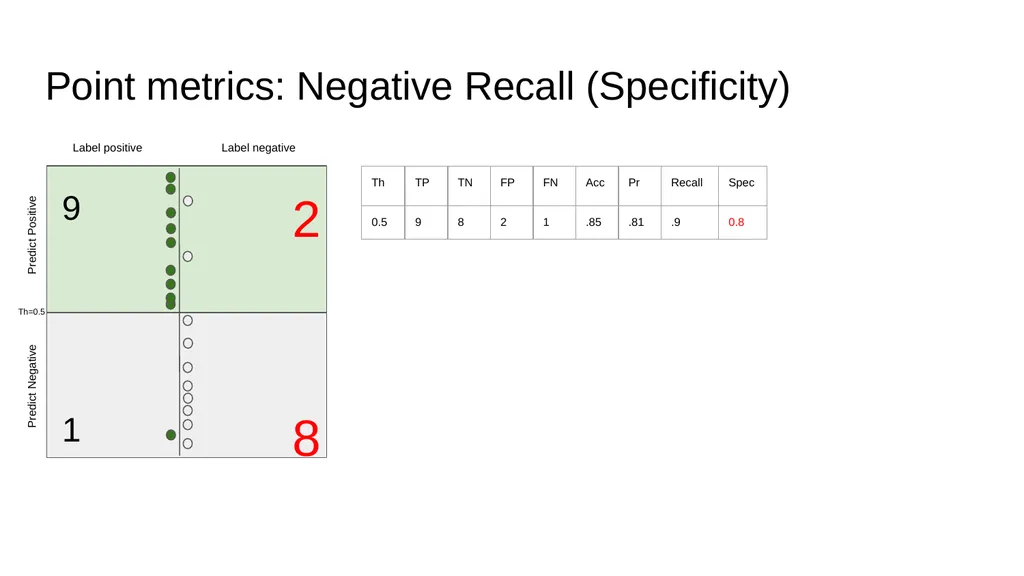
slide16. Point metrics: Negative Recall (Specificity) Label positive Label negative 9 8 2 1 Th=0.5 Predict Negative Predict Positive<br>
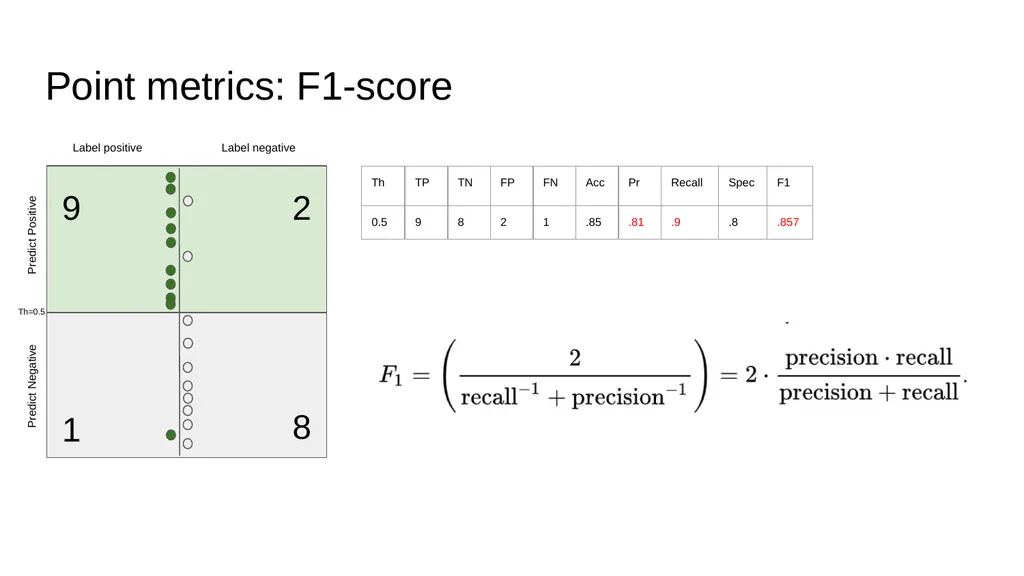
slide17. Point metrics: F1-score Label positive Label negative 9 8 2 1 Th=0.5 Predict Negative Predict Positive<br>
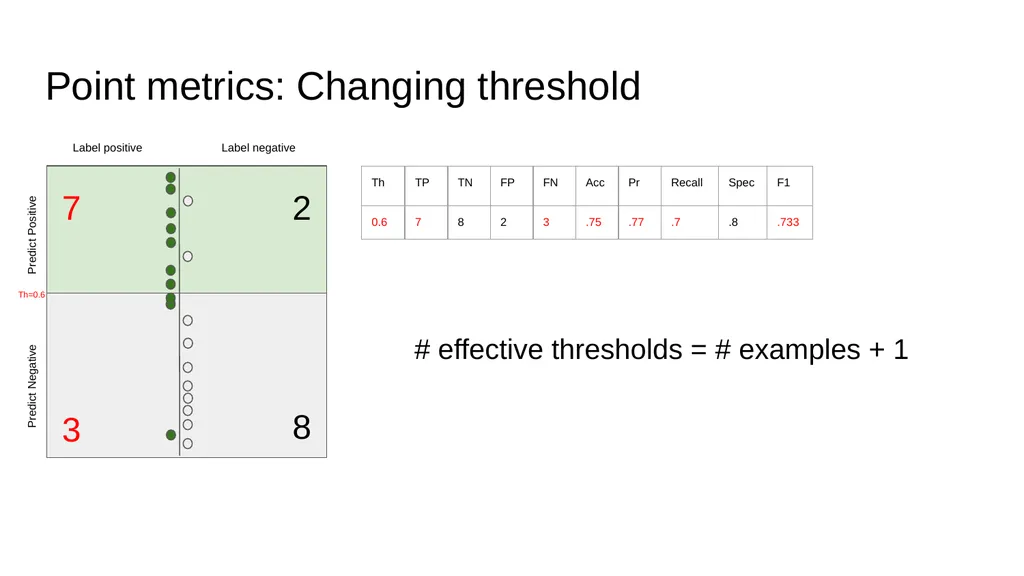
slide18. Point metrics: Changing threshold Label positive Label negative 7 8 2 3 Th=0.6 Predict Negative Predict Positive # effective thresholds = # examples + 1<br>
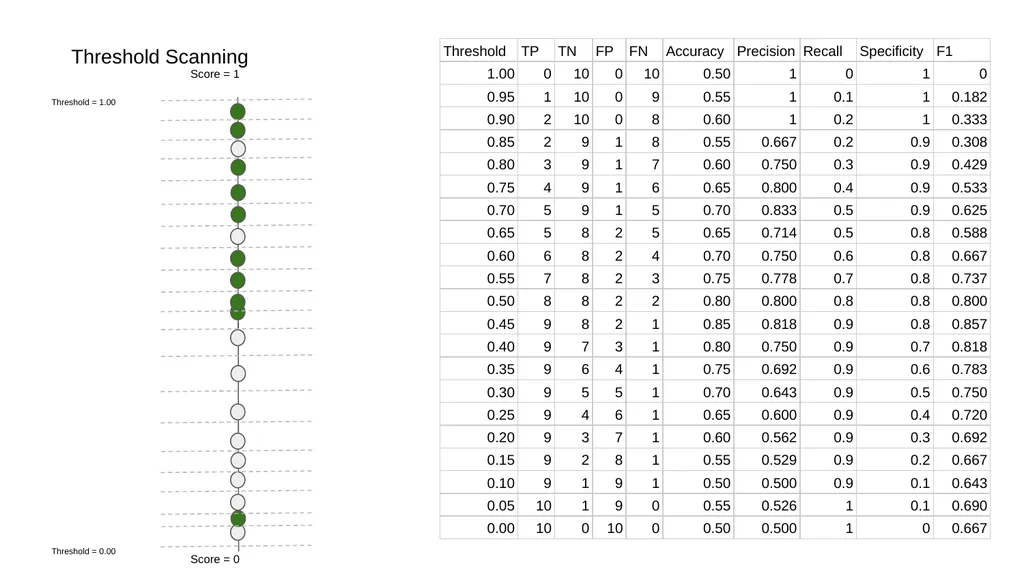
slide19. Threshold Scanning<br>
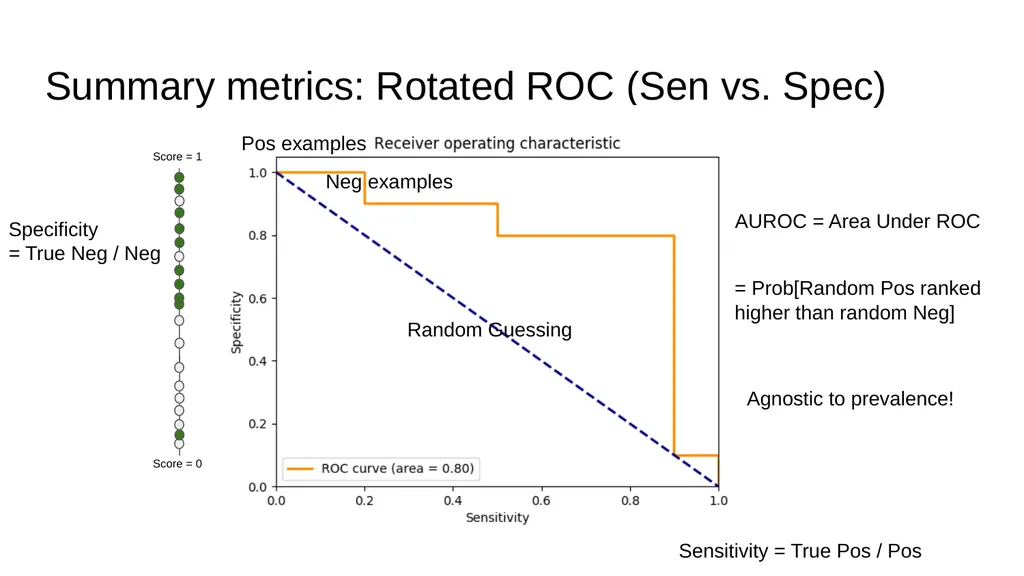
slide20. Summary metrics: Rotated ROC (Sen vs. Spec) Score = 1 Score = 0 Sensitivity = True Pos / Pos Specificity
= True Neg / Neg Pos examples Neg examples Random Guessing AUROC = Area Under ROC = Prob[Random Pos ranked
higher than random Neg] Agnostic to prevalence!<br>
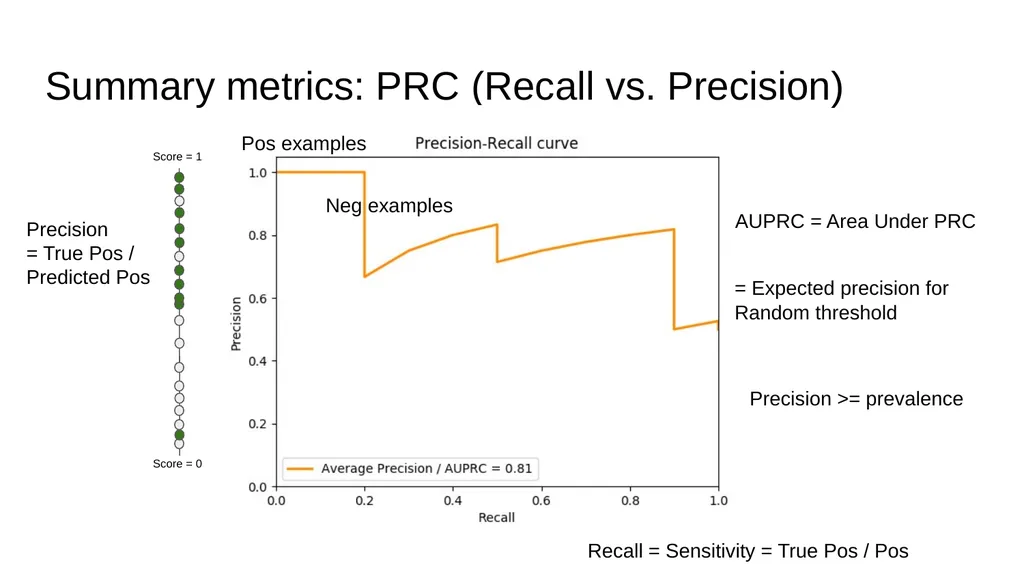
slide21. Summary metrics: PRC (Recall vs. Precision) Score = 1 Score = 0 Recall = Sensitivity = True Pos / Pos Precision
= True Pos /
Predicted Pos Pos examples Neg examples AUPRC = Area Under PRC = Expected precision for
Random threshold Precision >= prevalence<br>
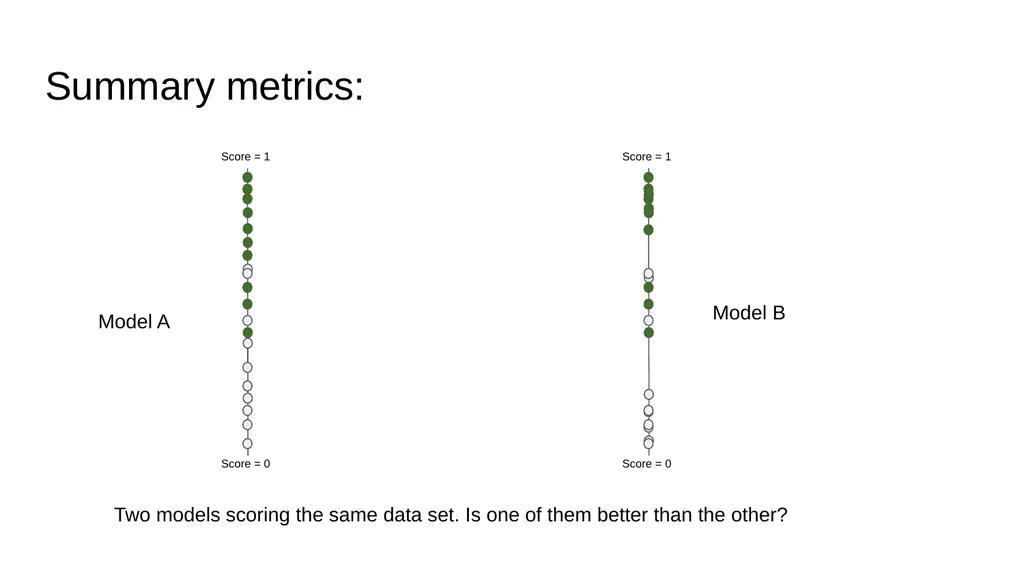
slide22. Summary metrics: Score = 1 Score = 0 Two models scoring the same data set. Is one of them better than the other? Model A Model B<br>
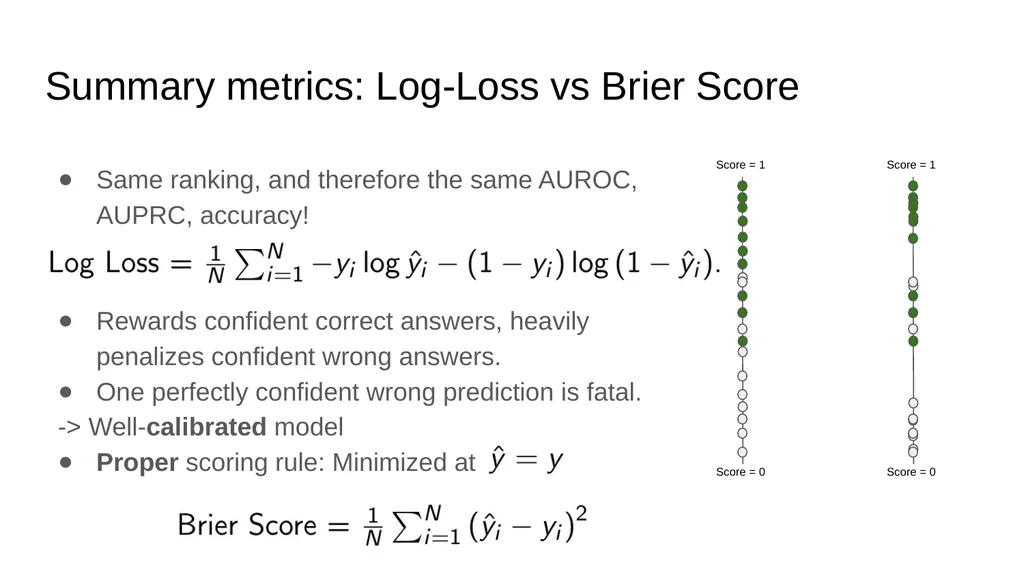
slide23. Summary metrics: Log-Loss vs Brier Score Same ranking, and therefore the same AUROC, AUPRC, accuracy!
Rewards confident correct answers, heavily penalizes confident wrong answers.
One perfectly confident wrong prediction is fatal.
-> Well-calibrated model
Proper scoring rule: Minimized at Score = 1 Score = 0 Score = 1 Score = 0<br>
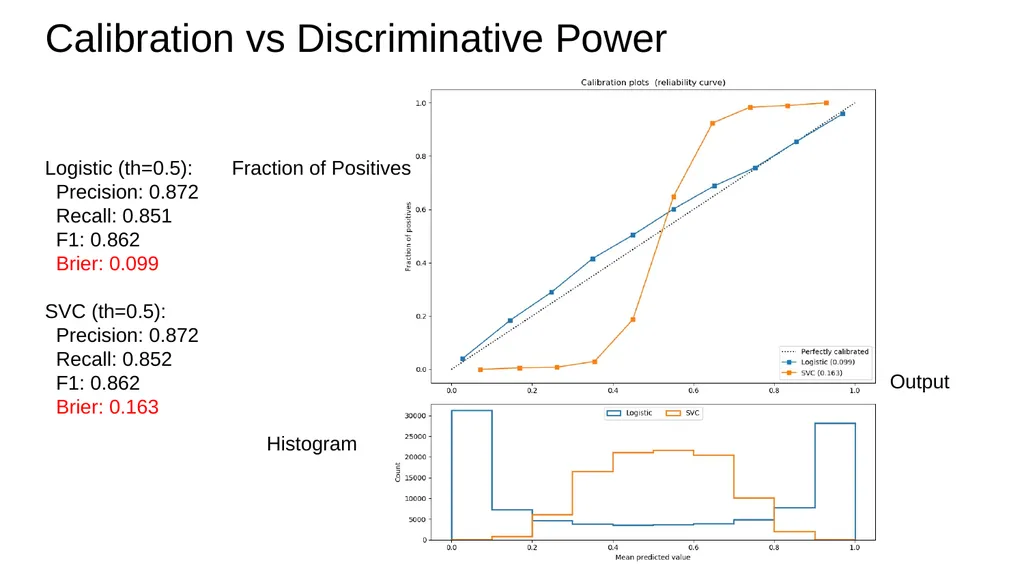
slide24. Calibration vs Discriminative Power Logistic (th=0.5):
Precision: 0.872
Recall: 0.851
F1: 0.862
Brier: 0.099
SVC (th=0.5):
Precision: 0.872
Recall: 0.852
F1: 0.862
Brier: 0.163 Output Fraction of Positives Histogram<br>
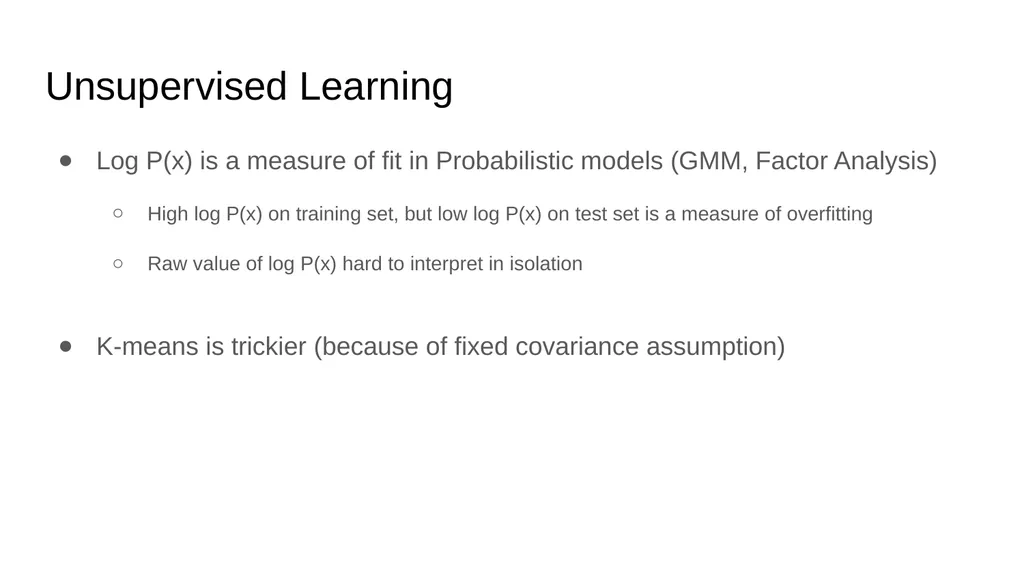
slide25. Unsupervised Learning Log P(x) is a measure of fit in Probabilistic models (GMM, Factor Analysis)
High log P(x) on training set, but low log P(x) on test set is a measure of overfitting
Raw value of log P(x) hard to interpret in isolation
K-means is trickier (because of fixed covariance assumption)<br>
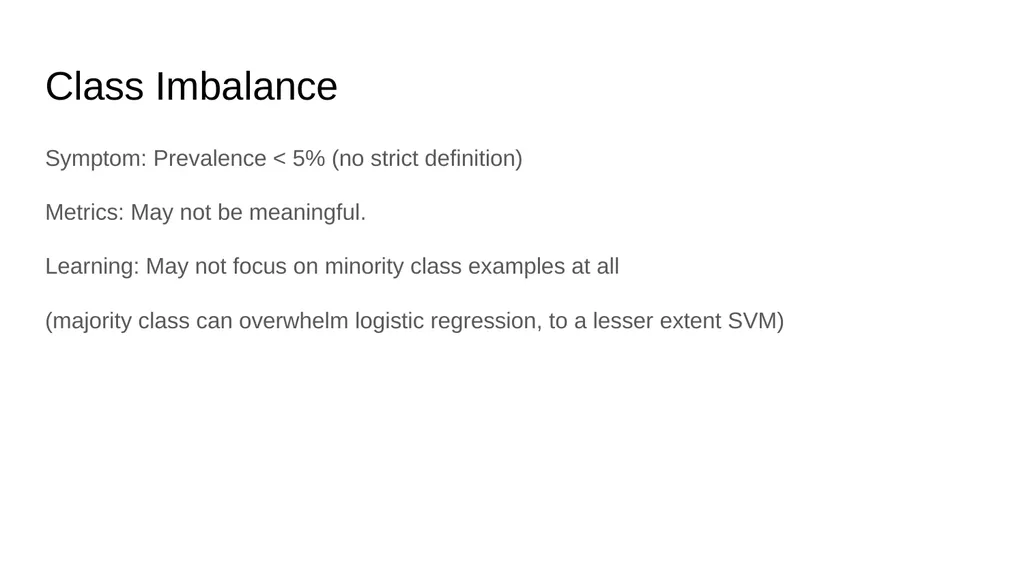
slide26. Class Imbalance Symptom: Prevalence < 5% (no strict definition)
Metrics: May not be meaningful.
Learning: May not focus on minority class examples at all
(majority class can overwhelm logistic regression, to a lesser extent SVM)<br>
slide27. What happen to the metrics under class imbalance? Accuracy: Blindly predicts majority class -> prevalence is the baseline.
Log-Loss: Majority class can dominate the loss.
AUROC: Easy to keep AUC high by scoring most negatives very low.
AUPRC: Somewhat more robust than AUROC. But other challenges.
In general: Accuracy < AUROC < AUPRC<br>
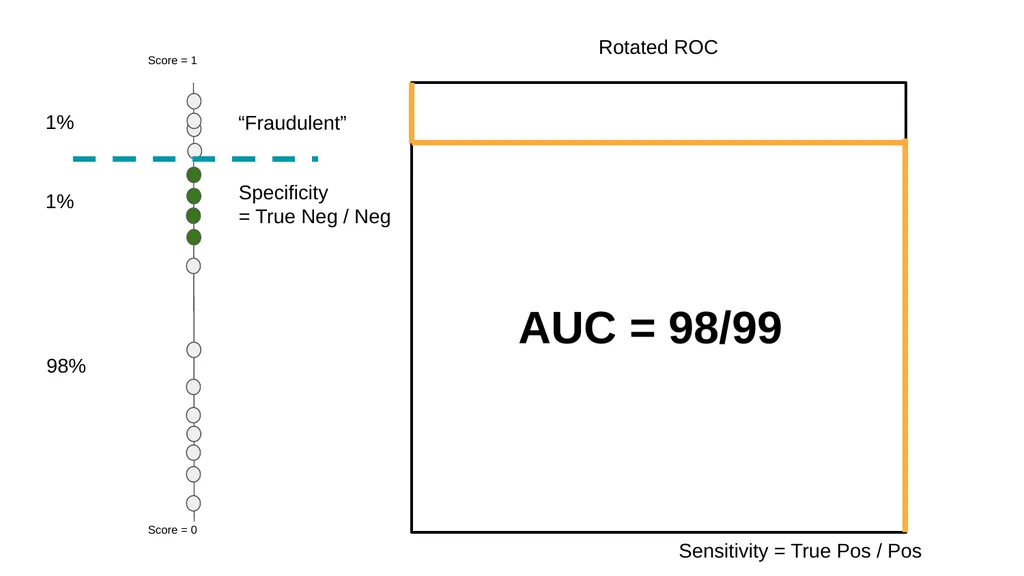
slide28. Score = 1 Score = 0 1% 1% 98% AUC = 98/99<br>
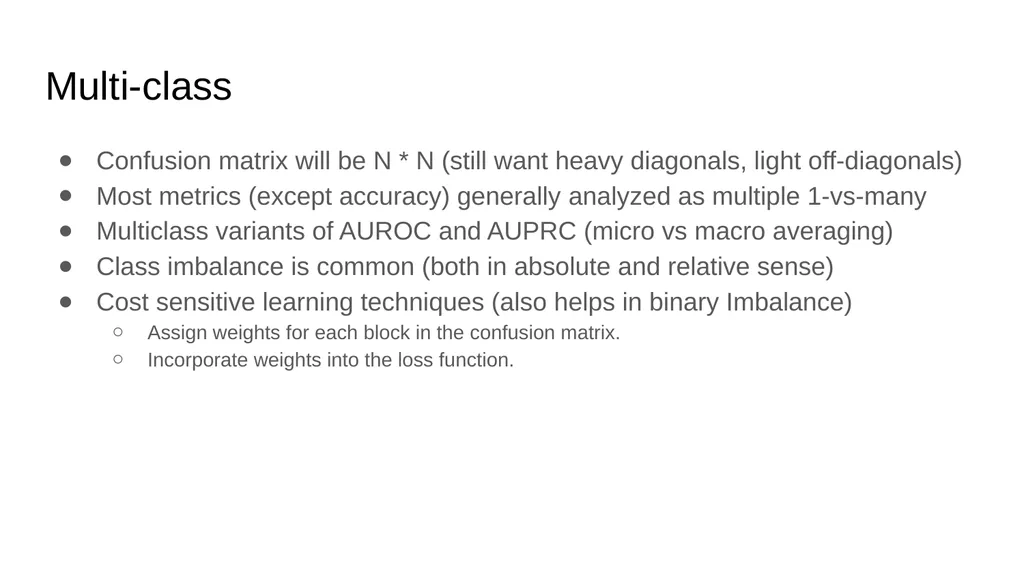
slide29. Multi-class Confusion matrix will be N * N (still want heavy diagonals, light off-diagonals)
Most metrics (except accuracy) generally analyzed as multiple 1-vs-many
Multiclass variants of AUROC and AUPRC (micro vs macro averaging)
Class imbalance is common (both in absolute and relative sense)
Cost sensitive learning techniques (also helps in binary Imbalance)
Assign weights for each block in the confusion matrix.
Incorporate weights into the loss function.<br>
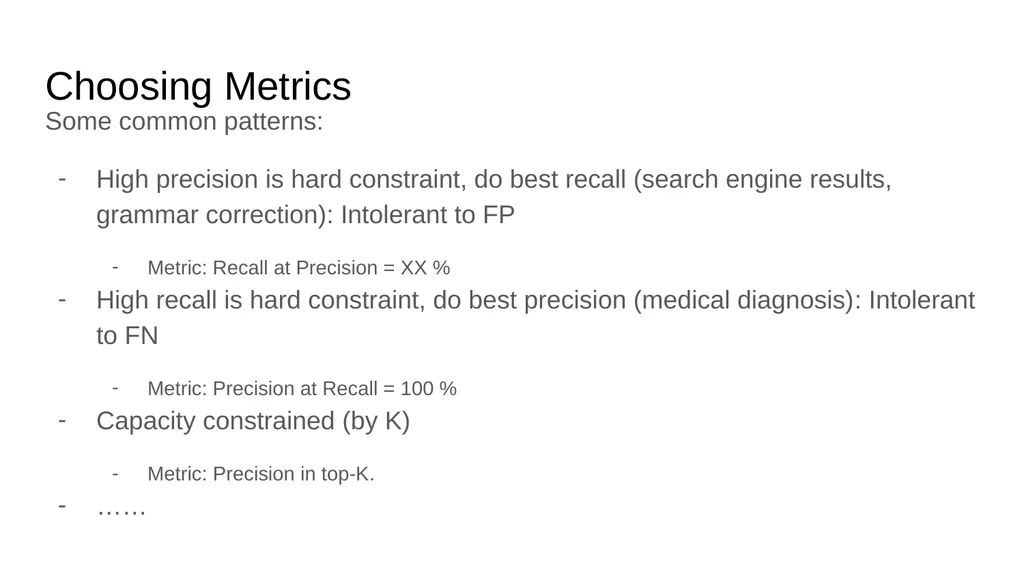
slide30. Choosing Metrics Some common patterns:
High precision is hard constraint, do best recall (search engine results, grammar correction): Intolerant to FP
Metric: Recall at Precision = XX %
High recall is hard constraint, do best precision (medical diagnosis): Intolerant to FN
Metric: Precision at Recall = 100 %
Capacity constrained (by K)
Metric: Precision in top-K.
……<br>
slide31. Thank You!<br>
(Adapted from slides by Anand Avati)
May 1, 2020<br>
slide2. Topics Why are metrics important?
Binary classifiers
Rank view, Thresholding
Metrics
Confusion Matrix
Point metrics: Accuracy, Precision, Recall / Sensitivity, Specificity, F-score
Summary metrics: AU-ROC, AU-PRC, Log-loss.
Choosing Metrics
Class Imbalance
Failure scenarios for each metric
Multi-class<br>
slide3. Why are metrics important? Training objective (cost function) is only a proxy for real world objectives.
Metrics help capture a business goal into a quantitative target (not all errors are equal).
Helps organize ML team effort towards that target.
Generally in the form of improving that metric on the dev set.
Useful to quantify the “gap” between:
Desired performance and baseline (estimate effort initially).
Desired performance and current performance.
Measure progress over time.
Useful for lower level tasks and debugging (e.g. diagnosing bias vs variance).
Ideally training objective should be the metric, but not always possible. Still, metrics are useful and important for evaluation.<br>
slide4. Binary Classification x is input
y is binary output (0/1)
Model is ŷ = h(x)
Two types of models
Models that output a categorical class directly (K-nearest neighbor, Decision tree)
Models that output a real valued score (SVM, Logistic Regression)
Score could be margin (SVM), probability (LR, NN)
Need to pick a threshold
We focus on this type (the other type can be interpreted as an instance)<br>
slide5. Score based models Example of Score: Output of logistic regression.
For most metrics: Only ranking matters.
If too many examples: Plot class-wise histogram.<br>
slide6. Threshold -> Classifier -> Point Metrics Th=0.5<br>
slide7. Point metrics: Confusion Matrix Label Positive Label Negative Predict Negative Predict Positive 9 8 2 1 Th=0.5 Properties:
Total sum is fixed (population).
Column sums are fixed (class-wise population).
Quality of model & threshold decide how columns are split into rows.
We want diagonals to be “heavy”, off diagonals to be “light”.<br>
slide8. Point metrics: True Positives Label positive Label negative 9 8 2 1 Th=0.5 Predict Negative Predict Positive<br>
slide9. Point metrics: True Negatives Label positive Label negative 9 8 2 1 Th=0.5 Predict Negative Predict Positive<br>
slide10. Point metrics: False Positives Label positive Label negative 9 8 2 1 Th=0.5 Predict Negative Predict Positive<br>
slide11. Point metrics: False Negatives Label positive Label negative 9 8 2 1 Th=0.5 Predict Negative Predict Positive<br>
slide12. FP and FN also called Type-1 and Type-2 errors Could not find true source of image to cite<br>
slide13. Point metrics: Accuracy Label positive Label negative 9 8 2 1 Th=0.5 Predict Negative Predict Positive Equivalent to 0-1 Loss!<br>
slide14. Point metrics: Precision Label positive Label negative 9 8 2 1 Th=0.5 Predict Negative Predict Positive<br>
slide15. Point metrics: Positive Recall (Sensitivity) Label positive Label negative 9 8 2 1 Th=0.5 Predict Negative Predict Positive Trivial 100% recall = pull everybody above the threshold.
Trivial 100% precision = push everybody below the threshold except 1 green on top.
(Hopefully no gray above it!) Striving for good precision with 100% recall =
pulling up the lowest green as high as possible in the ranking.
Striving for good recall with 100% precision =
pushing down the top gray as low as possible in the ranking.<br>
slide16. Point metrics: Negative Recall (Specificity) Label positive Label negative 9 8 2 1 Th=0.5 Predict Negative Predict Positive<br>
slide17. Point metrics: F1-score Label positive Label negative 9 8 2 1 Th=0.5 Predict Negative Predict Positive<br>
slide18. Point metrics: Changing threshold Label positive Label negative 7 8 2 3 Th=0.6 Predict Negative Predict Positive # effective thresholds = # examples + 1<br>
slide19. Threshold Scanning<br>
slide20. Summary metrics: Rotated ROC (Sen vs. Spec) Score = 1 Score = 0 Sensitivity = True Pos / Pos Specificity
= True Neg / Neg Pos examples Neg examples Random Guessing AUROC = Area Under ROC = Prob[Random Pos ranked
higher than random Neg] Agnostic to prevalence!<br>
slide21. Summary metrics: PRC (Recall vs. Precision) Score = 1 Score = 0 Recall = Sensitivity = True Pos / Pos Precision
= True Pos /
Predicted Pos Pos examples Neg examples AUPRC = Area Under PRC = Expected precision for
Random threshold Precision >= prevalence<br>
slide22. Summary metrics: Score = 1 Score = 0 Two models scoring the same data set. Is one of them better than the other? Model A Model B<br>
slide23. Summary metrics: Log-Loss vs Brier Score Same ranking, and therefore the same AUROC, AUPRC, accuracy!
Rewards confident correct answers, heavily penalizes confident wrong answers.
One perfectly confident wrong prediction is fatal.
-> Well-calibrated model
Proper scoring rule: Minimized at Score = 1 Score = 0 Score = 1 Score = 0<br>
slide24. Calibration vs Discriminative Power Logistic (th=0.5):
Precision: 0.872
Recall: 0.851
F1: 0.862
Brier: 0.099
SVC (th=0.5):
Precision: 0.872
Recall: 0.852
F1: 0.862
Brier: 0.163 Output Fraction of Positives Histogram<br>
slide25. Unsupervised Learning Log P(x) is a measure of fit in Probabilistic models (GMM, Factor Analysis)
High log P(x) on training set, but low log P(x) on test set is a measure of overfitting
Raw value of log P(x) hard to interpret in isolation
K-means is trickier (because of fixed covariance assumption)<br>
slide26. Class Imbalance Symptom: Prevalence < 5% (no strict definition)
Metrics: May not be meaningful.
Learning: May not focus on minority class examples at all
(majority class can overwhelm logistic regression, to a lesser extent SVM)<br>
slide27. What happen to the metrics under class imbalance? Accuracy: Blindly predicts majority class -> prevalence is the baseline.
Log-Loss: Majority class can dominate the loss.
AUROC: Easy to keep AUC high by scoring most negatives very low.
AUPRC: Somewhat more robust than AUROC. But other challenges.
In general: Accuracy < AUROC < AUPRC<br>
slide28. Score = 1 Score = 0 1% 1% 98% AUC = 98/99<br>
slide29. Multi-class Confusion matrix will be N * N (still want heavy diagonals, light off-diagonals)
Most metrics (except accuracy) generally analyzed as multiple 1-vs-many
Multiclass variants of AUROC and AUPRC (micro vs macro averaging)
Class imbalance is common (both in absolute and relative sense)
Cost sensitive learning techniques (also helps in binary Imbalance)
Assign weights for each block in the confusion matrix.
Incorporate weights into the loss function.<br>
slide30. Choosing Metrics Some common patterns:
High precision is hard constraint, do best recall (search engine results, grammar correction): Intolerant to FP
Metric: Recall at Precision = XX %
High recall is hard constraint, do best precision (medical diagnosis): Intolerant to FN
Metric: Precision at Recall = 100 %
Capacity constrained (by K)
Metric: Precision in top-K.
……<br>
slide31. Thank You!<br>