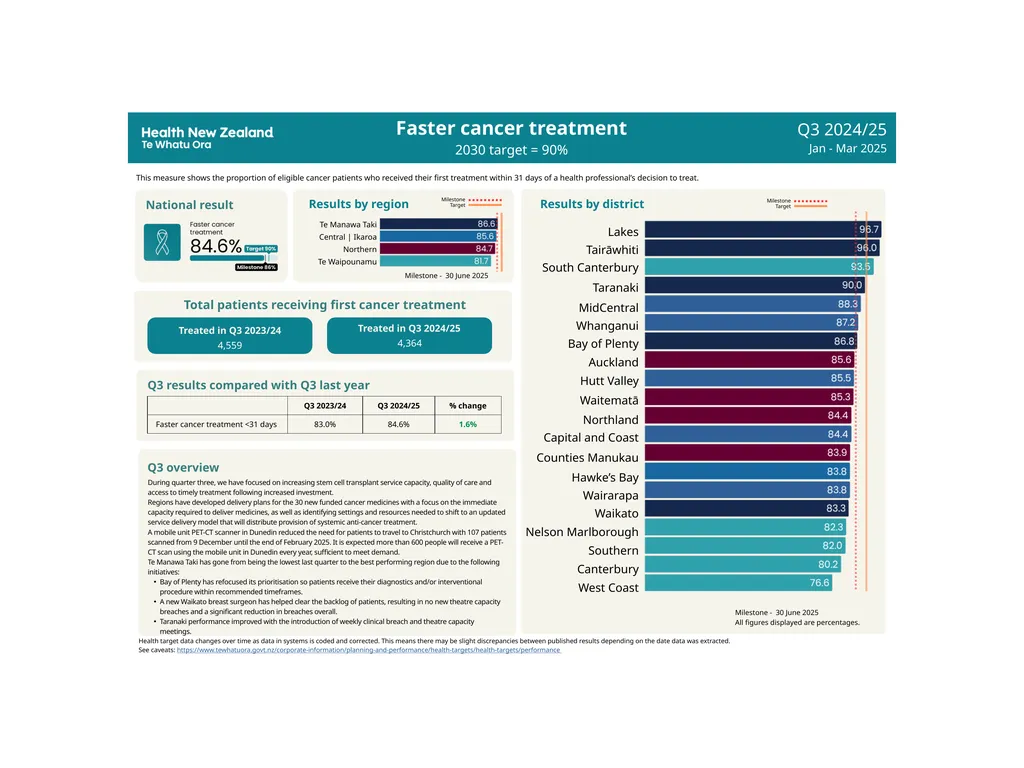
Faster cancer treatment 2030 target = 90% National
Description: Faster cancer treatment 2030 target 90 National result Results by region Results by district Te Manawa Taki Central Ikaroa Northern Te Waipounamu Lakes Tairāwhiti South Canterbury Taranaki MidCentral Whanganui Bay of Plenty Auckland
Related Topics
Download Presentation
"Faster cancer treatment 2030 target = 90% National" is the property of its rightful owner. Permission is granted to download and print the materials on this website for personal, non-commercial use only, and to display it on your personal computer provided you do not modify the materials and that you retain all copyright notices contained in the materials. By downloading content from our website, you accept the terms of this agreement.
Presentation Transcript
slide1. Faster cancer treatment
2030 target = 90% National result Results by region Results by district Te Manawa Taki
Central | Ikaroa
Northern
Te Waipounamu Lakes
Tairāwhiti
South Canterbury
Taranaki
MidCentral
Whanganui
Bay of Plenty
Auckland
Hutt Valley
Waitematā
Northland
Capital and Coast
Counties Manukau
Hawke’s Bay
Wairarapa
Waikato
Nelson Marlborough
Southern
Canterbury
West Coast This measure shows the proportion of eligible cancer patients who received their first treatment within 31 days of a health professional’s decision to treat. Milestone
Target Q3 2024/25
Jan - Mar 2025 Q3 results compared with Q3 last year Total patients receiving first cancer treatment During quarter three, we have focused on increasing stem cell transplant service capacity, quality of care and access to timely treatment following increased investment.
Regions have developed delivery plans for the 30 new funded cancer medicines with a focus on the immediate capacity required to deliver medicines, as well as identifying settings and resources needed to shift to an updated service delivery model that will distribute provision of systemic anti-cancer treatment.
A mobile unit PET-CT scanner in Dunedin reduced the need for patients to travel to Christchurch with 107 patients scanned from 9 December until the end of February 2025. It is expected more than 600 people will receive a PET-CT scan using the mobile unit in Dunedin every year, sufficient to meet demand.
Te Manawa Taki has gone from being the lowest last quarter to the best performing region due to the following initiatives:
Bay of Plenty has refocused its prioritisation so patients receive their diagnostics and/or interventional procedure within recommended timeframes.
A new Waikato breast surgeon has helped clear the backlog of patients, resulting in no new theatre capacity breaches and a significant reduction in breaches overall.
Taranaki performance improved with the introduction of weekly clinical breach and theatre capacity meetings. Q3 overview Milestone
Target Treated in Q3 2023/24 4,559 Milestone - 30 June 2025
All figures displayed are percentages. Milestone - 30 June 2025 Treated in Q3 2024/25 4,364 Health target data changes over time as data in systems is coded and corrected. This means there may be slight discrepancies between published results depending on the date data was extracted.
See caveats: https://www.tewhatuora.govt.nz/corporate-information/planning-and-performance/health-targets/health-targets/performance<br>
slide2. Faster cancer treatment
Number of patients receiving first cancer treatment Q3 2024/25
compared to
Q3 2023/24 4,559 4,364 Health target data changes over time as data in systems is coded and corrected. This means there may be slight discrepancies between published results depending on the date data was extracted.
See caveats: https://www.tewhatuora.govt.nz/corporate-information/planning-and-performance/health-targets/health-targets/performance The total volume of patients receiving first cancer treatment has remained relatively stable over the past five years. Performance in the health target has also remained stable. We expect that work underway as part of the cancer service delivery and transformation programme along with recent investment in additional medicines will help ensure more people receive timely access to cancer treatment through Regional Cancer Service Delivery Networks.<br>
slide3. Improved childhood immunisations
2030 target = 95% This measure shows the percentage of children who have all their scheduled vaccinations by the time they are two years old. Milestone
Target Q3 results compared with Q3 last year Immunisation rates have increased for the second consecutive quarter for children aged 24 months. However, rates for Māori and Pacific children remain lower than the national average.
Health NZ continues implementing initiatives including the following examples.
A cohort tracker, developed in March, is actively used by local teams (Health NZ and health sector partners) to identify, prioritise and immunise children nearing 24 months who have overdue immunisations.
Whānau Āwhina Plunket established four new vaccination clinics across Hamilton, Taumarunui and Kaikohe, bringing the total number of clinics to five. Since the pilot began in December 2024, 85 children have had 230 vaccines.
Funding to support general practice with pre-call/recall activities ensured 12,602 children under the age of two received their six-week immunisations.
A $1.14 million community action fund supports community organisations in high-need areas to deliver localised health promotion and community-led action.
A further 45 pharmacists have become authorised vaccinators (101 total) and an additional three community pharmacies were approved as childhood immunisation sites (14 total). Q3 overview National result Results by region Te Waipounamu
Central | Ikaroa
Northern
Te Manawa Taki Results by district Canterbury
Capital and Coast
South Canterbury
Southern
Auckland
Nelson Marlborough
Hutt Valley
MidCentral
Wairarapa
Waitematā
Counties Manukau
Hawke’s Bay
Whanganui
Taranaki
West Coast
Lakes
Waikato
Bay of Plenty
Tairāwhiti
Northland Number of children fully immunised at 24 months Q3 2023/24 12,078 Milestone
Target Milestone - 30 June 2025
All figures displayed are percentages. Milestone - 30 June 2025 Health target data changes over time as data in systems is coded and corrected. This means there may be slight discrepancies between published results depending on the date data was extracted.
See caveats: https://www.tewhatuora.govt.nz/corporate-information/planning-and-performance/health-targets/health-targets/performance Q3 2024/25
Jan - Mar 2025 Q3 2024/25 11,359 There has been a steady decline in the number of 24-month-old children eligible for immunisation since Q2 2023/24.
This is primarily due to:
declining birth rates starting two years prior (Q2 2021/22)
data quality improvements to exclude overseas-resident children (typically visitors needing medical care while in New Zealand).<br>
slide4. Improved childhood immunisations
Number of children fully immunised Q3 2024/25
compared to
Q3 2023/24 Health target data changes over time as data in systems is coded and corrected. This means there may be slight discrepancies between published results depending on the date data was extracted.
See caveats: https://www.tewhatuora.govt.nz/corporate-information/planning-and-performance/health-targets/health-targets/performance 20/21 21/22 22/23 23/24 24/25 15,701 14,324 12,078 11,359 Encouragingly, in the past two quarters, we've observed a narrowing gap between those who are immunised and those who are eligible, reflecting improved performance in the immunisation health target. 20/21 21/22 22/23 23/24 24/25<br>
slide5. Shorter stays in emergency departments
2030 target = 95% This measure reports patients admitted, discharged or transferred from an ED within six hours as a percentage of all patients who attended ED. Milestone
Target Q3 results compared with Q3 last year Improvement continues as hospitals across the country embed their acute flow improvement plans. The 2024/25 milestone has been achieved nationally, and in Te Waipounamu and Te Manawa Taki regions.
Central remains the lowest performing region and all districts in the region are focused on implementing actions set out in their 90-day plans to lift performance. Actions include:
implementation of an ambulatory care, treat and discharge, model of care at Wellington Hospital ED
48 additional rest home and hospital-level care beds in Wellington and 10 hospital-level care beds in Pahiatua
increased frontline positions at Wairarapa Hospital, with the addition of two new roles (triage nurse and senior doctor/nurse practitioner)
implemented an electronic medication management system, MedChart, at MidCentral to streamline workflows, improve patient safety, and enhance efficiency reducing administrative workload.
More than 3,000 patients have been through North Shore Hospital’s transitional lounge since October. Nineteen hospitals throughout the country have a dedicated transit or discharge lounge.
Permanent 24/7 ED security guard positions were filled at each of the eight priority EDs - Waitākere, North Shore, Auckland City, Middlemore, Waikato, Wellington, Christchurch and Dunedin. Ensuring safety in EDs remains a priority to reduce incidents of violence to better protect staff and patients, which will improve timeliness of care provided and contribute towards performance in this health target. Q3 overview National result Results by region Results by district Te Waipounamu
Te Manawa Taki
Northern
Central | Ikaroa West Coast
Tairāwhiti
South Canterbury
Lakes
Northland
Canterbury
Nelson Marlborough
Taranaki
Bay of Plenty
Southern
Wairarapa
Whanganui
Waitematā
Hawke’s Bay
Hutt Valley
Counties Manukau
Waikato
Auckland
MidCentral
Capital and Coast Milestone
Target Emergency department attendances Q3 2023/24 Q3 2024/25 321,686 333,642 Milestone goal date: 30 June 2025 Milestone - 30 June 2025
All figures displayed are percentages. Q3 2024/25
Jan - Mar 2025 Health target data changes over time as data in systems is coded and corrected. This means there may be slight discrepancies between published results depending on the date data was extracted.
See caveats: https://www.tewhatuora.govt.nz/corporate-information/planning-and-performance/health-targets/health-targets/performance<br>
slide6. Shorter stays in emergency departments
Number of ED attendances Results by district Canterbury
Waikato
Counties Manukau
Southern
Auckland
Waitematā
Bay of Plenty
Northland
Capital and Coast
Lakes
Taranaki
Nelson Marlborough
Hawke’s Bay
Hutt Valley
MidCentral
Tairāwhiti
Whanganui
South Canterbury
Wairarapa
West Coast 20/21 21/22 22/23 23/24 24/25 321,686 333,642 Health target data changes over time as data in systems is coded and corrected. This means there may be slight discrepancies between published results depending on the date data was extracted.
See caveats: https://www.tewhatuora.govt.nz/corporate-information/planning-and-performance/health-targets/health-targets/performance Q3 2024/25
compared to
Q3 2023/24 Over the past five years, ED attendance numbers have steadily increased, and there were more presentations in quarter three 24/25 compared to the same quarter last year. There has been a 3.72% increase in ED attendances from the same quarter last year. Notably, in the last two quarters, we've improved the proportion of patients seen within six hours. Acknowledging increased volumes of ED presentations, performance also continues to improve against the target, indicating we are effectively managing higher patient volumes without compromising on timely care. Our current focus is on reducing the number of patients who have long wait times in ED (especially those who spend more than 24 hours in ED), and improving ED and inpatient flow. +8.82% -5.49% +7.88% +2.38% +1.30% +5.60% +2.38% +10.14% -0.02% +3.92% +5.44% +2.12% +4.13% +3.76% +5.03% +4.63% +4.90% -1.64% +8.97% +6.66%<br>
slide7. Shorter waits for FSA
2030 target = 95% This measure shows the proportion of people waiting less than four months for their FSA (first specialist assessment) from the date of referral. Milestone
Target Q3 results compared with Q3 last year This quarter focused on increasing FSA delivery, reducing the number of long-waiting patients, validating waitlists, improving the consistency of how waitlists are managed and how patients are booked for appointments.
There has been a decrease in longest waiting patients with 52 per cent fewer patients waiting more than two years and 87 per cent fewer patients waiting more than three years for an FSA. Use of the musculoskeletal pathway continues to increase with 1,797 FSAs provided through the pathway nationally, an increase of 1,345 (almost 300 per cent) on the previous quarter.
Regions are validating FSA and elective treatment waitlists across the five biggest services (ear, nose and throat, orthopaedics, gynaecology, general surgery and ophthalmology) focusing on patients waiting more than four months with the goal of completing this cohort by 30 June 2025. Q3 overview National result Results by region Results by district Central | Ikaroa
Northern
Te Manawa Taki
Te Waipounamu Lakes
South Canterbury
MidCentral
West Coast
Capital and Coast
Counties Manukau
Wairarapa
Auckland
Waitematā
Hutt Valley
Canterbury
Tairāwhiti
Waikato
Whanganui
Northland
Southern
Hawke’s Bay
Taranaki
Bay of Plenty
Nelson Marlborough Total number of first specialist assessments delivered FSAs delivered
Q3 2023/24 Milestone
Target Milestone goal date: 30 June 2025 166,157 Milestone - 30 June 2025
All figures displayed are percentages. Q3 2024/25
Jan - Mar 2025 FSAs delivered
Q3 2024/25 167,069 Health target data changes over time as data in systems is coded and corrected. This means there may be slight discrepancies between published results depending on the date data was extracted.
See caveats: https://www.tewhatuora.govt.nz/corporate-information/planning-and-performance/health-targets/health-targets/performance<br>
slide8. Shorter waits for FSA
Total number of first specialist assessments delivered Results by district Q3 2024/25
compared to
Q3 2023/24 *This graph represents the total numbers of FSAs delivered in the quarter, not just those delivered within four months.
** Q3 24/25 figures for the Auckland district are under-reported due to a new Patient Administration System implementation Auckland
Counties Manukau
Canterbury
Waitematā
Waikato
Capital and Coast
MidCentral
Southern
Bay of Plenty
Northland
Hawke’s Bay
Nelson Marlborough
Hutt Valley
Taranaki
Lakes
Tairāwhiti
South Canterbury
Whanganui
Wairarapa
West Coast 192,805 200,400 166,157 167,069 The pandemic has had a long-lasting impact on the provision of planned care. The FSA waitlist has nearly doubled since Q1 2020/21, while our output (number seen per quarter) has remained relatively constant. The number of people on the FSA waitlist at the end of Q3 increased by 3.94% compared with the same quarter last year. In Q3 this year we saw a 0.55% increase in the number of FSAs delivered compared to last year.
The total FSA wait list numbers peaked in January 2025, and this has been reducing each week since then. The number of patients waiting longer than 4 months for their FSA has also reduced and continues to trend downwards.
Since the reintroduction of Health Targets in June 2024 we have sharpened our focus on operational performance – with concerted effort on managing our turn rates (i.e. to ensure more patients are seen – and removed from FSA waitlists - than added to them), booking routine priority patients in order of time spent waiting, and validating the accuracy of waitlists. We have created increased capacity by shifting follow-up appointments after elective treatment to be patient-directed; re-designed clinical pathways to better utilise the skills of Allied Health professionals (such as physiotherapists) to undertake FSAs; and developed standardised waitlist management guidance to ensure our approach to managing people on waitlists is consistent around the country.
Improved data validation activity commenced late in quarter three and we are seeing this in improved FSA health target performance into quarter four. Data validation is happening through direct contact with patients (via email, text and phone calls) and data cleansing. As at 1 June 2025 we have confirmed and validated details for 27,490 patients who have been waiting longer than 4 months for their FSA. Regions continue to focus on performance in the largest volume services and the longest waiting patients.
During quarter three, there was also a focus on improving the consistency of how waiting lists are managed and patients are booked for appointments. This focus continues through into quarter four with the improvement reflected in both health target performance and wait list numbers. In quarter four and beyond we will also focus on reducing unwarranted variation in access, via methods to harmonise the criteria used across the country to determine if someone is accepted onto a waitlist (or not) for an FSA. Health target data changes over time as data in systems is coded and corrected. This means there may be slight discrepancies between published results depending on the date data was extracted.
See caveats: https://www.tewhatuora.govt.nz/corporate-information/planning-and-performance/health-targets/health-targets/performance -20.83% +2.86% +11.93% +11.13% +5.13% +6.83% -2.56% +1.41% +11.54% +1.29% -2.82% +15.24% -2.47% +9.94% +1.24% -20.35% -9.28% -9.77% -8.83% +80.31%<br>
slide9. National result Shorter wait times for elective treatment
2030 target = 95% This measure shows the proportion of people given a commitment to treatment waiting less than four months, as a proportion of all people waiting for a procedure. Milestone
Target Q3 results compared with Q3 last year The electives boost initiative focuses on increasing use of private sector capacity to provide an additional 10,579 elective surgeries by the end of June 2025. This is complemented by work to improve theatre productivity and better use of internal capacity. Weekday elective theatre session use has improved by 3.5 per cent this quarter and reached a national average of 85 per cent. The number of weekday elective theatre sessions finishing more than one hour early reduced by 4.8 per cent from the previous quarter, which allows us to use our theatres more efficiently and schedule more sessions.
Examples of key activity to improve performance include:
Additional insourcing in the Auckland and Counties Manukau districts, and additional outsourcing for ophthalmology, cardiothoracics, general surgery, gynaecology, orthopaedics, plastics and specialist paediatrics.
Introduction of the +1 booking model (adding a booking) in specialities with chronic early finishes (finishing more than 60 minutes early), such as plastics and gynaecology at Counties Manukau. Early evidence shows an average increase of 36.5 hours of operating per week (23 per cent increase).
Additional theatres opening at Counties Manukau from the start of March and an increase in Saturday elective procedures at Middlemore Hospital from 25 to 42 until June.
Te Waipounamu has been working with private providers to maximise available capacity to treat public patients. While several services have outsourced appropriate patients, the largest volumes have been general surgery, orthopaedics, and cataract procedures. Between 17 February and 30 March, 791 additional outsourced treatments had been delivered in the private sector.
Reprioritised funding for Burwood Hospital will facilitate an additional 1,670 surgical procedures per year going forward, delivered by activating 58 vacant theatre sessions and 10 multi-day surgical beds. This will assist in managing the elective surgery waitlist across Te Waipounamu. Q3 overview Results by region Results by district Te Manawa Taki
Central | Ikaroa
Te Waipounamu
Northern Number of people treated from the waitlist Q3 2023/24 Milestone
Target Milestone goal date: 30 June 2025 Milestone - 30 June 2025
All figures displayed are percentages. Q3 2024/25
Jan - Mar 2025 48,389 Q3 2024/25 46,902 Health target data changes over time as data in systems is coded and corrected. This means there may be slight discrepancies between published results depending on the date data was extracted.
See caveats: https://www.tewhatuora.govt.nz/corporate-information/planning-and-performance/health-targets/health-targets/performance<br>
slide10. Shorter wait times for elective treatment
Number of people treated from the waitlist Results by district Q3 2024/25
compared to
Q3 2023/24 Auckland
Waikato
Canterbury
Waitematā
Bay of Plenty
Capital and Coast
Counties Manukau
Southern
MidCentral
Hawke’s Bay
Northland
Lakes
Hutt Valley
Nelson Marlborough
Taranaki
Whanganui
Tairāwhiti
South Canterbury
Wairarapa
West Coast 74,744 82,190 46,902 48,389 20/21 21/22 22/23 23/24 24/25 The pandemic, coupled with increasing demand, has had a long-lasting impact on the provision of planned care. Waitlists for elective treatment have grown significantly since Q1 2020/21, while our output (number of procedures per quarter) has remained relatively constant. The number of people on the elective treatment waitlist at the end of Q3 increased by 9.96% increase compared with the same quarter last year. In Q3 we saw a 3.17% increase in the number of people treated compared to last year.
Treatment wait list numbers peaked back in early January 2025, and this has been reducing each week since then. Immediately post-pandemic, our focus was on treating the people who had been on our waitlists for the longest (to ‘reduce the tail’). We’ve succeeded at this, with only a handful of people with complex clinical circumstances left, who have been waiting more than 3 years for a procedure. The number of patients waiting longer than 4 months for their treatment has also reduced and continues to trend downwards.
Actions during quarter three to increase outsourcing have been complemented by improving theatre productivity and use of Health NZ’s internal capacity (such as through Totara Haumaru, Burwood Hospital and Manukau Health Park).
Improved data validation activity commenced in late quarter three and continues to improve performance through into quarter four by direct contact with patients (via email, text and phone calls), data cleansing and increased focus on outsourcing. As at 1 June 2025 data relating to 12,604 patients waiting more than 4 months has been validated. Ensuring the right patients are booked in the right order is critical to improving health target performance. Over the quarter, Health NZ continued to work with regions to improve the consistent application of clinical urgency categories (that define patient priority), which inform effective waitlist management and booking practice.
Our continued focus going forward is to increase the number of elective treatments we fund or deliver every quarter. Health target data changes over time as data in systems is coded and corrected. This means there may be slight discrepancies between published results depending on the date data was extracted.
See caveats: https://www.tewhatuora.govt.nz/corporate-information/planning-and-performance/health-targets/health-targets/performance +0.35% +0.57% +8.29% -5.70% +1.46% -0.18% -7.88% +11.97% +14.55% +9.49% +1.84% -1.94% +13.59% +9.68% +1.55% +5.06% +15.16% +100% +37.93% +10.78%<br>
2030 target = 90% National result Results by region Results by district Te Manawa Taki
Central | Ikaroa
Northern
Te Waipounamu Lakes
Tairāwhiti
South Canterbury
Taranaki
MidCentral
Whanganui
Bay of Plenty
Auckland
Hutt Valley
Waitematā
Northland
Capital and Coast
Counties Manukau
Hawke’s Bay
Wairarapa
Waikato
Nelson Marlborough
Southern
Canterbury
West Coast This measure shows the proportion of eligible cancer patients who received their first treatment within 31 days of a health professional’s decision to treat. Milestone
Target Q3 2024/25
Jan - Mar 2025 Q3 results compared with Q3 last year Total patients receiving first cancer treatment During quarter three, we have focused on increasing stem cell transplant service capacity, quality of care and access to timely treatment following increased investment.
Regions have developed delivery plans for the 30 new funded cancer medicines with a focus on the immediate capacity required to deliver medicines, as well as identifying settings and resources needed to shift to an updated service delivery model that will distribute provision of systemic anti-cancer treatment.
A mobile unit PET-CT scanner in Dunedin reduced the need for patients to travel to Christchurch with 107 patients scanned from 9 December until the end of February 2025. It is expected more than 600 people will receive a PET-CT scan using the mobile unit in Dunedin every year, sufficient to meet demand.
Te Manawa Taki has gone from being the lowest last quarter to the best performing region due to the following initiatives:
Bay of Plenty has refocused its prioritisation so patients receive their diagnostics and/or interventional procedure within recommended timeframes.
A new Waikato breast surgeon has helped clear the backlog of patients, resulting in no new theatre capacity breaches and a significant reduction in breaches overall.
Taranaki performance improved with the introduction of weekly clinical breach and theatre capacity meetings. Q3 overview Milestone
Target Treated in Q3 2023/24 4,559 Milestone - 30 June 2025
All figures displayed are percentages. Milestone - 30 June 2025 Treated in Q3 2024/25 4,364 Health target data changes over time as data in systems is coded and corrected. This means there may be slight discrepancies between published results depending on the date data was extracted.
See caveats: https://www.tewhatuora.govt.nz/corporate-information/planning-and-performance/health-targets/health-targets/performance<br>
slide2. Faster cancer treatment
Number of patients receiving first cancer treatment Q3 2024/25
compared to
Q3 2023/24 4,559 4,364 Health target data changes over time as data in systems is coded and corrected. This means there may be slight discrepancies between published results depending on the date data was extracted.
See caveats: https://www.tewhatuora.govt.nz/corporate-information/planning-and-performance/health-targets/health-targets/performance The total volume of patients receiving first cancer treatment has remained relatively stable over the past five years. Performance in the health target has also remained stable. We expect that work underway as part of the cancer service delivery and transformation programme along with recent investment in additional medicines will help ensure more people receive timely access to cancer treatment through Regional Cancer Service Delivery Networks.<br>
slide3. Improved childhood immunisations
2030 target = 95% This measure shows the percentage of children who have all their scheduled vaccinations by the time they are two years old. Milestone
Target Q3 results compared with Q3 last year Immunisation rates have increased for the second consecutive quarter for children aged 24 months. However, rates for Māori and Pacific children remain lower than the national average.
Health NZ continues implementing initiatives including the following examples.
A cohort tracker, developed in March, is actively used by local teams (Health NZ and health sector partners) to identify, prioritise and immunise children nearing 24 months who have overdue immunisations.
Whānau Āwhina Plunket established four new vaccination clinics across Hamilton, Taumarunui and Kaikohe, bringing the total number of clinics to five. Since the pilot began in December 2024, 85 children have had 230 vaccines.
Funding to support general practice with pre-call/recall activities ensured 12,602 children under the age of two received their six-week immunisations.
A $1.14 million community action fund supports community organisations in high-need areas to deliver localised health promotion and community-led action.
A further 45 pharmacists have become authorised vaccinators (101 total) and an additional three community pharmacies were approved as childhood immunisation sites (14 total). Q3 overview National result Results by region Te Waipounamu
Central | Ikaroa
Northern
Te Manawa Taki Results by district Canterbury
Capital and Coast
South Canterbury
Southern
Auckland
Nelson Marlborough
Hutt Valley
MidCentral
Wairarapa
Waitematā
Counties Manukau
Hawke’s Bay
Whanganui
Taranaki
West Coast
Lakes
Waikato
Bay of Plenty
Tairāwhiti
Northland Number of children fully immunised at 24 months Q3 2023/24 12,078 Milestone
Target Milestone - 30 June 2025
All figures displayed are percentages. Milestone - 30 June 2025 Health target data changes over time as data in systems is coded and corrected. This means there may be slight discrepancies between published results depending on the date data was extracted.
See caveats: https://www.tewhatuora.govt.nz/corporate-information/planning-and-performance/health-targets/health-targets/performance Q3 2024/25
Jan - Mar 2025 Q3 2024/25 11,359 There has been a steady decline in the number of 24-month-old children eligible for immunisation since Q2 2023/24.
This is primarily due to:
declining birth rates starting two years prior (Q2 2021/22)
data quality improvements to exclude overseas-resident children (typically visitors needing medical care while in New Zealand).<br>
slide4. Improved childhood immunisations
Number of children fully immunised Q3 2024/25
compared to
Q3 2023/24 Health target data changes over time as data in systems is coded and corrected. This means there may be slight discrepancies between published results depending on the date data was extracted.
See caveats: https://www.tewhatuora.govt.nz/corporate-information/planning-and-performance/health-targets/health-targets/performance 20/21 21/22 22/23 23/24 24/25 15,701 14,324 12,078 11,359 Encouragingly, in the past two quarters, we've observed a narrowing gap between those who are immunised and those who are eligible, reflecting improved performance in the immunisation health target. 20/21 21/22 22/23 23/24 24/25<br>
slide5. Shorter stays in emergency departments
2030 target = 95% This measure reports patients admitted, discharged or transferred from an ED within six hours as a percentage of all patients who attended ED. Milestone
Target Q3 results compared with Q3 last year Improvement continues as hospitals across the country embed their acute flow improvement plans. The 2024/25 milestone has been achieved nationally, and in Te Waipounamu and Te Manawa Taki regions.
Central remains the lowest performing region and all districts in the region are focused on implementing actions set out in their 90-day plans to lift performance. Actions include:
implementation of an ambulatory care, treat and discharge, model of care at Wellington Hospital ED
48 additional rest home and hospital-level care beds in Wellington and 10 hospital-level care beds in Pahiatua
increased frontline positions at Wairarapa Hospital, with the addition of two new roles (triage nurse and senior doctor/nurse practitioner)
implemented an electronic medication management system, MedChart, at MidCentral to streamline workflows, improve patient safety, and enhance efficiency reducing administrative workload.
More than 3,000 patients have been through North Shore Hospital’s transitional lounge since October. Nineteen hospitals throughout the country have a dedicated transit or discharge lounge.
Permanent 24/7 ED security guard positions were filled at each of the eight priority EDs - Waitākere, North Shore, Auckland City, Middlemore, Waikato, Wellington, Christchurch and Dunedin. Ensuring safety in EDs remains a priority to reduce incidents of violence to better protect staff and patients, which will improve timeliness of care provided and contribute towards performance in this health target. Q3 overview National result Results by region Results by district Te Waipounamu
Te Manawa Taki
Northern
Central | Ikaroa West Coast
Tairāwhiti
South Canterbury
Lakes
Northland
Canterbury
Nelson Marlborough
Taranaki
Bay of Plenty
Southern
Wairarapa
Whanganui
Waitematā
Hawke’s Bay
Hutt Valley
Counties Manukau
Waikato
Auckland
MidCentral
Capital and Coast Milestone
Target Emergency department attendances Q3 2023/24 Q3 2024/25 321,686 333,642 Milestone goal date: 30 June 2025 Milestone - 30 June 2025
All figures displayed are percentages. Q3 2024/25
Jan - Mar 2025 Health target data changes over time as data in systems is coded and corrected. This means there may be slight discrepancies between published results depending on the date data was extracted.
See caveats: https://www.tewhatuora.govt.nz/corporate-information/planning-and-performance/health-targets/health-targets/performance<br>
slide6. Shorter stays in emergency departments
Number of ED attendances Results by district Canterbury
Waikato
Counties Manukau
Southern
Auckland
Waitematā
Bay of Plenty
Northland
Capital and Coast
Lakes
Taranaki
Nelson Marlborough
Hawke’s Bay
Hutt Valley
MidCentral
Tairāwhiti
Whanganui
South Canterbury
Wairarapa
West Coast 20/21 21/22 22/23 23/24 24/25 321,686 333,642 Health target data changes over time as data in systems is coded and corrected. This means there may be slight discrepancies between published results depending on the date data was extracted.
See caveats: https://www.tewhatuora.govt.nz/corporate-information/planning-and-performance/health-targets/health-targets/performance Q3 2024/25
compared to
Q3 2023/24 Over the past five years, ED attendance numbers have steadily increased, and there were more presentations in quarter three 24/25 compared to the same quarter last year. There has been a 3.72% increase in ED attendances from the same quarter last year. Notably, in the last two quarters, we've improved the proportion of patients seen within six hours. Acknowledging increased volumes of ED presentations, performance also continues to improve against the target, indicating we are effectively managing higher patient volumes without compromising on timely care. Our current focus is on reducing the number of patients who have long wait times in ED (especially those who spend more than 24 hours in ED), and improving ED and inpatient flow. +8.82% -5.49% +7.88% +2.38% +1.30% +5.60% +2.38% +10.14% -0.02% +3.92% +5.44% +2.12% +4.13% +3.76% +5.03% +4.63% +4.90% -1.64% +8.97% +6.66%<br>
slide7. Shorter waits for FSA
2030 target = 95% This measure shows the proportion of people waiting less than four months for their FSA (first specialist assessment) from the date of referral. Milestone
Target Q3 results compared with Q3 last year This quarter focused on increasing FSA delivery, reducing the number of long-waiting patients, validating waitlists, improving the consistency of how waitlists are managed and how patients are booked for appointments.
There has been a decrease in longest waiting patients with 52 per cent fewer patients waiting more than two years and 87 per cent fewer patients waiting more than three years for an FSA. Use of the musculoskeletal pathway continues to increase with 1,797 FSAs provided through the pathway nationally, an increase of 1,345 (almost 300 per cent) on the previous quarter.
Regions are validating FSA and elective treatment waitlists across the five biggest services (ear, nose and throat, orthopaedics, gynaecology, general surgery and ophthalmology) focusing on patients waiting more than four months with the goal of completing this cohort by 30 June 2025. Q3 overview National result Results by region Results by district Central | Ikaroa
Northern
Te Manawa Taki
Te Waipounamu Lakes
South Canterbury
MidCentral
West Coast
Capital and Coast
Counties Manukau
Wairarapa
Auckland
Waitematā
Hutt Valley
Canterbury
Tairāwhiti
Waikato
Whanganui
Northland
Southern
Hawke’s Bay
Taranaki
Bay of Plenty
Nelson Marlborough Total number of first specialist assessments delivered FSAs delivered
Q3 2023/24 Milestone
Target Milestone goal date: 30 June 2025 166,157 Milestone - 30 June 2025
All figures displayed are percentages. Q3 2024/25
Jan - Mar 2025 FSAs delivered
Q3 2024/25 167,069 Health target data changes over time as data in systems is coded and corrected. This means there may be slight discrepancies between published results depending on the date data was extracted.
See caveats: https://www.tewhatuora.govt.nz/corporate-information/planning-and-performance/health-targets/health-targets/performance<br>
slide8. Shorter waits for FSA
Total number of first specialist assessments delivered Results by district Q3 2024/25
compared to
Q3 2023/24 *This graph represents the total numbers of FSAs delivered in the quarter, not just those delivered within four months.
** Q3 24/25 figures for the Auckland district are under-reported due to a new Patient Administration System implementation Auckland
Counties Manukau
Canterbury
Waitematā
Waikato
Capital and Coast
MidCentral
Southern
Bay of Plenty
Northland
Hawke’s Bay
Nelson Marlborough
Hutt Valley
Taranaki
Lakes
Tairāwhiti
South Canterbury
Whanganui
Wairarapa
West Coast 192,805 200,400 166,157 167,069 The pandemic has had a long-lasting impact on the provision of planned care. The FSA waitlist has nearly doubled since Q1 2020/21, while our output (number seen per quarter) has remained relatively constant. The number of people on the FSA waitlist at the end of Q3 increased by 3.94% compared with the same quarter last year. In Q3 this year we saw a 0.55% increase in the number of FSAs delivered compared to last year.
The total FSA wait list numbers peaked in January 2025, and this has been reducing each week since then. The number of patients waiting longer than 4 months for their FSA has also reduced and continues to trend downwards.
Since the reintroduction of Health Targets in June 2024 we have sharpened our focus on operational performance – with concerted effort on managing our turn rates (i.e. to ensure more patients are seen – and removed from FSA waitlists - than added to them), booking routine priority patients in order of time spent waiting, and validating the accuracy of waitlists. We have created increased capacity by shifting follow-up appointments after elective treatment to be patient-directed; re-designed clinical pathways to better utilise the skills of Allied Health professionals (such as physiotherapists) to undertake FSAs; and developed standardised waitlist management guidance to ensure our approach to managing people on waitlists is consistent around the country.
Improved data validation activity commenced late in quarter three and we are seeing this in improved FSA health target performance into quarter four. Data validation is happening through direct contact with patients (via email, text and phone calls) and data cleansing. As at 1 June 2025 we have confirmed and validated details for 27,490 patients who have been waiting longer than 4 months for their FSA. Regions continue to focus on performance in the largest volume services and the longest waiting patients.
During quarter three, there was also a focus on improving the consistency of how waiting lists are managed and patients are booked for appointments. This focus continues through into quarter four with the improvement reflected in both health target performance and wait list numbers. In quarter four and beyond we will also focus on reducing unwarranted variation in access, via methods to harmonise the criteria used across the country to determine if someone is accepted onto a waitlist (or not) for an FSA. Health target data changes over time as data in systems is coded and corrected. This means there may be slight discrepancies between published results depending on the date data was extracted.
See caveats: https://www.tewhatuora.govt.nz/corporate-information/planning-and-performance/health-targets/health-targets/performance -20.83% +2.86% +11.93% +11.13% +5.13% +6.83% -2.56% +1.41% +11.54% +1.29% -2.82% +15.24% -2.47% +9.94% +1.24% -20.35% -9.28% -9.77% -8.83% +80.31%<br>
slide9. National result Shorter wait times for elective treatment
2030 target = 95% This measure shows the proportion of people given a commitment to treatment waiting less than four months, as a proportion of all people waiting for a procedure. Milestone
Target Q3 results compared with Q3 last year The electives boost initiative focuses on increasing use of private sector capacity to provide an additional 10,579 elective surgeries by the end of June 2025. This is complemented by work to improve theatre productivity and better use of internal capacity. Weekday elective theatre session use has improved by 3.5 per cent this quarter and reached a national average of 85 per cent. The number of weekday elective theatre sessions finishing more than one hour early reduced by 4.8 per cent from the previous quarter, which allows us to use our theatres more efficiently and schedule more sessions.
Examples of key activity to improve performance include:
Additional insourcing in the Auckland and Counties Manukau districts, and additional outsourcing for ophthalmology, cardiothoracics, general surgery, gynaecology, orthopaedics, plastics and specialist paediatrics.
Introduction of the +1 booking model (adding a booking) in specialities with chronic early finishes (finishing more than 60 minutes early), such as plastics and gynaecology at Counties Manukau. Early evidence shows an average increase of 36.5 hours of operating per week (23 per cent increase).
Additional theatres opening at Counties Manukau from the start of March and an increase in Saturday elective procedures at Middlemore Hospital from 25 to 42 until June.
Te Waipounamu has been working with private providers to maximise available capacity to treat public patients. While several services have outsourced appropriate patients, the largest volumes have been general surgery, orthopaedics, and cataract procedures. Between 17 February and 30 March, 791 additional outsourced treatments had been delivered in the private sector.
Reprioritised funding for Burwood Hospital will facilitate an additional 1,670 surgical procedures per year going forward, delivered by activating 58 vacant theatre sessions and 10 multi-day surgical beds. This will assist in managing the elective surgery waitlist across Te Waipounamu. Q3 overview Results by region Results by district Te Manawa Taki
Central | Ikaroa
Te Waipounamu
Northern Number of people treated from the waitlist Q3 2023/24 Milestone
Target Milestone goal date: 30 June 2025 Milestone - 30 June 2025
All figures displayed are percentages. Q3 2024/25
Jan - Mar 2025 48,389 Q3 2024/25 46,902 Health target data changes over time as data in systems is coded and corrected. This means there may be slight discrepancies between published results depending on the date data was extracted.
See caveats: https://www.tewhatuora.govt.nz/corporate-information/planning-and-performance/health-targets/health-targets/performance<br>
slide10. Shorter wait times for elective treatment
Number of people treated from the waitlist Results by district Q3 2024/25
compared to
Q3 2023/24 Auckland
Waikato
Canterbury
Waitematā
Bay of Plenty
Capital and Coast
Counties Manukau
Southern
MidCentral
Hawke’s Bay
Northland
Lakes
Hutt Valley
Nelson Marlborough
Taranaki
Whanganui
Tairāwhiti
South Canterbury
Wairarapa
West Coast 74,744 82,190 46,902 48,389 20/21 21/22 22/23 23/24 24/25 The pandemic, coupled with increasing demand, has had a long-lasting impact on the provision of planned care. Waitlists for elective treatment have grown significantly since Q1 2020/21, while our output (number of procedures per quarter) has remained relatively constant. The number of people on the elective treatment waitlist at the end of Q3 increased by 9.96% increase compared with the same quarter last year. In Q3 we saw a 3.17% increase in the number of people treated compared to last year.
Treatment wait list numbers peaked back in early January 2025, and this has been reducing each week since then. Immediately post-pandemic, our focus was on treating the people who had been on our waitlists for the longest (to ‘reduce the tail’). We’ve succeeded at this, with only a handful of people with complex clinical circumstances left, who have been waiting more than 3 years for a procedure. The number of patients waiting longer than 4 months for their treatment has also reduced and continues to trend downwards.
Actions during quarter three to increase outsourcing have been complemented by improving theatre productivity and use of Health NZ’s internal capacity (such as through Totara Haumaru, Burwood Hospital and Manukau Health Park).
Improved data validation activity commenced in late quarter three and continues to improve performance through into quarter four by direct contact with patients (via email, text and phone calls), data cleansing and increased focus on outsourcing. As at 1 June 2025 data relating to 12,604 patients waiting more than 4 months has been validated. Ensuring the right patients are booked in the right order is critical to improving health target performance. Over the quarter, Health NZ continued to work with regions to improve the consistent application of clinical urgency categories (that define patient priority), which inform effective waitlist management and booking practice.
Our continued focus going forward is to increase the number of elective treatments we fund or deliver every quarter. Health target data changes over time as data in systems is coded and corrected. This means there may be slight discrepancies between published results depending on the date data was extracted.
See caveats: https://www.tewhatuora.govt.nz/corporate-information/planning-and-performance/health-targets/health-targets/performance +0.35% +0.57% +8.29% -5.70% +1.46% -0.18% -7.88% +11.97% +14.55% +9.49% +1.84% -1.94% +13.59% +9.68% +1.55% +5.06% +15.16% +100% +37.93% +10.78%<br>