Finance conference - November 2021 Understanding the University Financial Landscape Jane Bardell Financial Planning and Analysis Manager Some of the main topics affecting the sector and specifically OU over the next 5 years Scaling income
"Finance conference - November 2021 Understanding" is the property of its rightful owner. Permission is granted to
download and print the materials on this website for personal, non-commercial use only, and to display it
on your personal computer provided you do not modify the materials and that you retain all copyright
notices contained in the materials. By downloading content from our website, you accept the terms of this
agreement.
Presentation Transcript
01
Finance conference - November 2021 Understanding the University Financial Landscape Jane Bardell
Financial Planning and Analysis Manager<br>
02
Some of the main topics affecting the sector and specifically OU over the next 5 years
Scaling income and expenditure at the University
Teaching income – Augur review what could that mean?
Research Growth – what is happening to research funding?
Pension cost growth – why is this hitting so hard?
Other impacts Understanding the University Financial landscape<br>
03
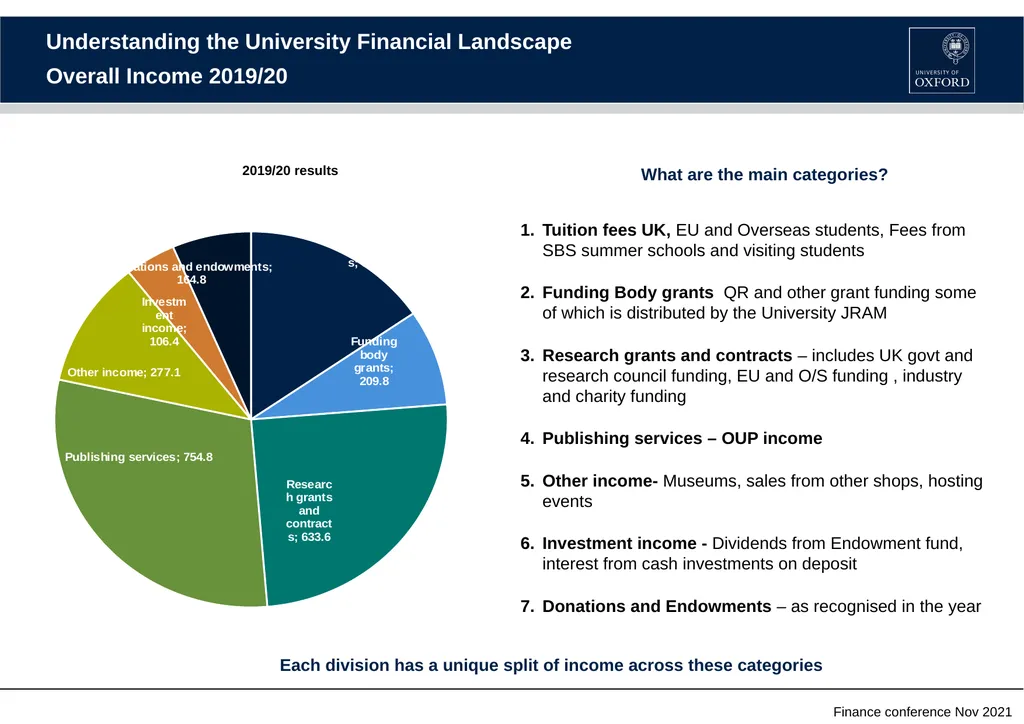
Understanding the University Financial Landscape Overall Income 2019/20 Tuition fees UK, EU and Overseas students, Fees from SBS summer schools and visiting students
Funding Body grants QR and other grant funding some of which is distributed by the University JRAM
Research grants and contracts – includes UK govt and research council funding, EU and O/S funding , industry and charity funding
Publishing services – OUP income
Other income- Museums, sales from other shops, hosting events
Investment income - Dividends from Endowment fund, interest from cash investments on deposit
Donations and Endowments – as recognised in the year Income 5 year forecast What are the main categories? 2019/20 results Each division has a unique split of income across these categories<br>
04
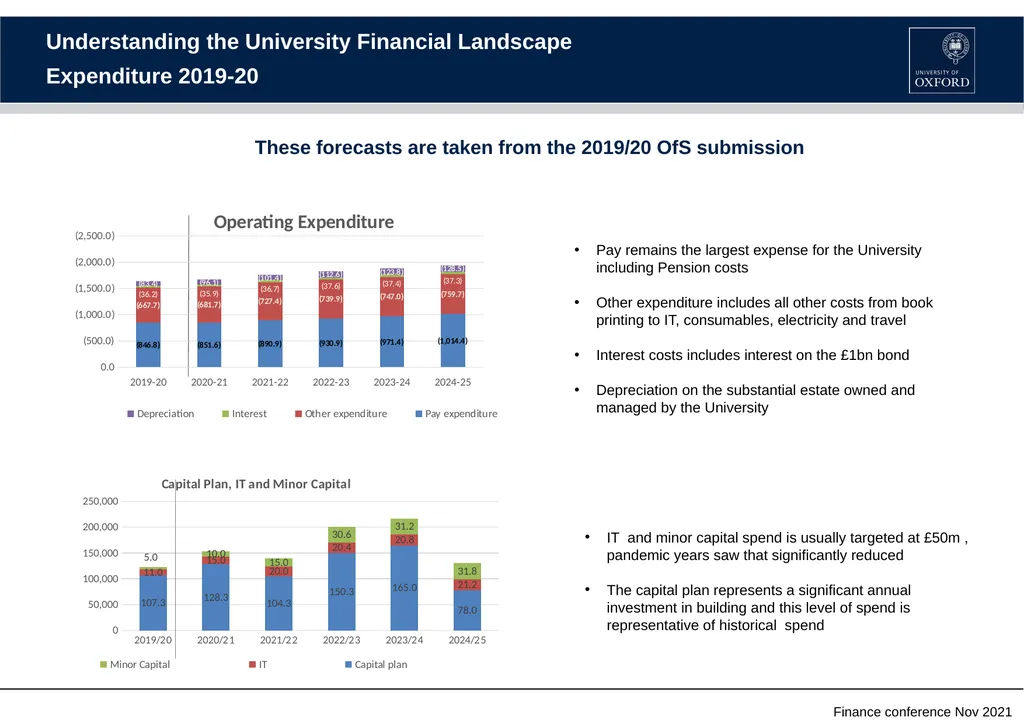
Understanding the University Financial Landscape Expenditure 2019-20 Pay remains the largest expense for the University including Pension costs
Other expenditure includes all other costs from book printing to IT, consumables, electricity and travel
Interest costs includes interest on the £1bn bond
Depreciation on the substantial estate owned and managed by the University IT and minor capital spend is usually targeted at £50m , pandemic years saw that significantly reduced
The capital plan represents a significant annual investment in building and this level of spend is representative of historical spend These forecasts are taken from the 2019/20 OfS submission<br>
05
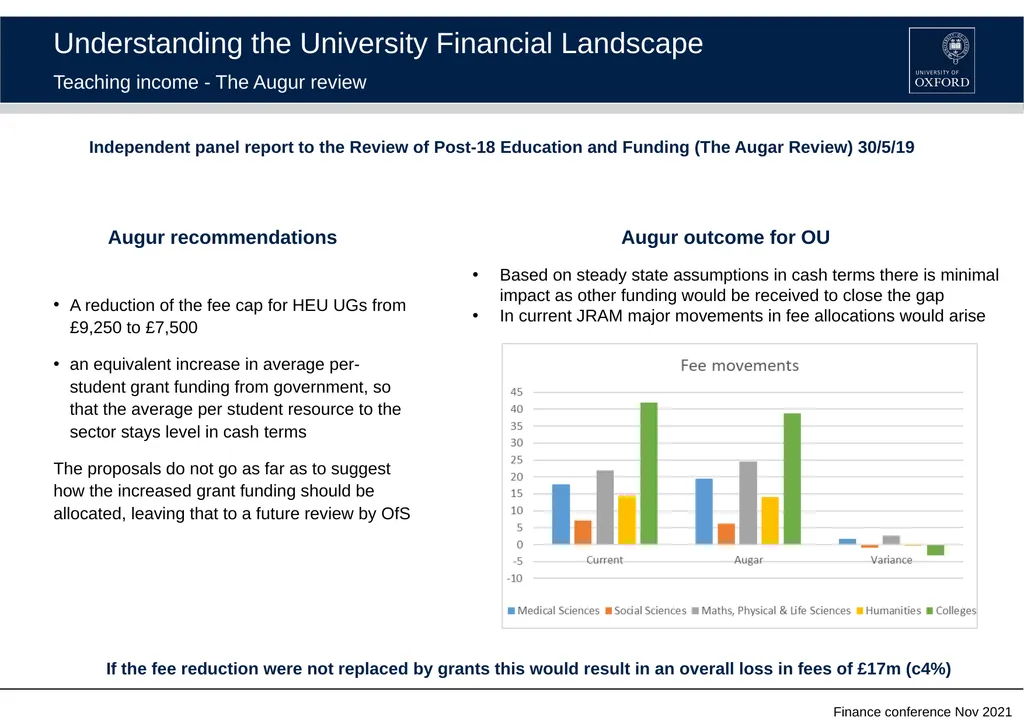
Understanding the University Financial Landscape Teaching income - The Augur review A reduction of the fee cap for HEU UGs from £9,250 to £7,500
an equivalent increase in average per-student grant funding from government, so that the average per student resource to the sector stays level in cash terms
The proposals do not go as far as to suggest how the increased grant funding should be allocated, leaving that to a future review by OfS Independent panel report to the Review of Post-18 Education and Funding (The Augar Review) 30/5/19 Augur recommendations Augur outcome for OU Based on steady state assumptions in cash terms there is minimal impact as other funding would be received to close the gap
In current JRAM major movements in fee allocations would arise If the fee reduction were not replaced by grants this would result in an overall loss in fees of £17m (c4%)<br>
06
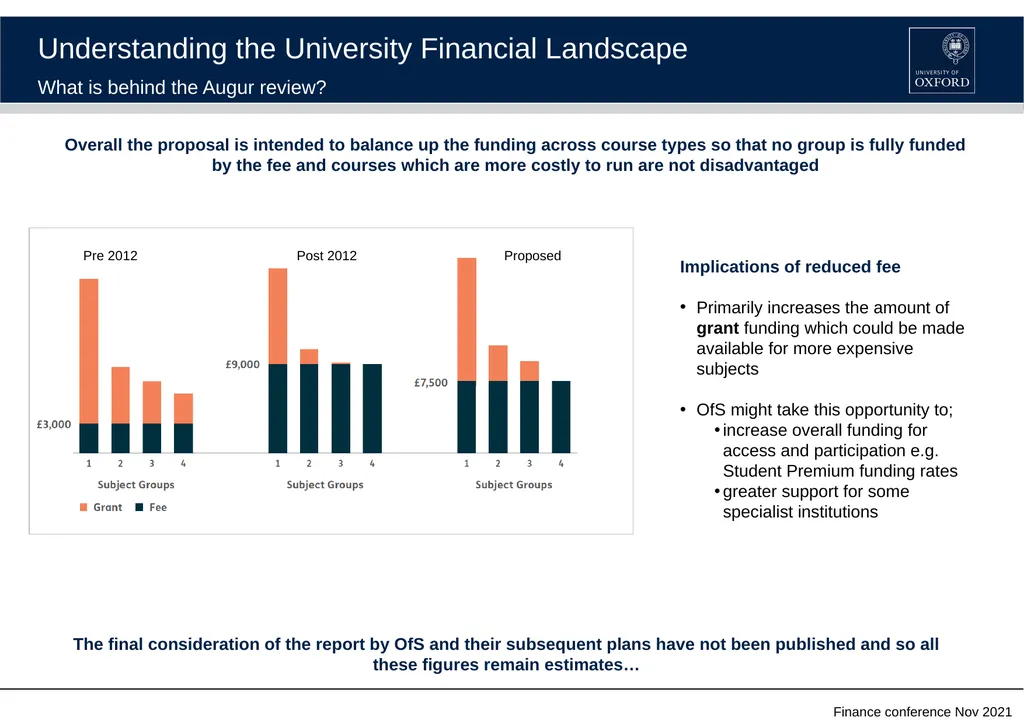
Understanding the University Financial Landscape What is behind the Augur review? Implications of reduced fee
Primarily increases the amount of grant funding which could be made available for more expensive subjects
OfS might take this opportunity to;
increase overall funding for access and participation e.g. Student Premium funding rates
greater support for some specialist institutions Overall the proposal is intended to balance up the funding across course types so that no group is fully funded by the fee and courses which are more costly to run are not disadvantaged The final consideration of the report by OfS and their subsequent plans have not been published and so all these figures remain estimates… Pre 2012 Post 2012 Proposed<br>
07
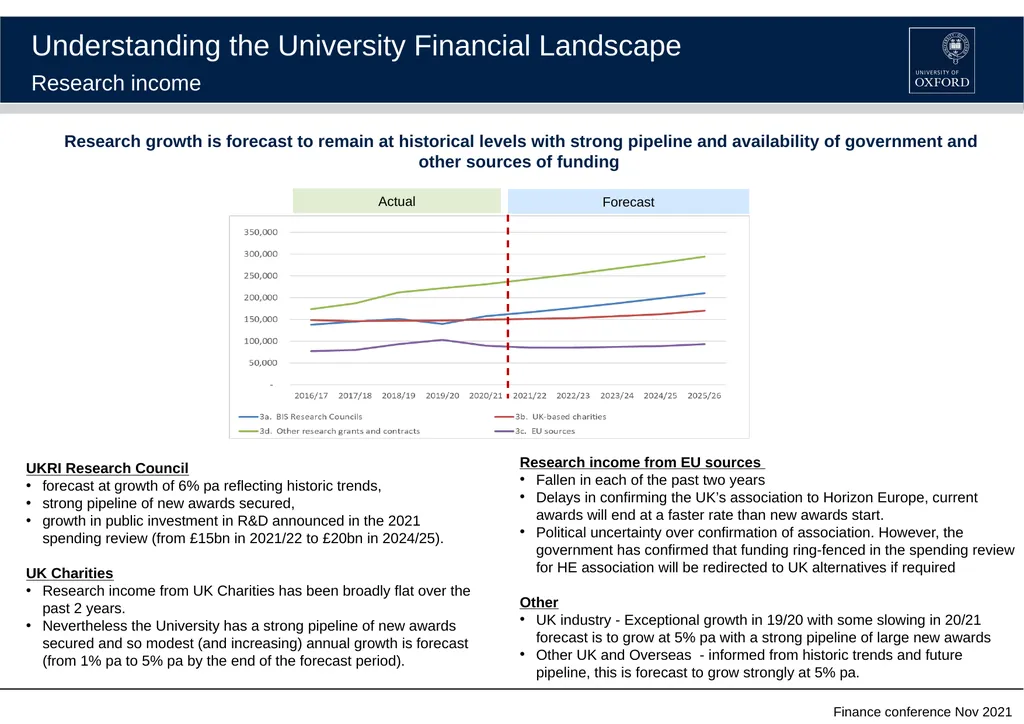
Understanding the University Financial Landscape Research income Research income from EU sources
Fallen in each of the past two years
Delays in confirming the UK’s association to Horizon Europe, current awards will end at a faster rate than new awards start.
Political uncertainty over confirmation of association. However, the government has confirmed that funding ring-fenced in the spending review for HE association will be redirected to UK alternatives if required
Other
UK industry - Exceptional growth in 19/20 with some slowing in 20/21 forecast is to grow at 5% pa with a strong pipeline of large new awards
Other UK and Overseas - informed from historic trends and future pipeline, this is forecast to grow strongly at 5% pa. UKRI Research Council
forecast at growth of 6% pa reflecting historic trends,
strong pipeline of new awards secured,
growth in public investment in R&D announced in the 2021 spending review (from £15bn in 2021/22 to £20bn in 2024/25).
UK Charities
Research income from UK Charities has been broadly flat over the past 2 years.
Nevertheless the University has a strong pipeline of new awards secured and so modest (and increasing) annual growth is forecast (from 1% pa to 5% pa by the end of the forecast period). Research growth is forecast to remain at historical levels with strong pipeline and availability of government and other sources of funding<br>
08
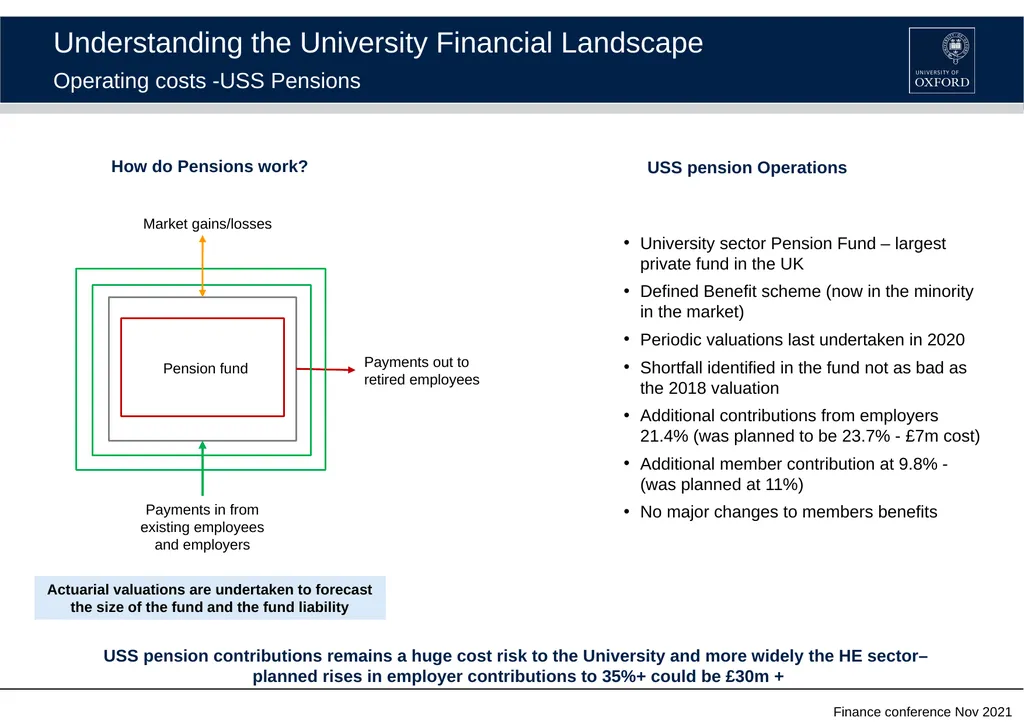
Understanding the University Financial Landscape Operating costs -USS Pensions How do Pensions work? Payments in from existing employees and employers Payments out to retired employees Pension fund Market gains/losses University sector Pension Fund – largest private fund in the UK
Defined Benefit scheme (now in the minority in the market)
Periodic valuations last undertaken in 2020
Shortfall identified in the fund not as bad as the 2018 valuation
Additional contributions from employers 21.4% (was planned to be 23.7% - £7m cost)
Additional member contribution at 9.8% - (was planned at 11%)
No major changes to members benefits USS pension Operations USS pension contributions remains a huge cost risk to the University and more widely the HE sector–
planned rises in employer contributions to 35%+ could be £30m + Actuarial valuations are undertaken to forecast the size of the fund and the fund liability<br>
09
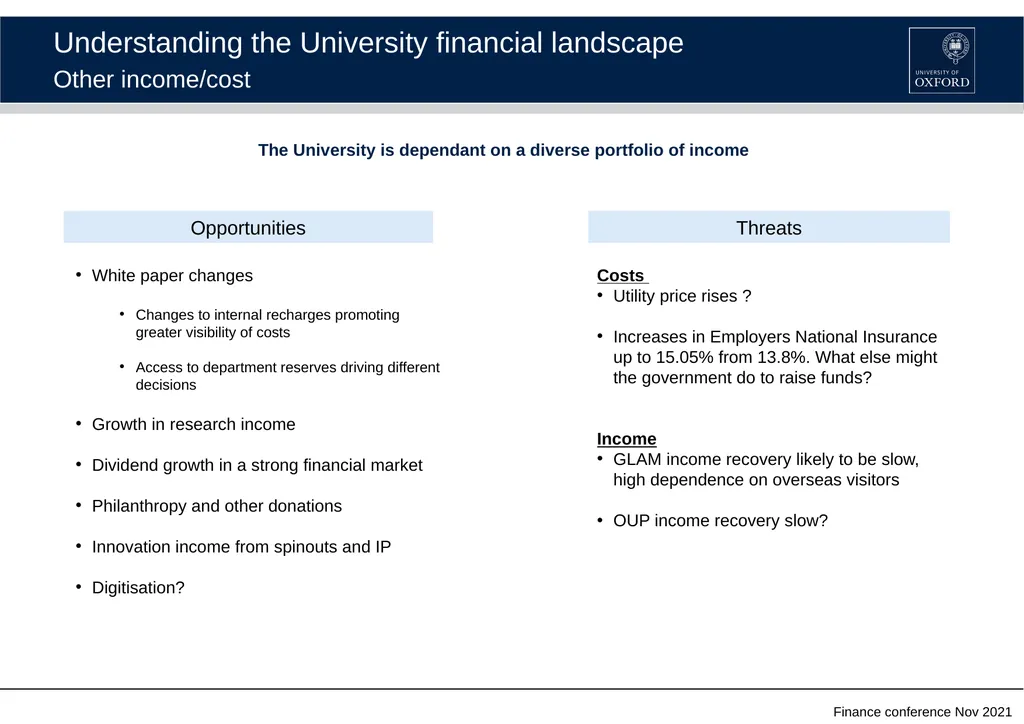
Understanding the University financial landscape Other income/cost Opportunities Threats Costs
Utility price rises ?
Increases in Employers National Insurance up to 15.05% from 13.8%. What else might the government do to raise funds?
Income
GLAM income recovery likely to be slow, high dependence on overseas visitors
OUP income recovery slow? White paper changes
Changes to internal recharges promoting greater visibility of costs
Access to department reserves driving different decisions
Growth in research income
Dividend growth in a strong financial market
Philanthropy and other donations
Innovation income from spinouts and IP
Digitisation? The University is dependant on a diverse portfolio of income<br>