
Finance for Non Financial Managers Matt H. Evans
GB
Published · 120 slides · 0 views

1 / 1

Description
Finance for Non Financial Managers Matt H. Evans CPA, CMA, CFM 25 years in Accounting Finance Former Controller, Financial Manager, Senior Analyst, etc. Formal Training includes Wharton Business School and J.L. Kellogg Graduate School
Related Topics
Share
Embed code
Download this presentation From Below
"Finance for Non Financial Managers Matt H. Evans" is the property of its rightful owner. Permission is granted to download and print the materials on this website for personal, non-commercial use only, and to display it on your personal computer provided you do not modify the materials and that you retain all copyright notices contained in the materials. By downloading content from our website, you accept the terms of this agreement.
Presentation Transcript
01
Finance for Non Financial Managers<br>
02
Matt H. Evans CPA, CMA, CFM
25 years + in Accounting & Finance
Former Controller, Financial Manager, Senior Analyst, etc.
Formal Training includes Wharton Business School and J.L. Kellogg Graduate School of Management
Work & live here in D.C. area 2<br>
25 years + in Accounting & Finance
Former Controller, Financial Manager, Senior Analyst, etc.
Formal Training includes Wharton Business School and J.L. Kellogg Graduate School of Management
Work & live here in D.C. area 2<br>
03
About You Your Name
Your Title
Your Organization
What you hope to gain from this workshop 3<br>
Your Title
Your Organization
What you hope to gain from this workshop 3<br>
04
Learning Objectives
as it relates to PMBOK At the completion of this course, the student will be able to:
Understand how to work with financial information to effectively manage project cost management tasks set forth in A Guide to the Project Management Body of Knowledge (PMBOK® Guide), Fifth Edition.
Apply basic accounting procedures to effectively track and manage project budgets as set forth in PMBOK® Guide
Analyze financial statements and understand the project impact in order to maintain best practices set forth in PMBOK® Guide.
Understand the core concepts of financial analysis as they apply to corporations and long-term projects.
Apply financial analysis concepts as they relate to risk management, procurement management, and cost management knowledge area best practices set forth in PMBOK® Guide. 4<br>
Understand how to work with financial information to effectively manage project cost management tasks set forth in A Guide to the Project Management Body of Knowledge (PMBOK® Guide), Fifth Edition.
Apply basic accounting procedures to effectively track and manage project budgets as set forth in PMBOK® Guide
Analyze financial statements and understand the project impact in order to maintain best practices set forth in PMBOK® Guide.
Understand the core concepts of financial analysis as they apply to corporations and long-term projects.
Apply financial analysis concepts as they relate to risk management, procurement management, and cost management knowledge area best practices set forth in PMBOK® Guide. 4<br>
05
Overview of Workshop Purpose is to give you a good overall understanding of how to work with financial information
Assumes you know nothing about finance
Consists of several small modules – each builds on the previous module
Interactive – Feel free to ask questions as we progress
Two days – Day 1 covers core topics and Day 2 reinforces Day 1 + advanced topics
All modules are reinforced with multiple choice questions or case study exercises 5<br>
Assumes you know nothing about finance
Consists of several small modules – each builds on the previous module
Interactive – Feel free to ask questions as we progress
Two days – Day 1 covers core topics and Day 2 reinforces Day 1 + advanced topics
All modules are reinforced with multiple choice questions or case study exercises 5<br>
06
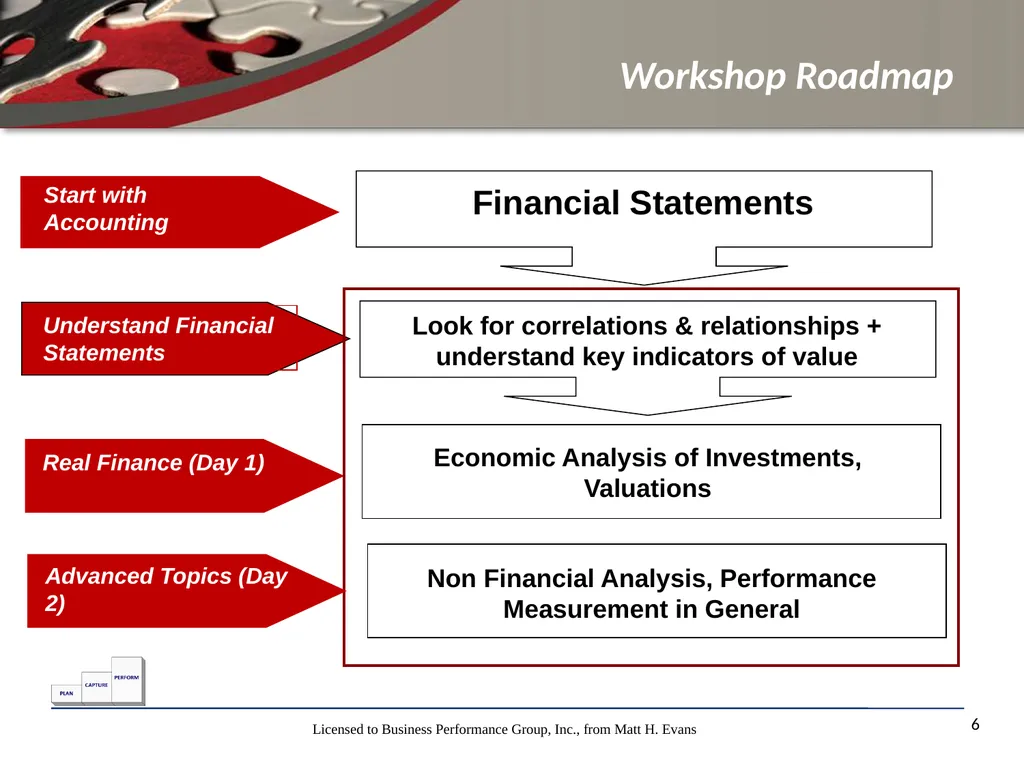
Workshop Roadmap 6 Financial Statements Look for correlations & relationships + understand key indicators of value Economic Analysis of Investments, Valuations Start with Accounting Understand Financial Statements Real Finance (Day 1) Advanced Topics (Day 2) Non Financial Analysis, Performance Measurement in General<br>
07
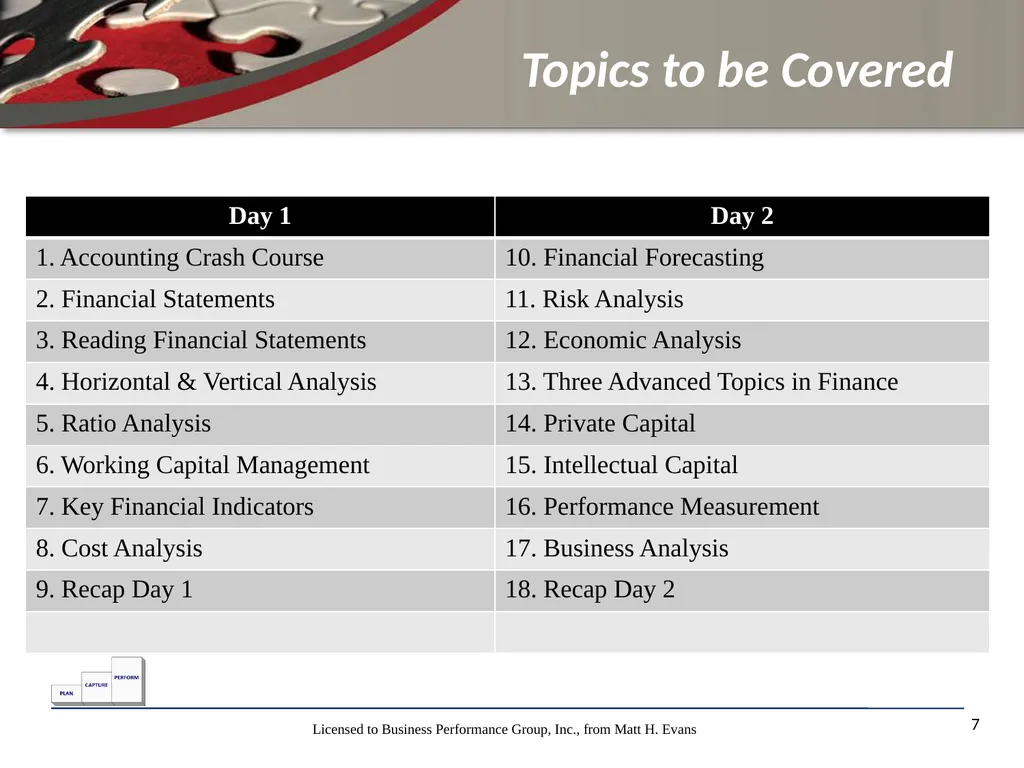
Topics to be Covered 7<br>
08
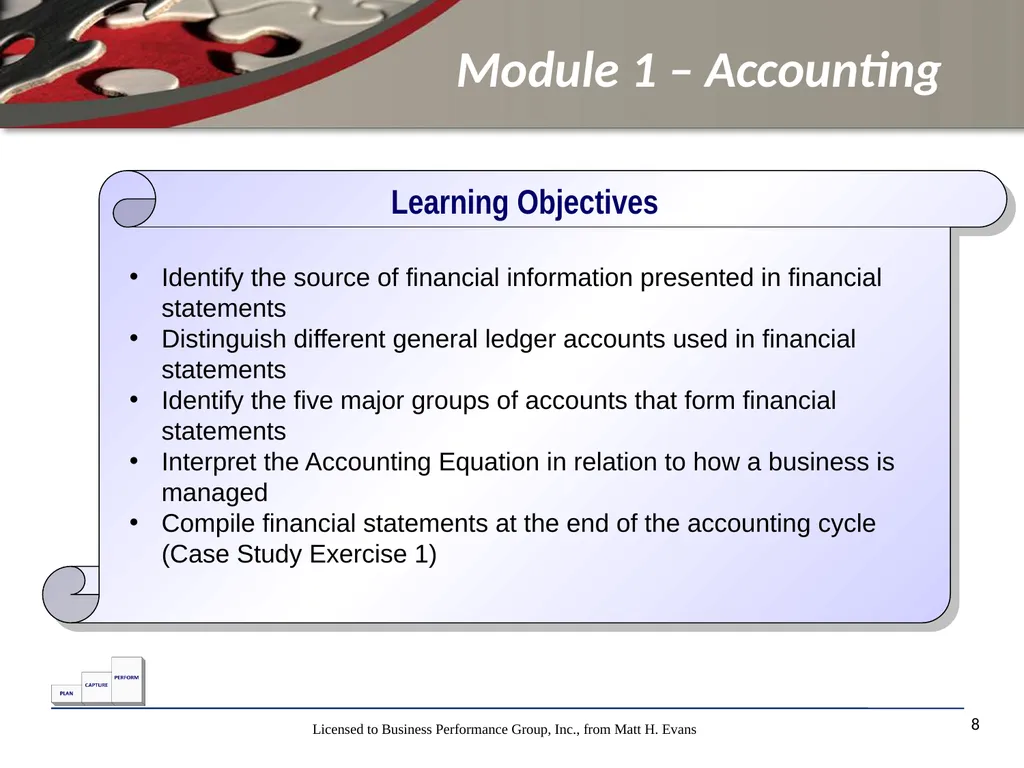
8 Learning Objectives Identify the source of financial information presented in financial statements
Distinguish different general ledger accounts used in financial statements
Identify the five major groups of accounts that form financial statements
Interpret the Accounting Equation in relation to how a business is managed
Compile financial statements at the end of the accounting cycle (Case Study Exercise 1) Module 1 – Accounting<br>
Distinguish different general ledger accounts used in financial statements
Identify the five major groups of accounts that form financial statements
Interpret the Accounting Equation in relation to how a business is managed
Compile financial statements at the end of the accounting cycle (Case Study Exercise 1) Module 1 – Accounting<br>
09
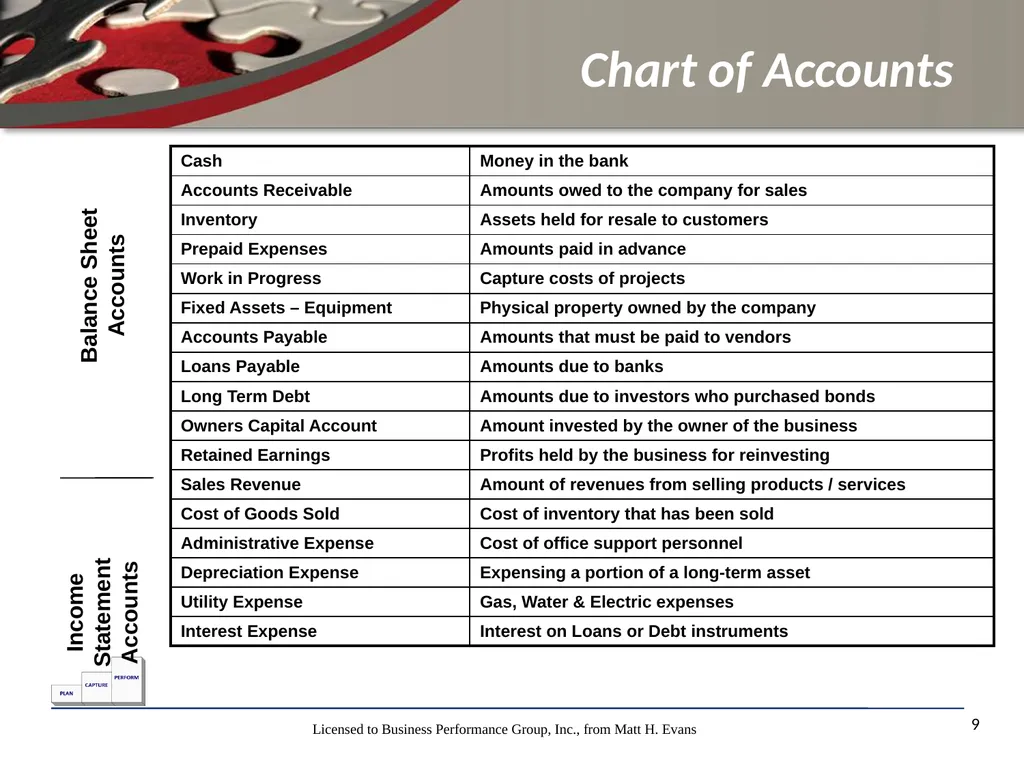
Chart of Accounts 9 Balance Sheet Accounts Income Statement Accounts<br>
10
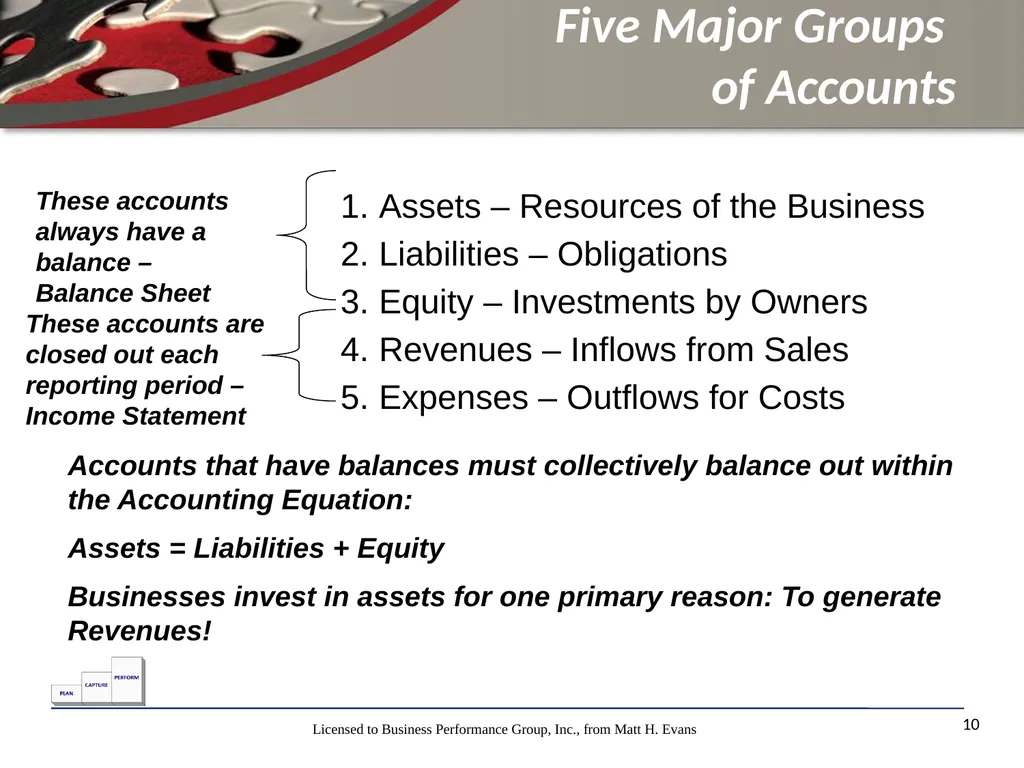
Five Major Groups
of Accounts 10 Assets – Resources of the Business
Liabilities – Obligations
Equity – Investments by Owners
Revenues – Inflows from Sales
Expenses – Outflows for Costs Accounts that have balances must collectively balance out within the Accounting Equation:
Assets = Liabilities + Equity
Businesses invest in assets for one primary reason: To generate Revenues! These accounts always have a balance – Balance Sheet These accounts are closed out each reporting period – Income Statement<br>
Liabilities – Obligations
Equity – Investments by Owners
Revenues – Inflows from Sales
Expenses – Outflows for Costs Accounts that have balances must collectively balance out within the Accounting Equation:
Assets = Liabilities + Equity
Businesses invest in assets for one primary reason: To generate Revenues! These accounts always have a balance – Balance Sheet These accounts are closed out each reporting period – Income Statement<br>
11
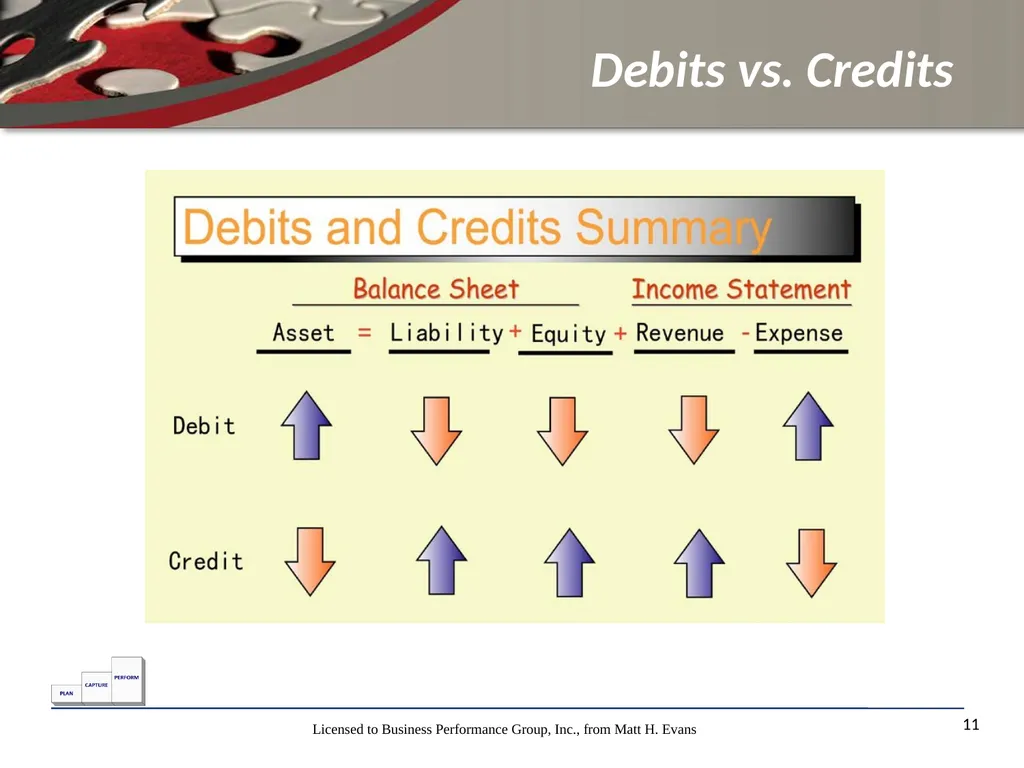
Debits vs. Credits 11<br>
12
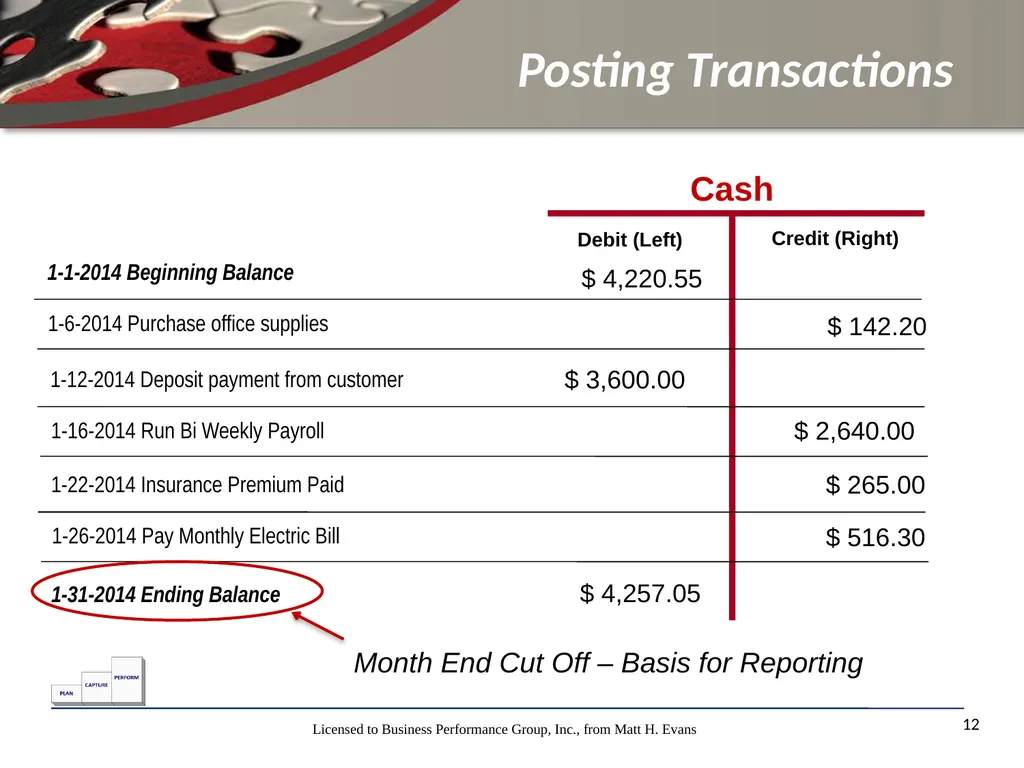
Posting Transactions 12 1-6-2014 Purchase office supplies 1-1-2014 Beginning Balance Cash 1-16-2014 Run Bi Weekly Payroll 1-12-2014 Deposit payment from customer 1-26-2014 Pay Monthly Electric Bill 1-22-2014 Insurance Premium Paid $ 4,220.55 $ 142.20 1-31-2014 Ending Balance $ 3,600.00 $ 2,640.00 $ 265.00 $ 516.30 $ 4,257.05 Debit (Left) Credit (Right) Month End Cut Off – Basis for Reporting<br>
13
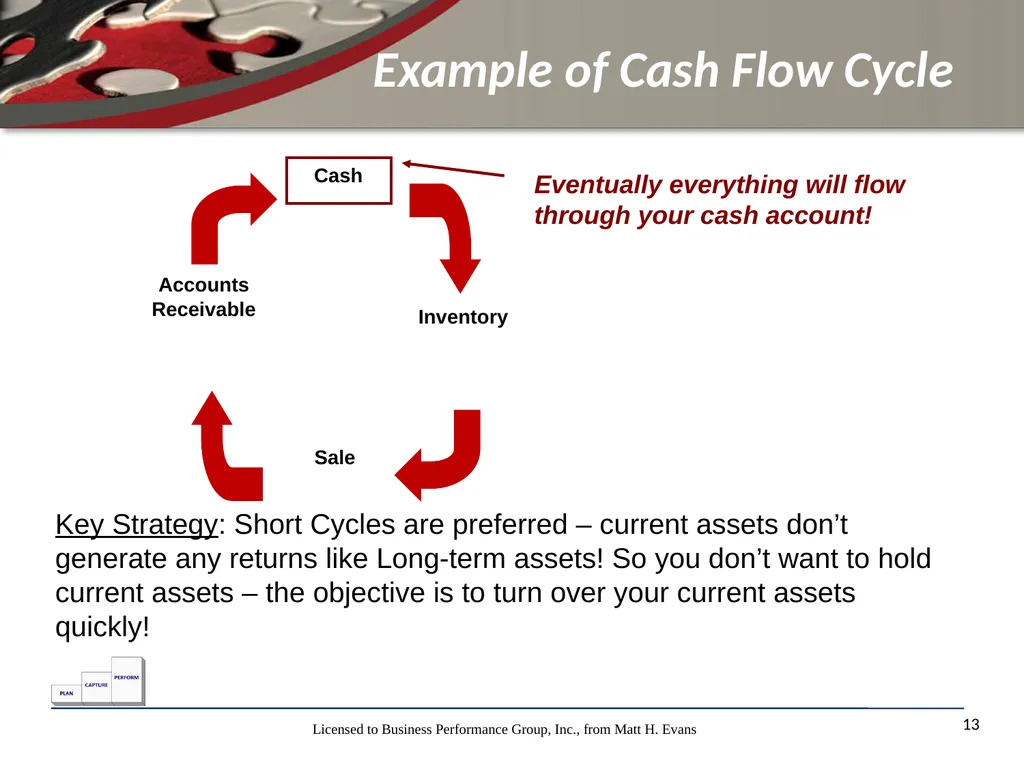
Example of Cash Flow Cycle 13 Key Strategy: Short Cycles are preferred – current assets don’t generate any returns like Long-term assets! So you don’t want to hold current assets – the objective is to turn over your current assets quickly! Eventually everything will flow through your cash account!<br>
14
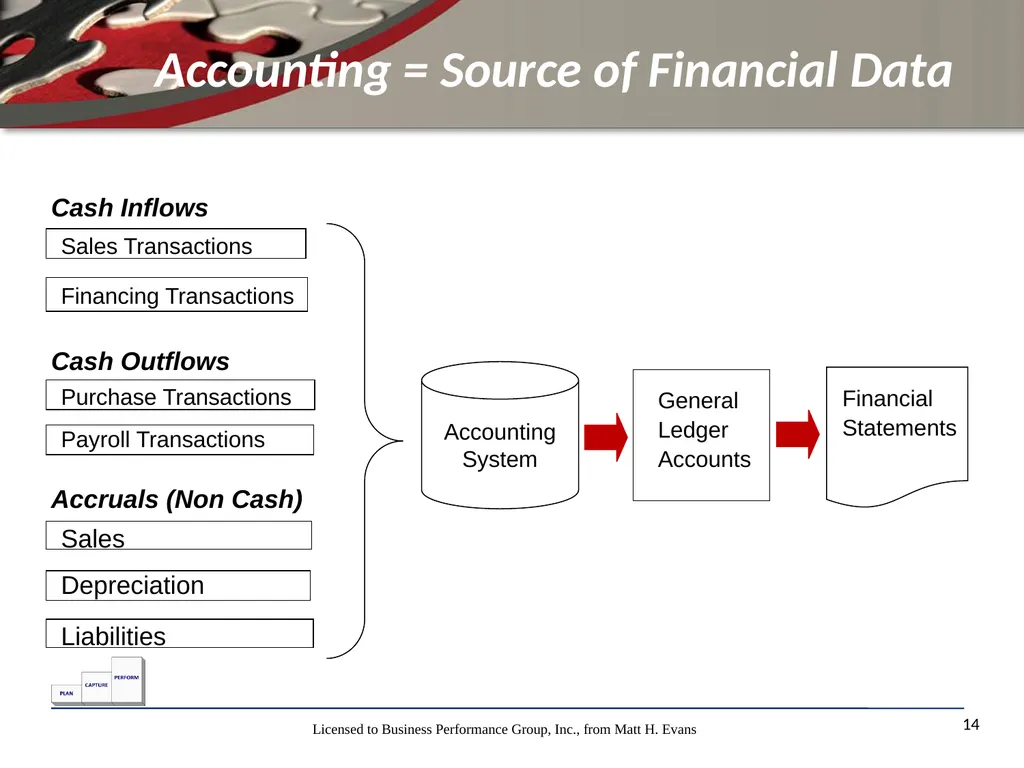
Accounting = Source of Financial Data 14<br>
15
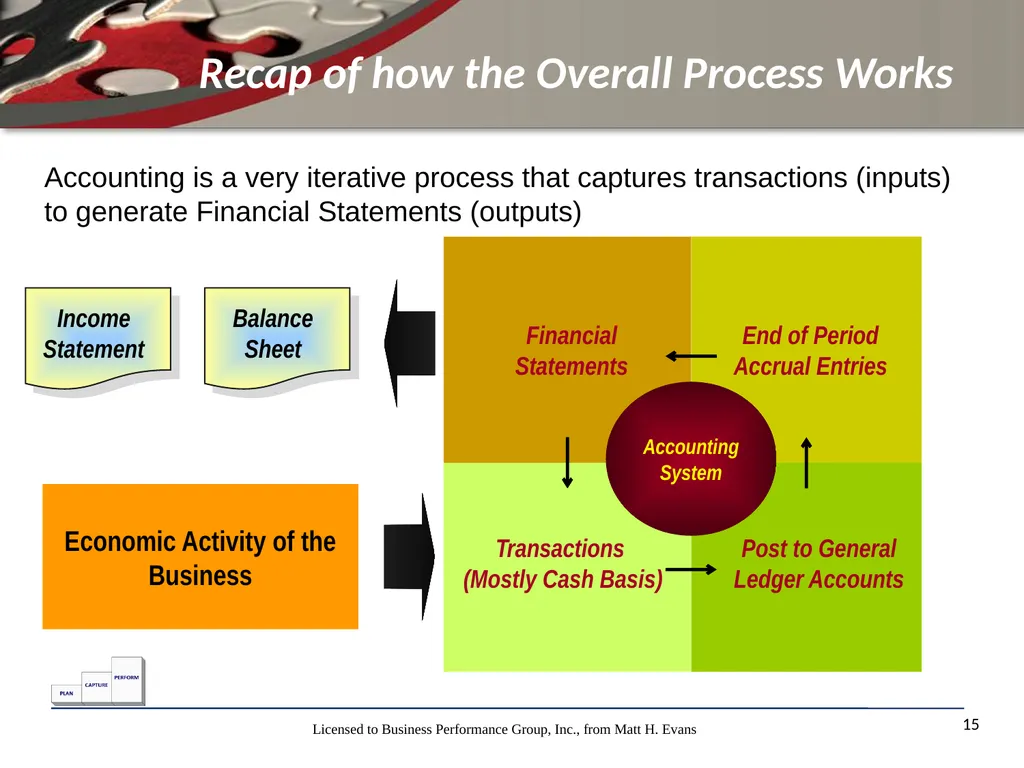
Recap of how the Overall Process Works 15 Accounting System Financial Statements End of Period Accrual Entries Transactions
(Mostly Cash Basis) Post to General Ledger Accounts Balance
Sheet Income
Statement Economic Activity of the Business Accounting is a very iterative process that captures transactions (inputs) to generate Financial Statements (outputs)<br>
(Mostly Cash Basis) Post to General Ledger Accounts Balance
Sheet Income
Statement Economic Activity of the Business Accounting is a very iterative process that captures transactions (inputs) to generate Financial Statements (outputs)<br>
16
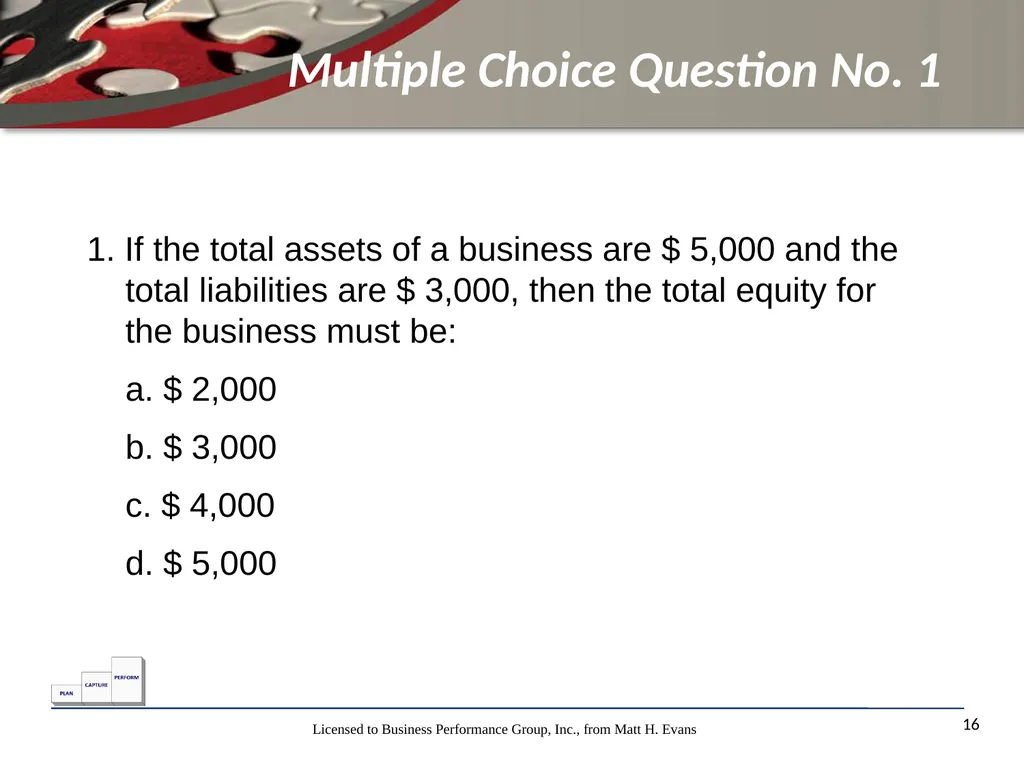
Multiple Choice Question No. 1 16 1. If the total assets of a business are $ 5,000 and the total liabilities are $ 3,000, then the total equity for the business must be:
a. $ 2,000
b. $ 3,000
c. $ 4,000
d. $ 5,000<br>
a. $ 2,000
b. $ 3,000
c. $ 4,000
d. $ 5,000<br>
17
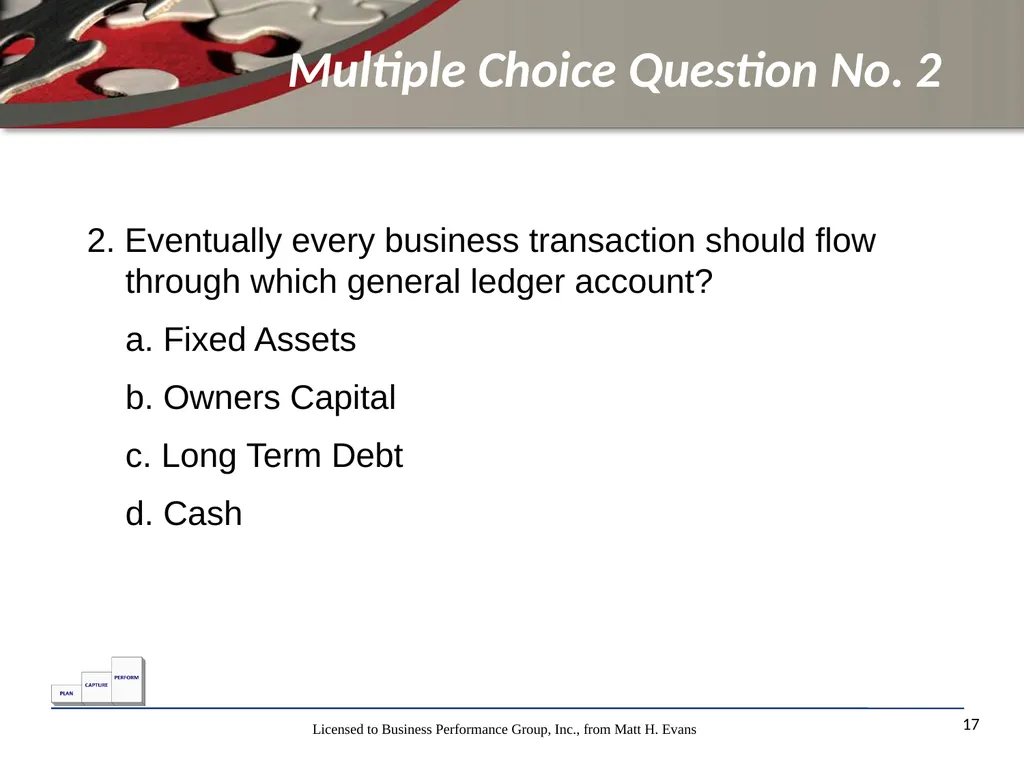
Multiple Choice Question No. 2 17 2. Eventually every business transaction should flow through which general ledger account?
a. Fixed Assets
b. Owners Capital
c. Long Term Debt
d. Cash<br>
a. Fixed Assets
b. Owners Capital
c. Long Term Debt
d. Cash<br>
18
Case Study Exercise 1 –
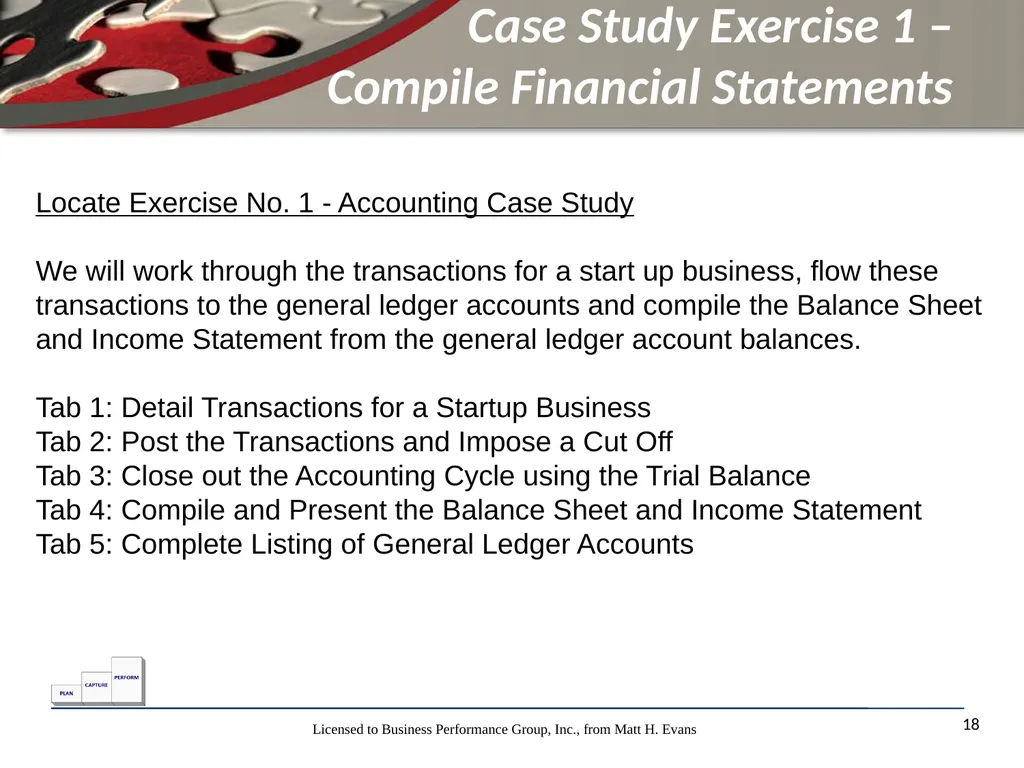
Compile Financial Statements 18 Locate Exercise No. 1 - Accounting Case Study
We will work through the transactions for a start up business, flow these transactions to the general ledger accounts and compile the Balance Sheet and Income Statement from the general ledger account balances.
Tab 1: Detail Transactions for a Startup Business
Tab 2: Post the Transactions and Impose a Cut Off
Tab 3: Close out the Accounting Cycle using the Trial Balance
Tab 4: Compile and Present the Balance Sheet and Income Statement
Tab 5: Complete Listing of General Ledger Accounts<br>
We will work through the transactions for a start up business, flow these transactions to the general ledger accounts and compile the Balance Sheet and Income Statement from the general ledger account balances.
Tab 1: Detail Transactions for a Startup Business
Tab 2: Post the Transactions and Impose a Cut Off
Tab 3: Close out the Accounting Cycle using the Trial Balance
Tab 4: Compile and Present the Balance Sheet and Income Statement
Tab 5: Complete Listing of General Ledger Accounts<br>
19
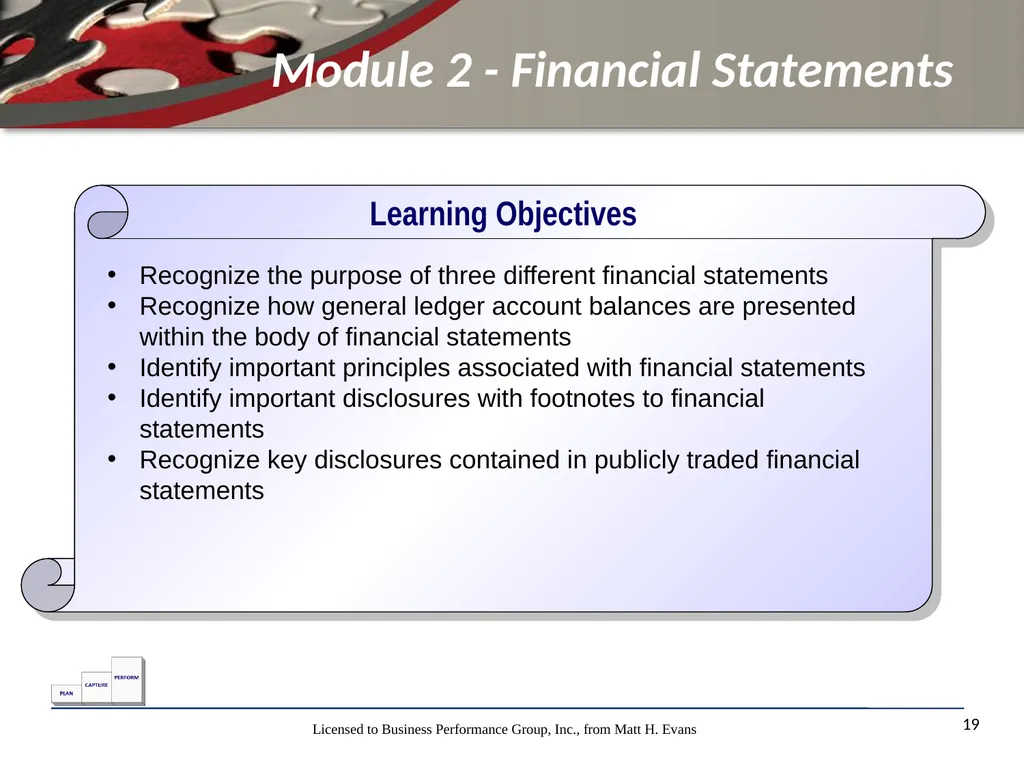
19 Learning Objectives Recognize the purpose of three different financial statements
Recognize how general ledger account balances are presented within the body of financial statements
Identify important principles associated with financial statements
Identify important disclosures with footnotes to financial statements
Recognize key disclosures contained in publicly traded financial statements Module 2 - Financial Statements<br>
Recognize how general ledger account balances are presented within the body of financial statements
Identify important principles associated with financial statements
Identify important disclosures with footnotes to financial statements
Recognize key disclosures contained in publicly traded financial statements Module 2 - Financial Statements<br>
20
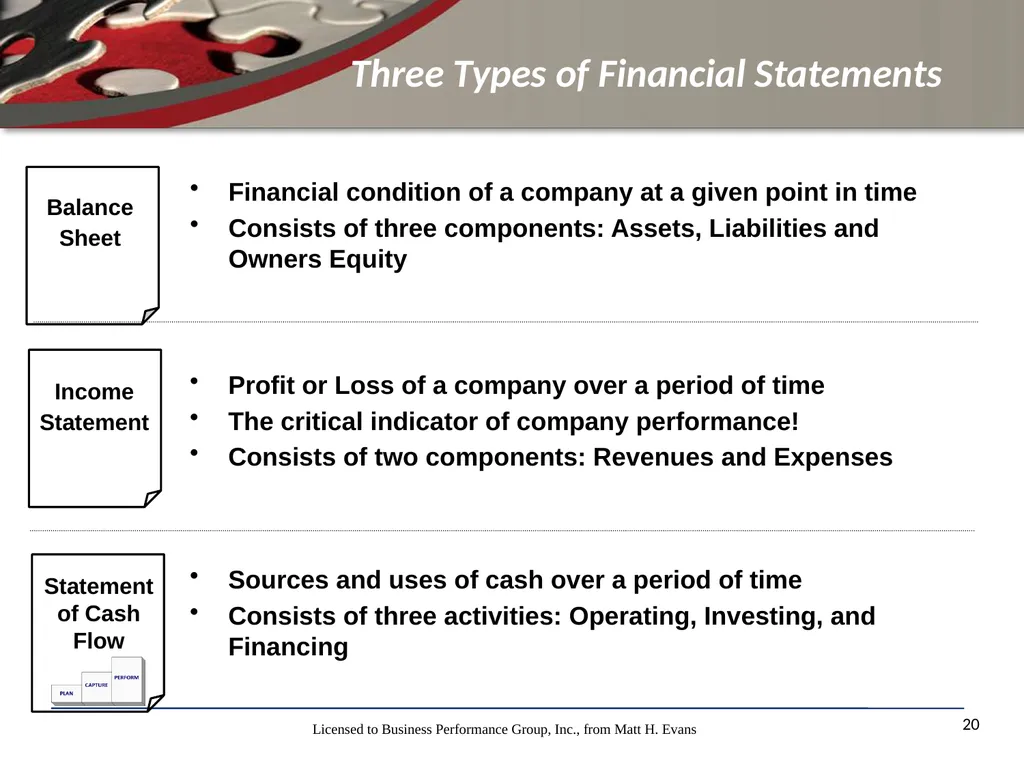
Three Types of Financial Statements 20 Financial condition of a company at a given point in time
Consists of three components: Assets, Liabilities and Owners Equity Profit or Loss of a company over a period of time
The critical indicator of company performance!
Consists of two components: Revenues and Expenses Sources and uses of cash over a period of time
Consists of three activities: Operating, Investing, and Financing Income
Statement Statement of Cash Flow Balance
Sheet<br>
Consists of three components: Assets, Liabilities and Owners Equity Profit or Loss of a company over a period of time
The critical indicator of company performance!
Consists of two components: Revenues and Expenses Sources and uses of cash over a period of time
Consists of three activities: Operating, Investing, and Financing Income
Statement Statement of Cash Flow Balance
Sheet<br>
21
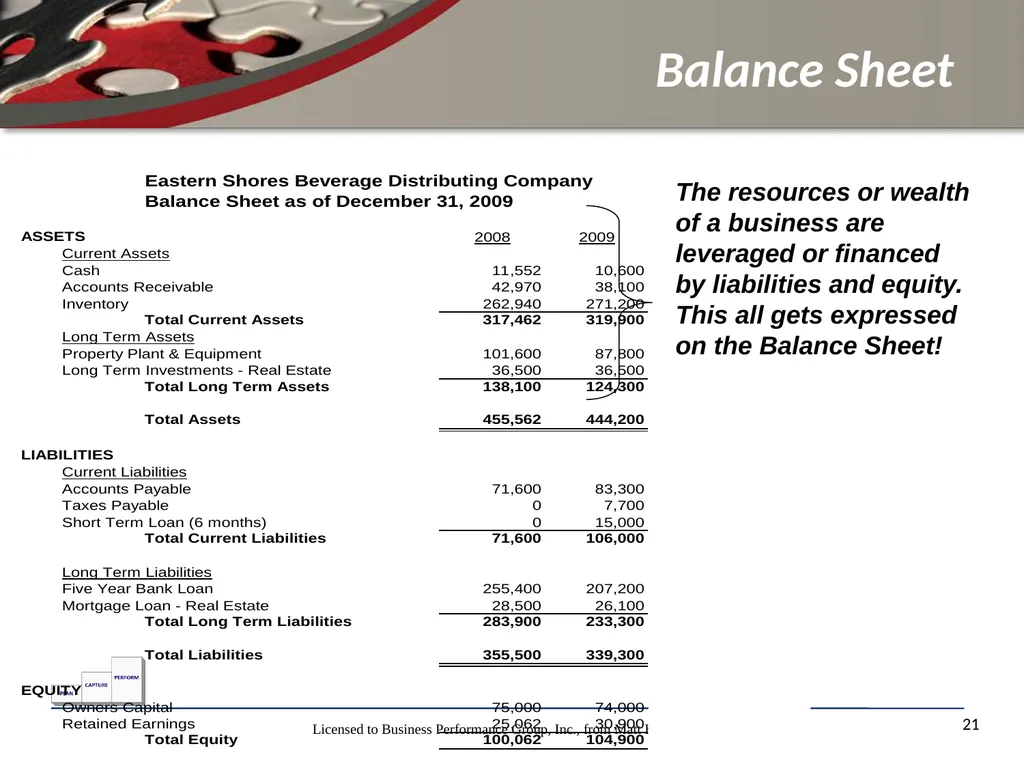
Balance Sheet 21 The resources or wealth of a business are leveraged or financed by liabilities and equity. This all gets expressed on the Balance Sheet!<br>
22
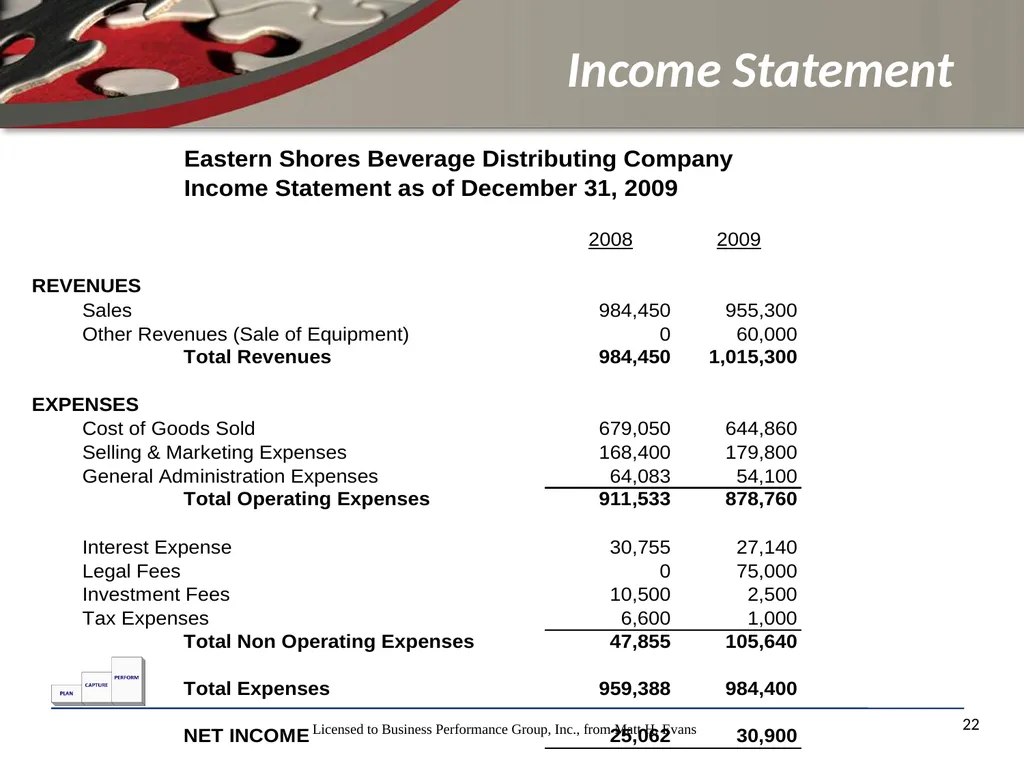
Income Statement 22<br>
23
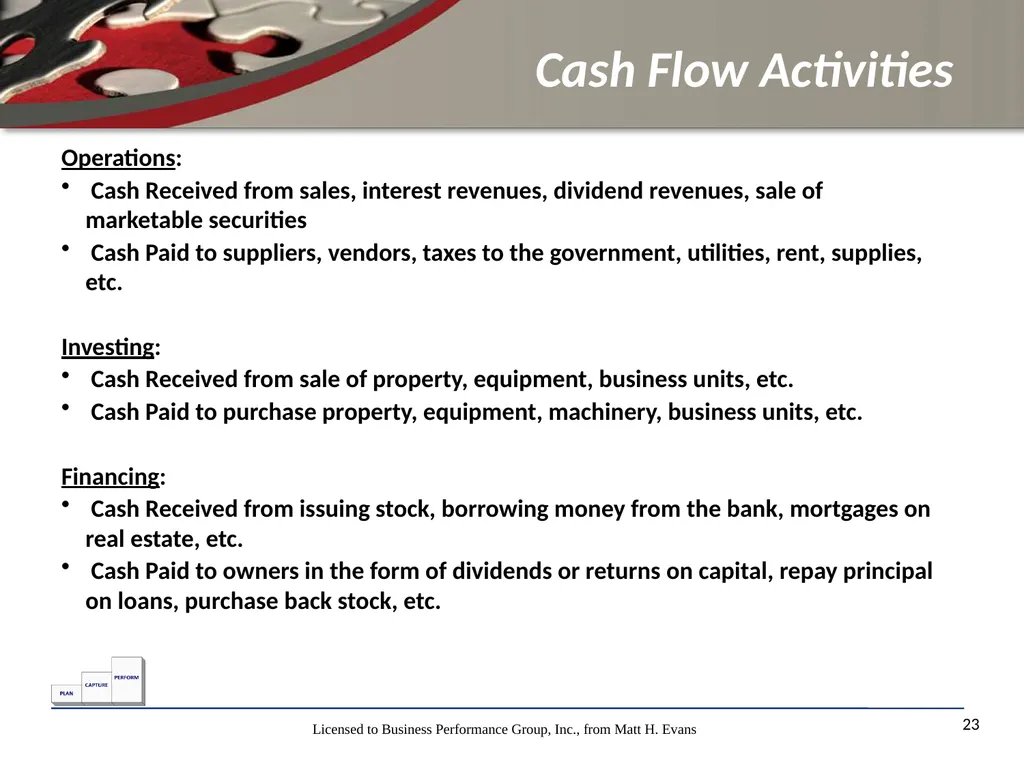
Cash Flow Activities 23 Operations:
Cash Received from sales, interest revenues, dividend revenues, sale of marketable securities
Cash Paid to suppliers, vendors, taxes to the government, utilities, rent, supplies, etc.
Investing:
Cash Received from sale of property, equipment, business units, etc.
Cash Paid to purchase property, equipment, machinery, business units, etc.
Financing:
Cash Received from issuing stock, borrowing money from the bank, mortgages on real estate, etc.
Cash Paid to owners in the form of dividends or returns on capital, repay principal on loans, purchase back stock, etc.<br>
Cash Received from sales, interest revenues, dividend revenues, sale of marketable securities
Cash Paid to suppliers, vendors, taxes to the government, utilities, rent, supplies, etc.
Investing:
Cash Received from sale of property, equipment, business units, etc.
Cash Paid to purchase property, equipment, machinery, business units, etc.
Financing:
Cash Received from issuing stock, borrowing money from the bank, mortgages on real estate, etc.
Cash Paid to owners in the form of dividends or returns on capital, repay principal on loans, purchase back stock, etc.<br>
24
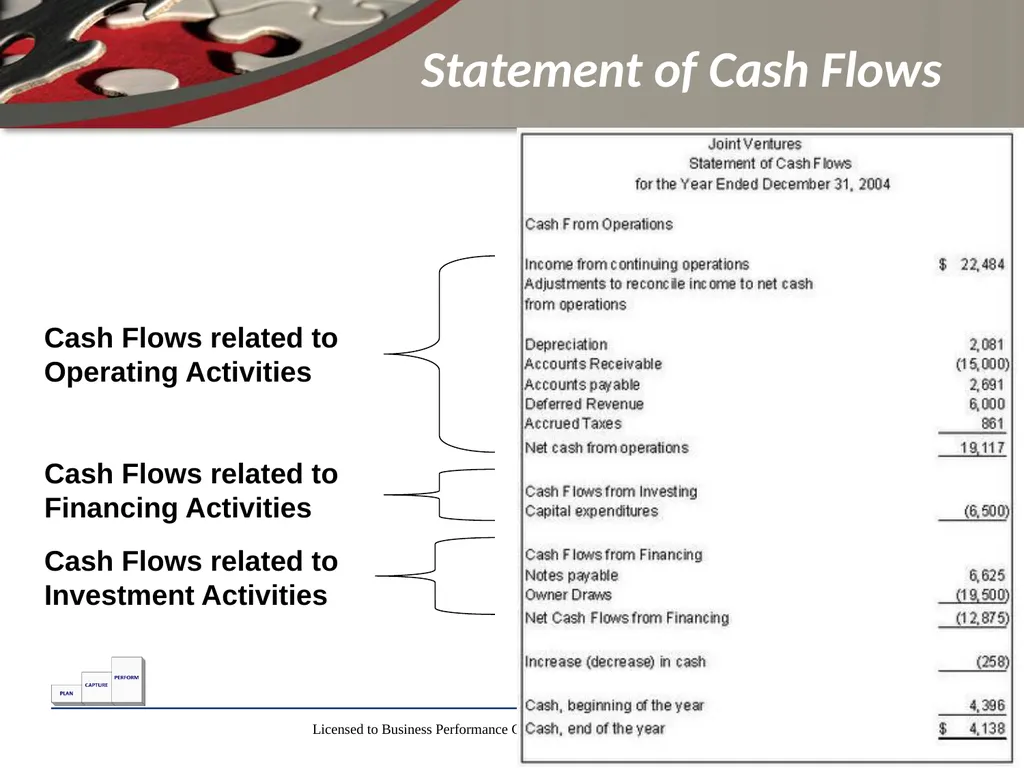
Statement of Cash Flows 24 Cash Flows related to Operating Activities Cash Flows related to Financing Activities Cash Flows related to Investment Activities<br>
25
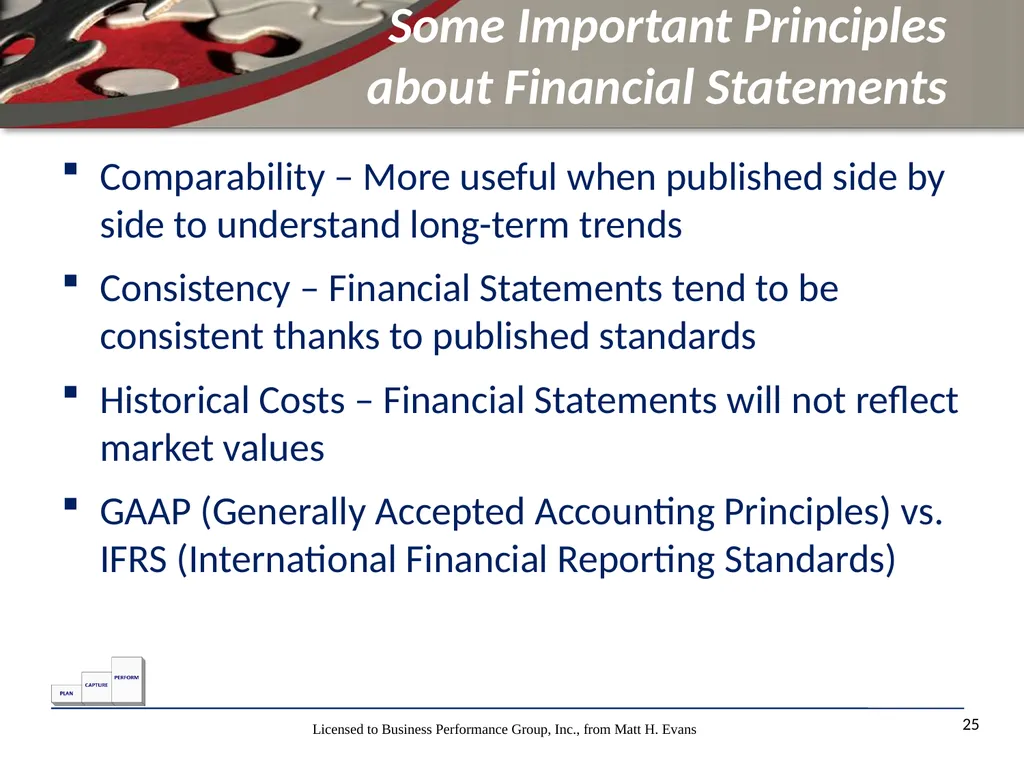
Some Important Principles
about Financial Statements Comparability – More useful when published side by side to understand long-term trends
Consistency – Financial Statements tend to be consistent thanks to published standards
Historical Costs – Financial Statements will not reflect market values
GAAP (Generally Accepted Accounting Principles) vs. IFRS (International Financial Reporting Standards) 25<br>
Consistency – Financial Statements tend to be consistent thanks to published standards
Historical Costs – Financial Statements will not reflect market values
GAAP (Generally Accepted Accounting Principles) vs. IFRS (International Financial Reporting Standards) 25<br>
26
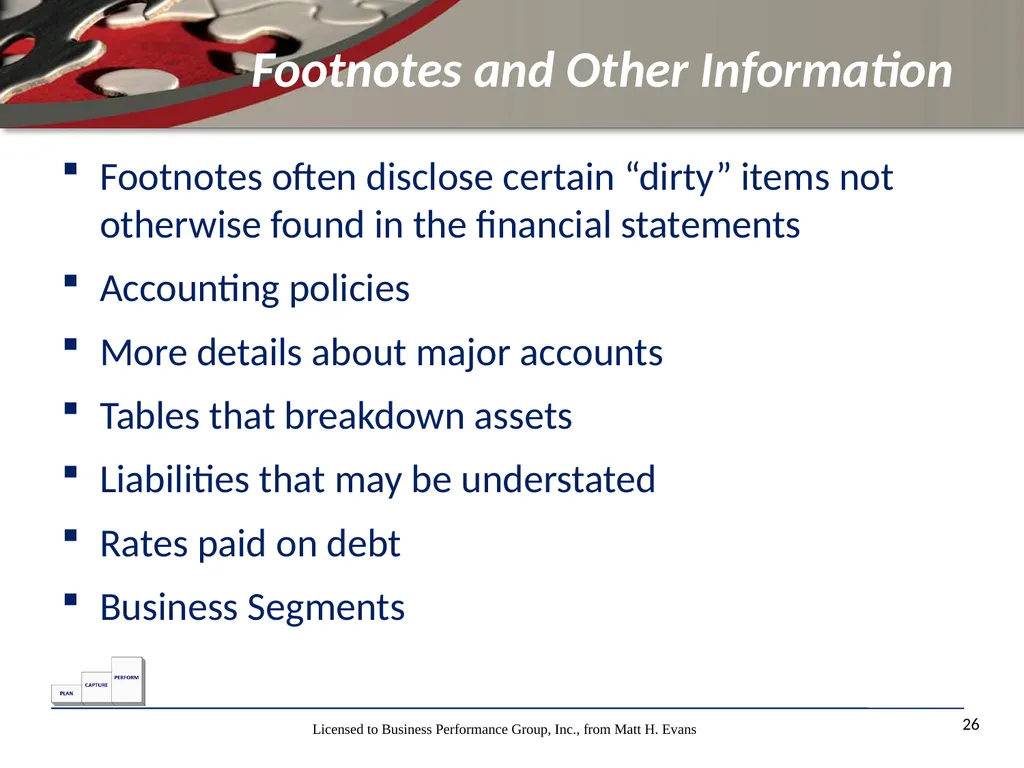
Footnotes and Other Information Footnotes often disclose certain “dirty” items not otherwise found in the financial statements
Accounting policies
More details about major accounts
Tables that breakdown assets
Liabilities that may be understated
Rates paid on debt
Business Segments 26<br>
Accounting policies
More details about major accounts
Tables that breakdown assets
Liabilities that may be understated
Rates paid on debt
Business Segments 26<br>
27
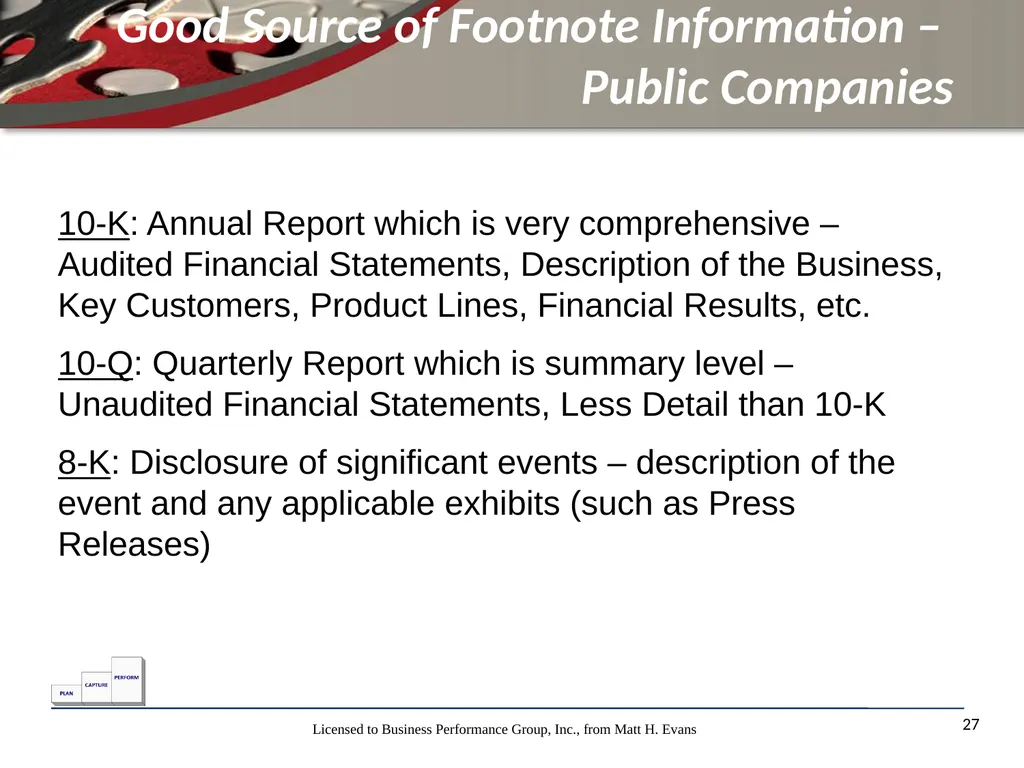
Good Source of Footnote Information –
Public Companies 27 10-K: Annual Report which is very comprehensive – Audited Financial Statements, Description of the Business, Key Customers, Product Lines, Financial Results, etc.
10-Q: Quarterly Report which is summary level – Unaudited Financial Statements, Less Detail than 10-K
8-K: Disclosure of significant events – description of the event and any applicable exhibits (such as Press Releases)<br>
10-Q: Quarterly Report which is summary level – Unaudited Financial Statements, Less Detail than 10-K
8-K: Disclosure of significant events – description of the event and any applicable exhibits (such as Press Releases)<br>
28
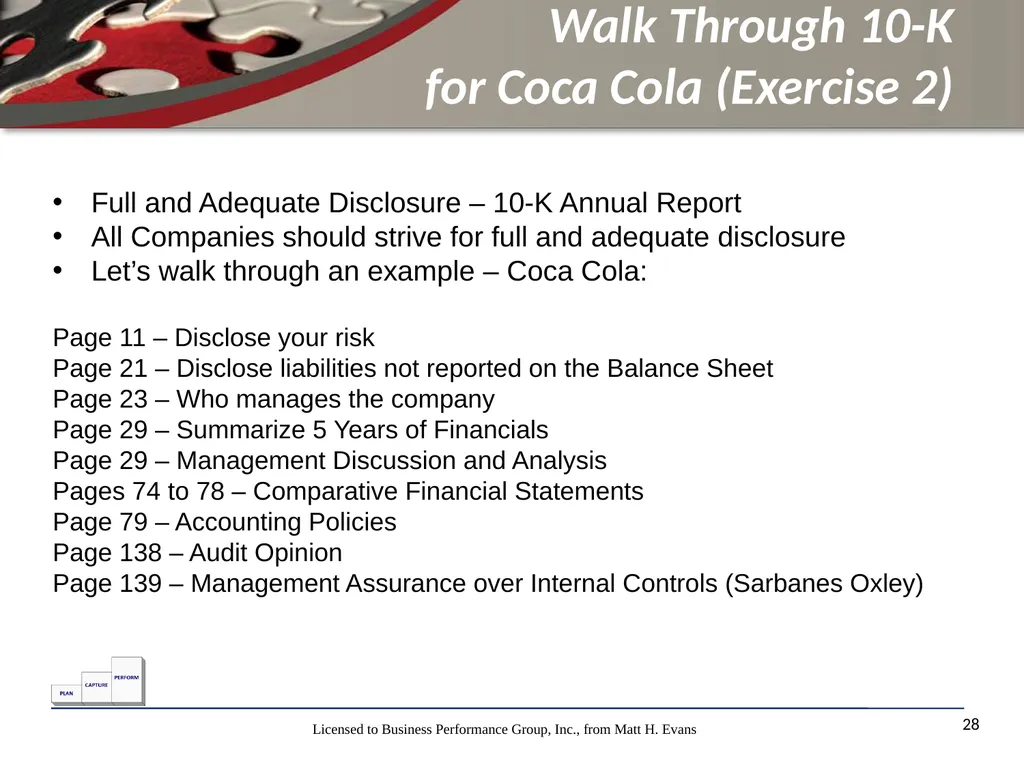
Walk Through 10-K
for Coca Cola (Exercise 2) 28 Full and Adequate Disclosure – 10-K Annual Report
All Companies should strive for full and adequate disclosure
Let’s walk through an example – Coca Cola:
Page 11 – Disclose your risk
Page 21 – Disclose liabilities not reported on the Balance Sheet
Page 23 – Who manages the company
Page 29 – Summarize 5 Years of Financials
Page 29 – Management Discussion and Analysis
Pages 74 to 78 – Comparative Financial Statements
Page 79 – Accounting Policies
Page 138 – Audit Opinion
Page 139 – Management Assurance over Internal Controls (Sarbanes Oxley)<br>
All Companies should strive for full and adequate disclosure
Let’s walk through an example – Coca Cola:
Page 11 – Disclose your risk
Page 21 – Disclose liabilities not reported on the Balance Sheet
Page 23 – Who manages the company
Page 29 – Summarize 5 Years of Financials
Page 29 – Management Discussion and Analysis
Pages 74 to 78 – Comparative Financial Statements
Page 79 – Accounting Policies
Page 138 – Audit Opinion
Page 139 – Management Assurance over Internal Controls (Sarbanes Oxley)<br>
29
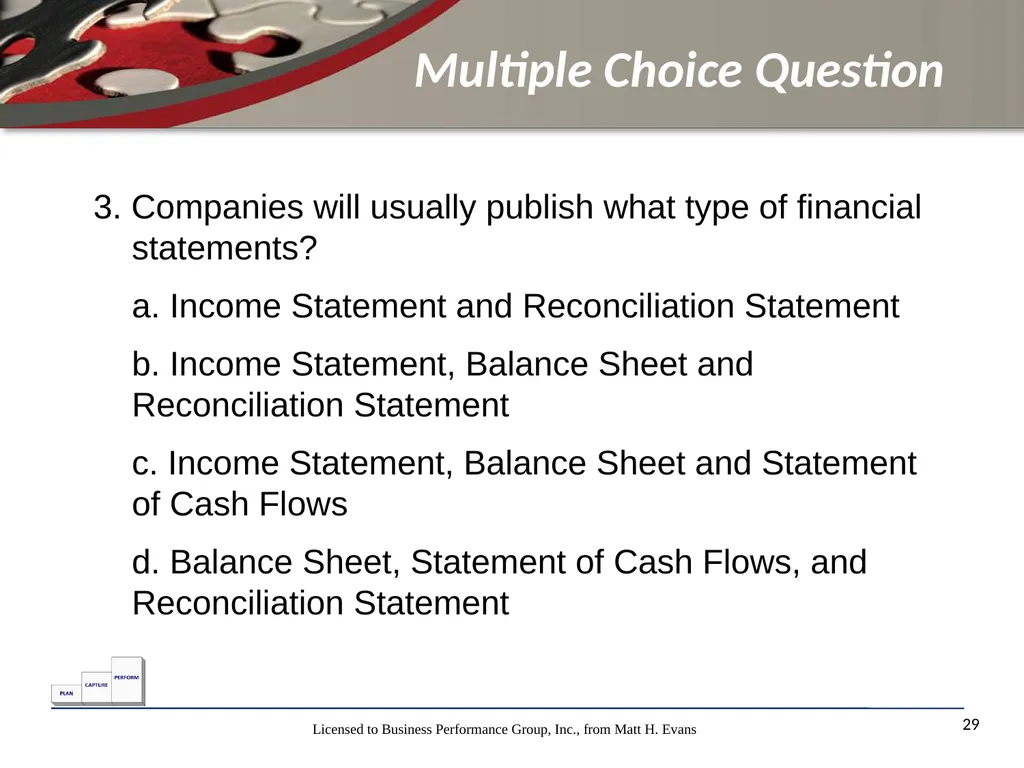
Multiple Choice Question 29 3. Companies will usually publish what type of financial statements?
a. Income Statement and Reconciliation Statement
b. Income Statement, Balance Sheet and Reconciliation Statement
c. Income Statement, Balance Sheet and Statement of Cash Flows
d. Balance Sheet, Statement of Cash Flows, and Reconciliation Statement<br>
a. Income Statement and Reconciliation Statement
b. Income Statement, Balance Sheet and Reconciliation Statement
c. Income Statement, Balance Sheet and Statement of Cash Flows
d. Balance Sheet, Statement of Cash Flows, and Reconciliation Statement<br>
30
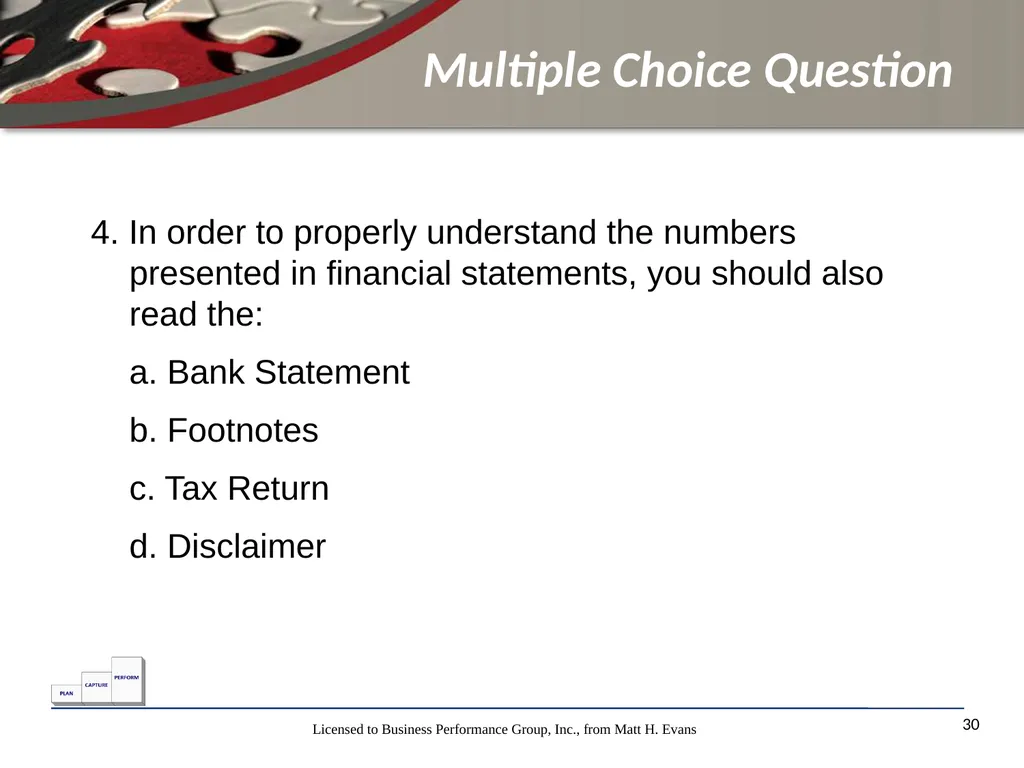
Multiple Choice Question 30 4. In order to properly understand the numbers presented in financial statements, you should also read the:
a. Bank Statement
b. Footnotes
c. Tax Return
d. Disclaimer<br>
a. Bank Statement
b. Footnotes
c. Tax Return
d. Disclaimer<br>
31
Module 3 –
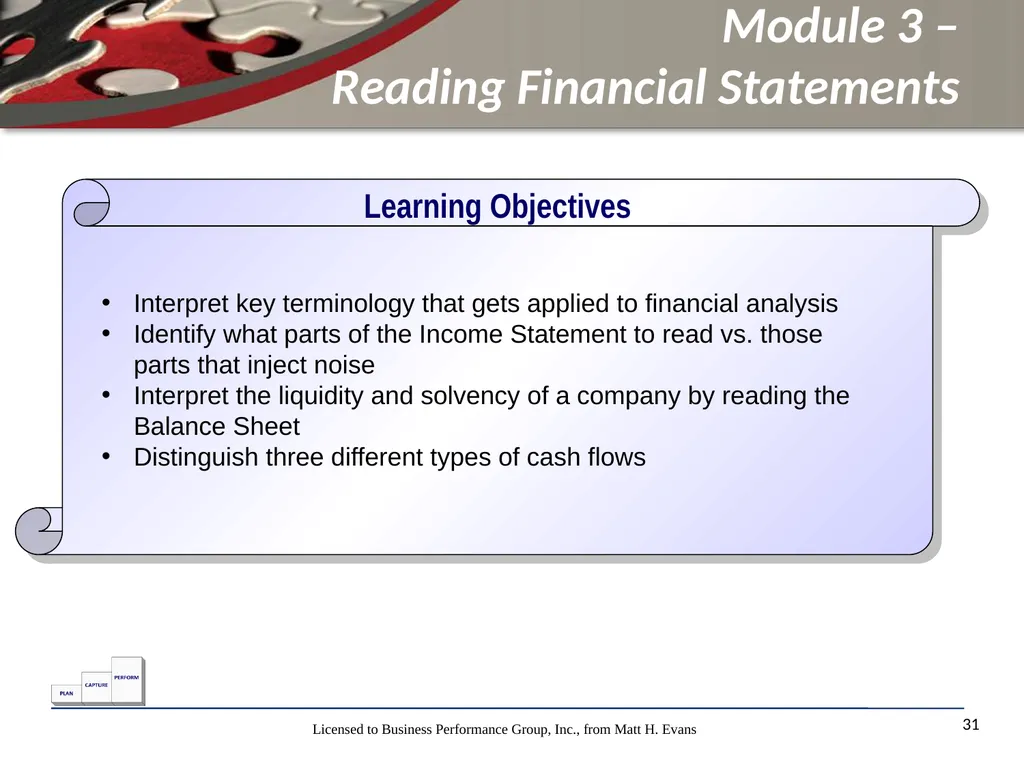
Reading Financial Statements 31 Interpret key terminology that gets applied to financial analysis
Identify what parts of the Income Statement to read vs. those parts that inject noise
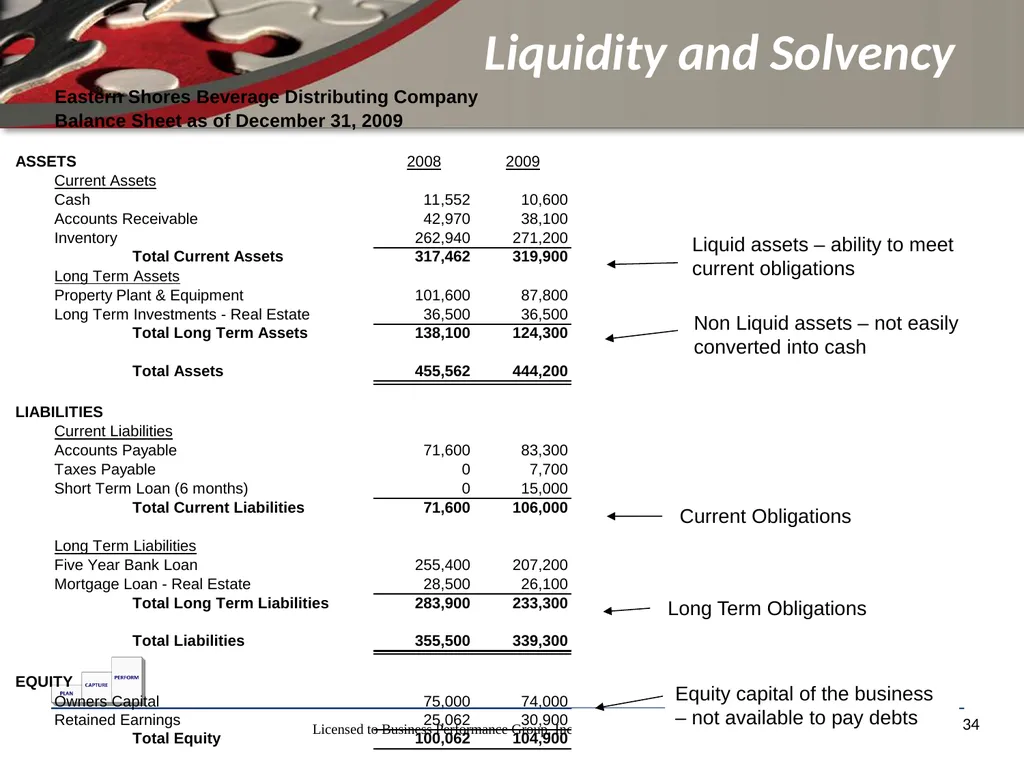
Interpret the liquidity and solvency of a company by reading the Balance Sheet
Distinguish three different types of cash flows Learning Objectives<br>
Identify what parts of the Income Statement to read vs. those parts that inject noise
Interpret the liquidity and solvency of a company by reading the Balance Sheet
Distinguish three different types of cash flows Learning Objectives<br>
32
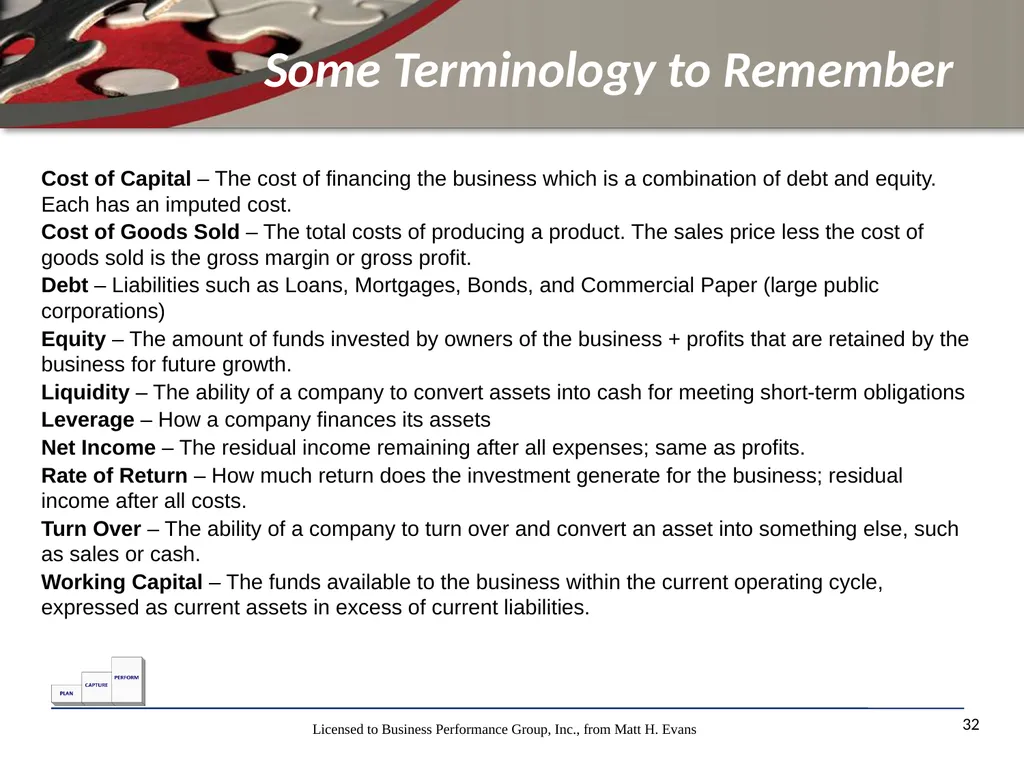
Some Terminology to Remember 32 Cost of Capital – The cost of financing the business which is a combination of debt and equity. Each has an imputed cost.
Cost of Goods Sold – The total costs of producing a product. The sales price less the cost of goods sold is the gross margin or gross profit.
Debt – Liabilities such as Loans, Mortgages, Bonds, and Commercial Paper (large public corporations)
Equity – The amount of funds invested by owners of the business + profits that are retained by the business for future growth.
Liquidity – The ability of a company to convert assets into cash for meeting short-term obligations
Leverage – How a company finances its assets
Net Income – The residual income remaining after all expenses; same as profits.
Rate of Return – How much return does the investment generate for the business; residual income after all costs.
Turn Over – The ability of a company to turn over and convert an asset into something else, such as sales or cash.
Working Capital – The funds available to the business within the current operating cycle, expressed as current assets in excess of current liabilities.<br>
Cost of Goods Sold – The total costs of producing a product. The sales price less the cost of goods sold is the gross margin or gross profit.
Debt – Liabilities such as Loans, Mortgages, Bonds, and Commercial Paper (large public corporations)
Equity – The amount of funds invested by owners of the business + profits that are retained by the business for future growth.
Liquidity – The ability of a company to convert assets into cash for meeting short-term obligations
Leverage – How a company finances its assets
Net Income – The residual income remaining after all expenses; same as profits.
Rate of Return – How much return does the investment generate for the business; residual income after all costs.
Turn Over – The ability of a company to turn over and convert an asset into something else, such as sales or cash.
Working Capital – The funds available to the business within the current operating cycle, expressed as current assets in excess of current liabilities.<br>
33
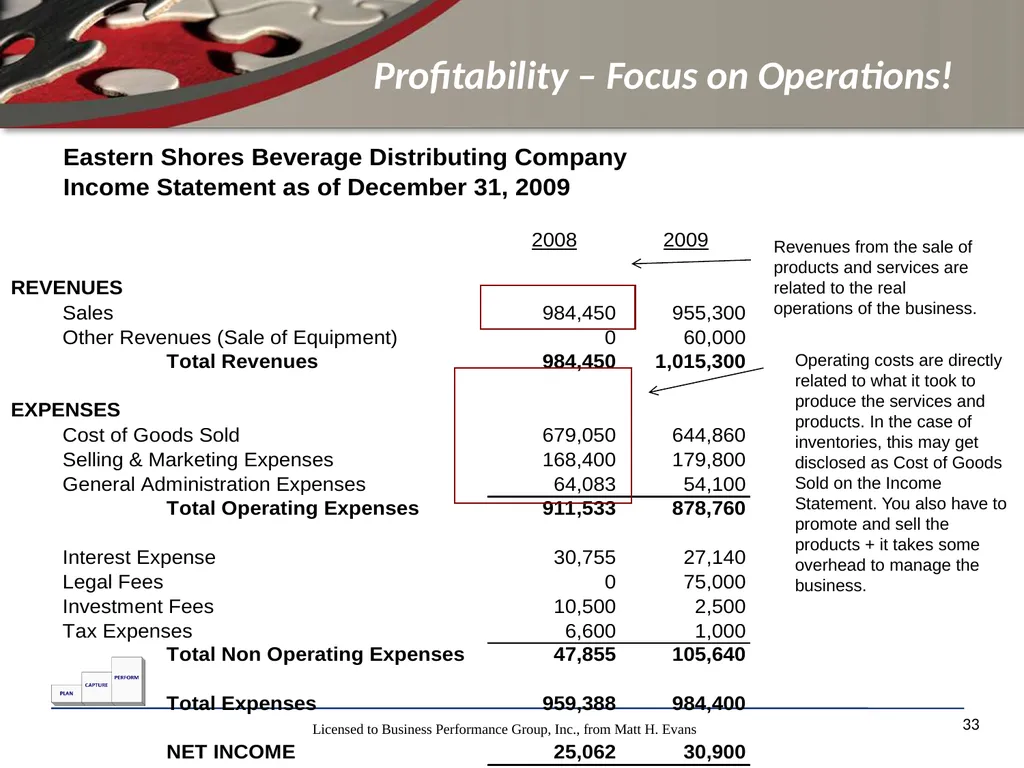
Profitability – Focus on Operations! 33 Revenues from the sale of products and services are related to the real operations of the business. Operating costs are directly related to what it took to produce the services and products. In the case of inventories, this may get disclosed as Cost of Goods Sold on the Income Statement. You also have to promote and sell the products + it takes some overhead to manage the business.<br>
34
Liquidity and Solvency 34<br>
35
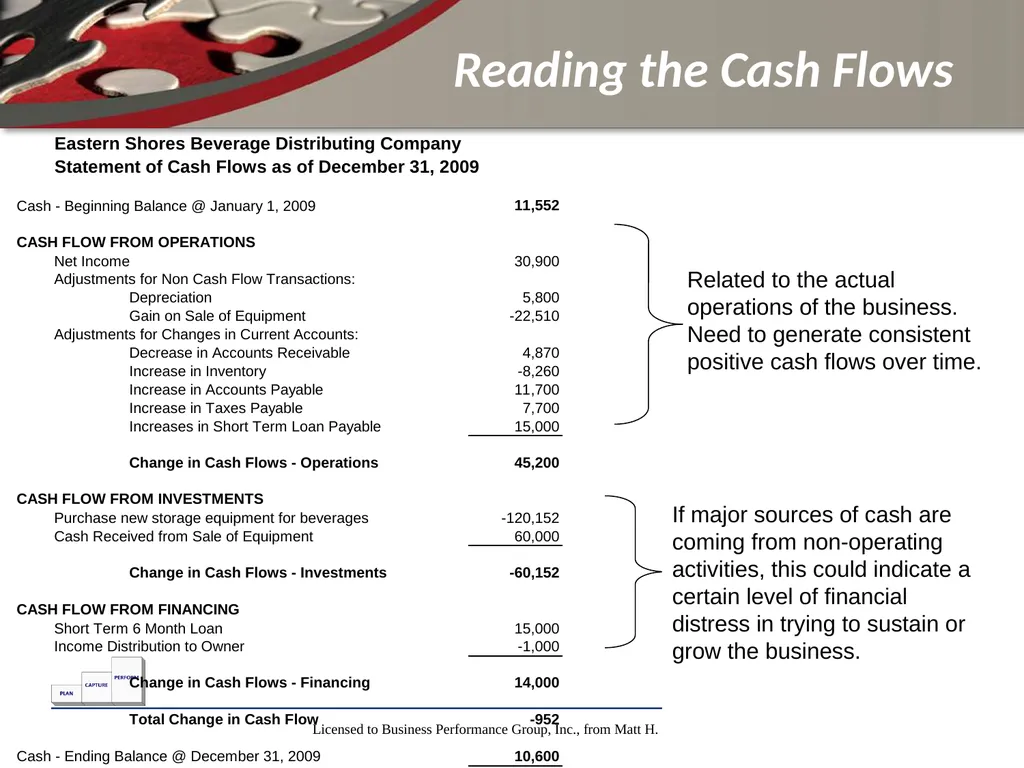
Reading the Cash Flows 35 Related to the actual operations of the business. Need to generate consistent positive cash flows over time. If major sources of cash are coming from non-operating activities, this could indicate a certain level of financial distress in trying to sustain or grow the business.<br>
36
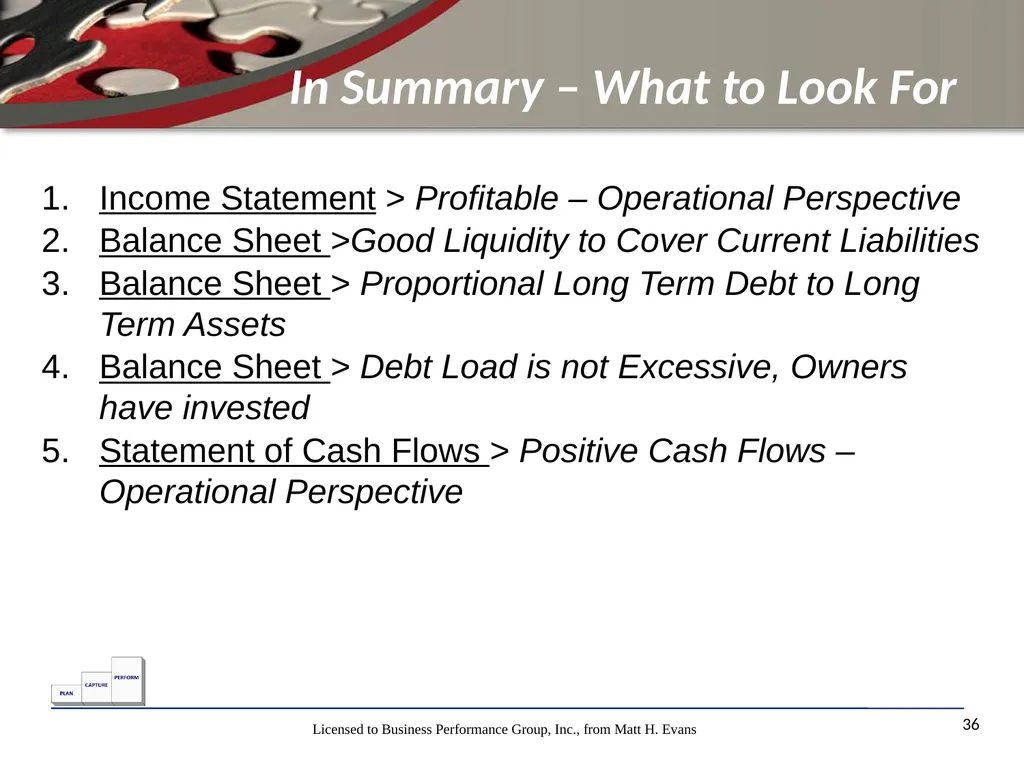
In Summary – What to Look For 36 Income Statement > Profitable – Operational Perspective
Balance Sheet >Good Liquidity to Cover Current Liabilities
Balance Sheet > Proportional Long Term Debt to Long Term Assets
Balance Sheet > Debt Load is not Excessive, Owners have invested
Statement of Cash Flows > Positive Cash Flows – Operational Perspective<br>
Balance Sheet >Good Liquidity to Cover Current Liabilities
Balance Sheet > Proportional Long Term Debt to Long Term Assets
Balance Sheet > Debt Load is not Excessive, Owners have invested
Statement of Cash Flows > Positive Cash Flows – Operational Perspective<br>
37
Multiple Choice Question No. 5 37 5. Which financial statement is useful in understanding the liquidity of a company?
a. Income Statement
b. Balance Sheet
c. Bank Statement
d. Reconciliation Statement<br>
a. Income Statement
b. Balance Sheet
c. Bank Statement
d. Reconciliation Statement<br>
38
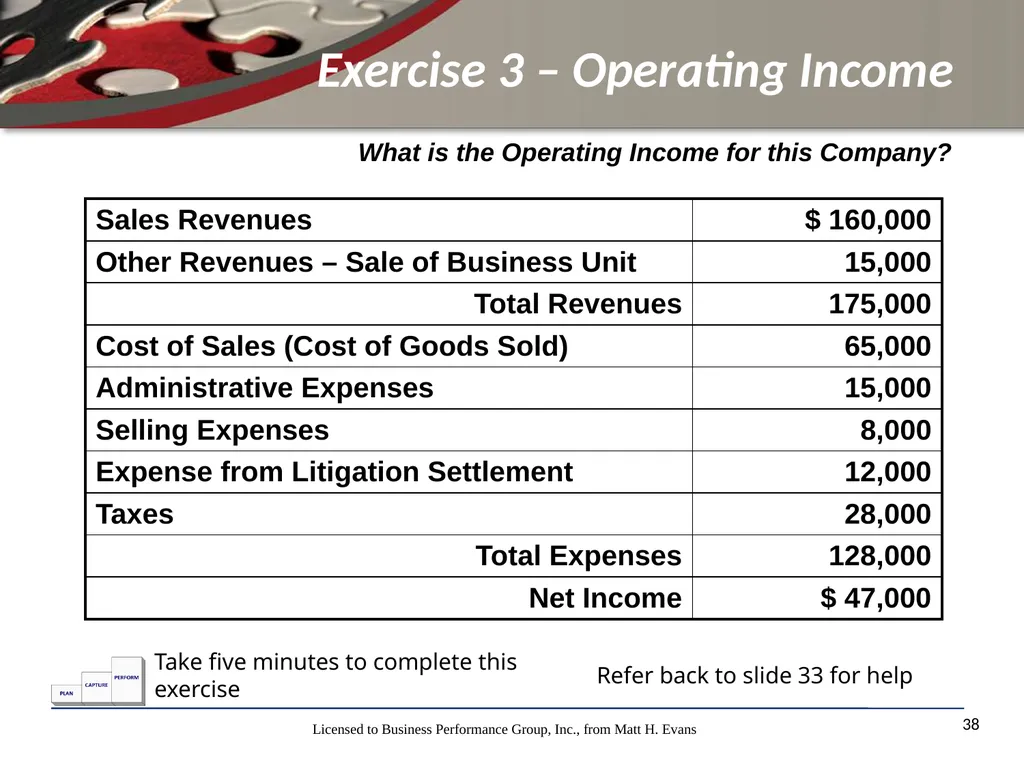
Exercise 3 – Operating Income 38 What is the Operating Income for this Company? Take five minutes to complete this exercise Refer back to slide 33 for help<br>
39
Module 4 –
Horizontal and Vertical Analysis 39 Interpret trends by applying horizontal analysis to comparative financial statements
Identify key financial relationships by applying vertical analysis to financial statements
Apply horizontal analysis to historical costs to arrive at Estimates to Complete for projects Learning Objectives<br>
Identify key financial relationships by applying vertical analysis to financial statements
Apply horizontal analysis to historical costs to arrive at Estimates to Complete for projects Learning Objectives<br>
40
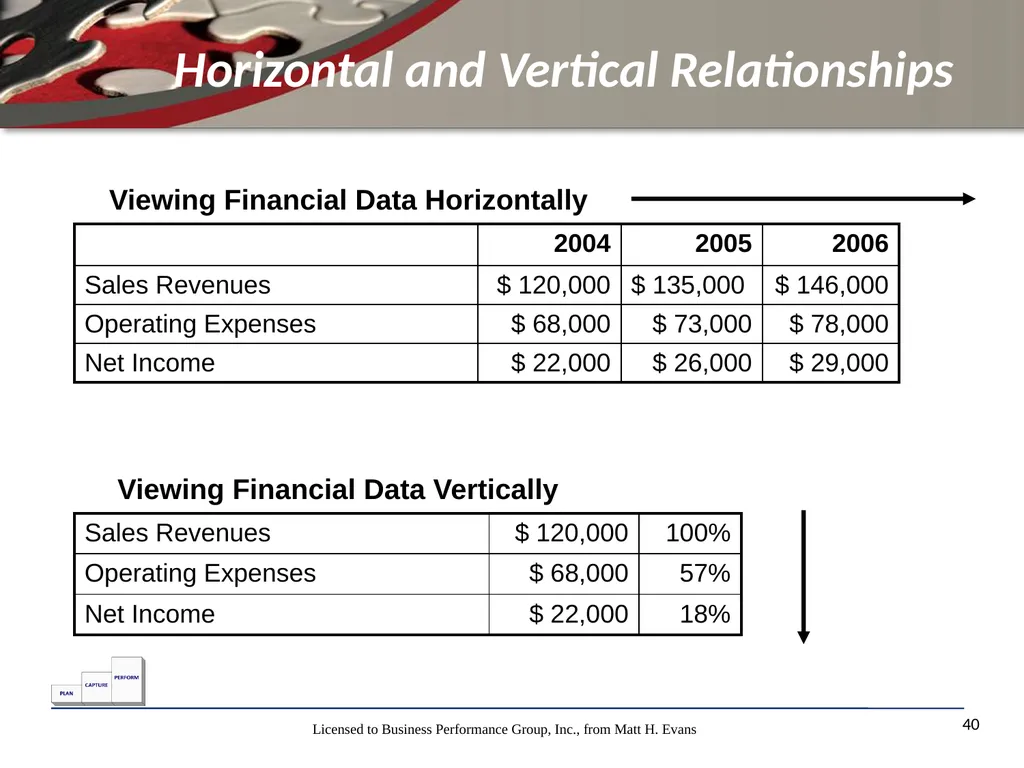
Horizontal and Vertical Relationships 40 Viewing Financial Data Horizontally Viewing Financial Data Vertically<br>
41
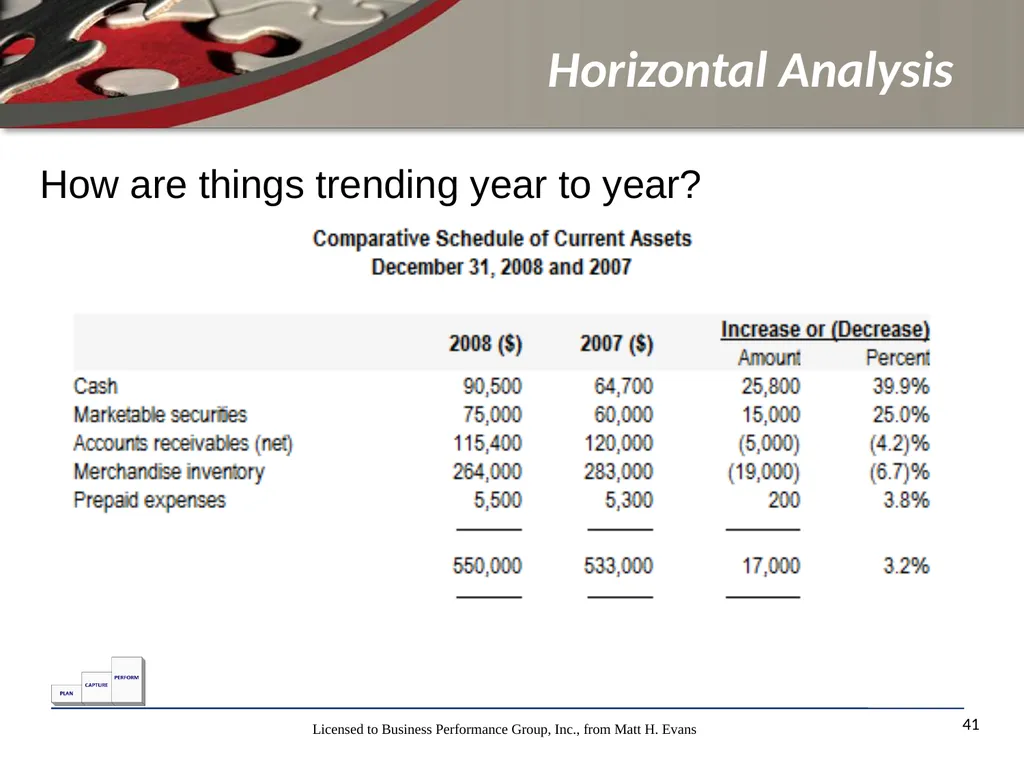
Horizontal Analysis 41 How are things trending year to year?<br>
42
Two Key Trends
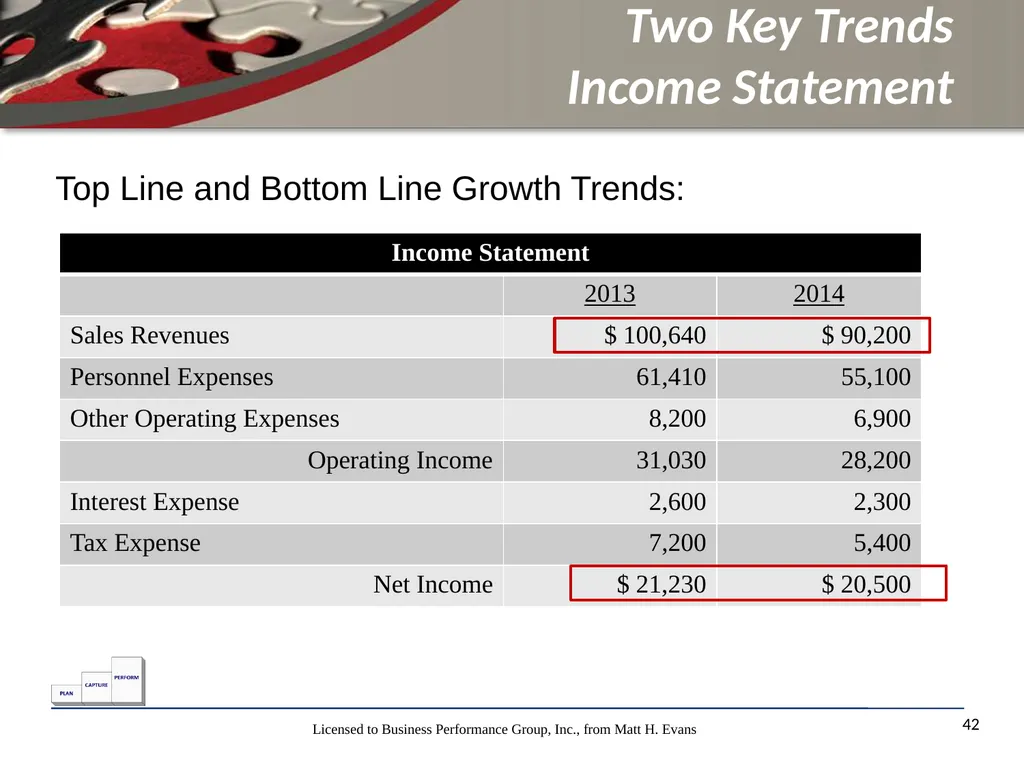
Income Statement 42 Top Line and Bottom Line Growth Trends:<br>
43
Horizontal Analysis - Projects
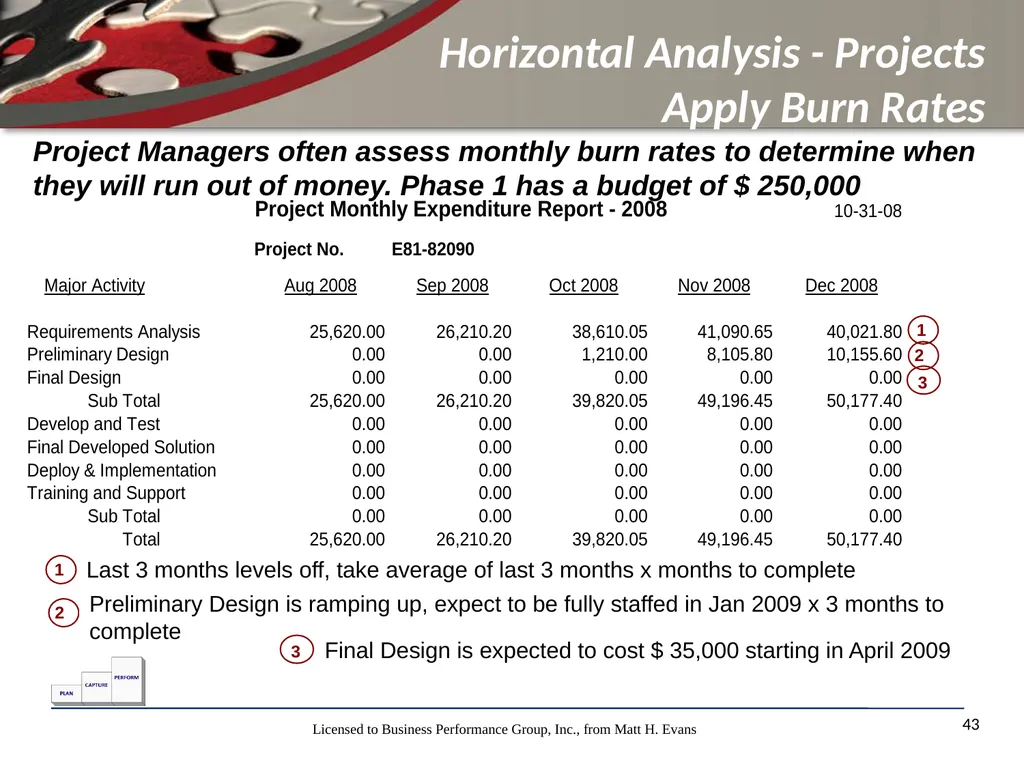
Apply Burn Rates 43 Project Managers often assess monthly burn rates to determine when they will run out of money. Phase 1 has a budget of $ 250,000 Last 3 months levels off, take average of last 3 months x months to complete Preliminary Design is ramping up, expect to be fully staffed in Jan 2009 x 3 months to complete Final Design is expected to cost $ 35,000 starting in April 2009<br>
44
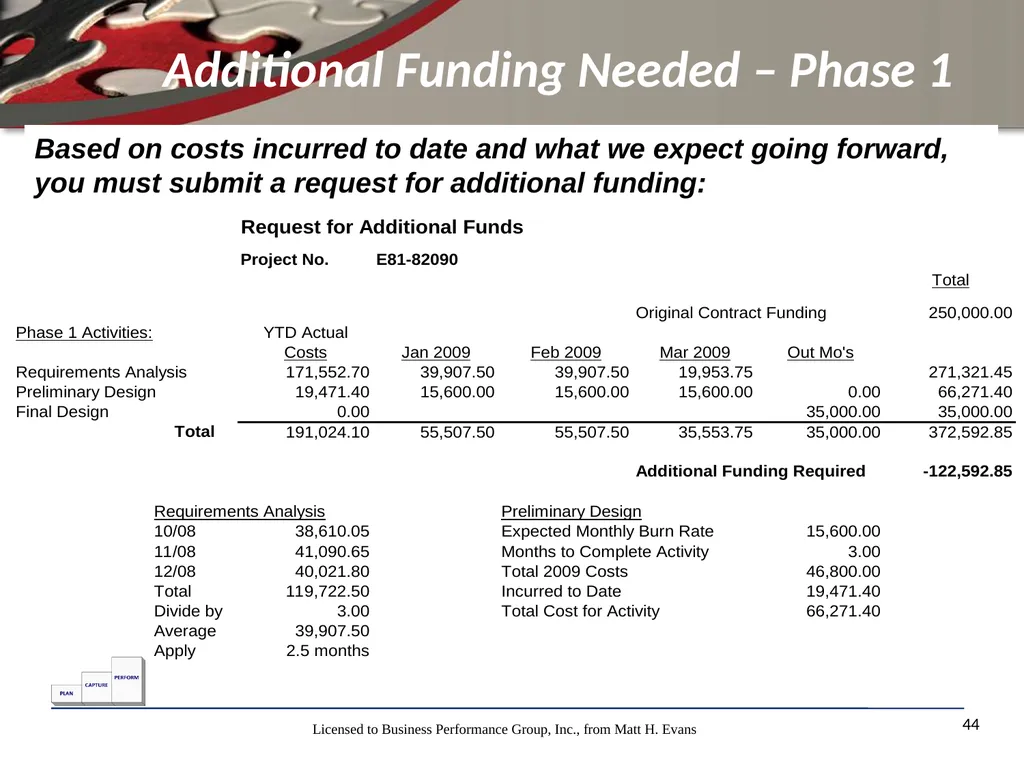
Additional Funding Needed – Phase 1 44 Based on costs incurred to date and what we expect going forward, you must submit a request for additional funding:<br>
45
Vertical Analysis Express financial statements as percentages – Common Size
Compare the Common Size Statements from period to period and against industry benchmarks
Easy to ascertain financial strength’s and weaknesses
Easy to discern overall cost structure
Certain Ratios are automatically calculated such as Return on Sales 45<br>
Compare the Common Size Statements from period to period and against industry benchmarks
Easy to ascertain financial strength’s and weaknesses
Easy to discern overall cost structure
Certain Ratios are automatically calculated such as Return on Sales 45<br>
46
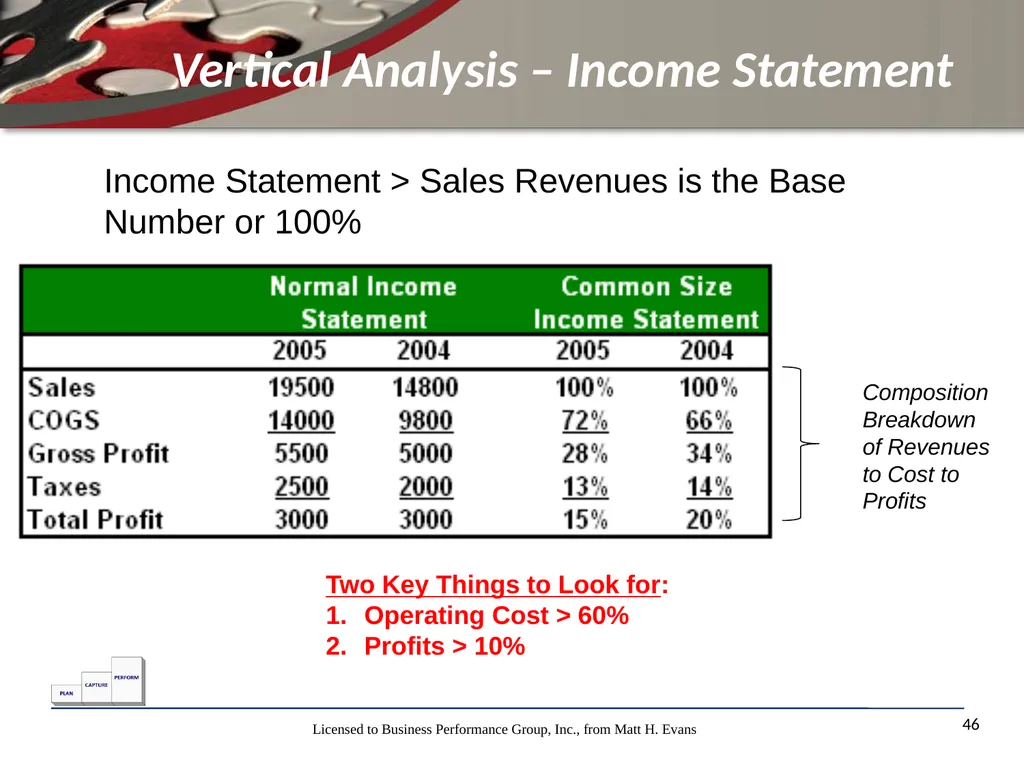
Vertical Analysis – Income Statement 46 Income Statement > Sales Revenues is the Base Number or 100% Composition Breakdown of Revenues to Cost to Profits Two Key Things to Look for:
Operating Cost > 60%
Profits > 10%<br>
Operating Cost > 60%
Profits > 10%<br>
47
Vertical Analysis –
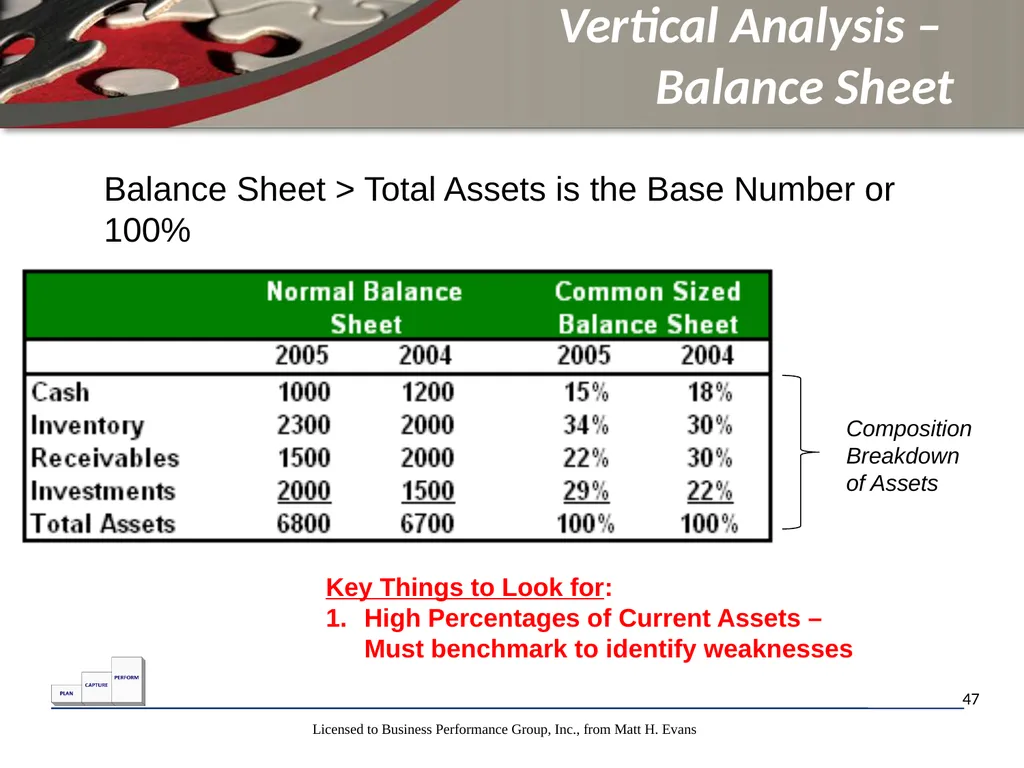
Balance Sheet 47 Balance Sheet > Total Assets is the Base Number or 100% Composition Breakdown of Assets Key Things to Look for:
High Percentages of Current Assets – Must benchmark to identify weaknesses<br>
High Percentages of Current Assets – Must benchmark to identify weaknesses<br>
48
In Summary –
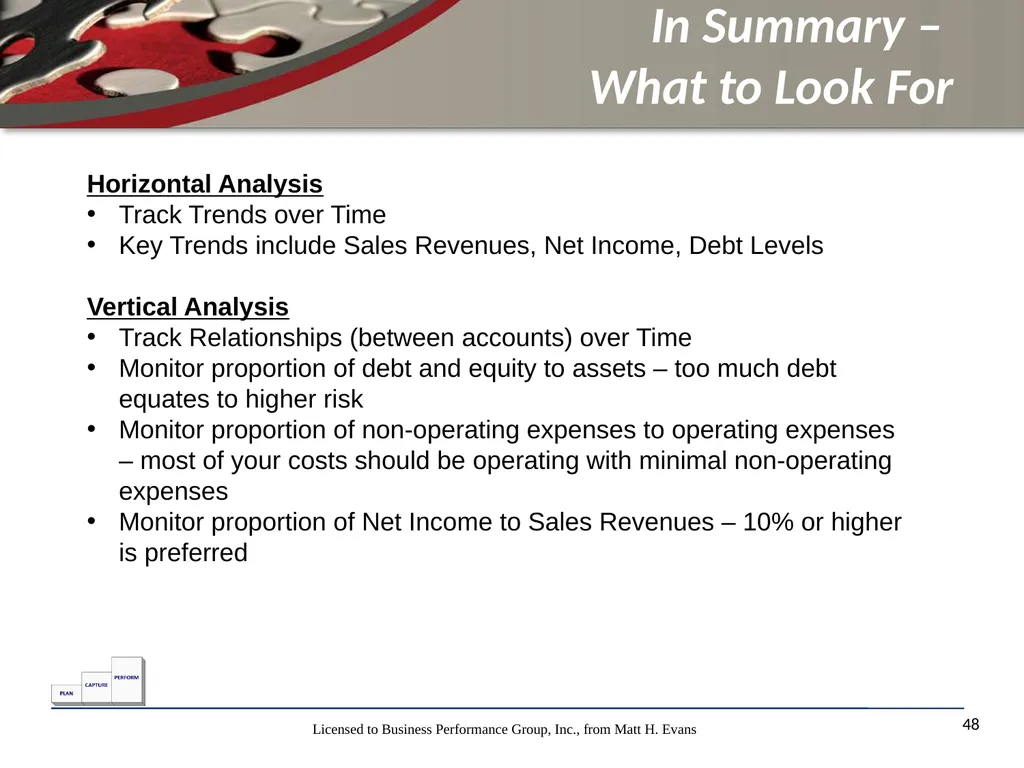
What to Look For 48 Horizontal Analysis
Track Trends over Time
Key Trends include Sales Revenues, Net Income, Debt Levels
Vertical Analysis
Track Relationships (between accounts) over Time
Monitor proportion of debt and equity to assets – too much debt equates to higher risk
Monitor proportion of non-operating expenses to operating expenses – most of your costs should be operating with minimal non-operating expenses
Monitor proportion of Net Income to Sales Revenues – 10% or higher is preferred<br>
Track Trends over Time
Key Trends include Sales Revenues, Net Income, Debt Levels
Vertical Analysis
Track Relationships (between accounts) over Time
Monitor proportion of debt and equity to assets – too much debt equates to higher risk
Monitor proportion of non-operating expenses to operating expenses – most of your costs should be operating with minimal non-operating expenses
Monitor proportion of Net Income to Sales Revenues – 10% or higher is preferred<br>
49
Include Benchmarking
Enhances Your Analysis Financial benchmarks are available from service bureaus (visit your public library)
Financial benchmarks can help determine costs (such as supply chains)
Averages are OK, but try to seek out “Best in Class”
Identify gaps in performance and set goals to improve 49<br>
Financial benchmarks can help determine costs (such as supply chains)
Averages are OK, but try to seek out “Best in Class”
Identify gaps in performance and set goals to improve 49<br>
50
Exercise 4
Vertical Analysis and Benchmarking 50 Refer to the financial statements for Jacobs Engineering and the Vertical Analysis Template:
Calculate the percentages for Jacobs Engineering per the boxes in the template.
Refer to the benchmark information in your handout. We will use RMA percentages that size to Jacobs Engineering. Insert the percentages based on assets and based on sales.
Compare the calculated percentages for Jacobs Engineering to the RMA benchmarks – how does Jacobs compare? Take ten minutes to complete this exercise<br>
Calculate the percentages for Jacobs Engineering per the boxes in the template.
Refer to the benchmark information in your handout. We will use RMA percentages that size to Jacobs Engineering. Insert the percentages based on assets and based on sales.
Compare the calculated percentages for Jacobs Engineering to the RMA benchmarks – how does Jacobs compare? Take ten minutes to complete this exercise<br>
51
Module 5 – Ratio Analysis 51 Calculate ratios to assess the liquidity of a company
Interpret a company’s ability to meet short term obligations
Calculate ratios to assess the use of leverage (debt and equity) by a company
Interpret the risk of a company per leverage ratios
Calculate ratios to assess how effective a company is with managing its assets
Calculate ratios to assess profitability Learning Objectives<br>
Interpret a company’s ability to meet short term obligations
Calculate ratios to assess the use of leverage (debt and equity) by a company
Interpret the risk of a company per leverage ratios
Calculate ratios to assess how effective a company is with managing its assets
Calculate ratios to assess profitability Learning Objectives<br>
52
Why Ratios? 52 Wide range of ratios to evaluate almost anything
Easier to comprehend financial results vs. financial statements
Easy to understand and calculate
Comparable by periods, companies, and useful for forecasting
Published benchmarks are available for industry analysis Numerator / Denominator = Ratio
Net Income / Sales = Return on Sales Ratio<br>
Easier to comprehend financial results vs. financial statements
Easy to understand and calculate
Comparable by periods, companies, and useful for forecasting
Published benchmarks are available for industry analysis Numerator / Denominator = Ratio
Net Income / Sales = Return on Sales Ratio<br>
53
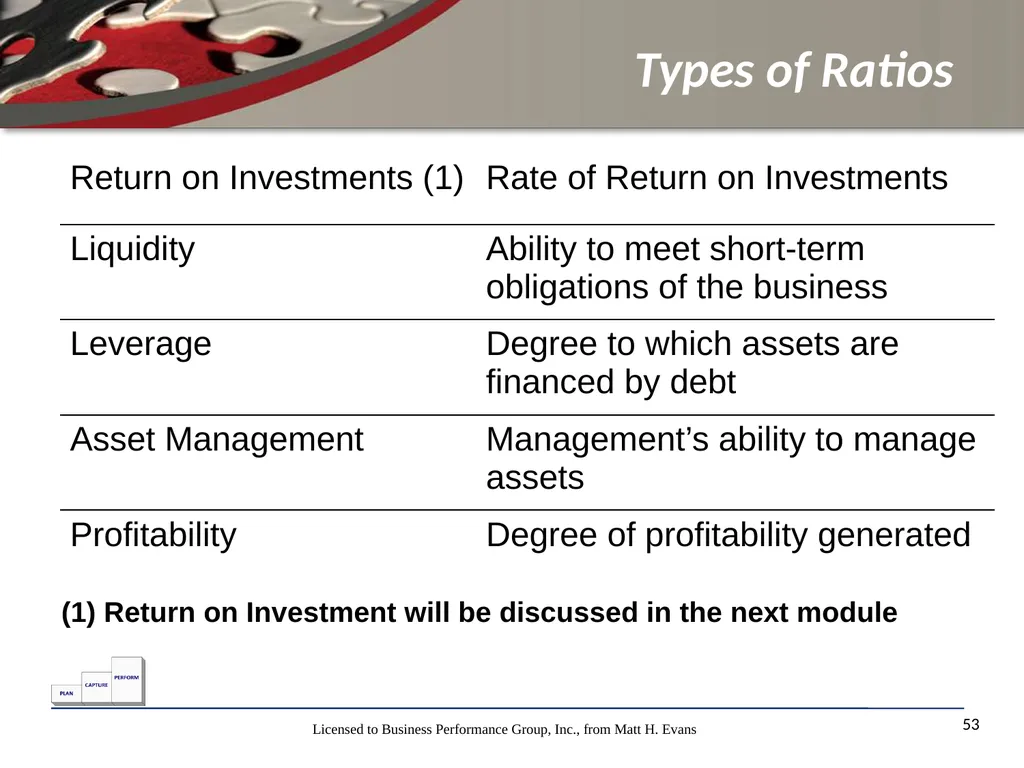
Types of Ratios 53 (1) Return on Investment will be discussed in the next module<br>
54
Key Questions –
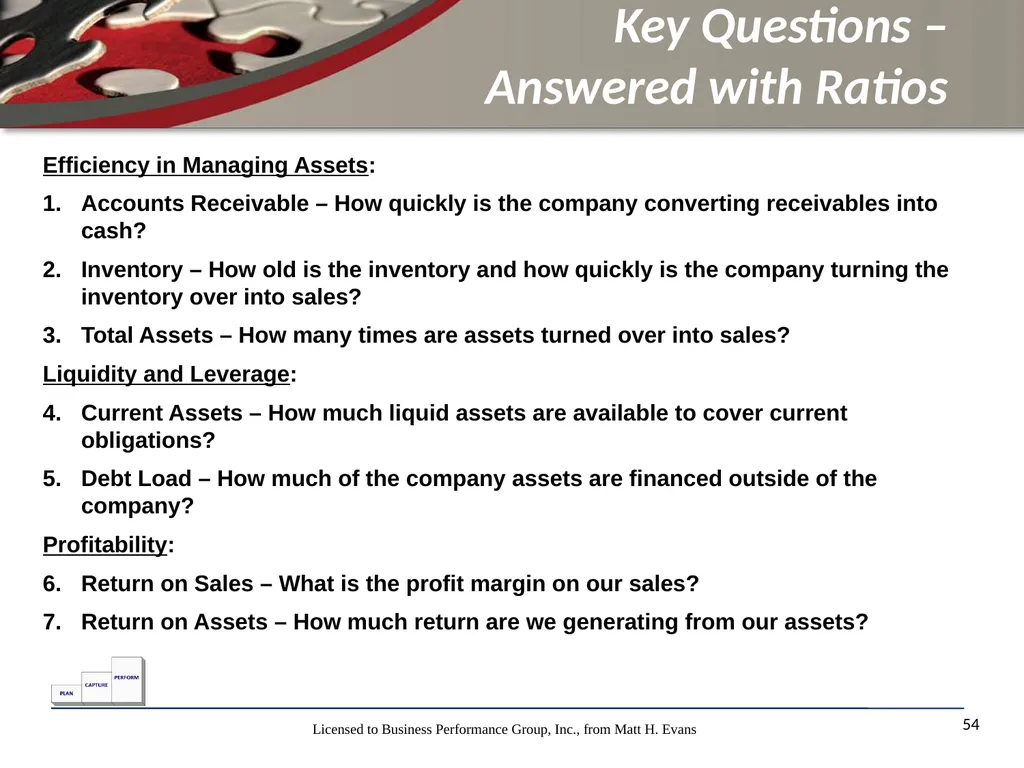
Answered with Ratios 54 Efficiency in Managing Assets:
Accounts Receivable – How quickly is the company converting receivables into cash?
Inventory – How old is the inventory and how quickly is the company turning the inventory over into sales?
Total Assets – How many times are assets turned over into sales?
Liquidity and Leverage:
Current Assets – How much liquid assets are available to cover current obligations?
Debt Load – How much of the company assets are financed outside of the company?
Profitability:
Return on Sales – What is the profit margin on our sales?
Return on Assets – How much return are we generating from our assets?<br>
Accounts Receivable – How quickly is the company converting receivables into cash?
Inventory – How old is the inventory and how quickly is the company turning the inventory over into sales?
Total Assets – How many times are assets turned over into sales?
Liquidity and Leverage:
Current Assets – How much liquid assets are available to cover current obligations?
Debt Load – How much of the company assets are financed outside of the company?
Profitability:
Return on Sales – What is the profit margin on our sales?
Return on Assets – How much return are we generating from our assets?<br>
55
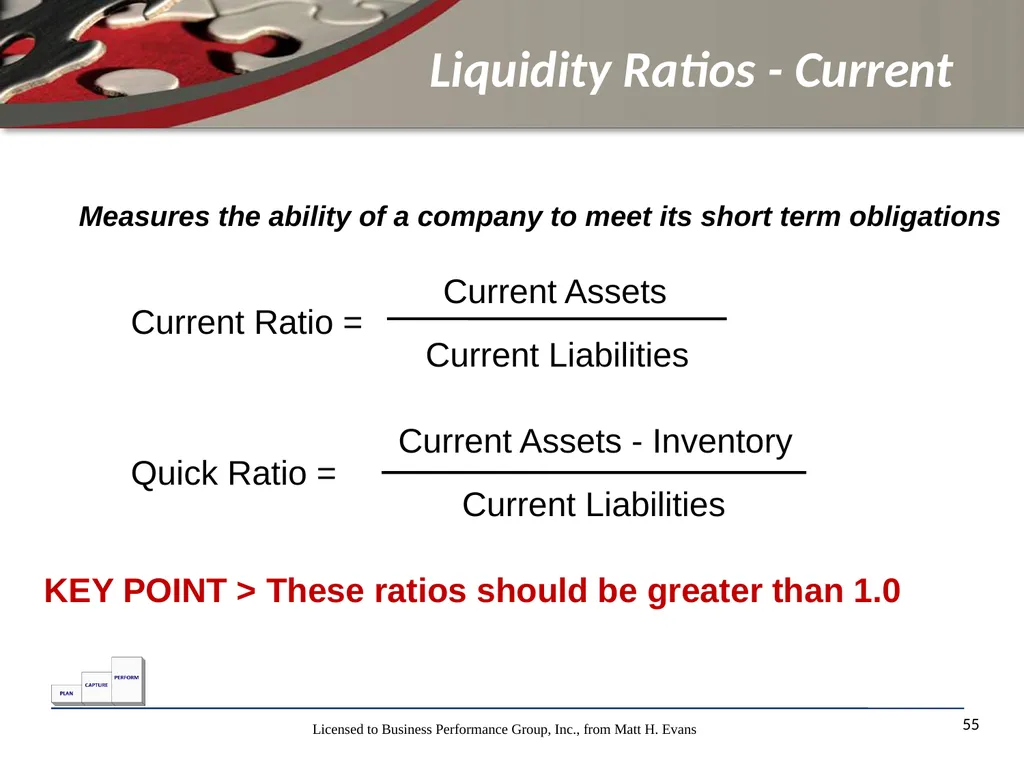
Liquidity Ratios - Current 55 Measures the ability of a company to meet its short term obligations Current Ratio = Quick Ratio = Current Assets Current Liabilities Current Assets - Inventory Current Liabilities KEY POINT > These ratios should be greater than 1.0<br>
56
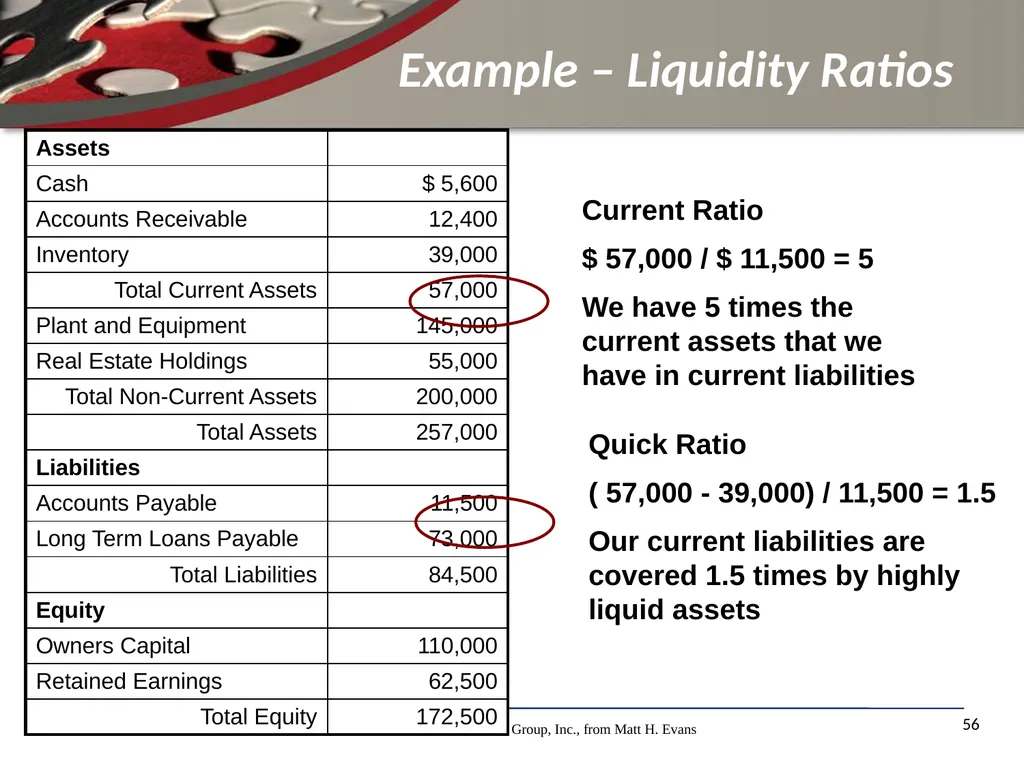
Example – Liquidity Ratios 56 Current Ratio
$ 57,000 / $ 11,500 = 5
We have 5 times the current assets that we have in current liabilities Quick Ratio
( 57,000 - 39,000) / 11,500 = 1.5
Our current liabilities are covered 1.5 times by highly liquid assets<br>
$ 57,000 / $ 11,500 = 5
We have 5 times the current assets that we have in current liabilities Quick Ratio
( 57,000 - 39,000) / 11,500 = 1.5
Our current liabilities are covered 1.5 times by highly liquid assets<br>
57
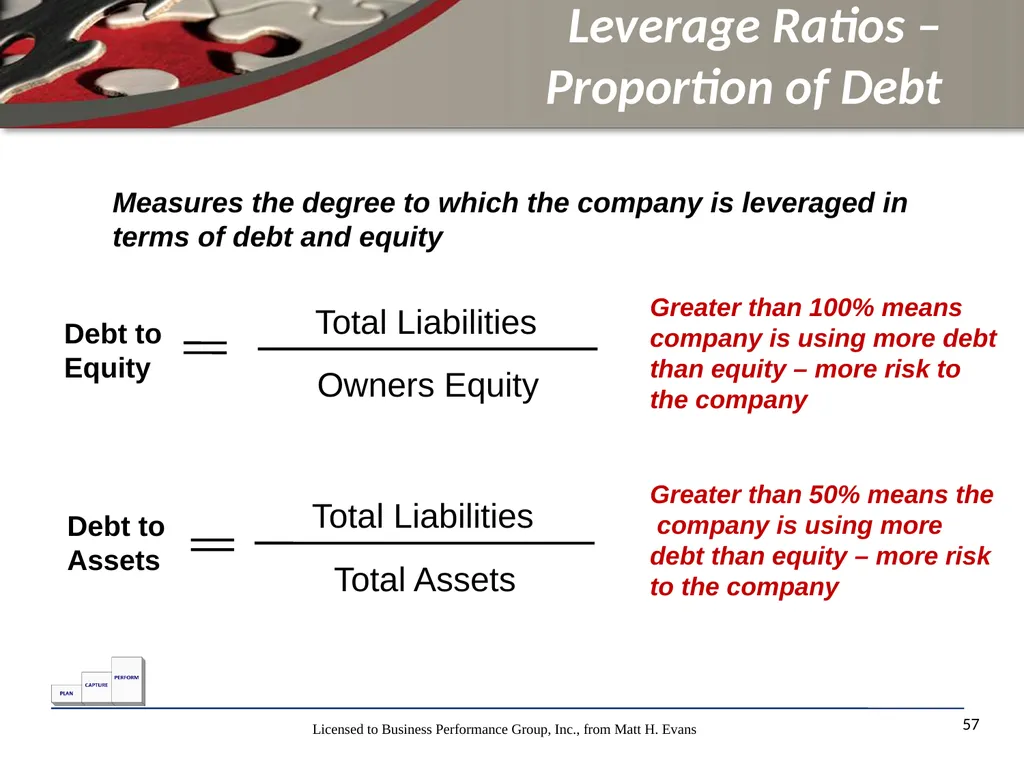
Leverage Ratios –
Proportion of Debt 57 Measures the degree to which the company is leveraged in terms of debt and equity Debt to Equity Debt to Assets Total Liabilities Owners Equity Total Liabilities Total Assets Greater than 100% means company is using more debt than equity – more risk to the company Greater than 50% means the company is using more debt than equity – more risk to the company<br>
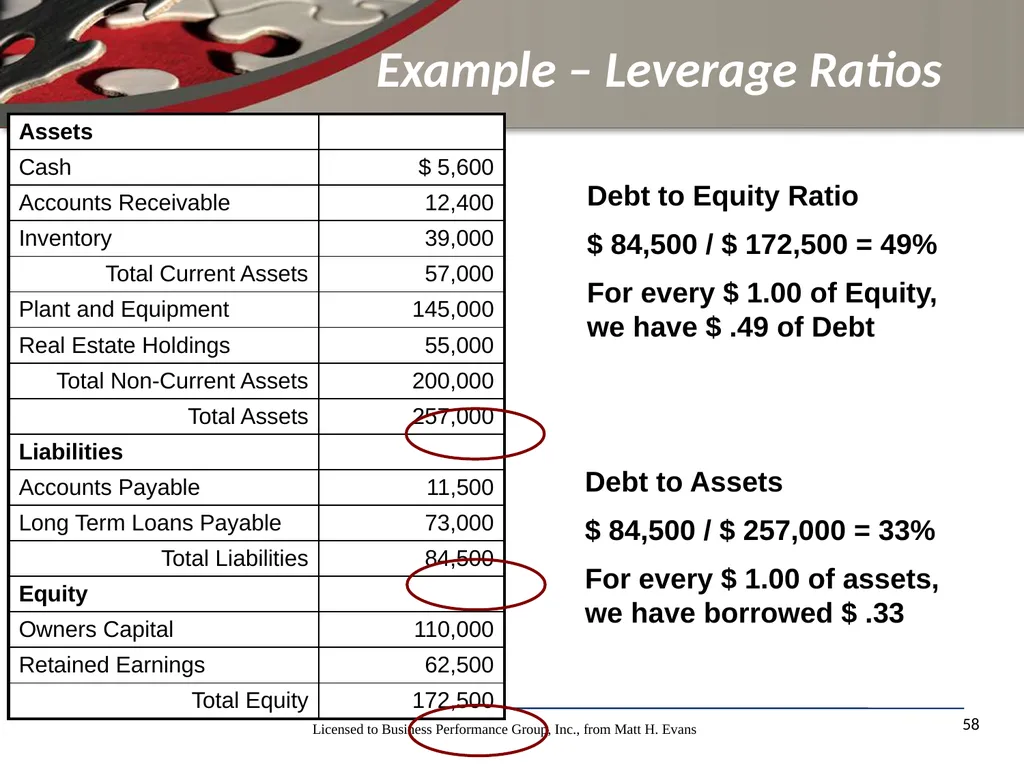
58
Example – Leverage Ratios 58 Debt to Equity Ratio
$ 84,500 / $ 172,500 = 49%
For every $ 1.00 of Equity, we have $ .49 of Debt Debt to Assets
$ 84,500 / $ 257,000 = 33%
For every $ 1.00 of assets, we have borrowed $ .33<br>
$ 84,500 / $ 172,500 = 49%
For every $ 1.00 of Equity, we have $ .49 of Debt Debt to Assets
$ 84,500 / $ 257,000 = 33%
For every $ 1.00 of assets, we have borrowed $ .33<br>
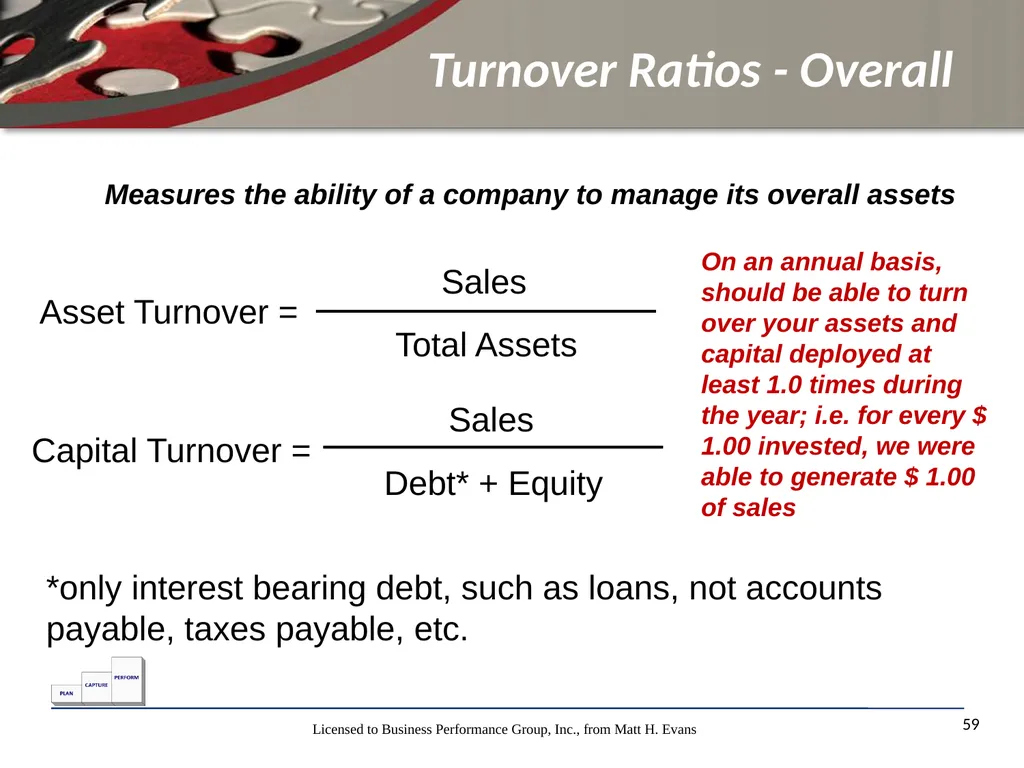
59
Turnover Ratios - Overall 59 Measures the ability of a company to manage its overall assets Asset Turnover = Sales Total Assets Capital Turnover = Sales Debt* + Equity *only interest bearing debt, such as loans, not accounts payable, taxes payable, etc. On an annual basis, should be able to turn over your assets and capital deployed at least 1.0 times during the year; i.e. for every $ 1.00 invested, we were able to generate $ 1.00 of sales<br>
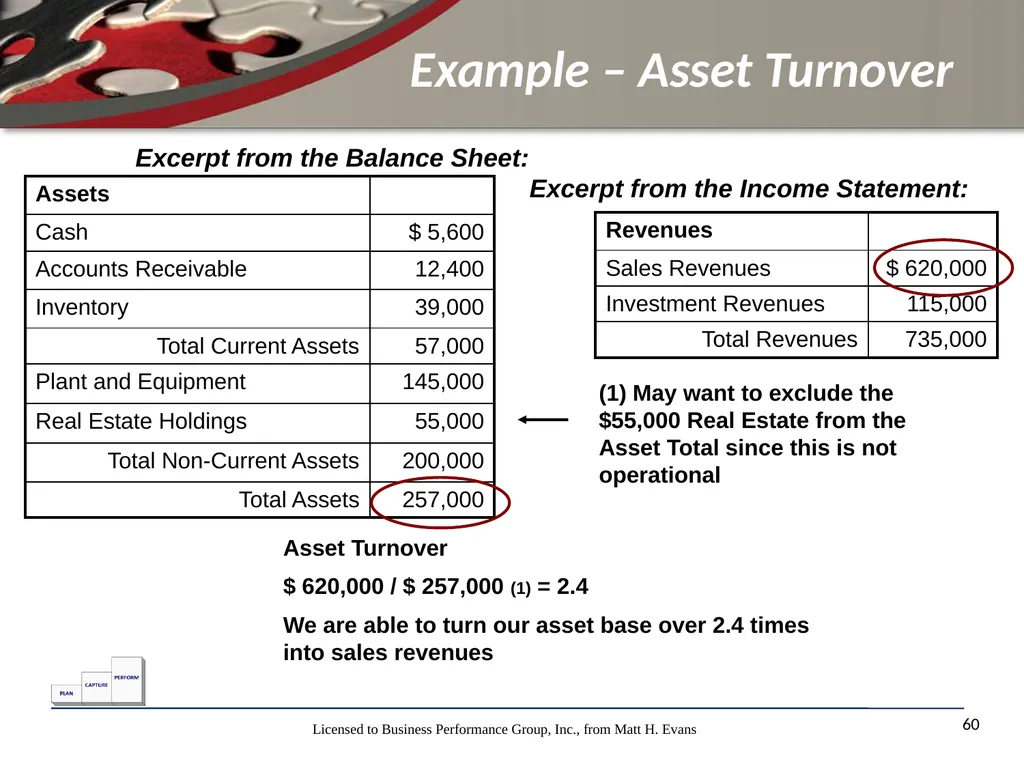
60
Example – Asset Turnover 60 Excerpt from the Balance Sheet: Excerpt from the Income Statement: Asset Turnover
$ 620,000 / $ 257,000 (1) = 2.4
We are able to turn our asset base over 2.4 times into sales revenues (1) May want to exclude the $55,000 Real Estate from the Asset Total since this is not operational<br>
$ 620,000 / $ 257,000 (1) = 2.4
We are able to turn our asset base over 2.4 times into sales revenues (1) May want to exclude the $55,000 Real Estate from the Asset Total since this is not operational<br>
61
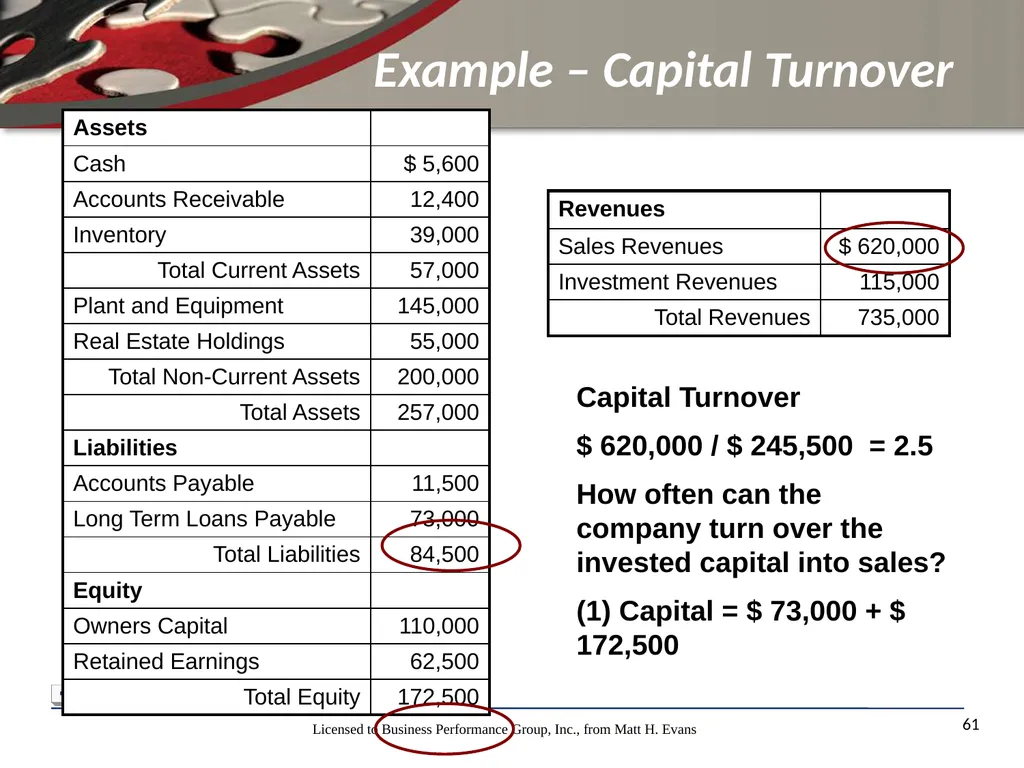
Example – Capital Turnover 61 Capital Turnover
$ 620,000 / $ 245,500 = 2.5
How often can the company turn over the invested capital into sales?
(1) Capital = $ 73,000 + $ 172,500<br>
$ 620,000 / $ 245,500 = 2.5
How often can the company turn over the invested capital into sales?
(1) Capital = $ 73,000 + $ 172,500<br>
62
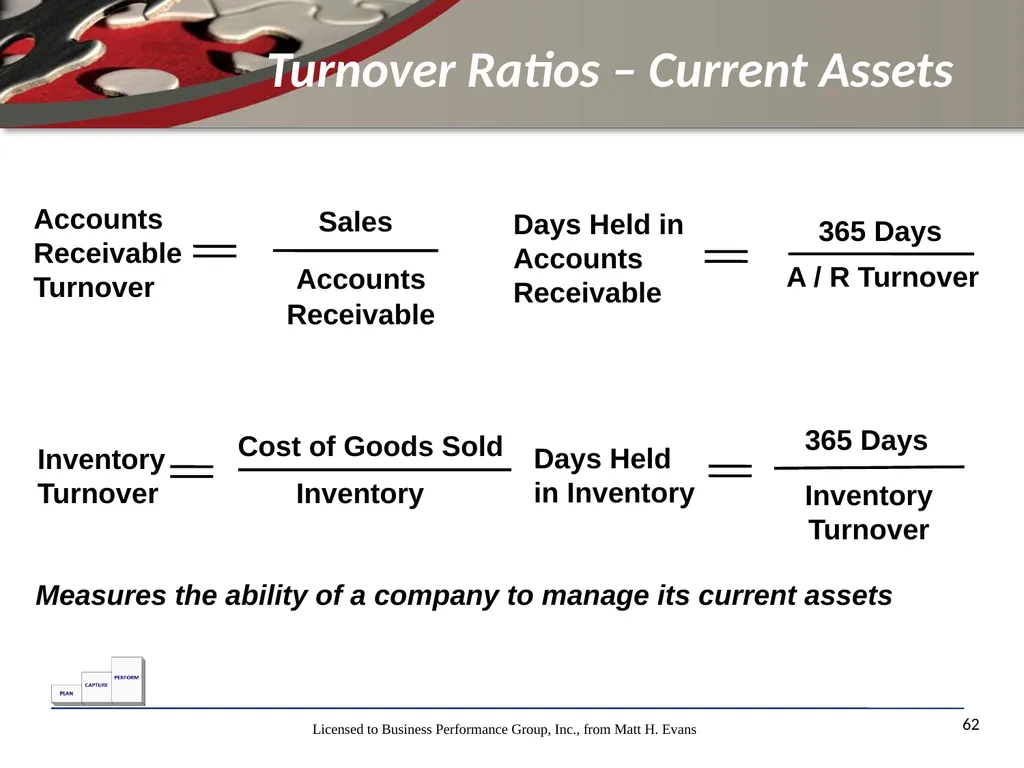
Turnover Ratios – Current Assets 62 Measures the ability of a company to manage its current assets Accounts Receivable Turnover Sales Accounts
Receivable Days Held in Accounts Receivable A / R Turnover 365 Days Inventory Turnover Cost of Goods Sold Inventory Days Held in Inventory 365 Days Inventory Turnover<br>
Receivable Days Held in Accounts Receivable A / R Turnover 365 Days Inventory Turnover Cost of Goods Sold Inventory Days Held in Inventory 365 Days Inventory Turnover<br>
63
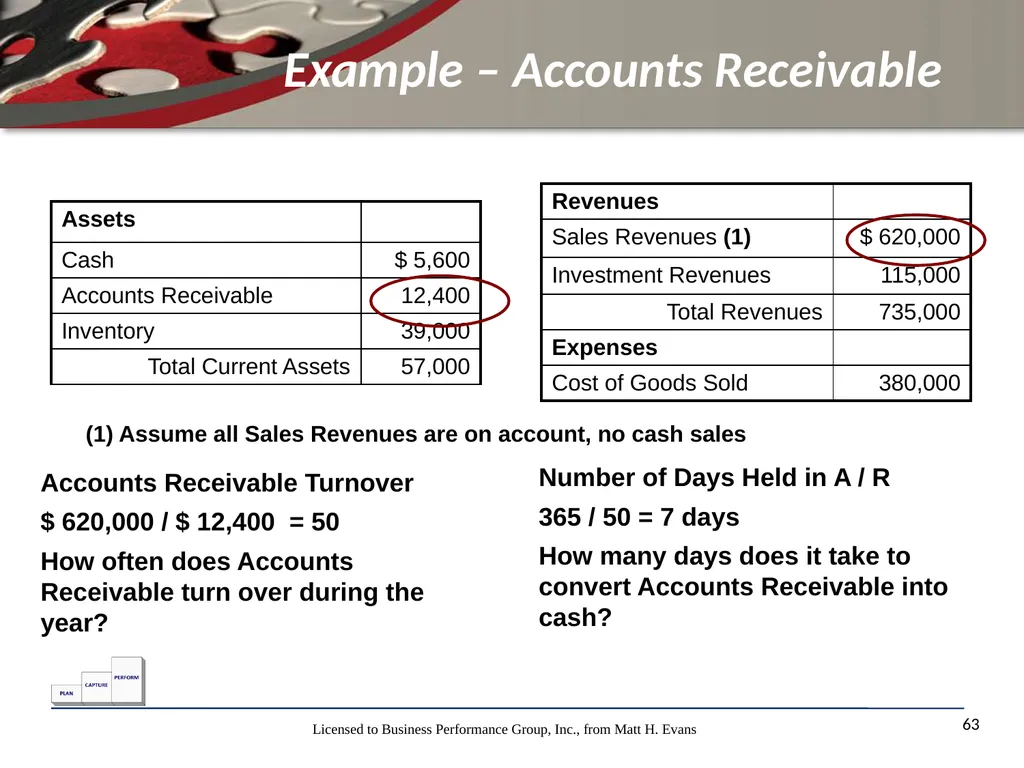
Example – Accounts Receivable 63 Accounts Receivable Turnover
$ 620,000 / $ 12,400 = 50
How often does Accounts Receivable turn over during the year? Number of Days Held in A / R
365 / 50 = 7 days
How many days does it take to convert Accounts Receivable into cash? (1) Assume all Sales Revenues are on account, no cash sales<br>
$ 620,000 / $ 12,400 = 50
How often does Accounts Receivable turn over during the year? Number of Days Held in A / R
365 / 50 = 7 days
How many days does it take to convert Accounts Receivable into cash? (1) Assume all Sales Revenues are on account, no cash sales<br>
64
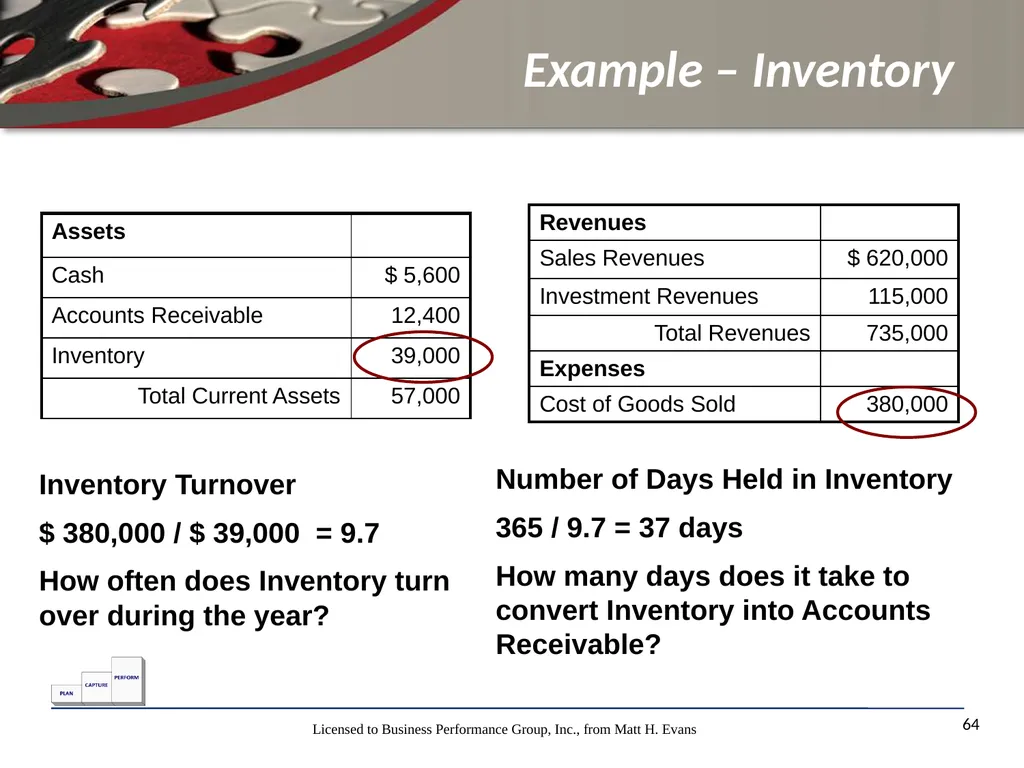
Example – Inventory 64 Inventory Turnover
$ 380,000 / $ 39,000 = 9.7
How often does Inventory turn over during the year? Number of Days Held in Inventory
365 / 9.7 = 37 days
How many days does it take to convert Inventory into Accounts Receivable?<br>
$ 380,000 / $ 39,000 = 9.7
How often does Inventory turn over during the year? Number of Days Held in Inventory
365 / 9.7 = 37 days
How many days does it take to convert Inventory into Accounts Receivable?<br>
65
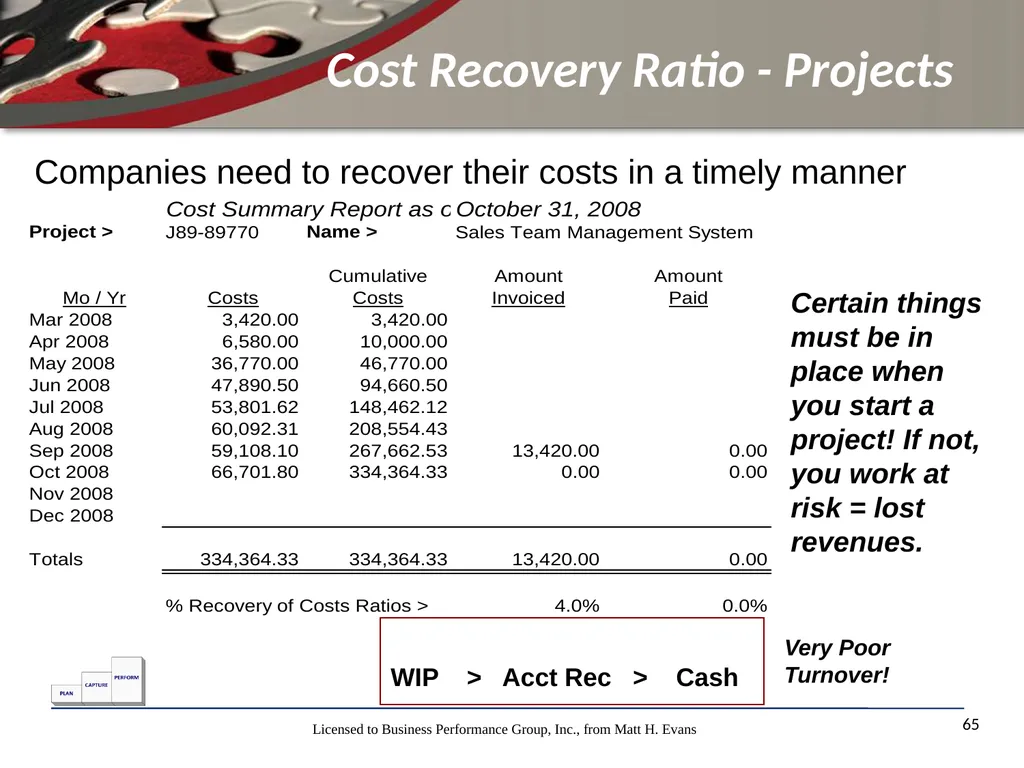
Cost Recovery Ratio - Projects 65 Companies need to recover their costs in a timely manner Certain things must be in place when you start a project! If not, you work at risk = lost revenues. WIP > Acct Rec > Cash Very Poor Turnover!<br>
66
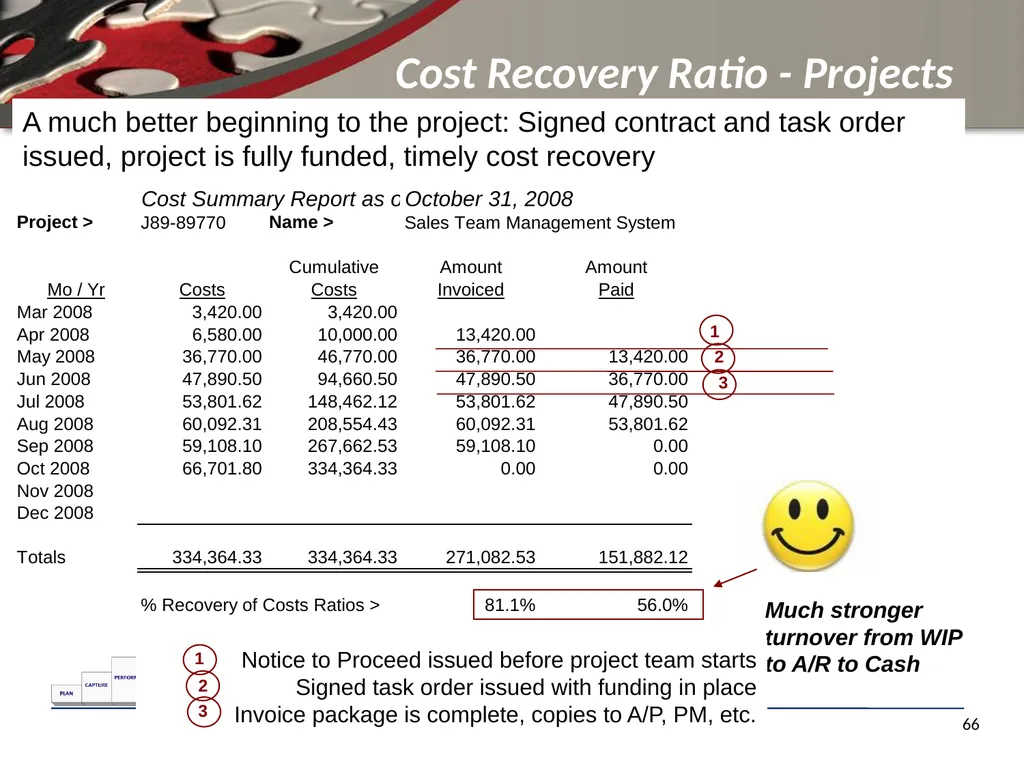
Cost Recovery Ratio - Projects 66 A much better beginning to the project: Signed contract and task order issued, project is fully funded, timely cost recovery Much stronger turnover from WIP to A/R to Cash Notice to Proceed issued before project team starts
Signed task order issued with funding in place
Invoice package is complete, copies to A/P, PM, etc. 1 2 3 1 2 3<br>
Signed task order issued with funding in place
Invoice package is complete, copies to A/P, PM, etc. 1 2 3 1 2 3<br>
67
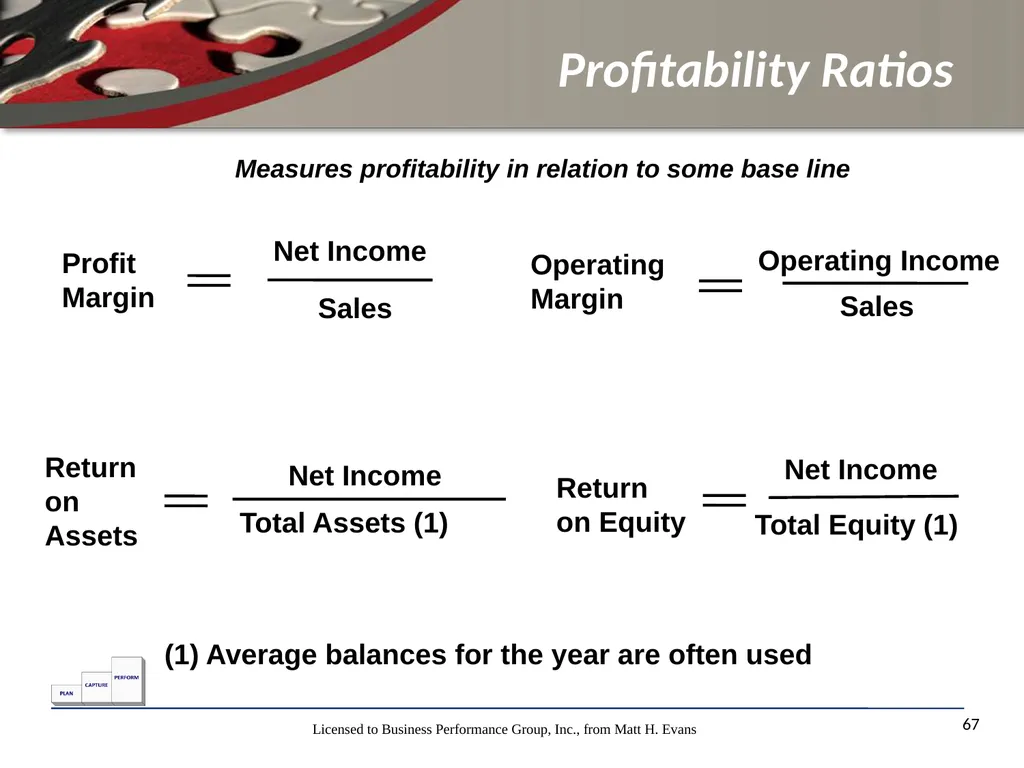
Profitability Ratios 67 Measures profitability in relation to some base line Profit Margin Net Income Sales Operating Margin Sales Operating Income Return on Assets Net Income Total Assets (1) Return on Equity Net Income Total Equity (1) (1) Average balances for the year are often used<br>
68
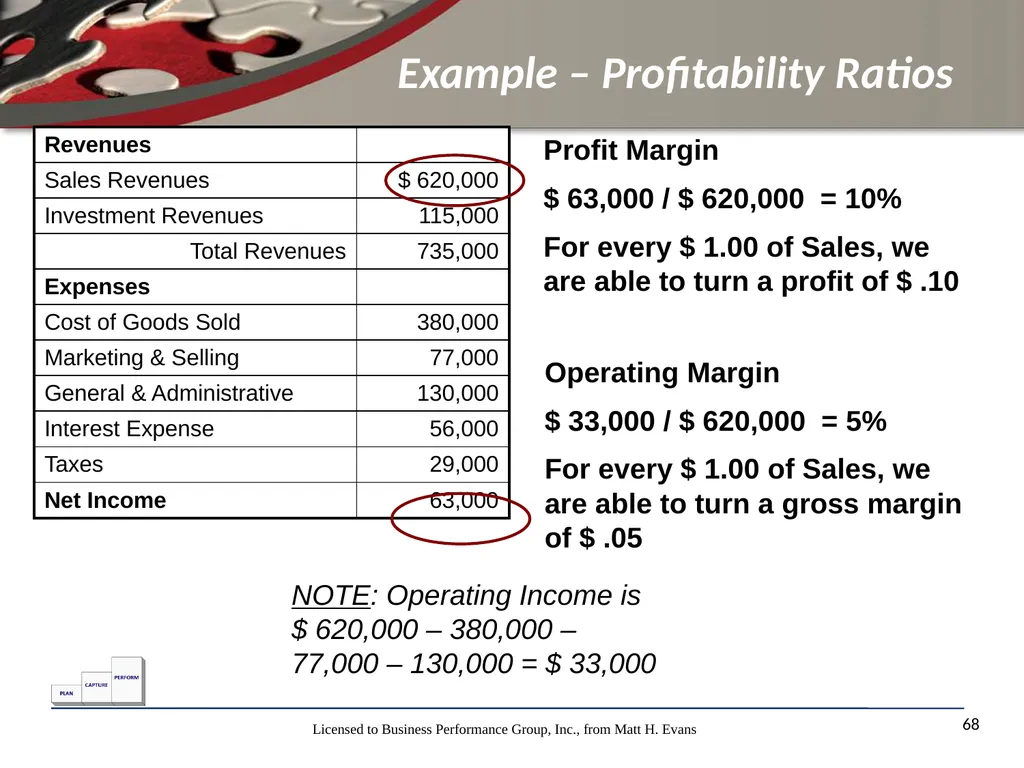
Example – Profitability Ratios 68 NOTE: Operating Income is $ 620,000 – 380,000 – 77,000 – 130,000 = $ 33,000 Profit Margin
$ 63,000 / $ 620,000 = 10%
For every $ 1.00 of Sales, we are able to turn a profit of $ .10 Operating Margin
$ 33,000 / $ 620,000 = 5%
For every $ 1.00 of Sales, we are able to turn a gross margin of $ .05<br>
$ 63,000 / $ 620,000 = 10%
For every $ 1.00 of Sales, we are able to turn a profit of $ .10 Operating Margin
$ 33,000 / $ 620,000 = 5%
For every $ 1.00 of Sales, we are able to turn a gross margin of $ .05<br>
69
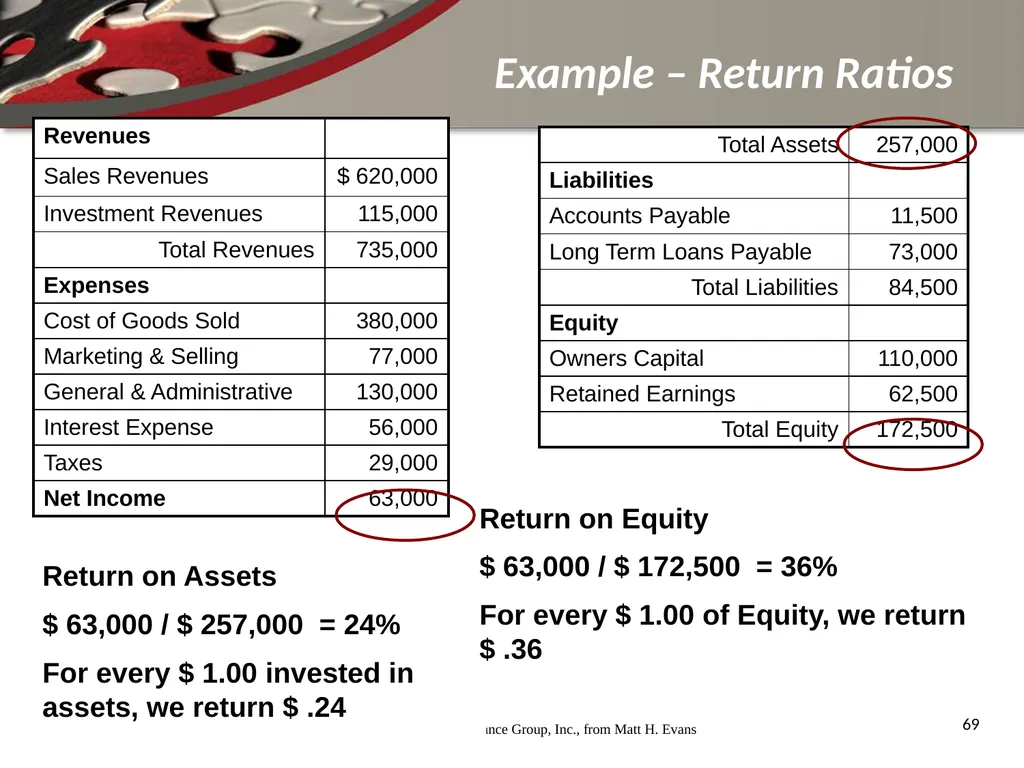
Example – Return Ratios 69 Return on Assets
$ 63,000 / $ 257,000 = 24%
For every $ 1.00 invested in assets, we return $ .24 Return on Equity
$ 63,000 / $ 172,500 = 36%
For every $ 1.00 of Equity, we return $ .36<br>
$ 63,000 / $ 257,000 = 24%
For every $ 1.00 invested in assets, we return $ .24 Return on Equity
$ 63,000 / $ 172,500 = 36%
For every $ 1.00 of Equity, we return $ .36<br>
70
Exercise 5 – Ratio Analysis 70 You will need the Ratio Template and the financial statements for Jacobs Engineering. Calculate the Ratios described in the template. The template includes the formula for each ratio. Take ten minutes to complete this exercise<br>
71
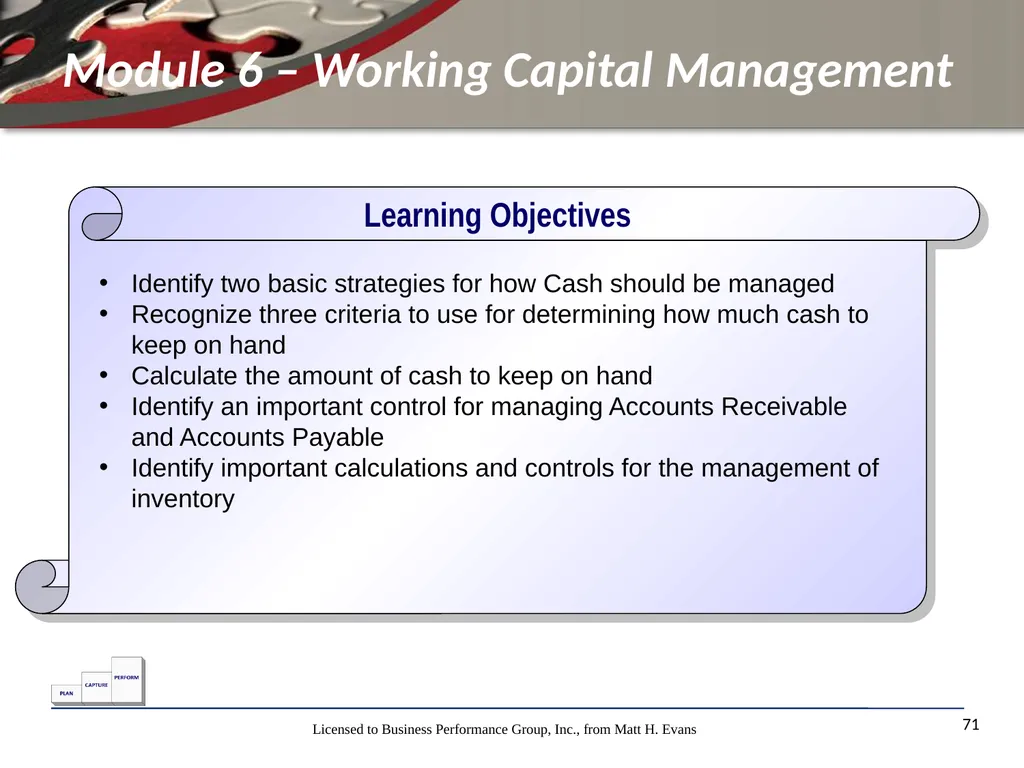
Module 6 – Working Capital Management 71 Identify two basic strategies for how Cash should be managed
Recognize three criteria to use for determining how much cash to keep on hand
Calculate the amount of cash to keep on hand
Identify an important control for managing Accounts Receivable and Accounts Payable
Identify important calculations and controls for the management of inventory Learning Objectives<br>
Recognize three criteria to use for determining how much cash to keep on hand
Calculate the amount of cash to keep on hand
Identify an important control for managing Accounts Receivable and Accounts Payable
Identify important calculations and controls for the management of inventory Learning Objectives<br>
72
Four accounts that warrant
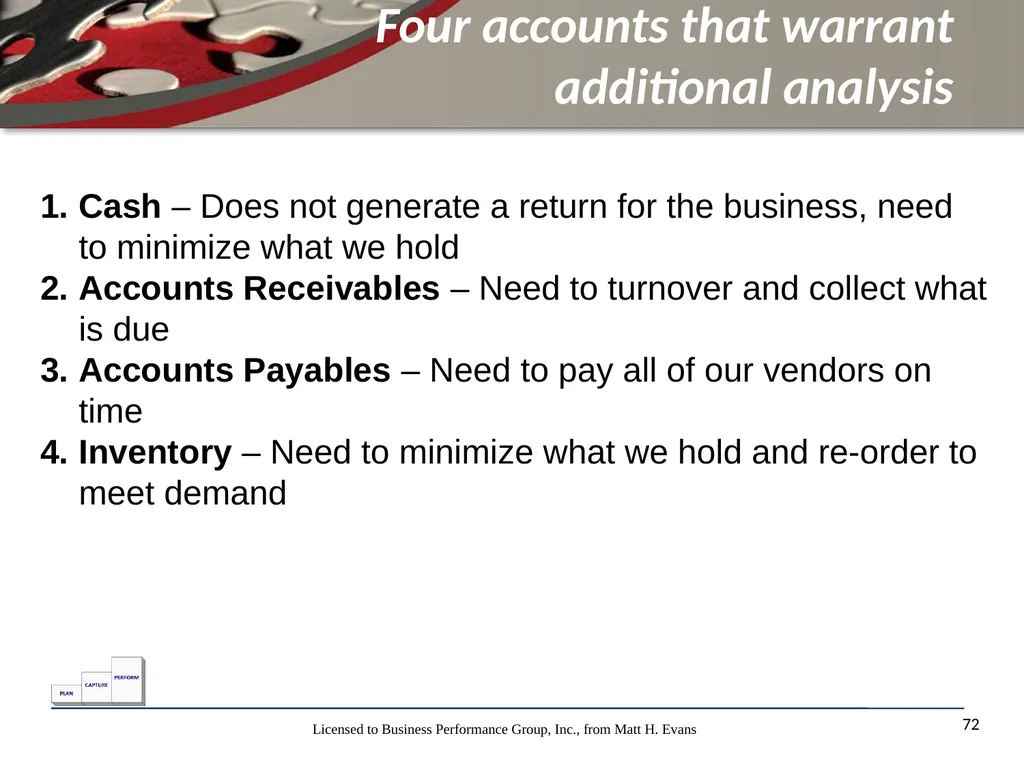
additional analysis 72 Cash – Does not generate a return for the business, need to minimize what we hold
Accounts Receivables – Need to turnover and collect what is due
Accounts Payables – Need to pay all of our vendors on time
Inventory – Need to minimize what we hold and re-order to meet demand<br>
Accounts Receivables – Need to turnover and collect what is due
Accounts Payables – Need to pay all of our vendors on time
Inventory – Need to minimize what we hold and re-order to meet demand<br>
73
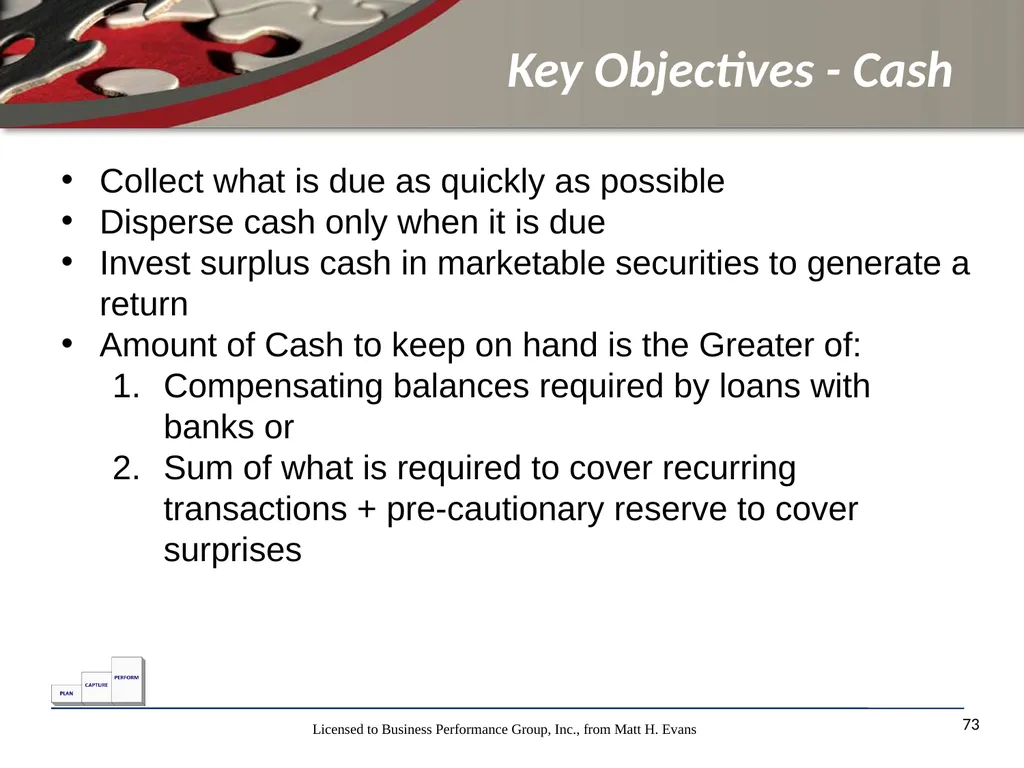
Key Objectives - Cash 73 Collect what is due as quickly as possible
Disperse cash only when it is due
Invest surplus cash in marketable securities to generate a return
Amount of Cash to keep on hand is the Greater of:
Compensating balances required by loans with banks or
Sum of what is required to cover recurring transactions + pre-cautionary reserve to cover surprises<br>
Disperse cash only when it is due
Invest surplus cash in marketable securities to generate a return
Amount of Cash to keep on hand is the Greater of:
Compensating balances required by loans with banks or
Sum of what is required to cover recurring transactions + pre-cautionary reserve to cover surprises<br>
74
Example of Cash to
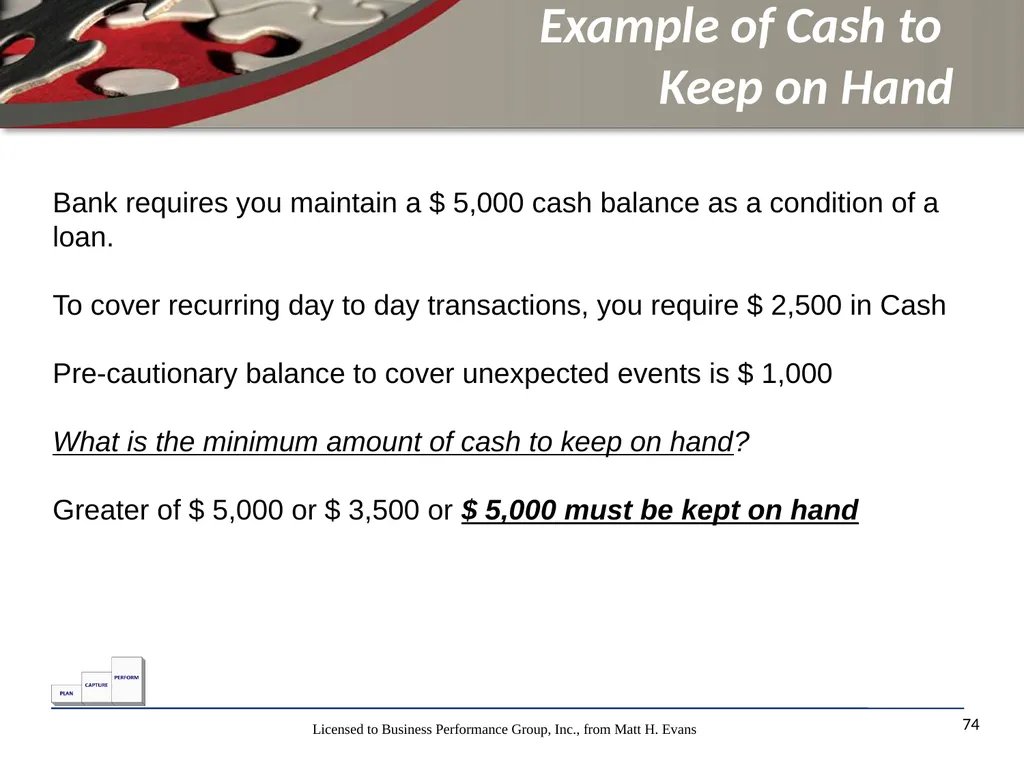
Keep on Hand 74 Bank requires you maintain a $ 5,000 cash balance as a condition of a loan.
To cover recurring day to day transactions, you require $ 2,500 in Cash
Pre-cautionary balance to cover unexpected events is $ 1,000
What is the minimum amount of cash to keep on hand?
Greater of $ 5,000 or $ 3,500 or $ 5,000 must be kept on hand<br>
To cover recurring day to day transactions, you require $ 2,500 in Cash
Pre-cautionary balance to cover unexpected events is $ 1,000
What is the minimum amount of cash to keep on hand?
Greater of $ 5,000 or $ 3,500 or $ 5,000 must be kept on hand<br>
75
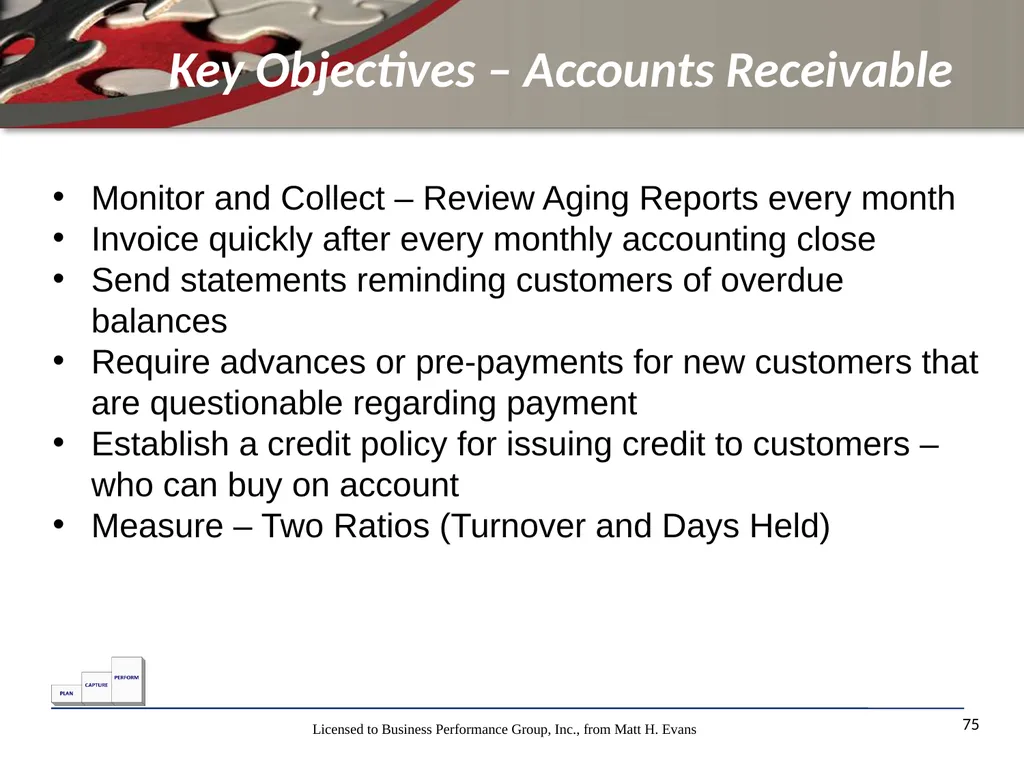
Key Objectives – Accounts Receivable 75 Monitor and Collect – Review Aging Reports every month
Invoice quickly after every monthly accounting close
Send statements reminding customers of overdue balances
Require advances or pre-payments for new customers that are questionable regarding payment
Establish a credit policy for issuing credit to customers – who can buy on account
Measure – Two Ratios (Turnover and Days Held)<br>
Invoice quickly after every monthly accounting close
Send statements reminding customers of overdue balances
Require advances or pre-payments for new customers that are questionable regarding payment
Establish a credit policy for issuing credit to customers – who can buy on account
Measure – Two Ratios (Turnover and Days Held)<br>
76
Accounts Receivable
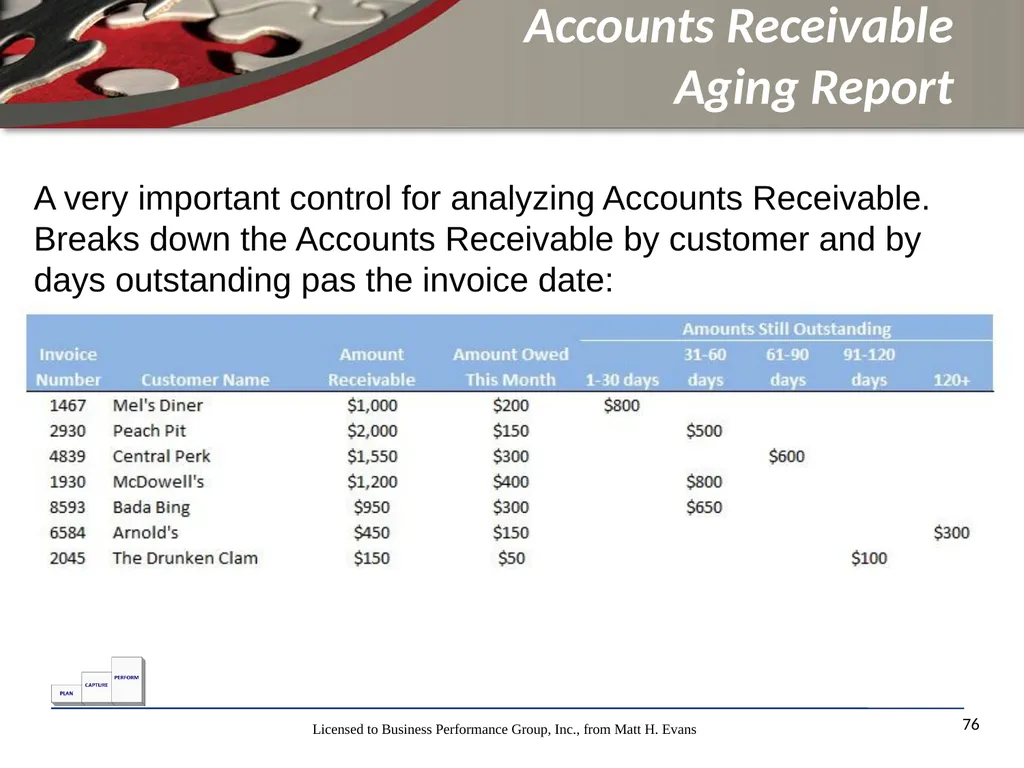
Aging Report 76 A very important control for analyzing Accounts Receivable. Breaks down the Accounts Receivable by customer and by days outstanding pas the invoice date:<br>
77
Accounts Payable
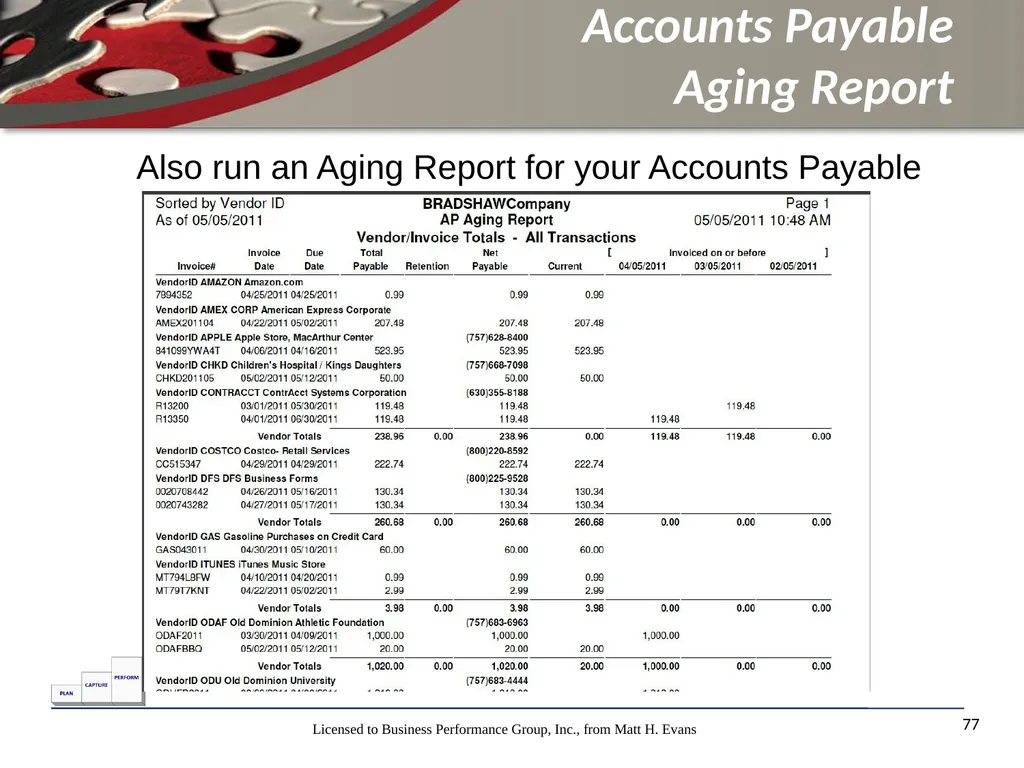
Aging Report 77 Also run an Aging Report for your Accounts Payable<br>
78
Key Objectives - Inventories 78 Automated System to track and control flow of every item
Segment inventory – high volume sales, moderate and slow moving
Calculate re-order points – know lead times
Control holding, storage and order costs
Integrated approach – Supply Chain Management – everyone working in sync If you have inventories, then you will need to have aggressive control procedures since this is at the heart of what your business does<br>
Segment inventory – high volume sales, moderate and slow moving
Calculate re-order points – know lead times
Control holding, storage and order costs
Integrated approach – Supply Chain Management – everyone working in sync If you have inventories, then you will need to have aggressive control procedures since this is at the heart of what your business does<br>
79
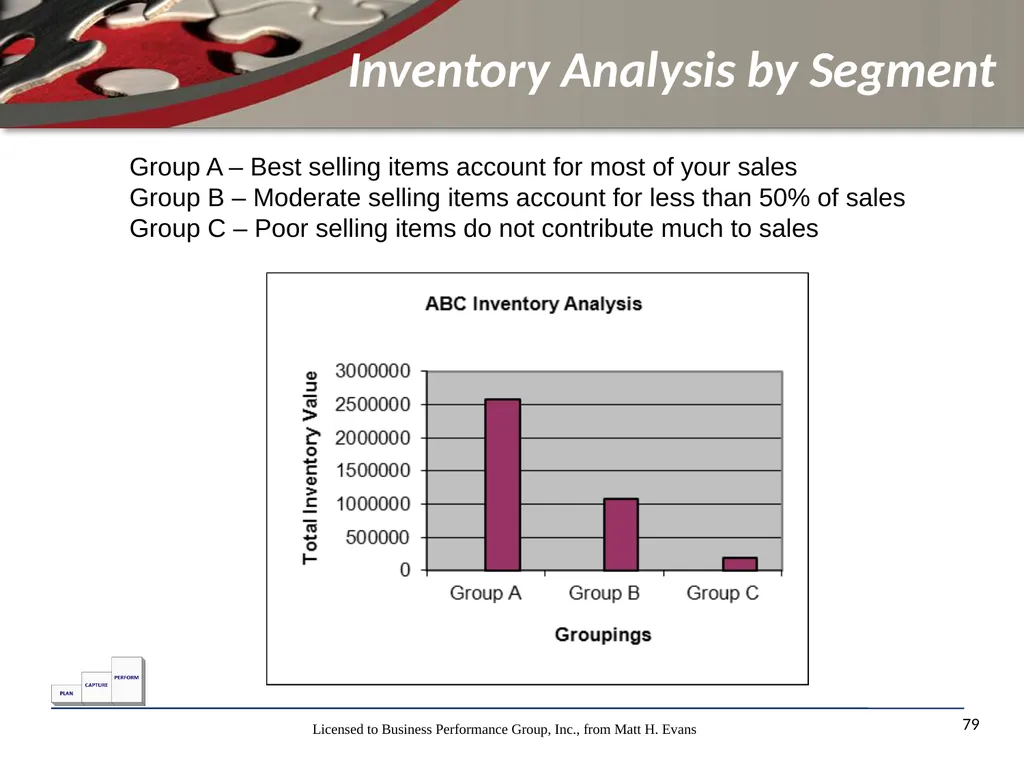
Inventory Analysis by Segment 79 Group A – Best selling items account for most of your sales
Group B – Moderate selling items account for less than 50% of sales
Group C – Poor selling items do not contribute much to sales<br>
Group B – Moderate selling items account for less than 50% of sales
Group C – Poor selling items do not contribute much to sales<br>
80
Inventory Re Order Level 80 Re-Order based on Demand and Lead Time to Replenish Inventory Start with a forecast of usage or demand for a specific time frame and normalize this to days
Next, multiply this daily demand by the number of lead time days to determine your reorder level
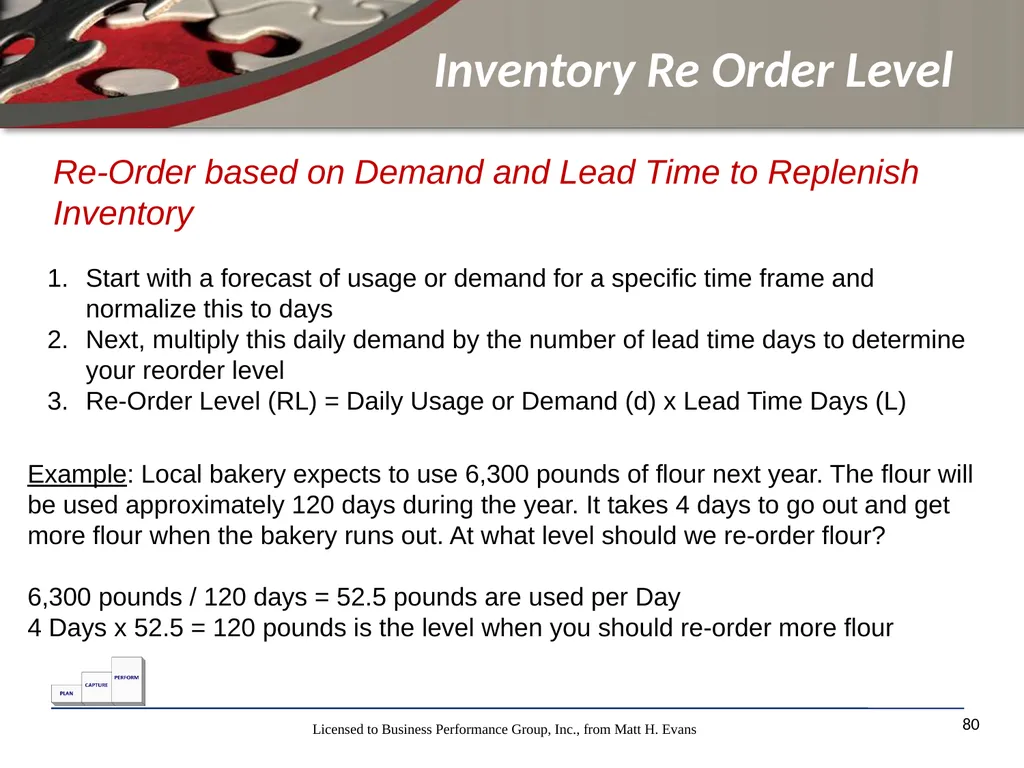
Re-Order Level (RL) = Daily Usage or Demand (d) x Lead Time Days (L) Example: Local bakery expects to use 6,300 pounds of flour next year. The flour will be used approximately 120 days during the year. It takes 4 days to go out and get more flour when the bakery runs out. At what level should we re-order flour?
6,300 pounds / 120 days = 52.5 pounds are used per Day
4 Days x 52.5 = 120 pounds is the level when you should re-order more flour<br>
Next, multiply this daily demand by the number of lead time days to determine your reorder level
Re-Order Level (RL) = Daily Usage or Demand (d) x Lead Time Days (L) Example: Local bakery expects to use 6,300 pounds of flour next year. The flour will be used approximately 120 days during the year. It takes 4 days to go out and get more flour when the bakery runs out. At what level should we re-order flour?
6,300 pounds / 120 days = 52.5 pounds are used per Day
4 Days x 52.5 = 120 pounds is the level when you should re-order more flour<br>
81
Exercise 6
Inventory Segment Analysis 81 Find the Inventory Segment Analysis template and calculate the inventory into three groups: A, B, and C
Group A = High valued items that contribute more than 10% to the total inventory value
Group B = Moderate inventory items that contribute between 2% to 10% to the total inventory value
Group C = Contributes the least, less than 2%
What is the total value for each of these three groups?<br>
Group A = High valued items that contribute more than 10% to the total inventory value
Group B = Moderate inventory items that contribute between 2% to 10% to the total inventory value
Group C = Contributes the least, less than 2%
What is the total value for each of these three groups?<br>
82
Module 7 – Key Financial Indicators 82 Identify underlying drivers behind growing revenues and reducing costs
Recognize how to measure profitability below the company level
Recognize the importance of cash flows as it relates to the value of an investment or company
Calculate the Return on Investment
Identify the components with Cost of Capital
Interpret value through the comparison of Return on Investment with Cost of Capital Learning Objectives<br>
Recognize how to measure profitability below the company level
Recognize the importance of cash flows as it relates to the value of an investment or company
Calculate the Return on Investment
Identify the components with Cost of Capital
Interpret value through the comparison of Return on Investment with Cost of Capital Learning Objectives<br>
83
Growing the Top Line
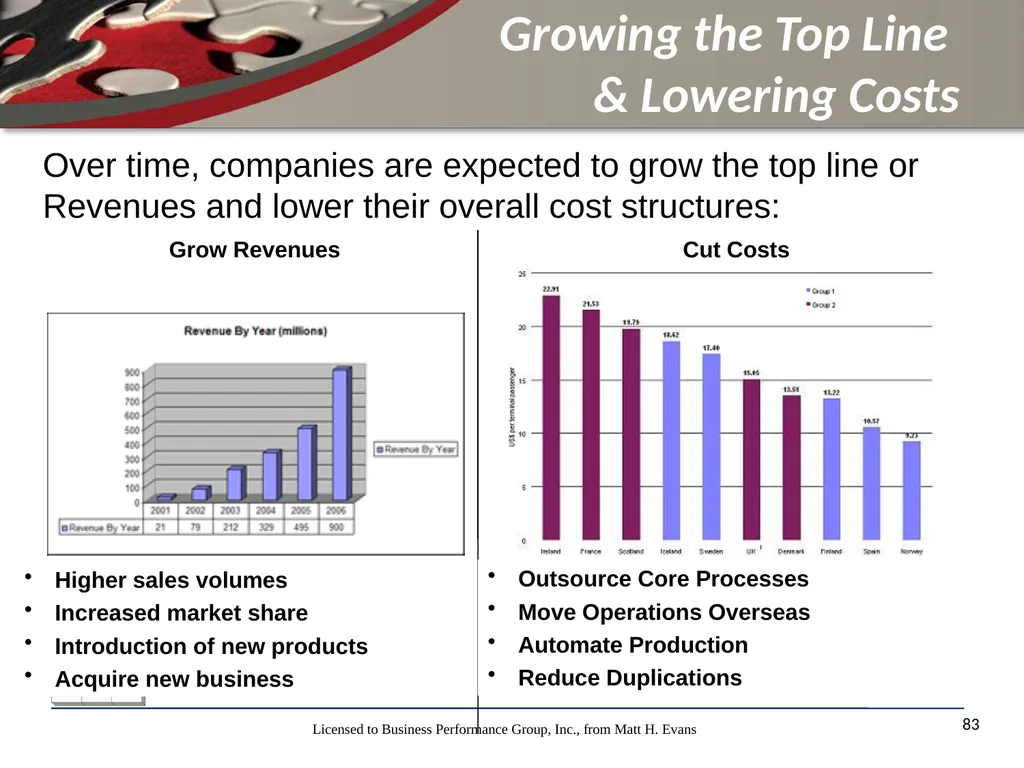
& Lowering Costs 83 Over time, companies are expected to grow the top line or Revenues and lower their overall cost structures: Higher sales volumes
Increased market share
Introduction of new products
Acquire new business Outsource Core Processes
Move Operations Overseas
Automate Production
Reduce Duplications Grow Revenues Cut Costs<br>
Increased market share
Introduction of new products
Acquire new business Outsource Core Processes
Move Operations Overseas
Automate Production
Reduce Duplications Grow Revenues Cut Costs<br>
84
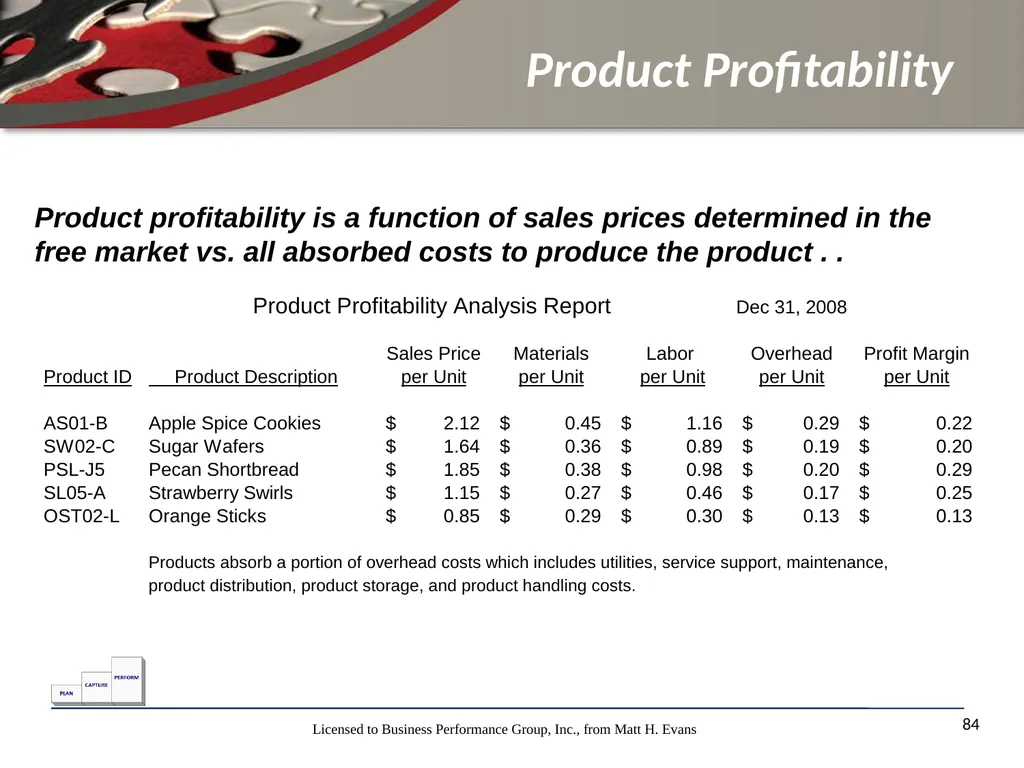
Product Profitability 84 Product profitability is a function of sales prices determined in the free market vs. all absorbed costs to produce the product . .<br>
85
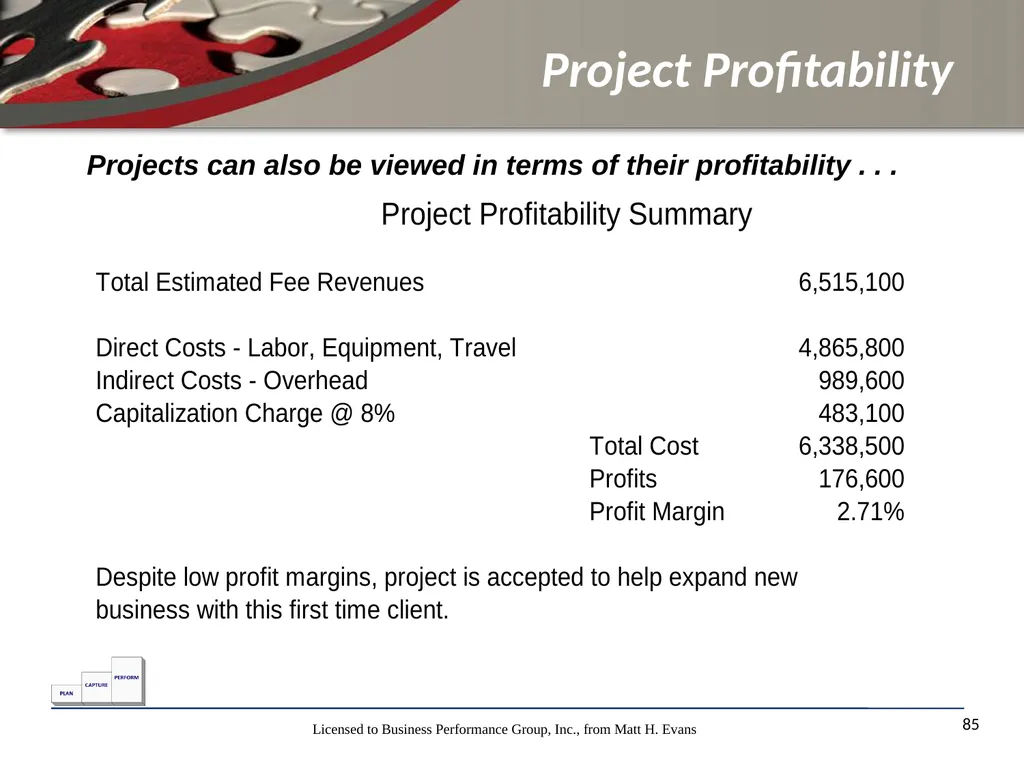
Project Profitability 85 Projects can also be viewed in terms of their profitability . . .<br>
86
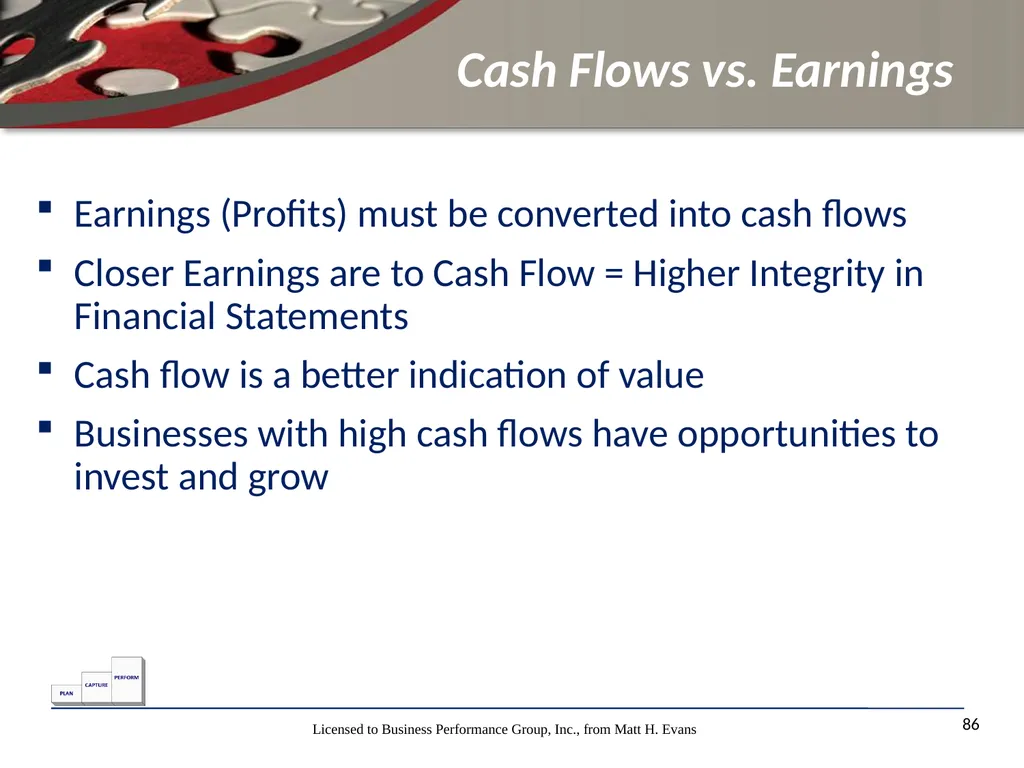
Cash Flows vs. Earnings 86 Earnings (Profits) must be converted into cash flows
Closer Earnings are to Cash Flow = Higher Integrity in Financial Statements
Cash flow is a better indication of value
Businesses with high cash flows have opportunities to invest and grow<br>
Closer Earnings are to Cash Flow = Higher Integrity in Financial Statements
Cash flow is a better indication of value
Businesses with high cash flows have opportunities to invest and grow<br>
87
Earnings are over-emphasized 87 There is a poor correlation between earnings and market values of companies since earnings tend to fluctuate:<br>
88
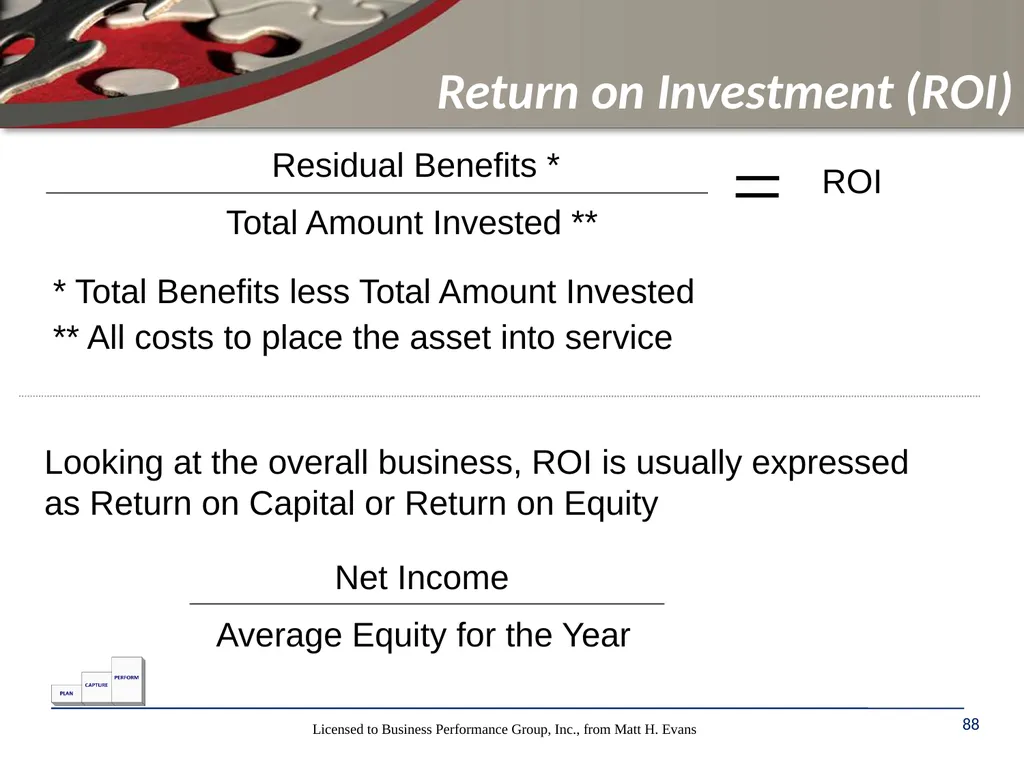
Return on Investment (ROI) 88 Residual Benefits * Total Amount Invested ** Looking at the overall business, ROI is usually expressed as Return on Capital or Return on Equity ROI Net Income Average Equity for the Year * Total Benefits less Total Amount Invested
** All costs to place the asset into service<br>
** All costs to place the asset into service<br>
89
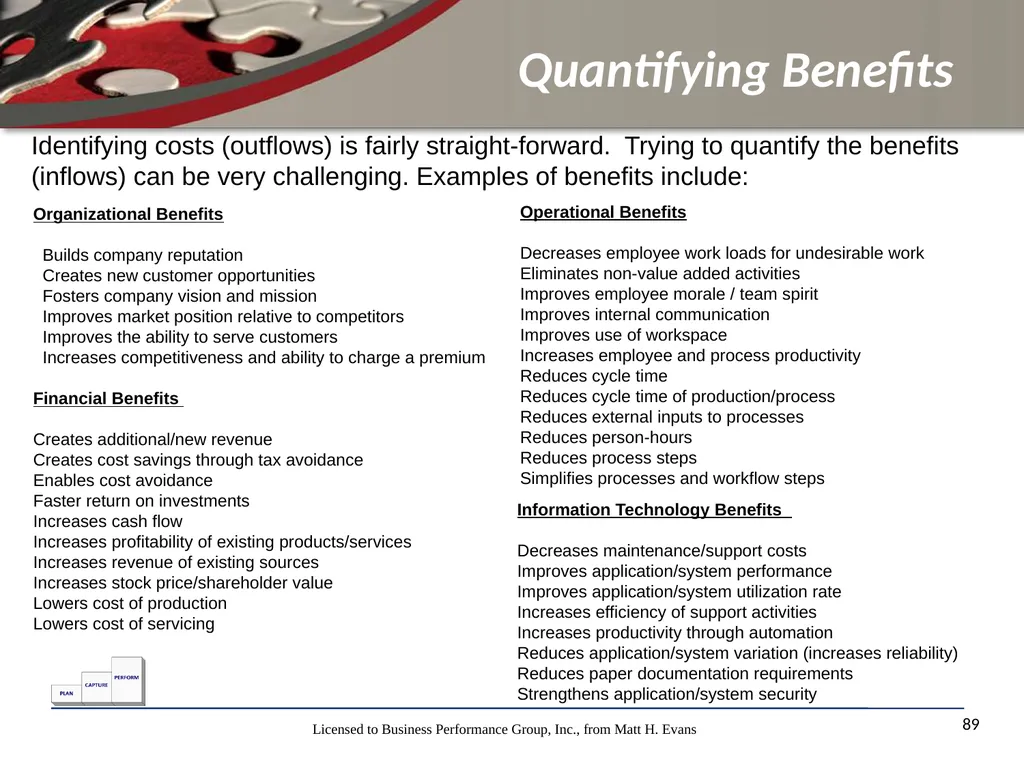
Quantifying Benefits 89 Organizational Benefits
Builds company reputation Creates new customer opportunities Fosters company vision and mission Improves market position relative to competitors Improves the ability to serve customers Increases competitiveness and ability to charge a premium
Financial Benefits
Creates additional/new revenue Creates cost savings through tax avoidance Enables cost avoidance Faster return on investments Increases cash flow Increases profitability of existing products/services Increases revenue of existing sources Increases stock price/shareholder value Lowers cost of production Lowers cost of servicing Operational Benefits
Decreases employee work loads for undesirable work Eliminates non-value added activities Improves employee morale / team spirit Improves internal communication
Improves use of workspace Increases employee and process productivity Reduces cycle time Reduces cycle time of production/process Reduces external inputs to processes Reduces person-hours Reduces process steps Simplifies processes and workflow steps Information Technology Benefits
Decreases maintenance/support costs Improves application/system performance Improves application/system utilization rate Increases efficiency of support activities Increases productivity through automation Reduces application/system variation (increases reliability) Reduces paper documentation requirements Strengthens application/system security Identifying costs (outflows) is fairly straight-forward. Trying to quantify the benefits (inflows) can be very challenging. Examples of benefits include:<br>
Builds company reputation Creates new customer opportunities Fosters company vision and mission Improves market position relative to competitors Improves the ability to serve customers Increases competitiveness and ability to charge a premium
Financial Benefits
Creates additional/new revenue Creates cost savings through tax avoidance Enables cost avoidance Faster return on investments Increases cash flow Increases profitability of existing products/services Increases revenue of existing sources Increases stock price/shareholder value Lowers cost of production Lowers cost of servicing Operational Benefits
Decreases employee work loads for undesirable work Eliminates non-value added activities Improves employee morale / team spirit Improves internal communication
Improves use of workspace Increases employee and process productivity Reduces cycle time Reduces cycle time of production/process Reduces external inputs to processes Reduces person-hours Reduces process steps Simplifies processes and workflow steps Information Technology Benefits
Decreases maintenance/support costs Improves application/system performance Improves application/system utilization rate Increases efficiency of support activities Increases productivity through automation Reduces application/system variation (increases reliability) Reduces paper documentation requirements Strengthens application/system security Identifying costs (outflows) is fairly straight-forward. Trying to quantify the benefits (inflows) can be very challenging. Examples of benefits include:<br>
90
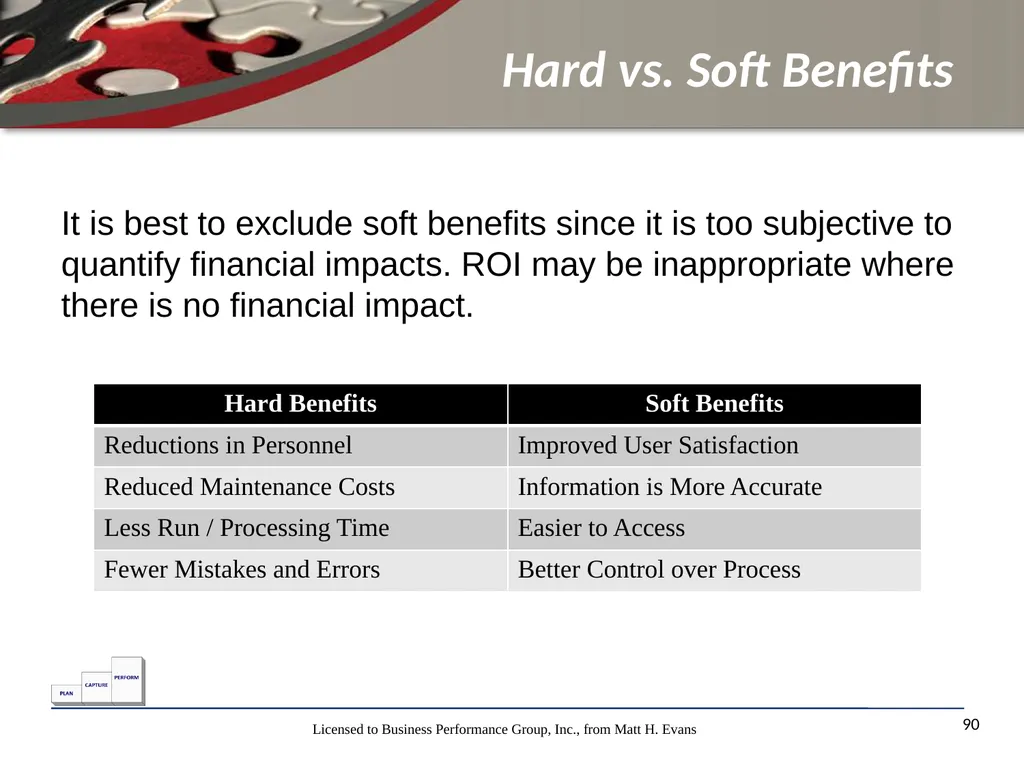
Hard vs. Soft Benefits 90 It is best to exclude soft benefits since it is too subjective to quantify financial impacts. ROI may be inappropriate where there is no financial impact.<br>
91
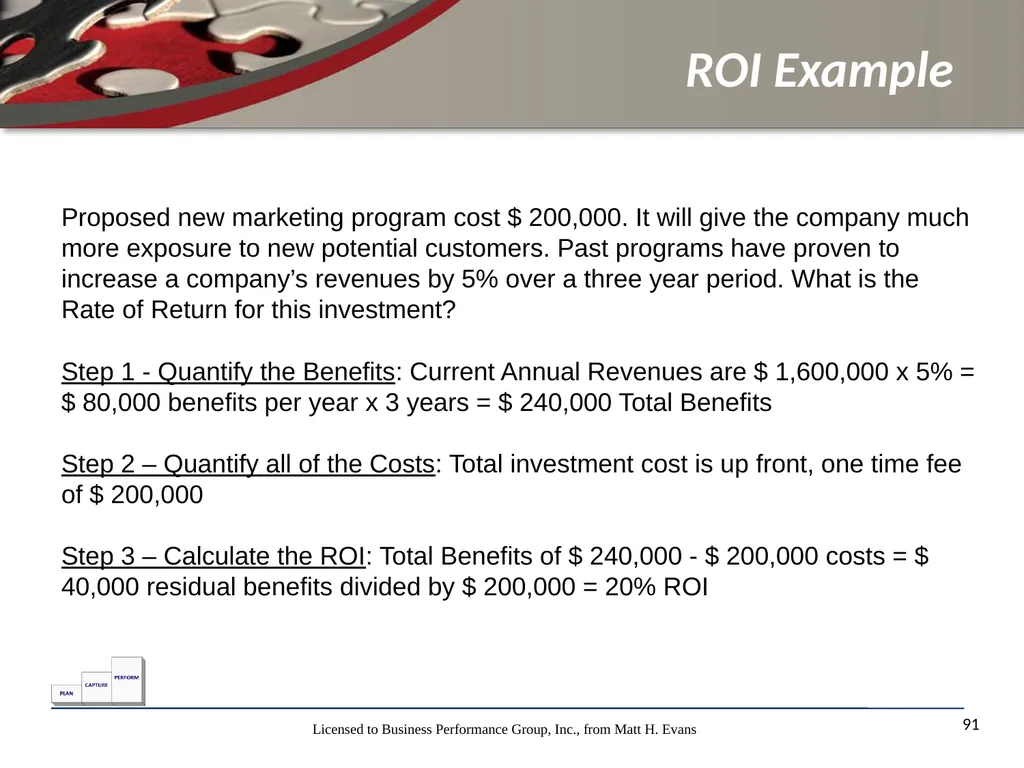
ROI Example 91 Proposed new marketing program cost $ 200,000. It will give the company much more exposure to new potential customers. Past programs have proven to increase a company’s revenues by 5% over a three year period. What is the Rate of Return for this investment? Step 1 - Quantify the Benefits: Current Annual Revenues are $ 1,600,000 x 5% = $ 80,000 benefits per year x 3 years = $ 240,000 Total Benefits
Step 2 – Quantify all of the Costs: Total investment cost is up front, one time fee of $ 200,000
Step 3 – Calculate the ROI: Total Benefits of $ 240,000 - $ 200,000 costs = $ 40,000 residual benefits divided by $ 200,000 = 20% ROI<br>
Step 2 – Quantify all of the Costs: Total investment cost is up front, one time fee of $ 200,000
Step 3 – Calculate the ROI: Total Benefits of $ 240,000 - $ 200,000 costs = $ 40,000 residual benefits divided by $ 200,000 = 20% ROI<br>
92
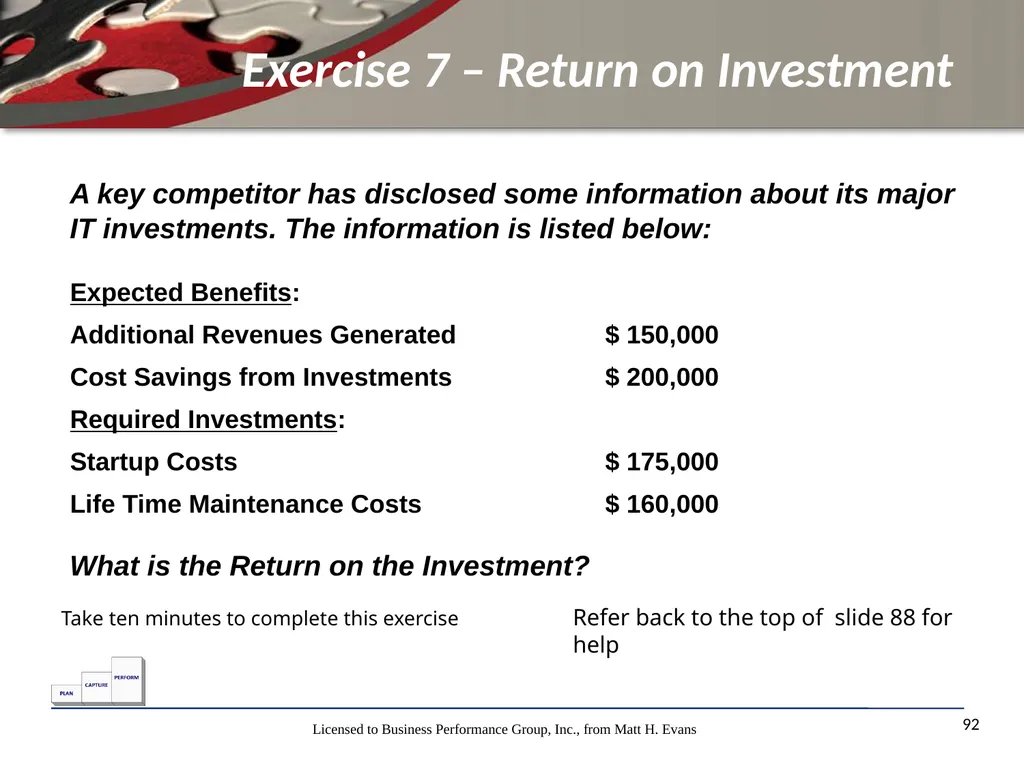
Exercise 7 – Return on Investment 92 A key competitor has disclosed some information about its major IT investments. The information is listed below: What is the Return on the Investment? Take ten minutes to complete this exercise Refer back to the top of slide 88 for help<br>
93
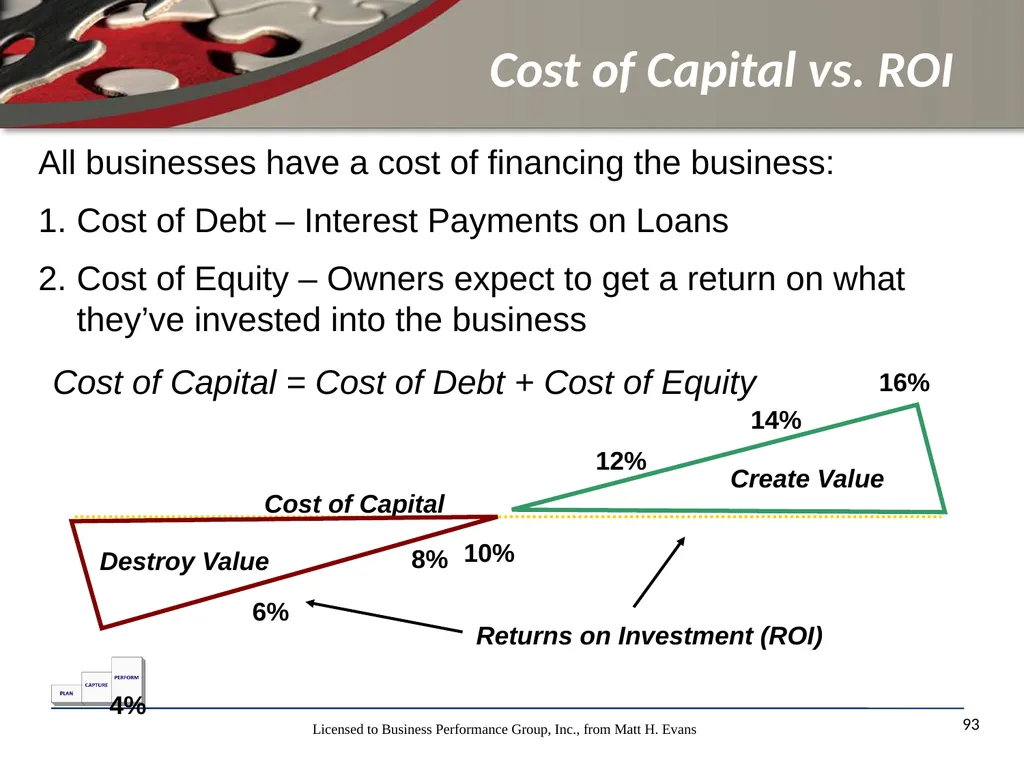
Cost of Capital vs. ROI 93 All businesses have a cost of financing the business:
Cost of Debt – Interest Payments on Loans
Cost of Equity – Owners expect to get a return on what they’ve invested into the business Cost of Capital = Cost of Debt + Cost of Equity Cost of Capital Create Value Destroy Value Returns on Investment (ROI) 10% 12% 14% 16% 8% 6% 4%<br>
Cost of Debt – Interest Payments on Loans
Cost of Equity – Owners expect to get a return on what they’ve invested into the business Cost of Capital = Cost of Debt + Cost of Equity Cost of Capital Create Value Destroy Value Returns on Investment (ROI) 10% 12% 14% 16% 8% 6% 4%<br>
94
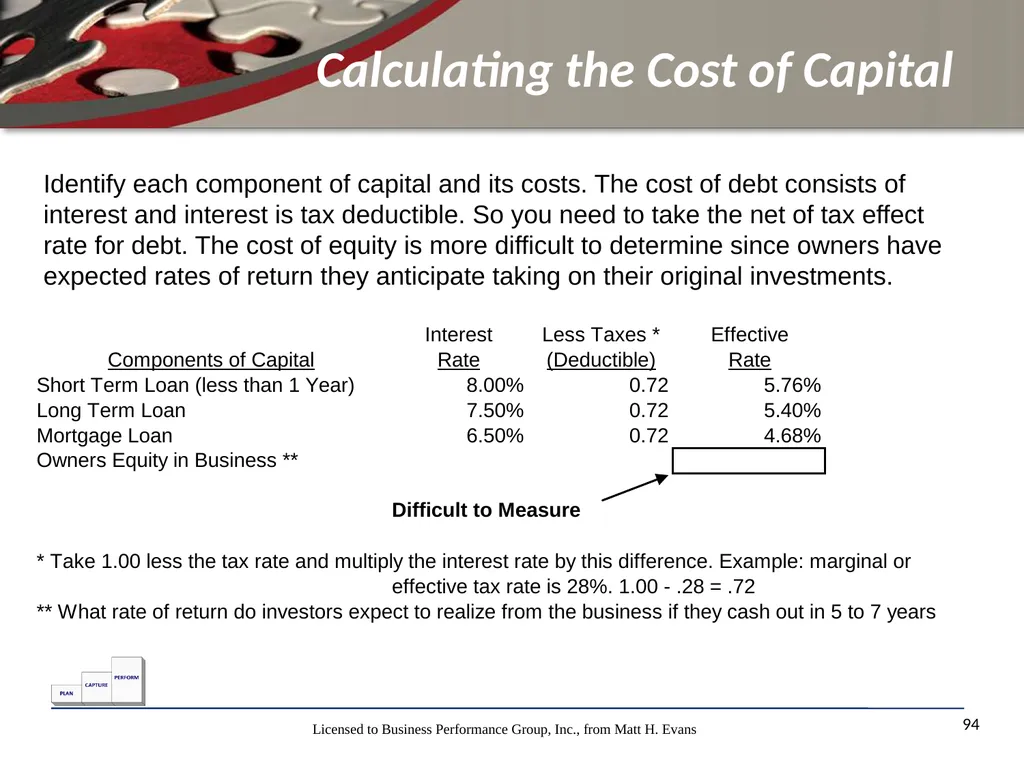
Calculating the Cost of Capital 94 Identify each component of capital and its costs. The cost of debt consists of interest and interest is tax deductible. So you need to take the net of tax effect rate for debt. The cost of equity is more difficult to determine since owners have expected rates of return they anticipate taking on their original investments.<br>
95
Apply Weights to Determine Overall
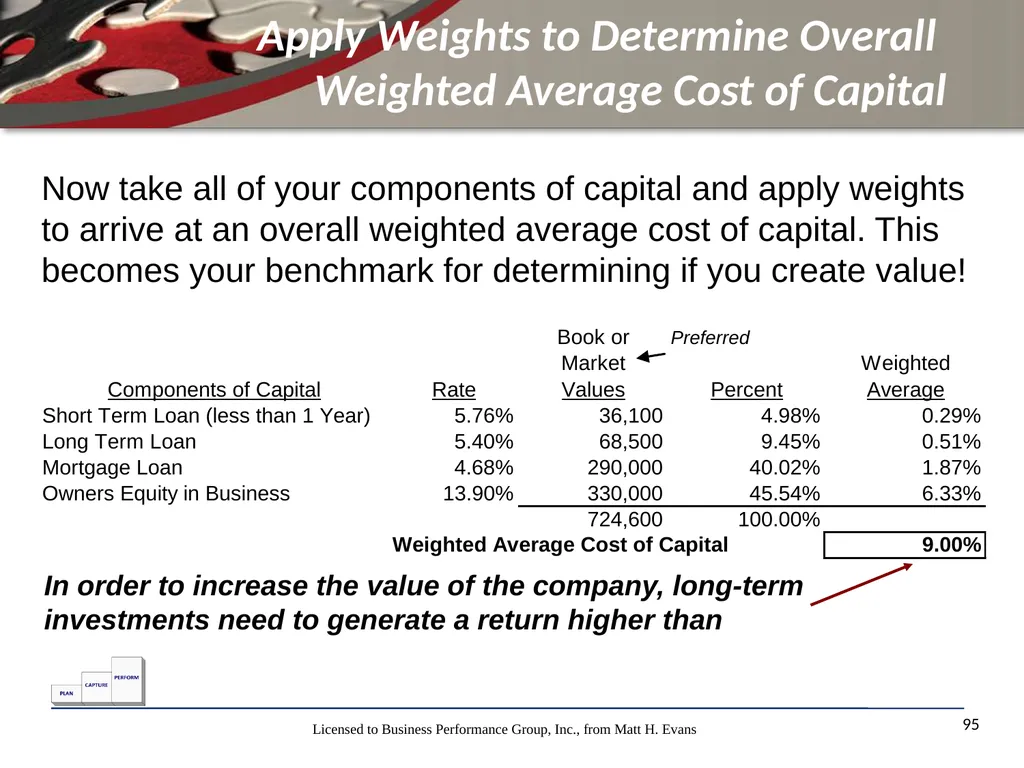
Weighted Average Cost of Capital 95 In order to increase the value of the company, long-term investments need to generate a return higher than Now take all of your components of capital and apply weights to arrive at an overall weighted average cost of capital. This becomes your benchmark for determining if you create value!<br>
96
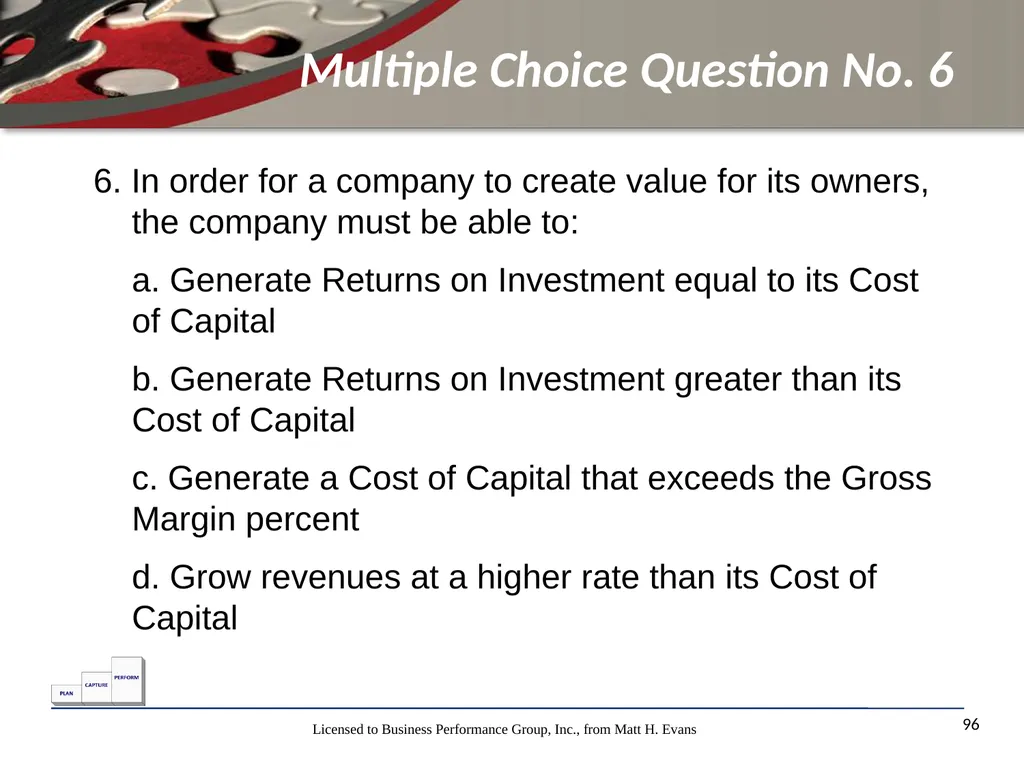
Multiple Choice Question No. 6 96 6. In order for a company to create value for its owners, the company must be able to:
a. Generate Returns on Investment equal to its Cost of Capital
b. Generate Returns on Investment greater than its Cost of Capital
c. Generate a Cost of Capital that exceeds the Gross Margin percent
d. Grow revenues at a higher rate than its Cost of Capital<br>
a. Generate Returns on Investment equal to its Cost of Capital
b. Generate Returns on Investment greater than its Cost of Capital
c. Generate a Cost of Capital that exceeds the Gross Margin percent
d. Grow revenues at a higher rate than its Cost of Capital<br>
97
Exercise 8 – Cost of Capital 97 Refer to the Template for Calculating Cost of Capital – Jacobs Engineering
You will need to refer to the Jacobs Financials to pull off Amounts per the Balance Sheet for Step 4 in the template.
Complete the template to see how you calculate Cost of Capital<br>
You will need to refer to the Jacobs Financials to pull off Amounts per the Balance Sheet for Step 4 in the template.
Complete the template to see how you calculate Cost of Capital<br>
98
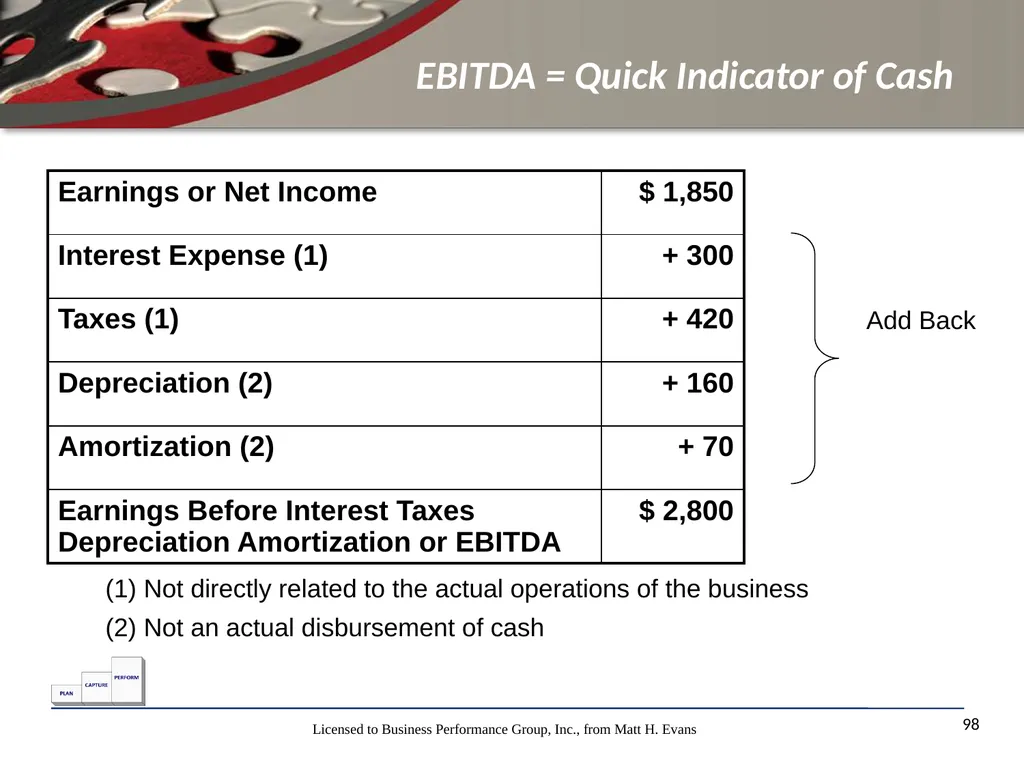
EBITDA = Quick Indicator of Cash 98 Not directly related to the actual operations of the business
Not an actual disbursement of cash Add Back<br>
Not an actual disbursement of cash Add Back<br>
99
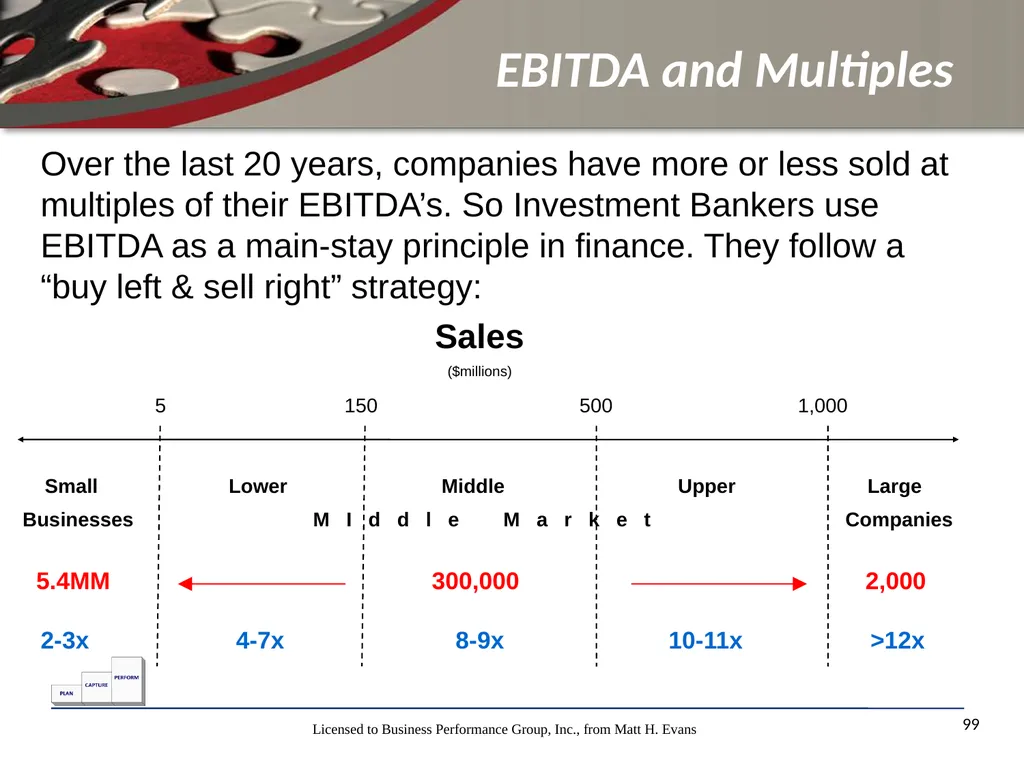
EBITDA and Multiples 99 Over the last 20 years, companies have more or less sold at multiples of their EBITDA’s. So Investment Bankers use EBITDA as a main-stay principle in finance. They follow a “buy left & sell right” strategy:<br>
100
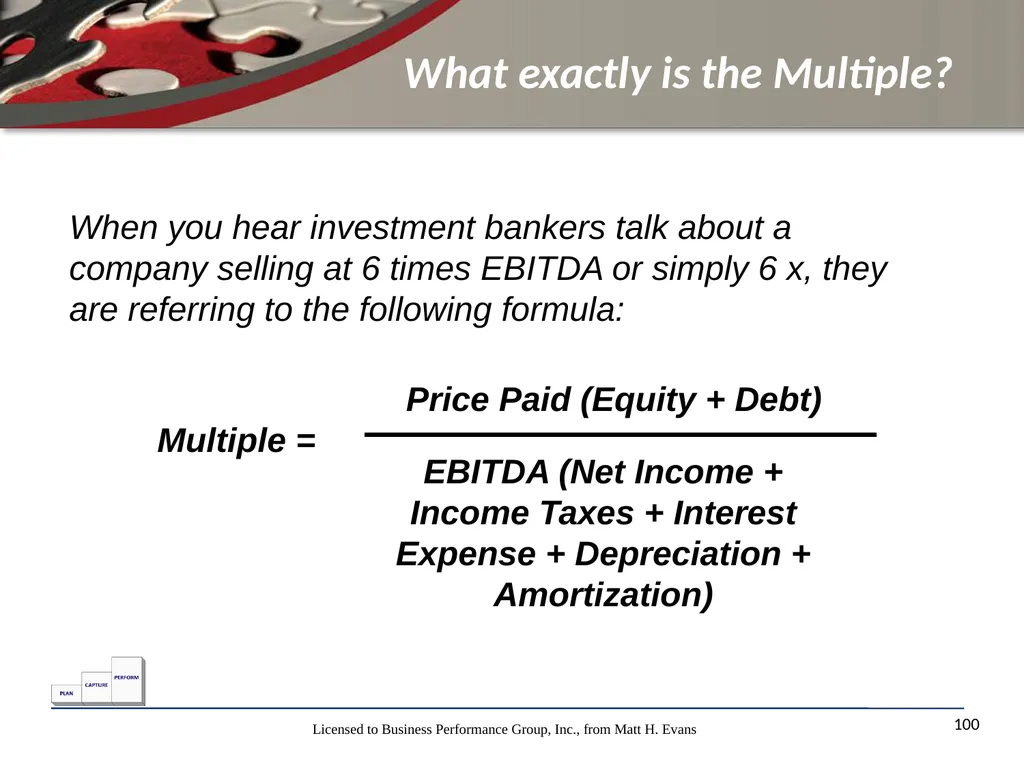
What exactly is the Multiple? 100 Price Paid (Equity + Debt) When you hear investment bankers talk about a company selling at 6 times EBITDA or simply 6 x, they are referring to the following formula: Multiple = EBITDA (Net Income + Income Taxes + Interest Expense + Depreciation + Amortization)<br>
101
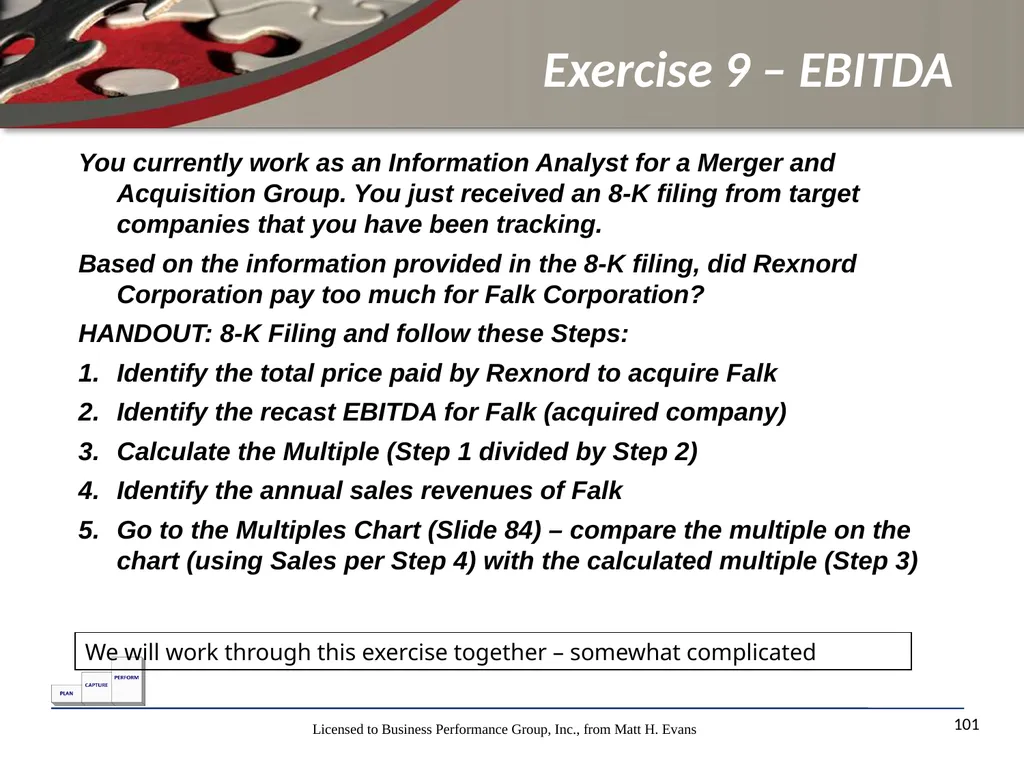
Exercise 9 – EBITDA 101 You currently work as an Information Analyst for a Merger and Acquisition Group. You just received an 8-K filing from target companies that you have been tracking.
Based on the information provided in the 8-K filing, did Rexnord Corporation pay too much for Falk Corporation?
HANDOUT: 8-K Filing and follow these Steps:
Identify the total price paid by Rexnord to acquire Falk
Identify the recast EBITDA for Falk (acquired company)
Calculate the Multiple (Step 1 divided by Step 2)
Identify the annual sales revenues of Falk
Go to the Multiples Chart (Slide 84) – compare the multiple on the chart (using Sales per Step 4) with the calculated multiple (Step 3) We will work through this exercise together – somewhat complicated<br>
Based on the information provided in the 8-K filing, did Rexnord Corporation pay too much for Falk Corporation?
HANDOUT: 8-K Filing and follow these Steps:
Identify the total price paid by Rexnord to acquire Falk
Identify the recast EBITDA for Falk (acquired company)
Calculate the Multiple (Step 1 divided by Step 2)
Identify the annual sales revenues of Falk
Go to the Multiples Chart (Slide 84) – compare the multiple on the chart (using Sales per Step 4) with the calculated multiple (Step 3) We will work through this exercise together – somewhat complicated<br>
102
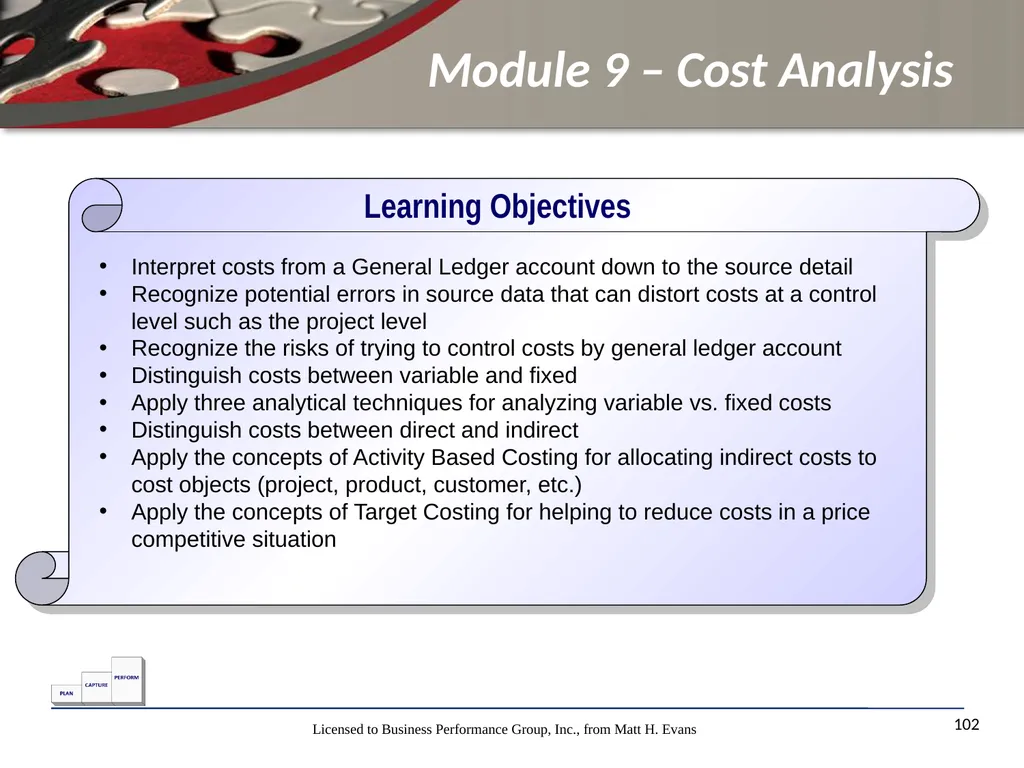
Module 9 – Cost Analysis 102 Interpret costs from a General Ledger account down to the source detail
Recognize potential errors in source data that can distort costs at a control level such as the project level
Recognize the risks of trying to control costs by general ledger account
Distinguish costs between variable and fixed
Apply three analytical techniques for analyzing variable vs. fixed costs
Distinguish costs between direct and indirect
Apply the concepts of Activity Based Costing for allocating indirect costs to cost objects (project, product, customer, etc.)
Apply the concepts of Target Costing for helping to reduce costs in a price competitive situation Learning Objectives<br>
Recognize potential errors in source data that can distort costs at a control level such as the project level
Recognize the risks of trying to control costs by general ledger account
Distinguish costs between variable and fixed
Apply three analytical techniques for analyzing variable vs. fixed costs
Distinguish costs between direct and indirect
Apply the concepts of Activity Based Costing for allocating indirect costs to cost objects (project, product, customer, etc.)
Apply the concepts of Target Costing for helping to reduce costs in a price competitive situation Learning Objectives<br>
103
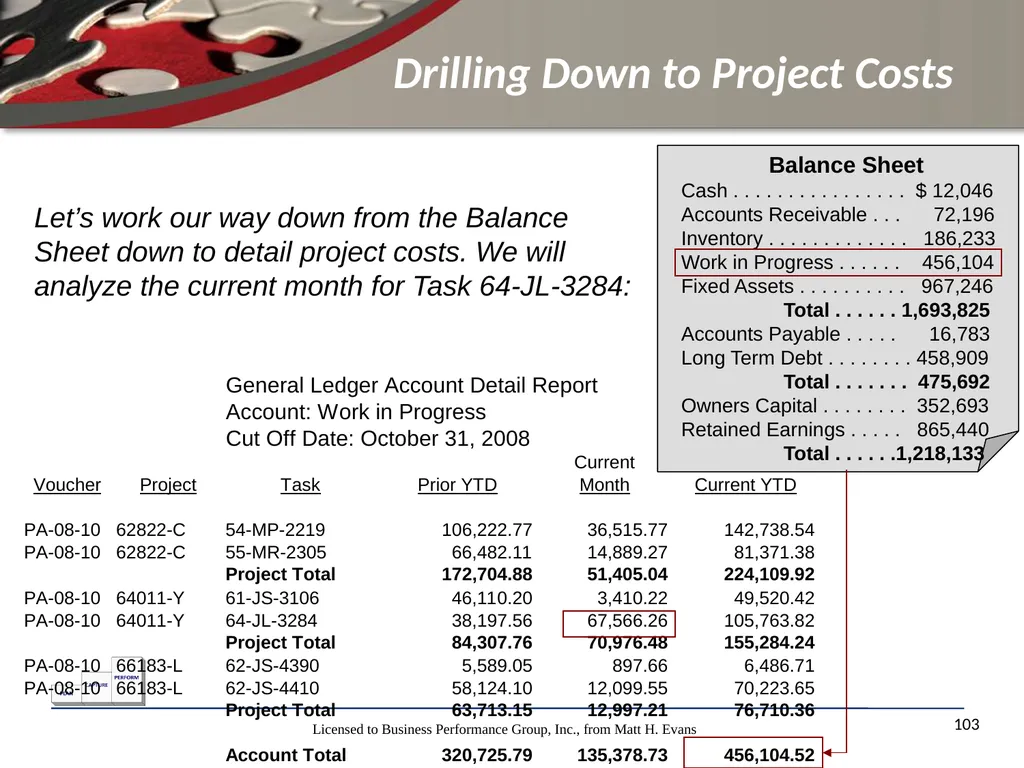
Drilling Down to Project Costs 103 Balance Sheet
Cash . . . . . . . . . . . . . . . . $ 12,046
Accounts Receivable . . . 72,196
Inventory . . . . . . . . . . . . . 186,233
Work in Progress . . . . . . 456,104
Fixed Assets . . . . . . . . . . 967,246
Total . . . . . . 1,693,825
Accounts Payable . . . . . 16,783
Long Term Debt . . . . . . . . 458,909
Total . . . . . . . 475,692
Owners Capital . . . . . . . . 352,693
Retained Earnings . . . . . 865,440
Total . . . . . .1,218,133 Let’s work our way down from the Balance Sheet down to detail project costs. We will analyze the current month for Task 64-JL-3284:<br>
Cash . . . . . . . . . . . . . . . . $ 12,046
Accounts Receivable . . . 72,196
Inventory . . . . . . . . . . . . . 186,233
Work in Progress . . . . . . 456,104
Fixed Assets . . . . . . . . . . 967,246
Total . . . . . . 1,693,825
Accounts Payable . . . . . 16,783
Long Term Debt . . . . . . . . 458,909
Total . . . . . . . 475,692
Owners Capital . . . . . . . . 352,693
Retained Earnings . . . . . 865,440
Total . . . . . .1,218,133 Let’s work our way down from the Balance Sheet down to detail project costs. We will analyze the current month for Task 64-JL-3284:<br>
104
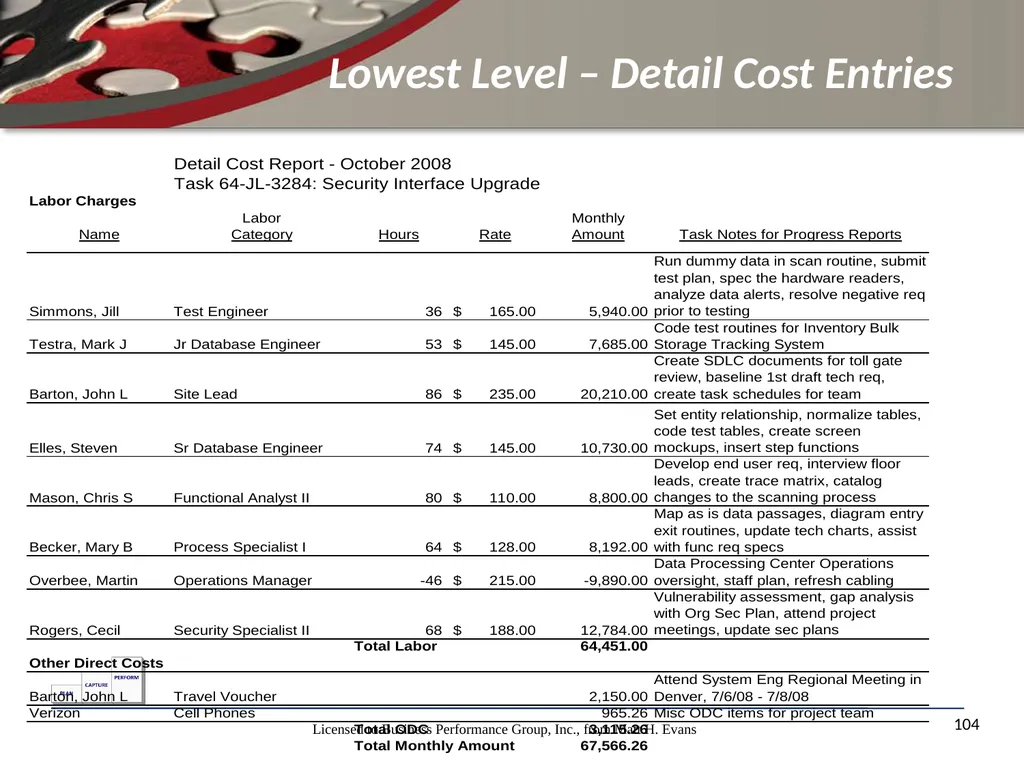
Lowest Level – Detail Cost Entries 104<br>
105
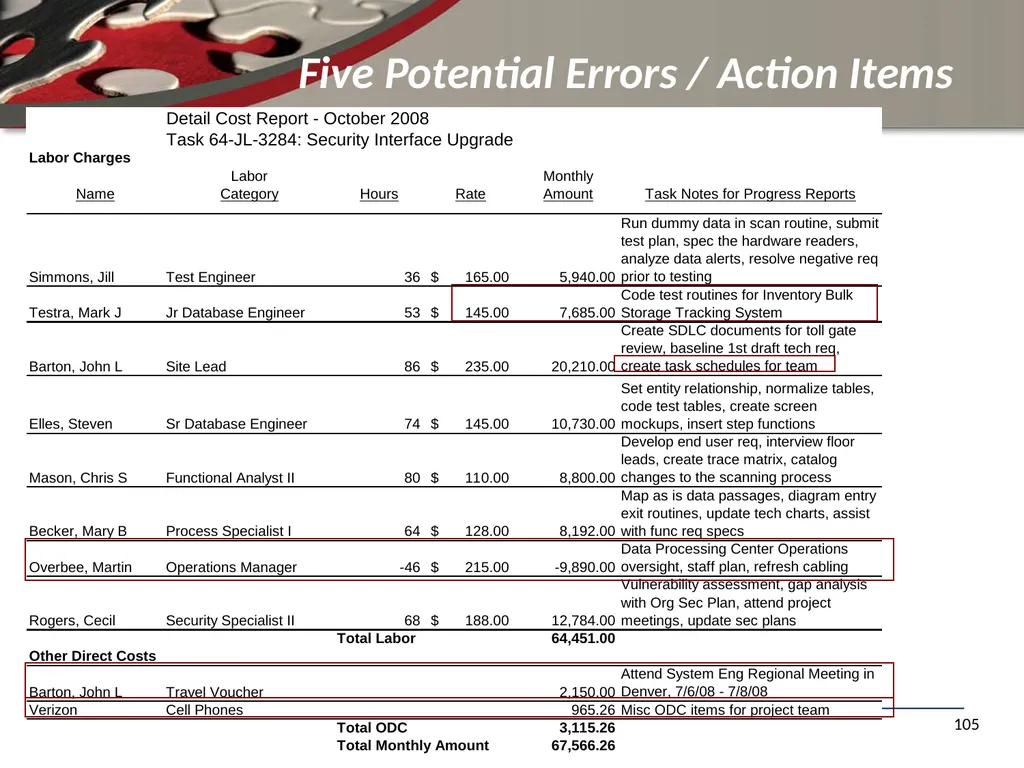
Five Potential Errors / Action Items 105<br>
106
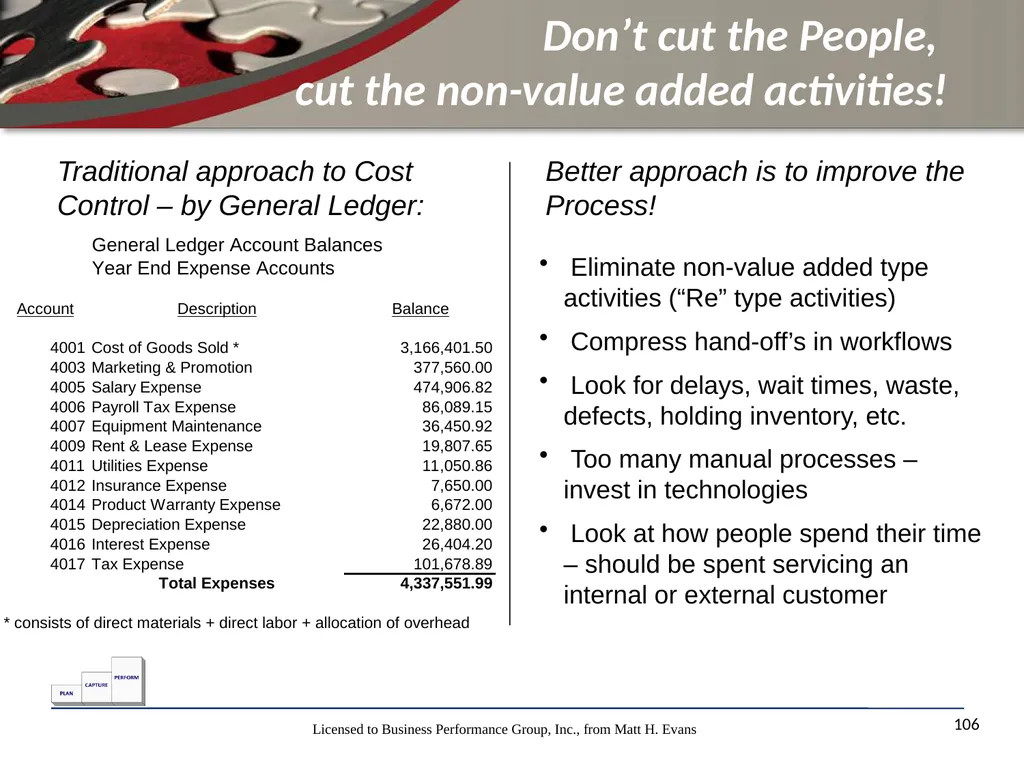
Don’t cut the People,
cut the non-value added activities! 106 Traditional approach to Cost Control – by General Ledger: Better approach is to improve the Process! Eliminate non-value added type activities (“Re” type activities)
Compress hand-off’s in workflows
Look for delays, wait times, waste, defects, holding inventory, etc.
Too many manual processes – invest in technologies
Look at how people spend their time – should be spent servicing an internal or external customer<br>
Compress hand-off’s in workflows
Look for delays, wait times, waste, defects, holding inventory, etc.
Too many manual processes – invest in technologies
Look at how people spend their time – should be spent servicing an internal or external customer<br>
107
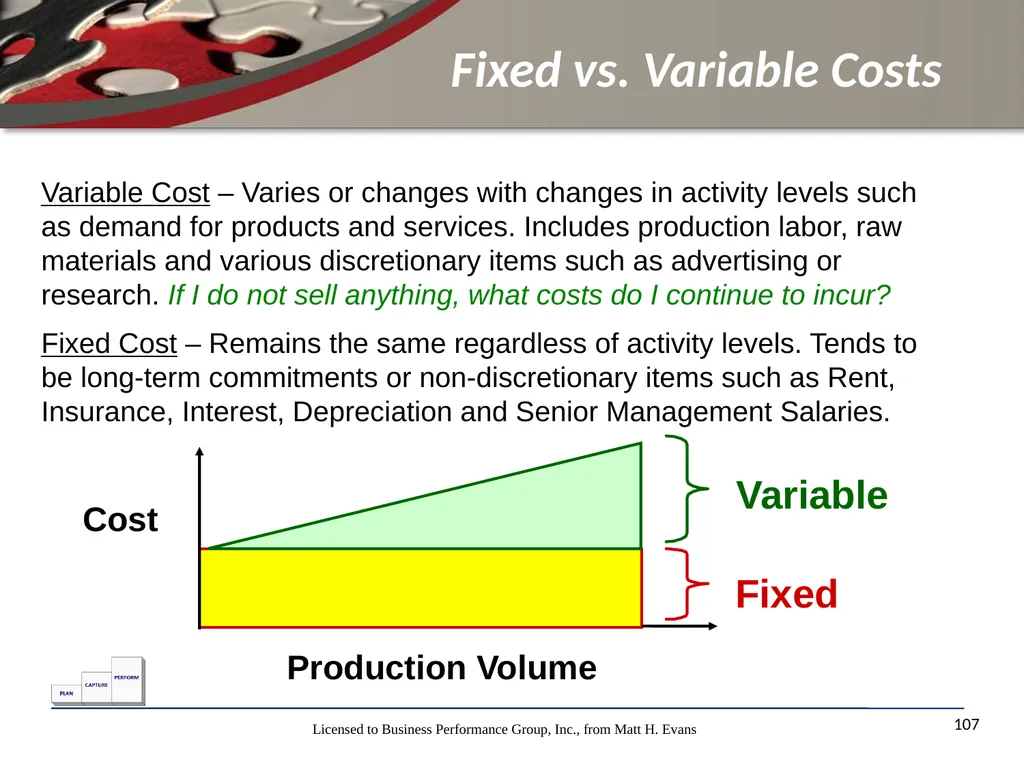
Fixed vs. Variable Costs 107 Variable Cost – Varies or changes with changes in activity levels such as demand for products and services. Includes production labor, raw materials and various discretionary items such as advertising or research. If I do not sell anything, what costs do I continue to incur?
Fixed Cost – Remains the same regardless of activity levels. Tends to be long-term commitments or non-discretionary items such as Rent, Insurance, Interest, Depreciation and Senior Management Salaries.<br>
Fixed Cost – Remains the same regardless of activity levels. Tends to be long-term commitments or non-discretionary items such as Rent, Insurance, Interest, Depreciation and Senior Management Salaries.<br>
108
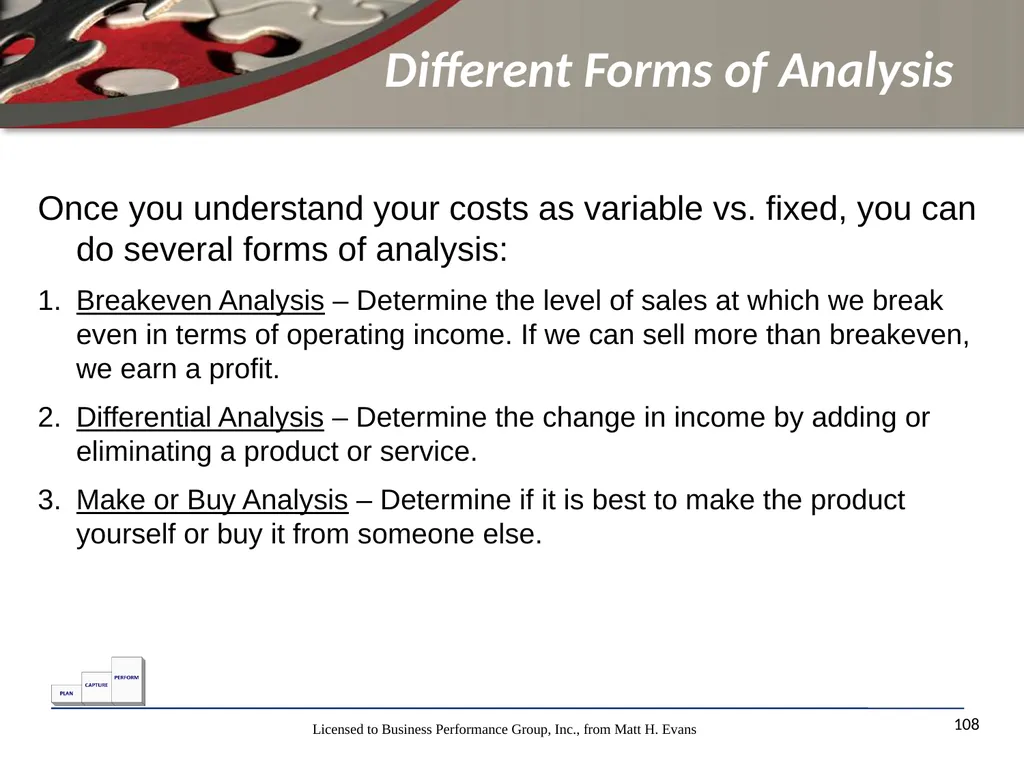
Different Forms of Analysis 108 Once you understand your costs as variable vs. fixed, you can do several forms of analysis:
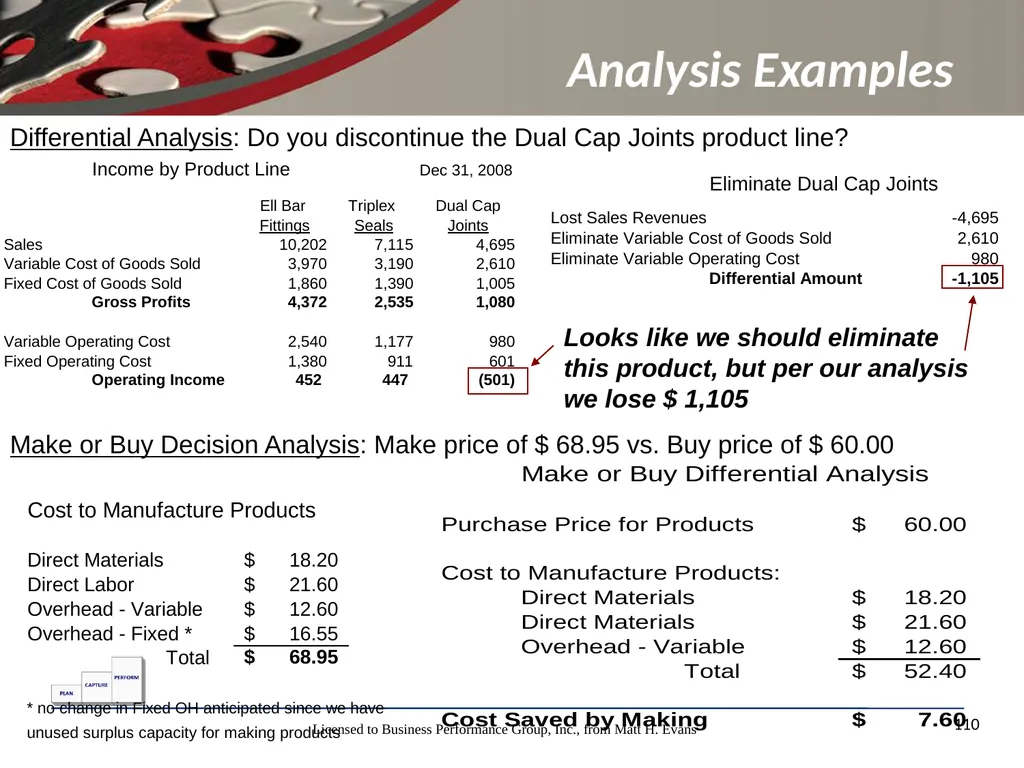
Breakeven Analysis – Determine the level of sales at which we break even in terms of operating income. If we can sell more than breakeven, we earn a profit.
Differential Analysis – Determine the change in income by adding or eliminating a product or service.
Make or Buy Analysis – Determine if it is best to make the product yourself or buy it from someone else.<br>
Breakeven Analysis – Determine the level of sales at which we break even in terms of operating income. If we can sell more than breakeven, we earn a profit.
Differential Analysis – Determine the change in income by adding or eliminating a product or service.
Make or Buy Analysis – Determine if it is best to make the product yourself or buy it from someone else.<br>
109
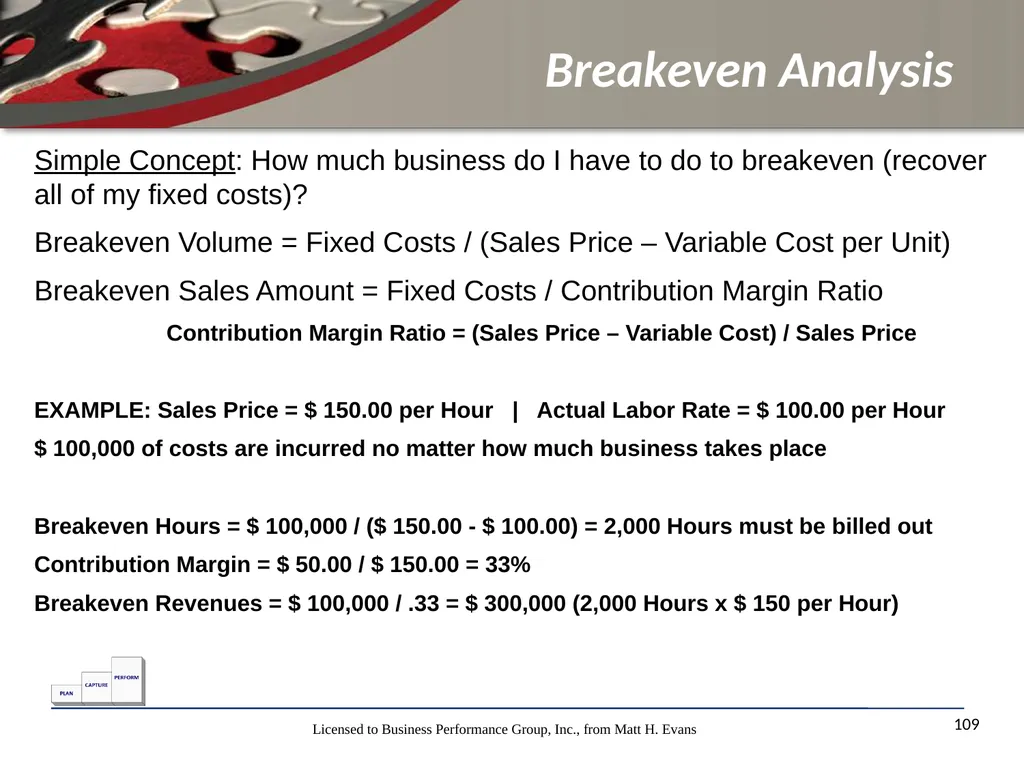
Breakeven Analysis 109 Simple Concept: How much business do I have to do to breakeven (recover all of my fixed costs)?
Breakeven Volume = Fixed Costs / (Sales Price – Variable Cost per Unit)
Breakeven Sales Amount = Fixed Costs / Contribution Margin Ratio
Contribution Margin Ratio = (Sales Price – Variable Cost) / Sales Price
EXAMPLE: Sales Price = $ 150.00 per Hour | Actual Labor Rate = $ 100.00 per Hour
$ 100,000 of costs are incurred no matter how much business takes place
Breakeven Hours = $ 100,000 / ($ 150.00 - $ 100.00) = 2,000 Hours must be billed out
Contribution Margin = $ 50.00 / $ 150.00 = 33%
Breakeven Revenues = $ 100,000 / .33 = $ 300,000 (2,000 Hours x $ 150 per Hour)<br>
Breakeven Volume = Fixed Costs / (Sales Price – Variable Cost per Unit)
Breakeven Sales Amount = Fixed Costs / Contribution Margin Ratio
Contribution Margin Ratio = (Sales Price – Variable Cost) / Sales Price
EXAMPLE: Sales Price = $ 150.00 per Hour | Actual Labor Rate = $ 100.00 per Hour
$ 100,000 of costs are incurred no matter how much business takes place
Breakeven Hours = $ 100,000 / ($ 150.00 - $ 100.00) = 2,000 Hours must be billed out
Contribution Margin = $ 50.00 / $ 150.00 = 33%
Breakeven Revenues = $ 100,000 / .33 = $ 300,000 (2,000 Hours x $ 150 per Hour)<br>
110
Analysis Examples 110 Differential Analysis: Do you discontinue the Dual Cap Joints product line? Make or Buy Decision Analysis: Make price of $ 68.95 vs. Buy price of $ 60.00 Looks like we should eliminate this product, but per our analysis we lose $ 1,105<br>
111
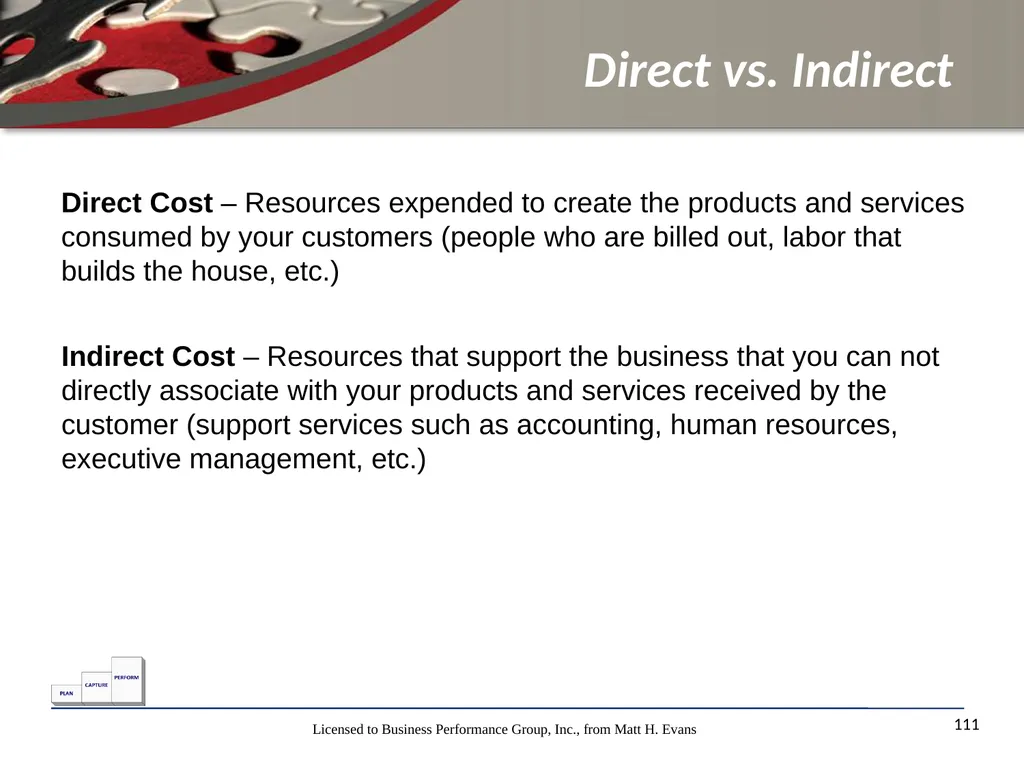
Direct vs. Indirect 111 Direct Cost – Resources expended to create the products and services consumed by your customers (people who are billed out, labor that builds the house, etc.) Indirect Cost – Resources that support the business that you can not directly associate with your products and services received by the customer (support services such as accounting, human resources, executive management, etc.)<br>
112
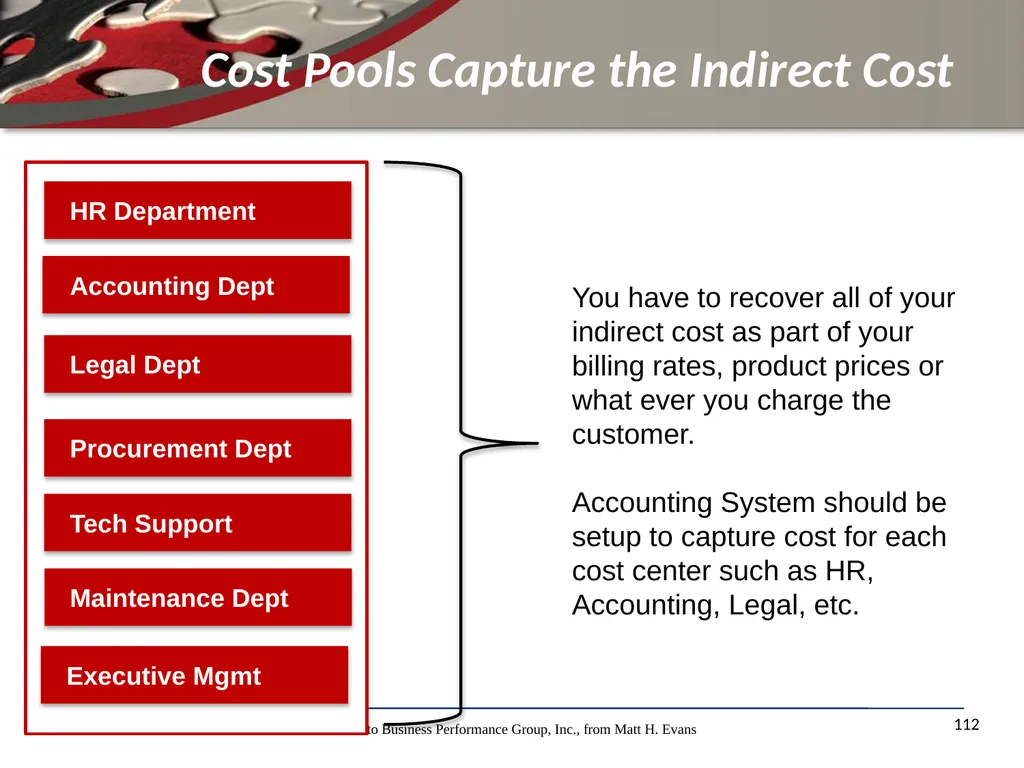
Cost Pools Capture the Indirect Cost 112 HR Department Accounting Dept Legal Dept Procurement Dept Tech Support Maintenance Dept Executive Mgmt You have to recover all of your indirect cost as part of your billing rates, product prices or what ever you charge the customer.
Accounting System should be setup to capture cost for each cost center such as HR, Accounting, Legal, etc.<br>
Accounting System should be setup to capture cost for each cost center such as HR, Accounting, Legal, etc.<br>
113
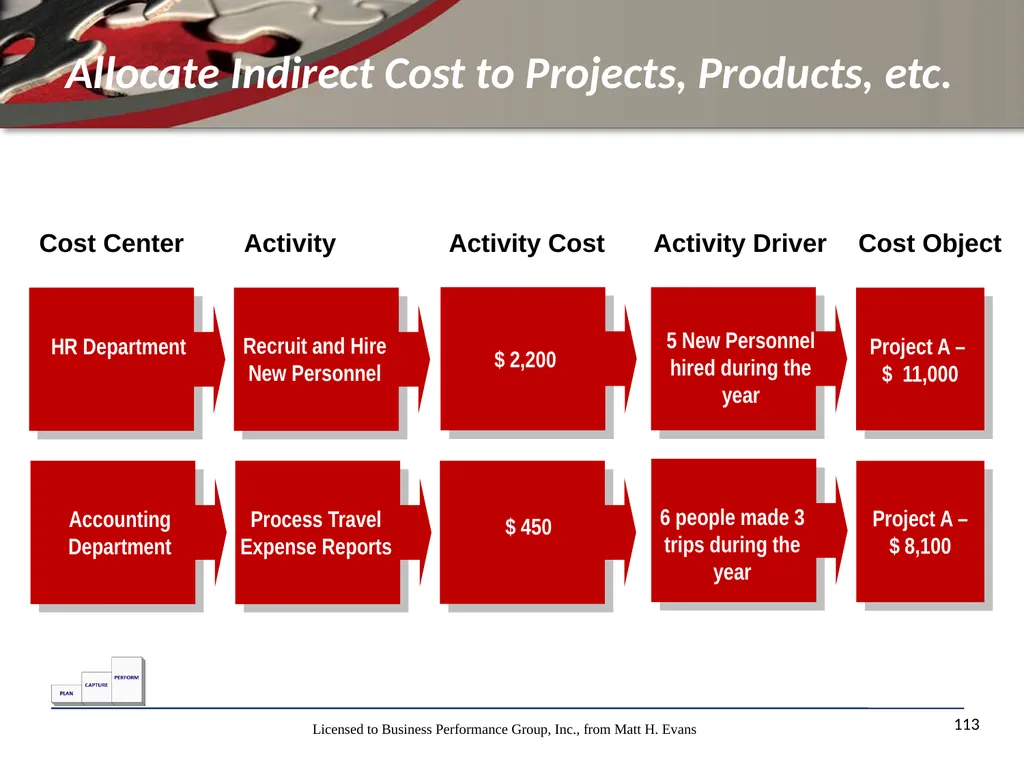
Allocate Indirect Cost to Projects, Products, etc. 113 HR Department Recruit and Hire New Personnel Accounting Department Process Travel Expense Reports $ 2,200 $ 450 Project A –
$ 11,000 Project A –
$ 8,100 5 New Personnel hired during the year 6 people made 3 trips during the year Cost Center Activity Activity Cost Activity Driver Cost Object<br>
$ 11,000 Project A –
$ 8,100 5 New Personnel hired during the year 6 people made 3 trips during the year Cost Center Activity Activity Cost Activity Driver Cost Object<br>
114
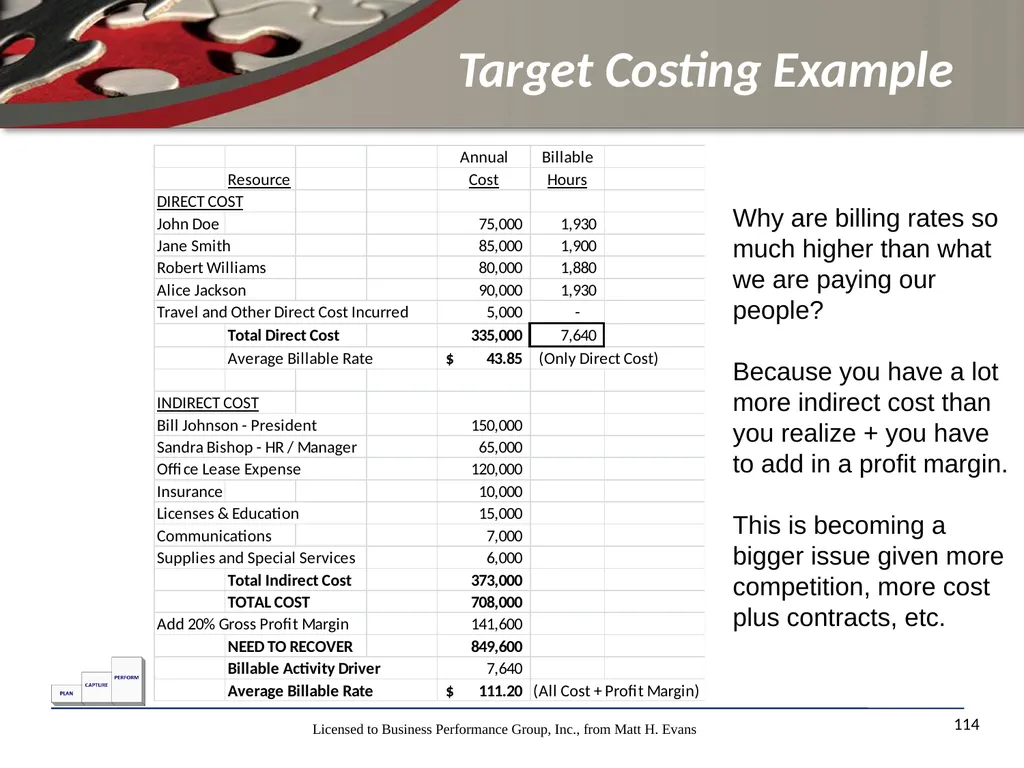
Target Costing Example 114 Why are billing rates so much higher than what we are paying our people?
Because you have a lot more indirect cost than you realize + you have to add in a profit margin.
This is becoming a bigger issue given more competition, more cost plus contracts, etc.<br>
Because you have a lot more indirect cost than you realize + you have to add in a profit margin.
This is becoming a bigger issue given more competition, more cost plus contracts, etc.<br>
115
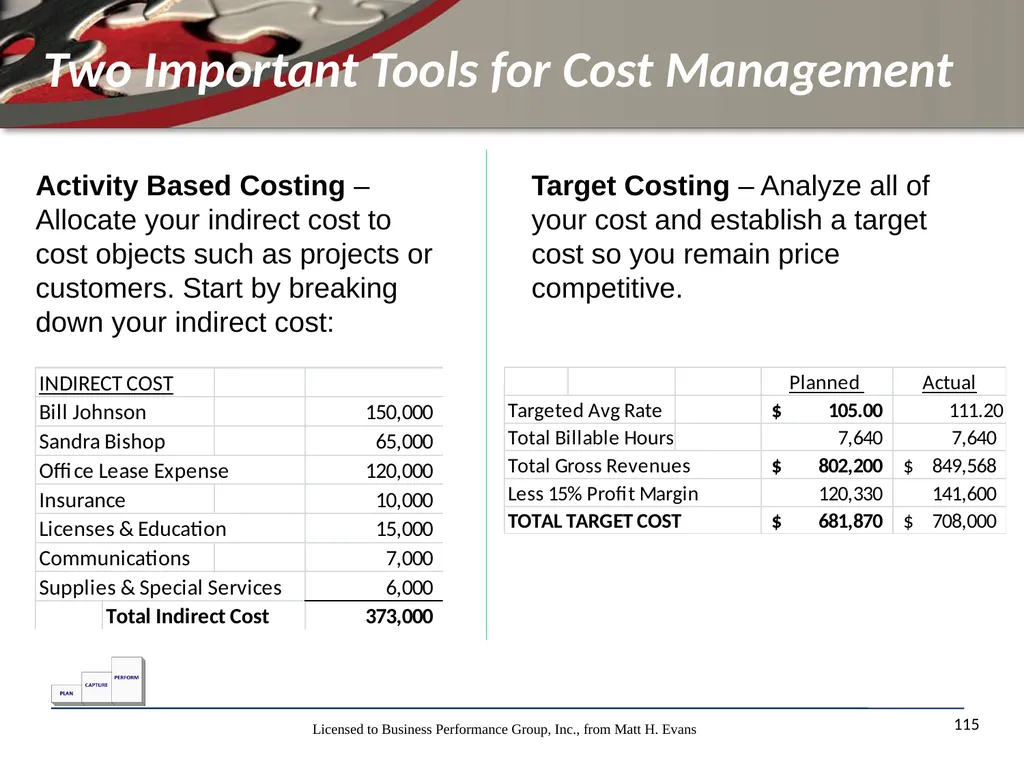
Two Important Tools for Cost Management 115 Activity Based Costing – Allocate your indirect cost to cost objects such as projects or customers. Start by breaking down your indirect cost: Target Costing – Analyze all of your cost and establish a target cost so you remain price competitive.<br>
116
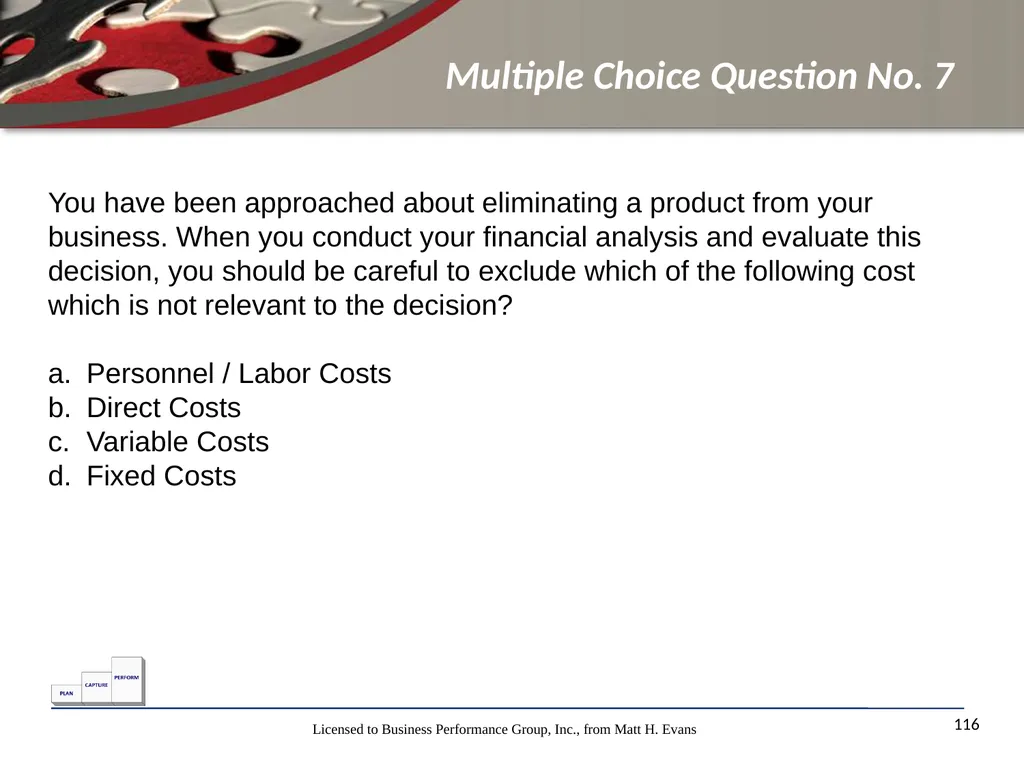
Multiple Choice Question No. 7 116 You have been approached about eliminating a product from your business. When you conduct your financial analysis and evaluate this decision, you should be careful to exclude which of the following cost which is not relevant to the decision?
Personnel / Labor Costs
Direct Costs
Variable Costs
Fixed Costs<br>
Personnel / Labor Costs
Direct Costs
Variable Costs
Fixed Costs<br>
117
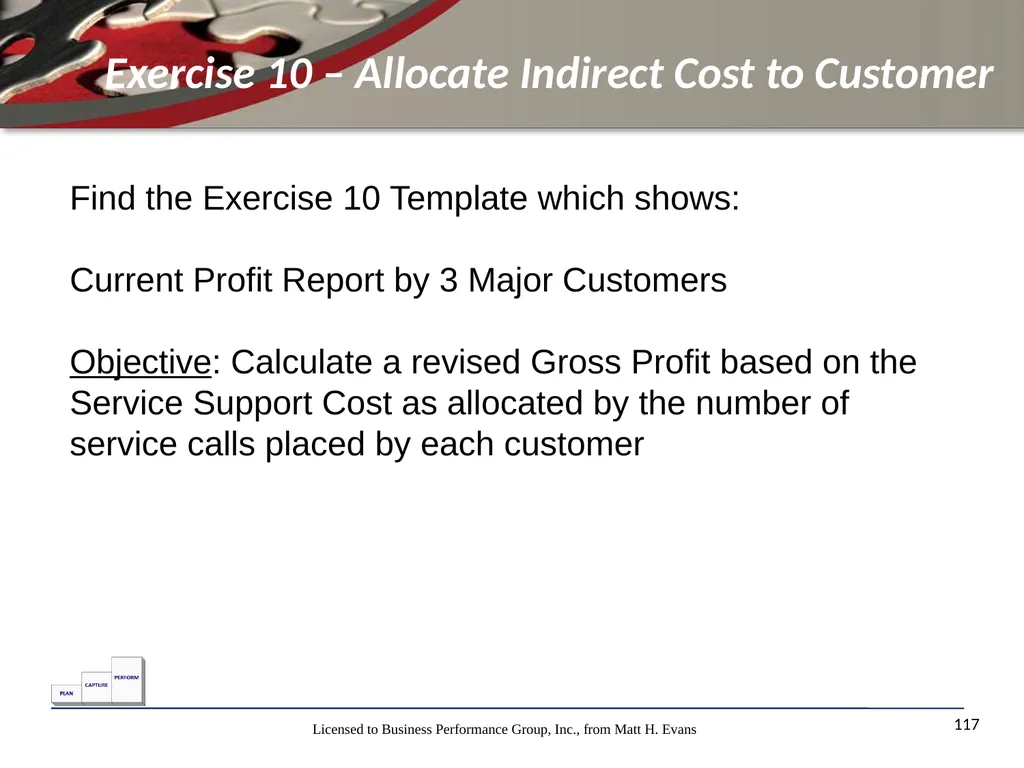
Exercise 10 – Allocate Indirect Cost to Customer 117 Find the Exercise 10 Template which shows:
Current Profit Report by 3 Major Customers
Objective: Calculate a revised Gross Profit based on the Service Support Cost as allocated by the number of service calls placed by each customer<br>
Current Profit Report by 3 Major Customers
Objective: Calculate a revised Gross Profit based on the Service Support Cost as allocated by the number of service calls placed by each customer<br>
118
Module 10 118 End of Day 1 – Quick Recap<br>
119
What we covered –
sequence of events 119 Accounting is not complicated – think about your Check Book. Cash flows in and out > Record the Transactions > Classify the Transactions > Generate Financial Statements
Financial Statements:
Balance Sheet – Use to evaluate financial condition of company
Income Statement – Use to assess profitability
Statement of Cash Flow – Use to see how the company obtains and applies its cash flow
Reading Financial Statements – Focus on the Operations to filter out the noise that is buried throughout the financial statements.
Market Value of Business – Not related to earnings, but has more to do with cash flows from long term investments<br>
Financial Statements:
Balance Sheet – Use to evaluate financial condition of company
Income Statement – Use to assess profitability
Statement of Cash Flow – Use to see how the company obtains and applies its cash flow
Reading Financial Statements – Focus on the Operations to filter out the noise that is buried throughout the financial statements.
Market Value of Business – Not related to earnings, but has more to do with cash flows from long term investments<br>
120
What we covered –
continued 120 Return on Investment must exceed Cost of Capital – Two very important financial calculations (ROI and Cost of Capital)
Three Techniques to Analyzing Financial Statements: Vertical Analysis, Horizontal Analysis and Ratio Analysis
Specific Account Analysis – Cash, Receivables and Inventory. This is how you manage the Working Capital of a company.
EBITDA – This is a very common benefit stream used to assign value to a private company. Worked through 6 multiple choice questions and 9 exercises on Day 1<br>
Three Techniques to Analyzing Financial Statements: Vertical Analysis, Horizontal Analysis and Ratio Analysis
Specific Account Analysis – Cash, Receivables and Inventory. This is how you manage the Working Capital of a company.
EBITDA – This is a very common benefit stream used to assign value to a private company. Worked through 6 multiple choice questions and 9 exercises on Day 1<br>