
Financial Analysis & Trust Fund Forecasts in the
CM
Published · 35 slides · 0 views
1 / 1


Description
Financial Analysis Trust Fund Forecasts in the Time of COVID-19 Connecticut Paid Family Medical Leave Insurance Authority Introduction Update to Implementing Paid Family and Medical Leave Insurance Connecticut, produced in 2016 Focus
Related Topics
Share
Embed code
Download this presentation From Below
"Financial Analysis & Trust Fund Forecasts in the" is the property of its rightful owner. Permission is granted to download and print the materials on this website for personal, non-commercial use only, and to display it on your personal computer provided you do not modify the materials and that you retain all copyright notices contained in the materials. By downloading content from our website, you accept the terms of this agreement.
Presentation Transcript
01
Financial Analysis & Trust Fund Forecasts in the Time of COVID-19 Connecticut Paid Family & Medical Leave Insurance Authority<br>
02
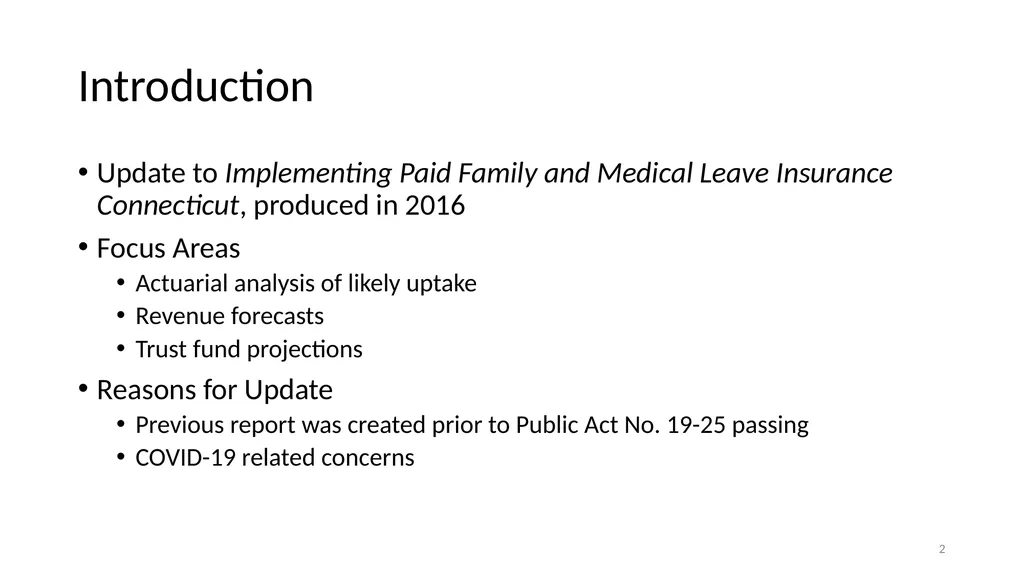
Introduction Update to Implementing Paid Family and Medical Leave Insurance Connecticut, produced in 2016
Focus Areas
Actuarial analysis of likely uptake
Revenue forecasts
Trust fund projections
Reasons for Update
Previous report was created prior to Public Act No. 19-25 passing
COVID-19 related concerns 2<br>
Focus Areas
Actuarial analysis of likely uptake
Revenue forecasts
Trust fund projections
Reasons for Update
Previous report was created prior to Public Act No. 19-25 passing
COVID-19 related concerns 2<br>
03
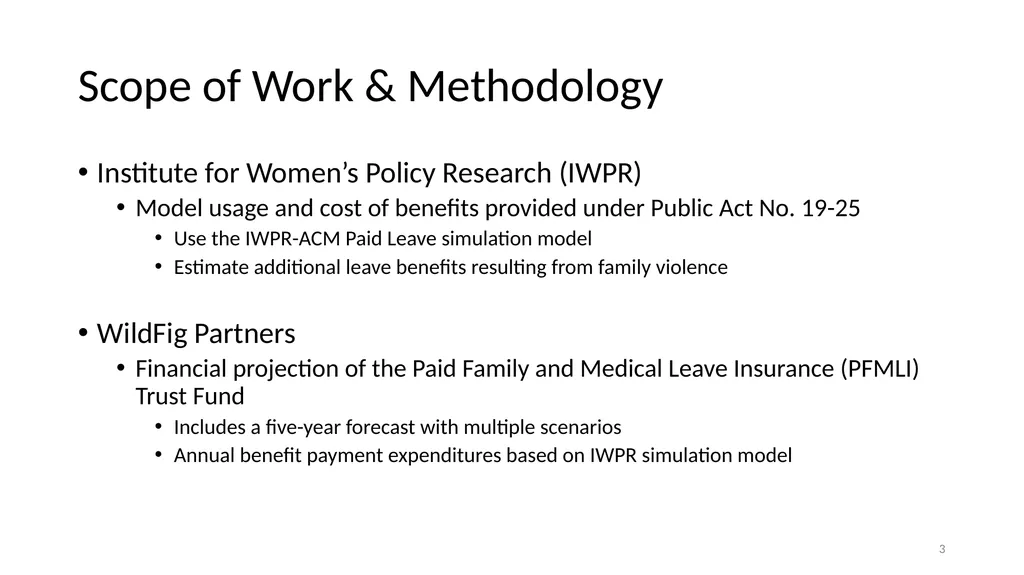
Scope of Work & Methodology Institute for Women’s Policy Research (IWPR)
Model usage and cost of benefits provided under Public Act No. 19-25
Use the IWPR-ACM Paid Leave simulation model
Estimate additional leave benefits resulting from family violence
WildFig Partners
Financial projection of the Paid Family and Medical Leave Insurance (PFMLI) Trust Fund
Includes a five-year forecast with multiple scenarios
Annual benefit payment expenditures based on IWPR simulation model 3<br>
Model usage and cost of benefits provided under Public Act No. 19-25
Use the IWPR-ACM Paid Leave simulation model
Estimate additional leave benefits resulting from family violence
WildFig Partners
Financial projection of the Paid Family and Medical Leave Insurance (PFMLI) Trust Fund
Includes a five-year forecast with multiple scenarios
Annual benefit payment expenditures based on IWPR simulation model 3<br>
04
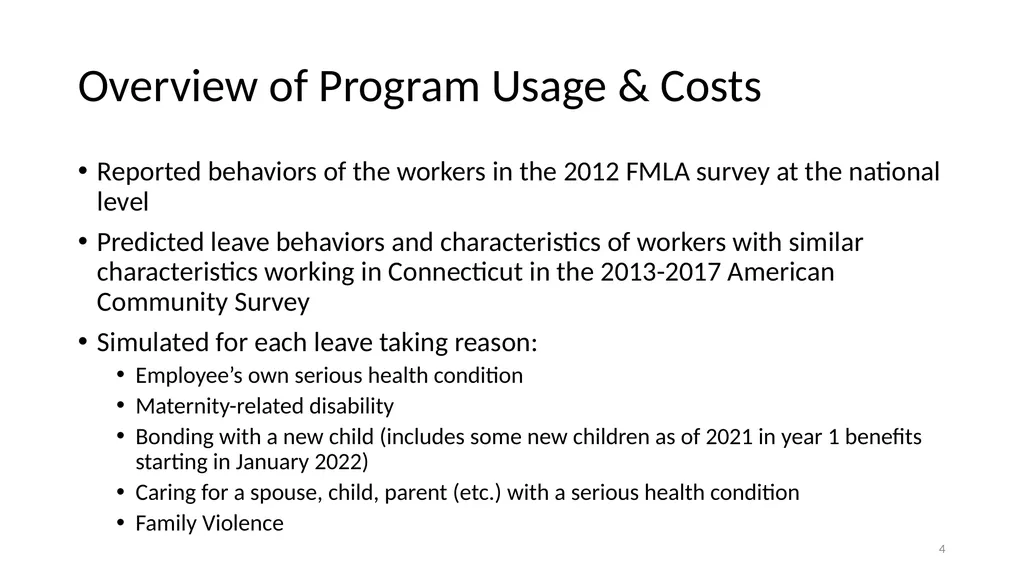
Overview of Program Usage & Costs Reported behaviors of the workers in the 2012 FMLA survey at the national level
Predicted leave behaviors and characteristics of workers with similar characteristics working in Connecticut in the 2013-2017 American Community Survey
Simulated for each leave taking reason:
Employee’s own serious health condition
Maternity-related disability
Bonding with a new child (includes some new children as of 2021 in year 1 benefits starting in January 2022)
Caring for a spouse, child, parent (etc.) with a serious health condition
Family Violence 4<br>
Predicted leave behaviors and characteristics of workers with similar characteristics working in Connecticut in the 2013-2017 American Community Survey
Simulated for each leave taking reason:
Employee’s own serious health condition
Maternity-related disability
Bonding with a new child (includes some new children as of 2021 in year 1 benefits starting in January 2022)
Caring for a spouse, child, parent (etc.) with a serious health condition
Family Violence 4<br>
05
Total benefits paid is estimated as 6% higher under COVID-19 take-up compared to baseline. 5 Many of the additional leaves are for family care which tend to be shorter in duration.<br>
06
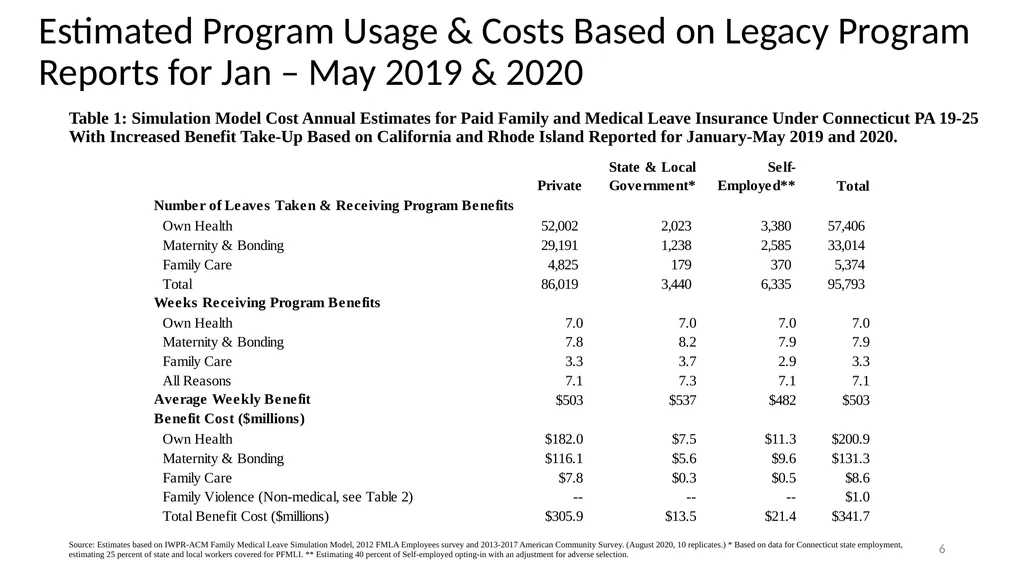
Estimated Program Usage & Costs Based on Legacy Program Reports for Jan – May 2019 & 2020 Table 1: Simulation Model Cost Annual Estimates for Paid Family and Medical Leave Insurance Under Connecticut PA 19-25 With Increased Benefit Take-Up Based on California and Rhode Island Reported for January-May 2019 and 2020. 6 Source: Estimates based on IWPR-ACM Family Medical Leave Simulation Model, 2012 FMLA Employees survey and 2013-2017 American Community Survey. (August 2020, 10 replicates.) * Based on data for Connecticut state employment, estimating 25 percent of state and local workers covered for PFMLI. ** Estimating 40 percent of Self-employed opting-in with an adjustment for adverse selection.<br>
07
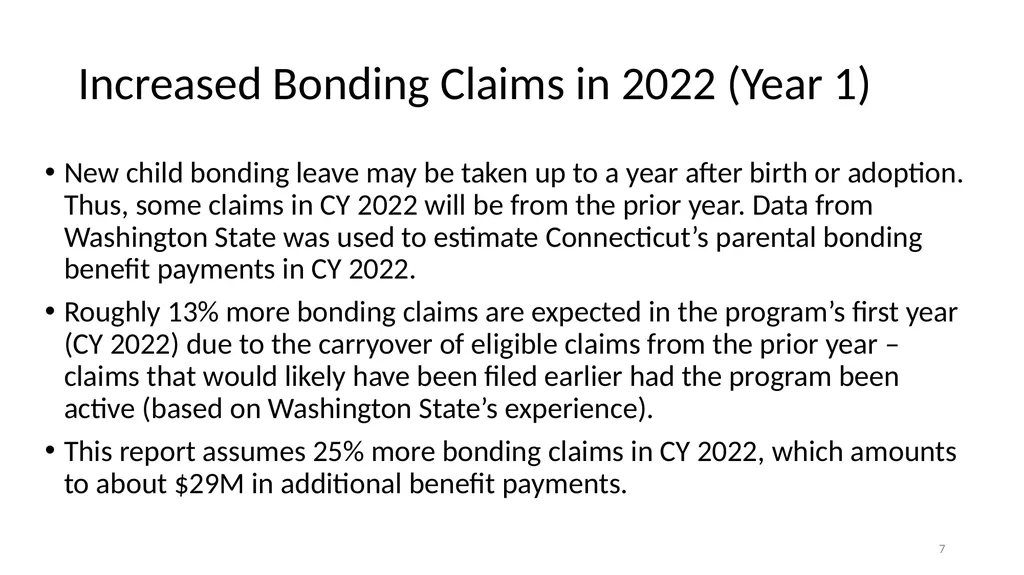
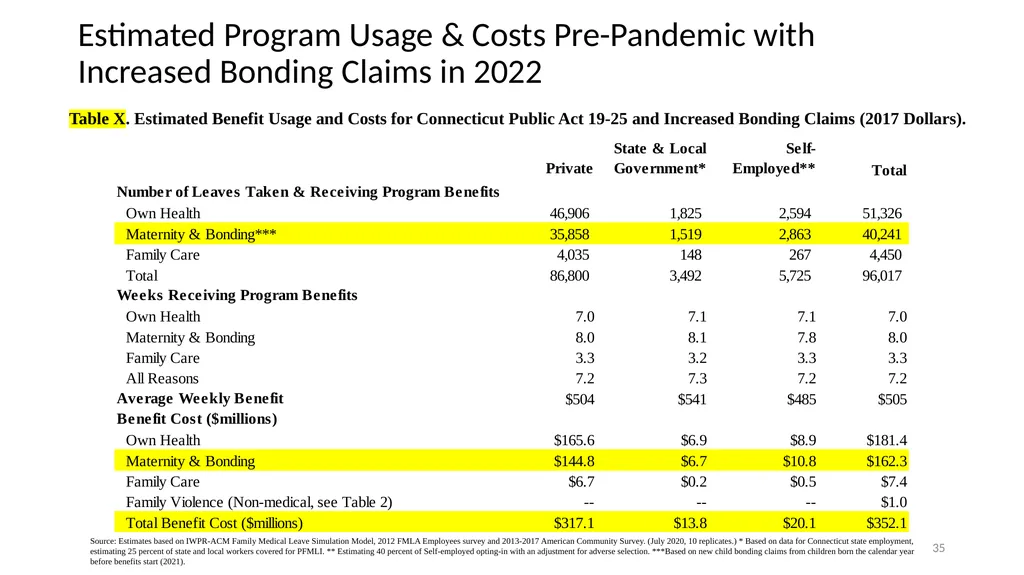
Increased Bonding Claims in 2022 (Year 1) New child bonding leave may be taken up to a year after birth or adoption. Thus, some claims in CY 2022 will be from the prior year. Data from Washington State was used to estimate Connecticut’s parental bonding benefit payments in CY 2022.
Roughly 13% more bonding claims are expected in the program’s first year (CY 2022) due to the carryover of eligible claims from the prior year – claims that would likely have been filed earlier had the program been active (based on Washington State’s experience).
This report assumes 25% more bonding claims in CY 2022, which amounts to about $29M in additional benefit payments. 7<br>
Roughly 13% more bonding claims are expected in the program’s first year (CY 2022) due to the carryover of eligible claims from the prior year – claims that would likely have been filed earlier had the program been active (based on Washington State’s experience).
This report assumes 25% more bonding claims in CY 2022, which amounts to about $29M in additional benefit payments. 7<br>
08
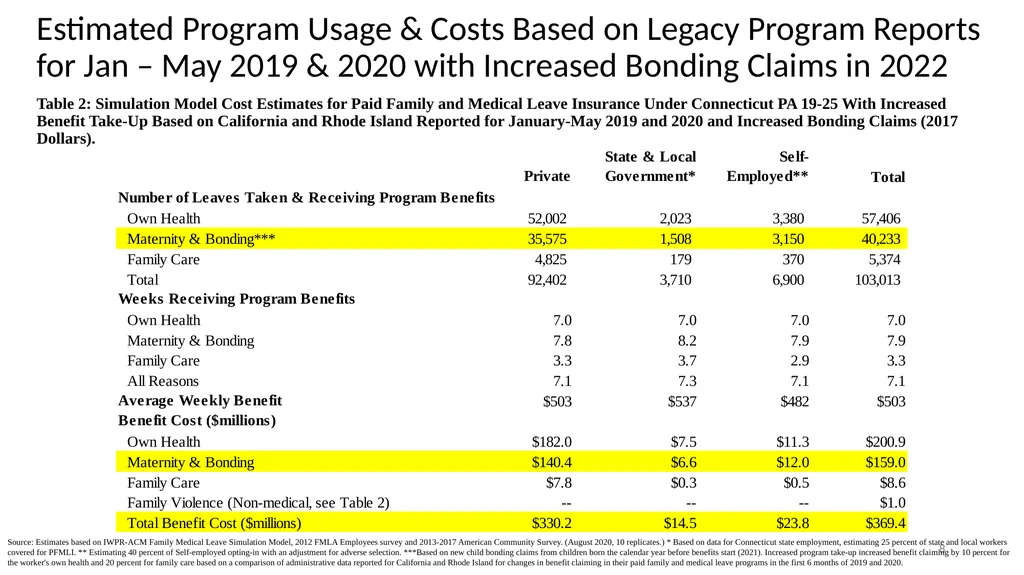
8 Table 2: Simulation Model Cost Estimates for Paid Family and Medical Leave Insurance Under Connecticut PA 19-25 With Increased Benefit Take-Up Based on California and Rhode Island Reported for January-May 2019 and 2020 and Increased Bonding Claims (2017 Dollars). Estimated Program Usage & Costs Based on Legacy Program Reports for Jan – May 2019 & 2020 with Increased Bonding Claims in 2022 Source: Estimates based on IWPR-ACM Family Medical Leave Simulation Model, 2012 FMLA Employees survey and 2013-2017 American Community Survey. (August 2020, 10 replicates.) * Based on data for Connecticut state employment, estimating 25 percent of state and local workers covered for PFMLI. ** Estimating 40 percent of Self-employed opting-in with an adjustment for adverse selection. ***Based on new child bonding claims from children born the calendar year before benefits start (2021). Increased program take-up increased benefit claiming by 10 percent for the worker's own health and 20 percent for family care based on a comparison of administrative data reported for California and Rhode Island for changes in benefit claiming in their paid family and medical leave programs in the first 6 months of 2019 and 2020.<br>
09
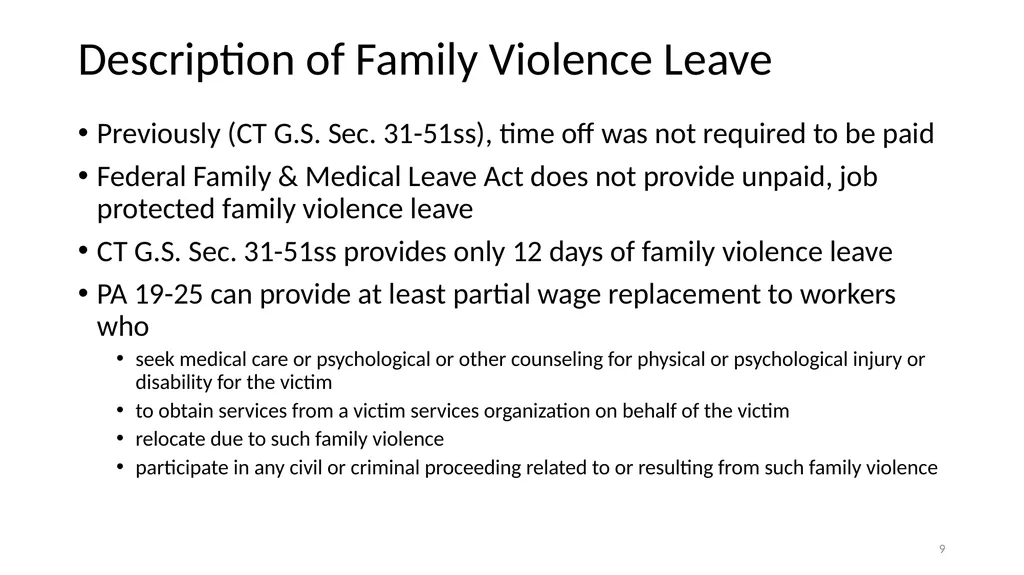
Description of Family Violence Leave Previously (CT G.S. Sec. 31-51ss), time off was not required to be paid
Federal Family & Medical Leave Act does not provide unpaid, job protected family violence leave
CT G.S. Sec. 31-51ss provides only 12 days of family violence leave
PA 19-25 can provide at least partial wage replacement to workers who
seek medical care or psychological or other counseling for physical or psychological injury or disability for the victim
to obtain services from a victim services organization on behalf of the victim
relocate due to such family violence
participate in any civil or criminal proceeding related to or resulting from such family violence 9<br>
Federal Family & Medical Leave Act does not provide unpaid, job protected family violence leave
CT G.S. Sec. 31-51ss provides only 12 days of family violence leave
PA 19-25 can provide at least partial wage replacement to workers who
seek medical care or psychological or other counseling for physical or psychological injury or disability for the victim
to obtain services from a victim services organization on behalf of the victim
relocate due to such family violence
participate in any civil or criminal proceeding related to or resulting from such family violence 9<br>
10
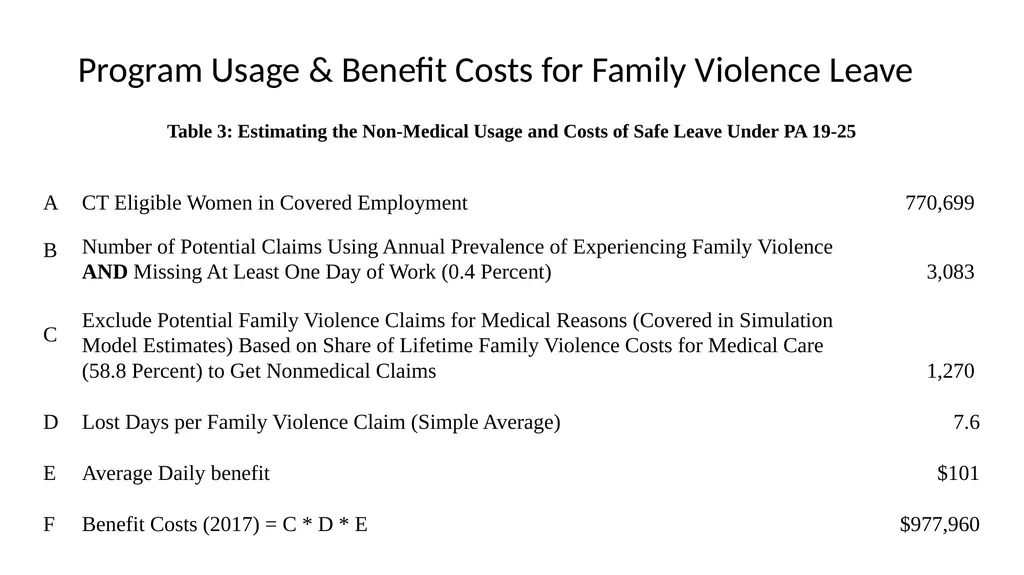
Program Usage & Benefit Costs for Family Violence Leave Table 3: Estimating the Non-Medical Usage and Costs of Safe Leave Under PA 19-25 10<br>
11
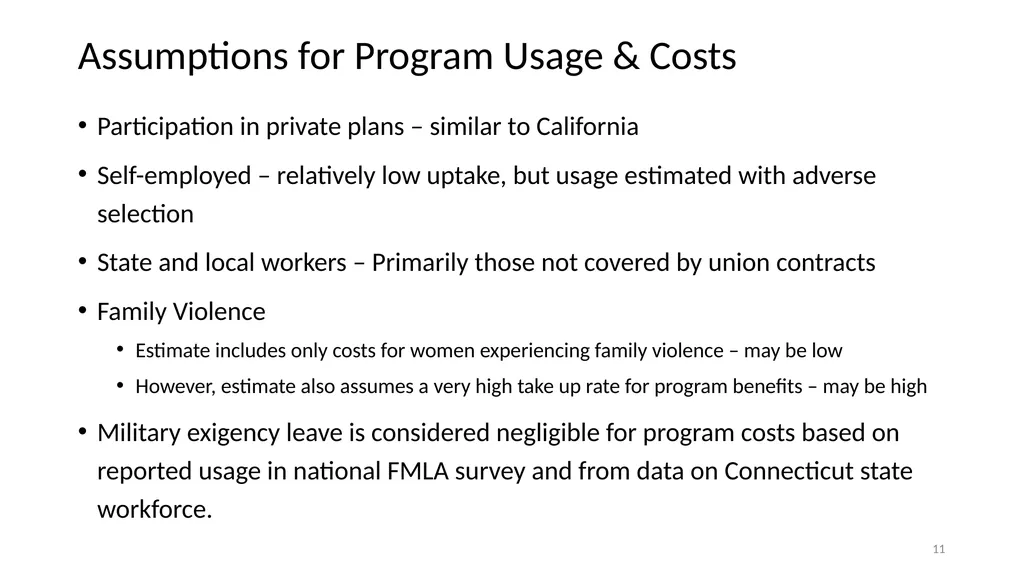
Assumptions for Program Usage & Costs Participation in private plans – similar to California
Self-employed – relatively low uptake, but usage estimated with adverse selection
State and local workers – Primarily those not covered by union contracts
Family Violence
Estimate includes only costs for women experiencing family violence – may be low
However, estimate also assumes a very high take up rate for program benefits – may be high
Military exigency leave is considered negligible for program costs based on reported usage in national FMLA survey and from data on Connecticut state workforce. 11<br>
Self-employed – relatively low uptake, but usage estimated with adverse selection
State and local workers – Primarily those not covered by union contracts
Family Violence
Estimate includes only costs for women experiencing family violence – may be low
However, estimate also assumes a very high take up rate for program benefits – may be high
Military exigency leave is considered negligible for program costs based on reported usage in national FMLA survey and from data on Connecticut state workforce. 11<br>
12
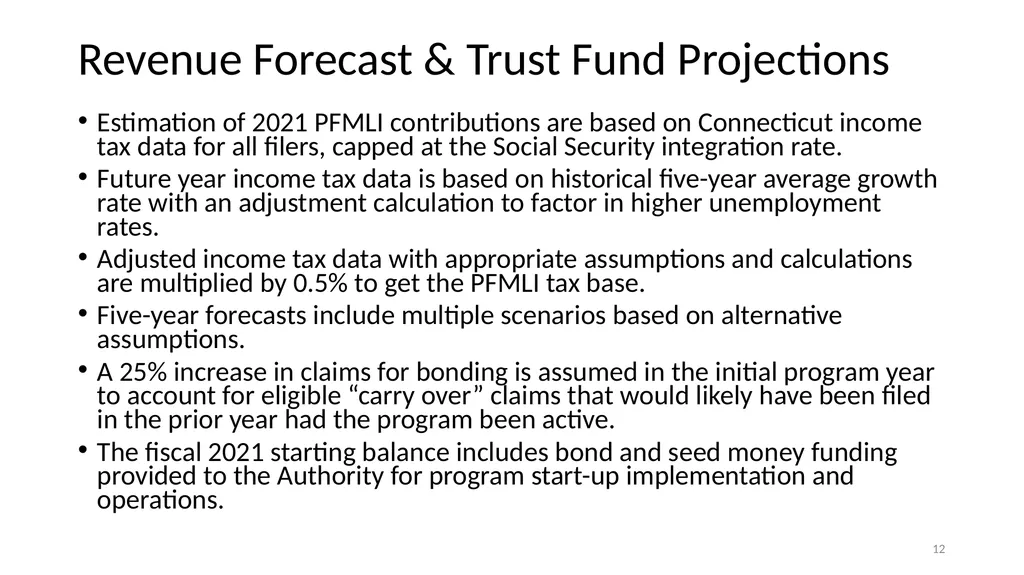
Revenue Forecast & Trust Fund Projections Estimation of 2021 PFMLI contributions are based on Connecticut income tax data for all filers, capped at the Social Security integration rate.
Future year income tax data is based on historical five-year average growth rate with an adjustment calculation to factor in higher unemployment rates.
Adjusted income tax data with appropriate assumptions and calculations are multiplied by 0.5% to get the PFMLI tax base.
Five-year forecasts include multiple scenarios based on alternative assumptions.
A 25% increase in claims for bonding is assumed in the initial program year to account for eligible “carry over” claims that would likely have been filed in the prior year had the program been active.
The fiscal 2021 starting balance includes bond and seed money funding provided to the Authority for program start-up implementation and operations. 12<br>
Future year income tax data is based on historical five-year average growth rate with an adjustment calculation to factor in higher unemployment rates.
Adjusted income tax data with appropriate assumptions and calculations are multiplied by 0.5% to get the PFMLI tax base.
Five-year forecasts include multiple scenarios based on alternative assumptions.
A 25% increase in claims for bonding is assumed in the initial program year to account for eligible “carry over” claims that would likely have been filed in the prior year had the program been active.
The fiscal 2021 starting balance includes bond and seed money funding provided to the Authority for program start-up implementation and operations. 12<br>
13
Overview of Fund Forecast Scenarios Each of the four scenarios include increased benefit utilization expenditures due to the pandemic with benefit utilization returning to non-pandemic activity levels in the final two years of forecast.
Each scenario includes start-up, major IT, and ongoing administration expenditures based on agency estimates. Certain scenarios assume higher than expected costs.
Graphs are included for each scenario showing revenue (blue line), expenditures, (orange line), and year-end Fund balance (green column).
Cost categories – including benefit expenditures – include an annual inflation factor.
Debt service costs included in each scenario average $3.3 million per year.
Non-compliance assumed to reduce collections by 1% annually. 13<br>
Each scenario includes start-up, major IT, and ongoing administration expenditures based on agency estimates. Certain scenarios assume higher than expected costs.
Graphs are included for each scenario showing revenue (blue line), expenditures, (orange line), and year-end Fund balance (green column).
Cost categories – including benefit expenditures – include an annual inflation factor.
Debt service costs included in each scenario average $3.3 million per year.
Non-compliance assumed to reduce collections by 1% annually. 13<br>
14
Scenario 1: Economic Conditions have Limited Impact on Collections; No Cost Overruns Heighted unemployment levels as of the spring and summer of 2020 are not sustained over multiple years or do not significantly depress collections.
Implementation and major costs align with projections provided by the CT PFMLI Authority in May, 2020.
Ongoing costs of administration are assumed to be a roughly two times higher than those of neighboring Rhode Island’s PFLMI program. 14<br>
Implementation and major costs align with projections provided by the CT PFMLI Authority in May, 2020.
Ongoing costs of administration are assumed to be a roughly two times higher than those of neighboring Rhode Island’s PFLMI program. 14<br>
15
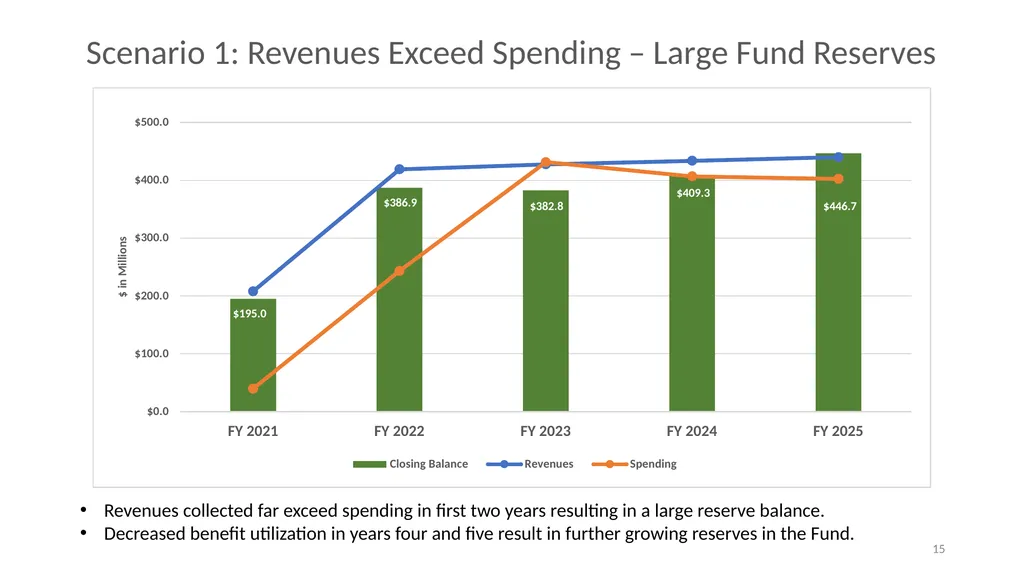
Scenario 1: Revenues Exceed Spending – Large Fund Reserves Revenues collected far exceed spending in first two years resulting in a large reserve balance.
Decreased benefit utilization in years four and five result in further growing reserves in the Fund. 15<br>
Decreased benefit utilization in years four and five result in further growing reserves in the Fund. 15<br>
16
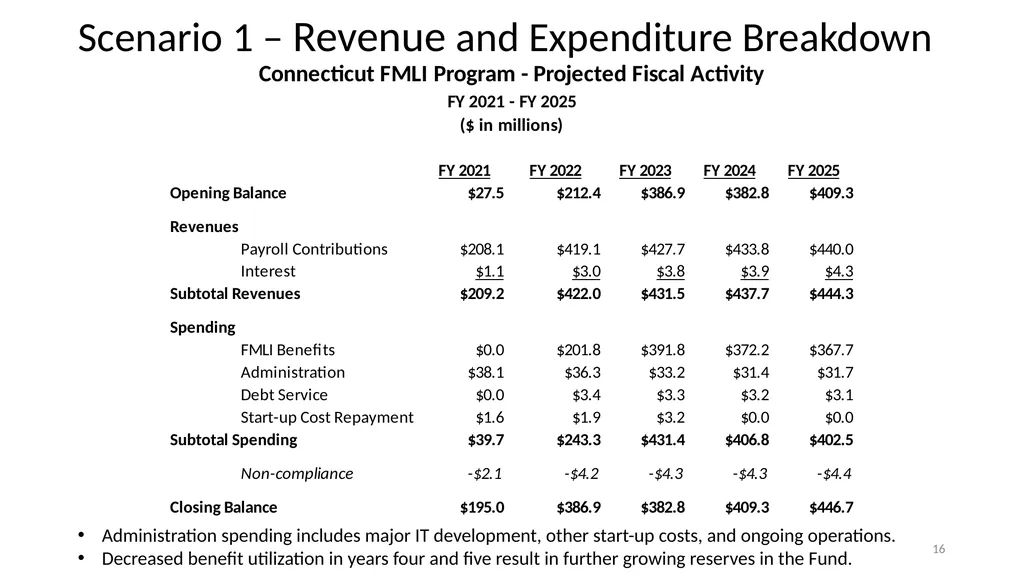
Scenario 1 – Revenue and Expenditure Breakdown 16 Administration spending includes major IT development, other start-up costs, and ongoing operations.
Decreased benefit utilization in years four and five result in further growing reserves in the Fund.<br>
Decreased benefit utilization in years four and five result in further growing reserves in the Fund.<br>
17
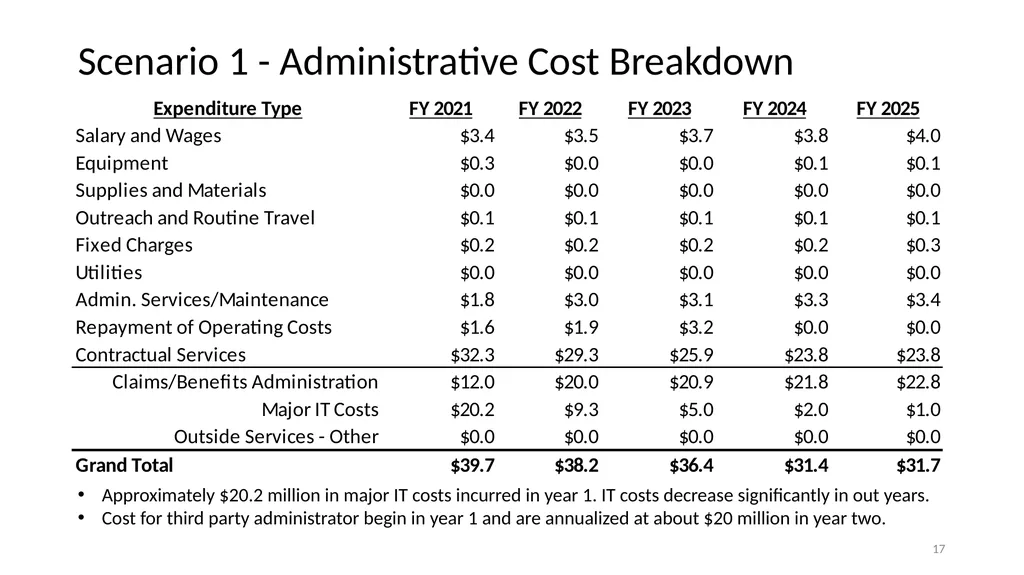
Scenario 1 - Administrative Cost Breakdown Approximately $20.2 million in major IT costs incurred in year 1. IT costs decrease significantly in out years.
Cost for third party administrator begin in year 1 and are annualized at about $20 million in year two. 17<br>
Cost for third party administrator begin in year 1 and are annualized at about $20 million in year two. 17<br>
18
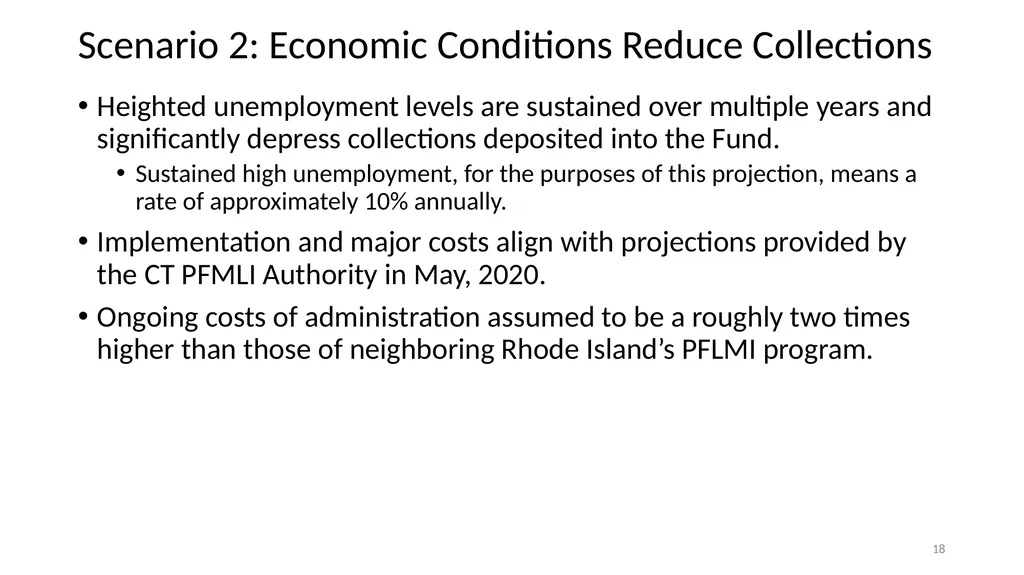
Scenario 2: Economic Conditions Reduce Collections Heighted unemployment levels are sustained over multiple years and significantly depress collections deposited into the Fund.
Sustained high unemployment, for the purposes of this projection, means a rate of approximately 10% annually.
Implementation and major costs align with projections provided by the CT PFMLI Authority in May, 2020.
Ongoing costs of administration assumed to be a roughly two times higher than those of neighboring Rhode Island’s PFLMI program. 18<br>
Sustained high unemployment, for the purposes of this projection, means a rate of approximately 10% annually.
Implementation and major costs align with projections provided by the CT PFMLI Authority in May, 2020.
Ongoing costs of administration assumed to be a roughly two times higher than those of neighboring Rhode Island’s PFLMI program. 18<br>
19
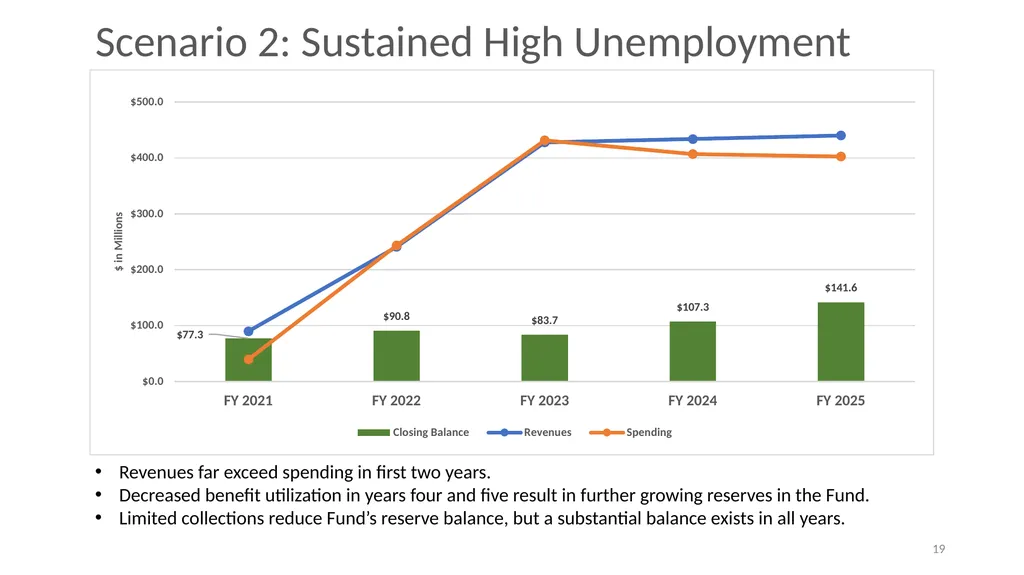
Revenues far exceed spending in first two years.
Decreased benefit utilization in years four and five result in further growing reserves in the Fund.
Limited collections reduce Fund’s reserve balance, but a substantial balance exists in all years. 19 Scenario 2: Sustained High Unemployment<br>
Decreased benefit utilization in years four and five result in further growing reserves in the Fund.
Limited collections reduce Fund’s reserve balance, but a substantial balance exists in all years. 19 Scenario 2: Sustained High Unemployment<br>
20
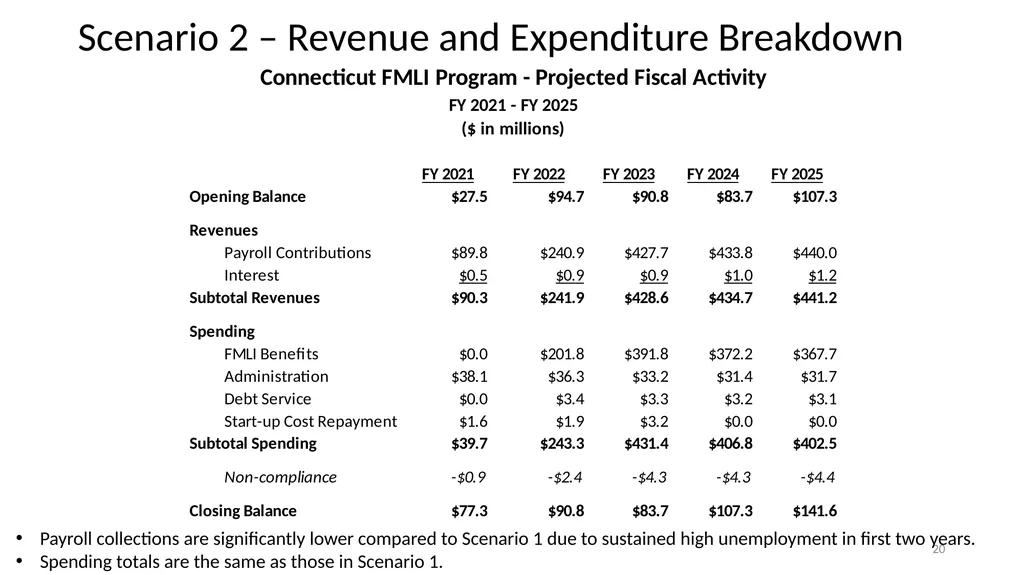
Scenario 2 – Revenue and Expenditure Breakdown Payroll collections are significantly lower compared to Scenario 1 due to sustained high unemployment in first two years.
Spending totals are the same as those in Scenario 1. 20<br>
Spending totals are the same as those in Scenario 1. 20<br>
21
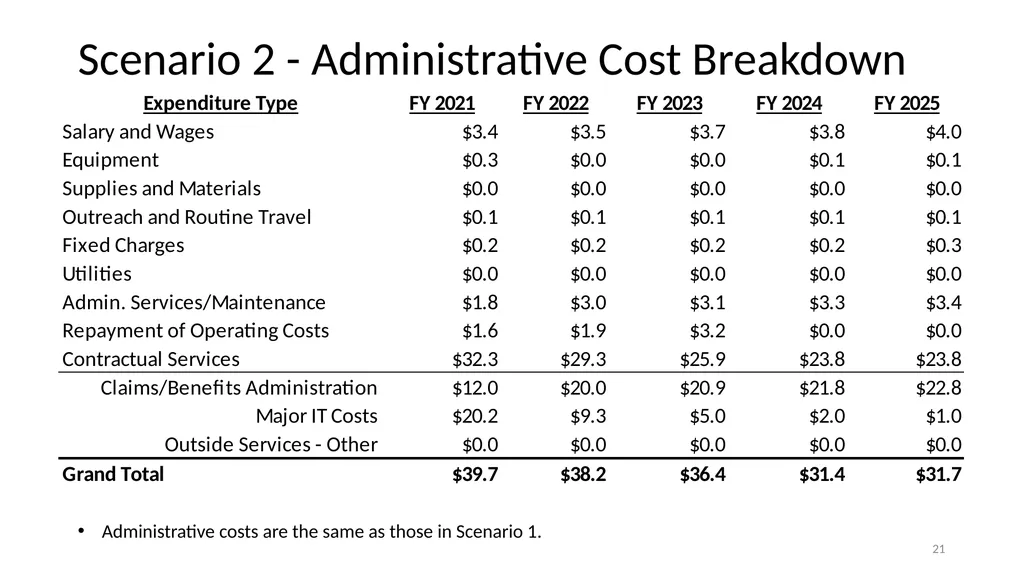
Scenario 2 - Administrative Cost Breakdown Administrative costs are the same as those in Scenario 1. 21<br>
22
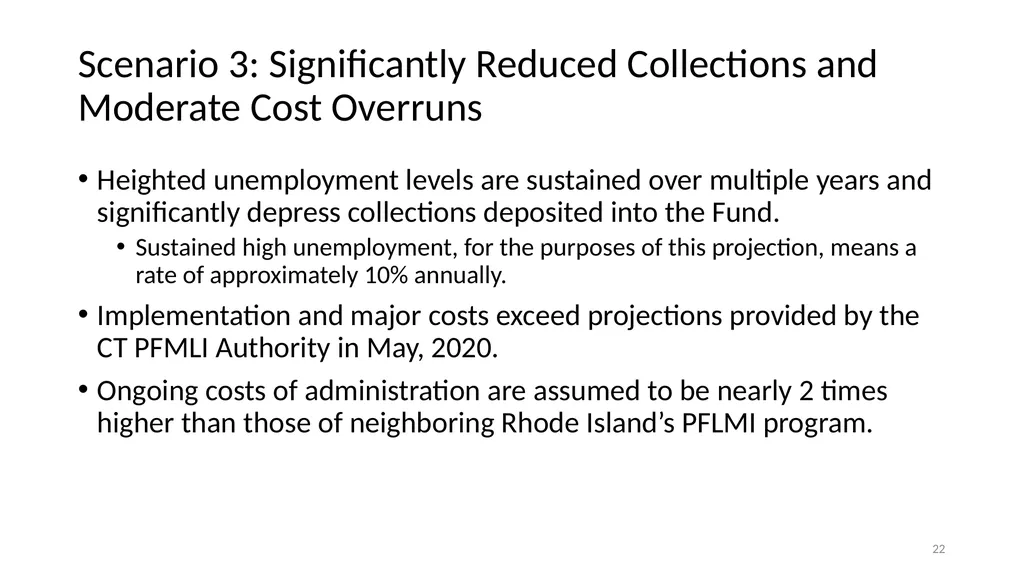
Scenario 3: Significantly Reduced Collections and Moderate Cost Overruns Heighted unemployment levels are sustained over multiple years and significantly depress collections deposited into the Fund.
Sustained high unemployment, for the purposes of this projection, means a rate of approximately 10% annually.
Implementation and major costs exceed projections provided by the CT PFMLI Authority in May, 2020.
Ongoing costs of administration are assumed to be nearly 2 times higher than those of neighboring Rhode Island’s PFLMI program. 22<br>
Sustained high unemployment, for the purposes of this projection, means a rate of approximately 10% annually.
Implementation and major costs exceed projections provided by the CT PFMLI Authority in May, 2020.
Ongoing costs of administration are assumed to be nearly 2 times higher than those of neighboring Rhode Island’s PFLMI program. 22<br>
23
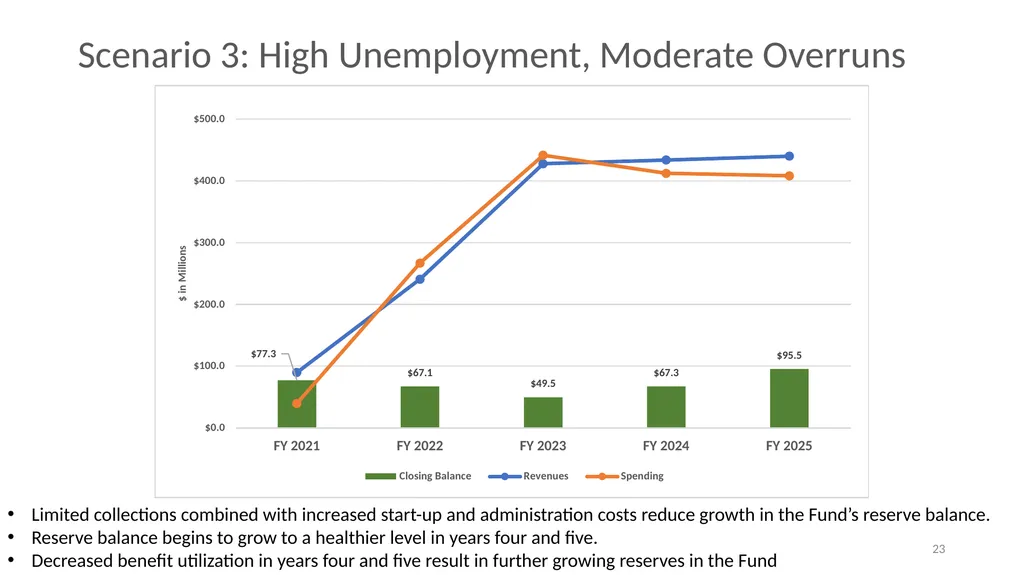
Scenario 3: High Unemployment, Moderate Overruns Limited collections combined with increased start-up and administration costs reduce growth in the Fund’s reserve balance.
Reserve balance begins to grow to a healthier level in years four and five.
Decreased benefit utilization in years four and five result in further growing reserves in the Fund 23<br>
Reserve balance begins to grow to a healthier level in years four and five.
Decreased benefit utilization in years four and five result in further growing reserves in the Fund 23<br>
24
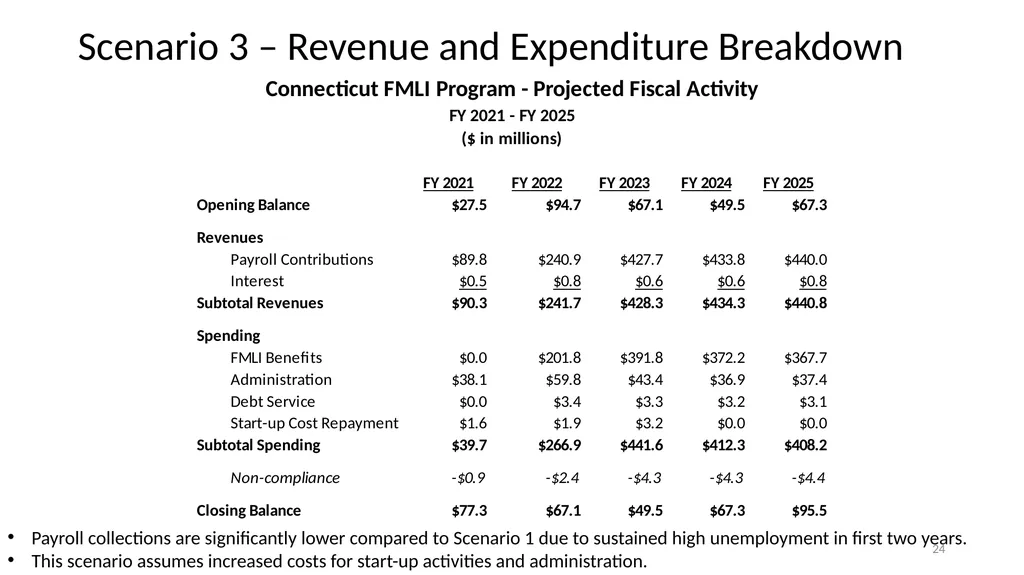
Scenario 3 – Revenue and Expenditure Breakdown Payroll collections are significantly lower compared to Scenario 1 due to sustained high unemployment in first two years.
This scenario assumes increased costs for start-up activities and administration. 24<br>
This scenario assumes increased costs for start-up activities and administration. 24<br>
25
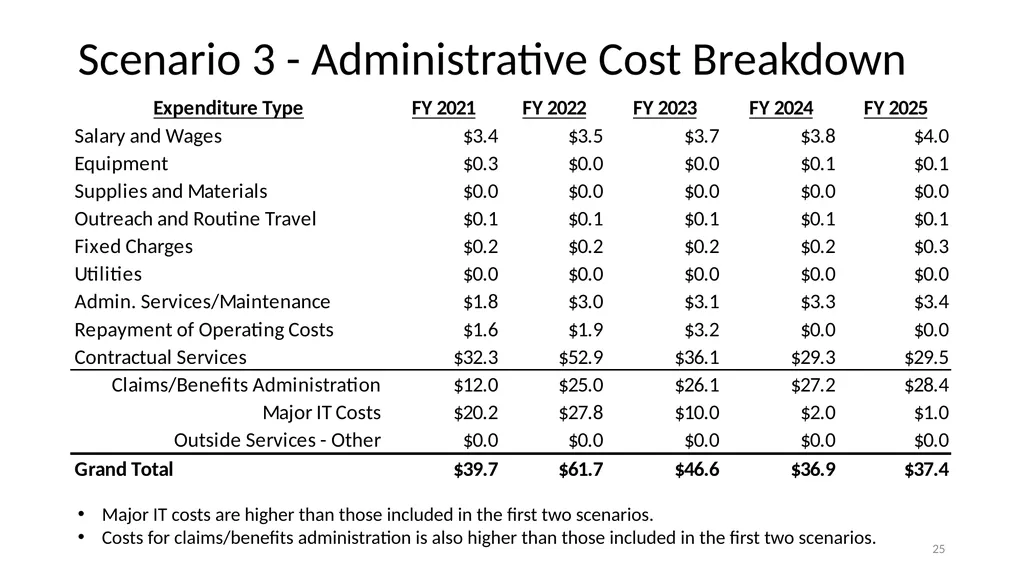
Scenario 3 - Administrative Cost Breakdown 25 Major IT costs are higher than those included in the first two scenarios.
Costs for claims/benefits administration is also higher than those included in the first two scenarios.<br>
Costs for claims/benefits administration is also higher than those included in the first two scenarios.<br>
26
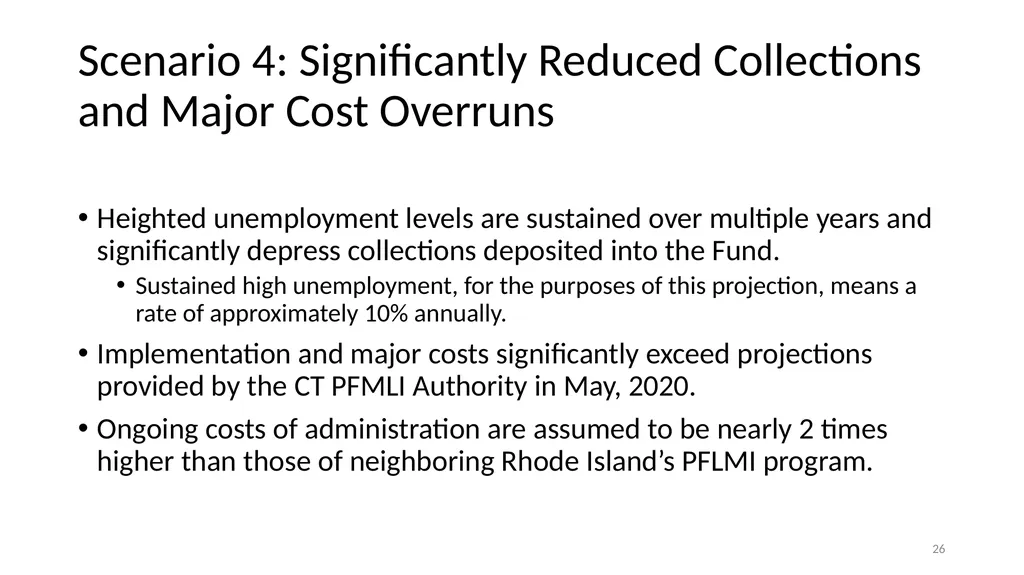
Scenario 4: Significantly Reduced Collections and Major Cost Overruns Heighted unemployment levels are sustained over multiple years and significantly depress collections deposited into the Fund.
Sustained high unemployment, for the purposes of this projection, means a rate of approximately 10% annually.
Implementation and major costs significantly exceed projections provided by the CT PFMLI Authority in May, 2020.
Ongoing costs of administration are assumed to be nearly 2 times higher than those of neighboring Rhode Island’s PFLMI program. 26<br>
Sustained high unemployment, for the purposes of this projection, means a rate of approximately 10% annually.
Implementation and major costs significantly exceed projections provided by the CT PFMLI Authority in May, 2020.
Ongoing costs of administration are assumed to be nearly 2 times higher than those of neighboring Rhode Island’s PFLMI program. 26<br>
27
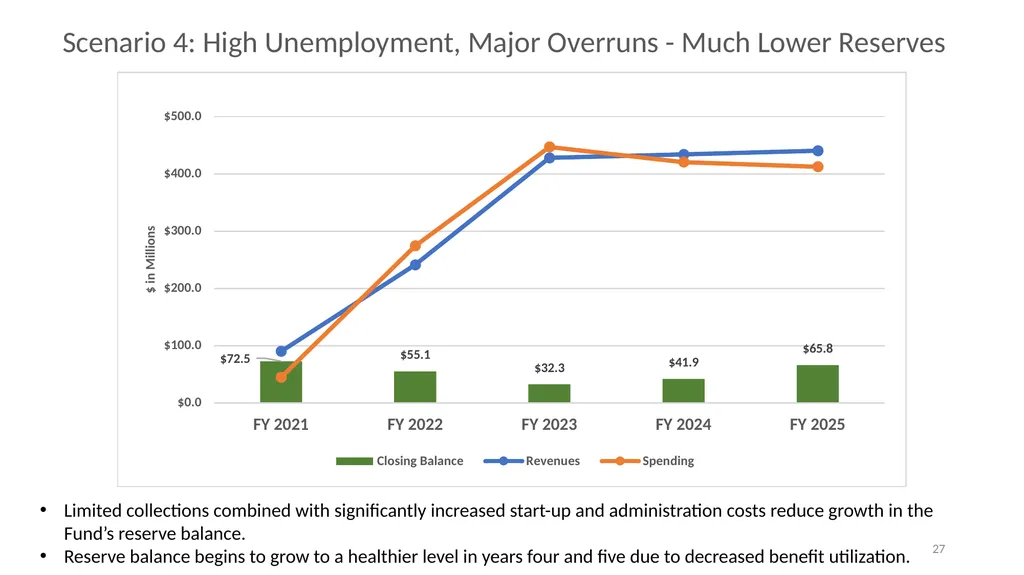
Scenario 4: High Unemployment, Major Overruns - Much Lower Reserves 27 Limited collections combined with significantly increased start-up and administration costs reduce growth in the Fund’s reserve balance.
Reserve balance begins to grow to a healthier level in years four and five due to decreased benefit utilization.<br>
Reserve balance begins to grow to a healthier level in years four and five due to decreased benefit utilization.<br>
28
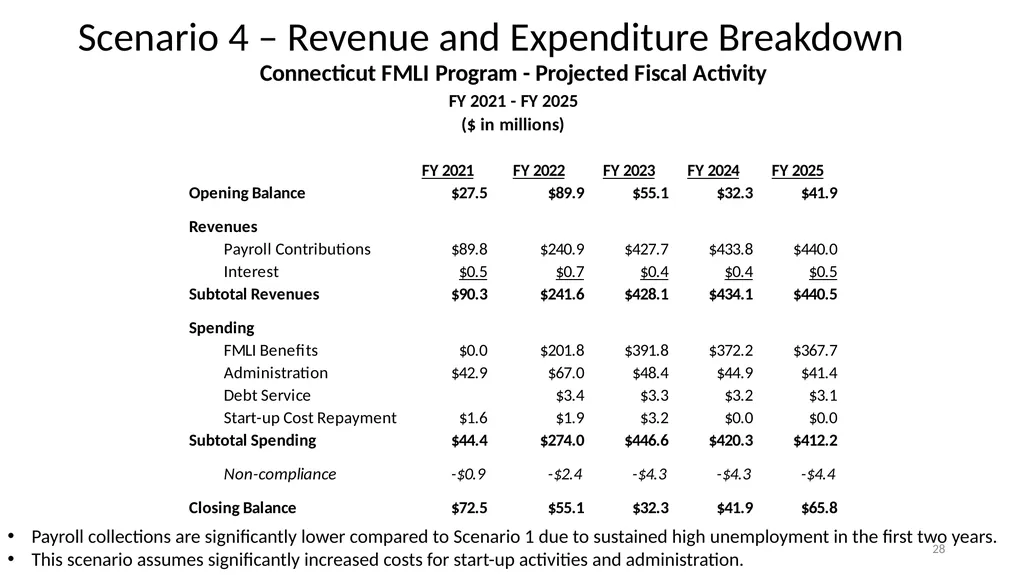
Scenario 4 – Revenue and Expenditure Breakdown 28 Payroll collections are significantly lower compared to Scenario 1 due to sustained high unemployment in the first two years.
This scenario assumes significantly increased costs for start-up activities and administration.<br>
This scenario assumes significantly increased costs for start-up activities and administration.<br>
29
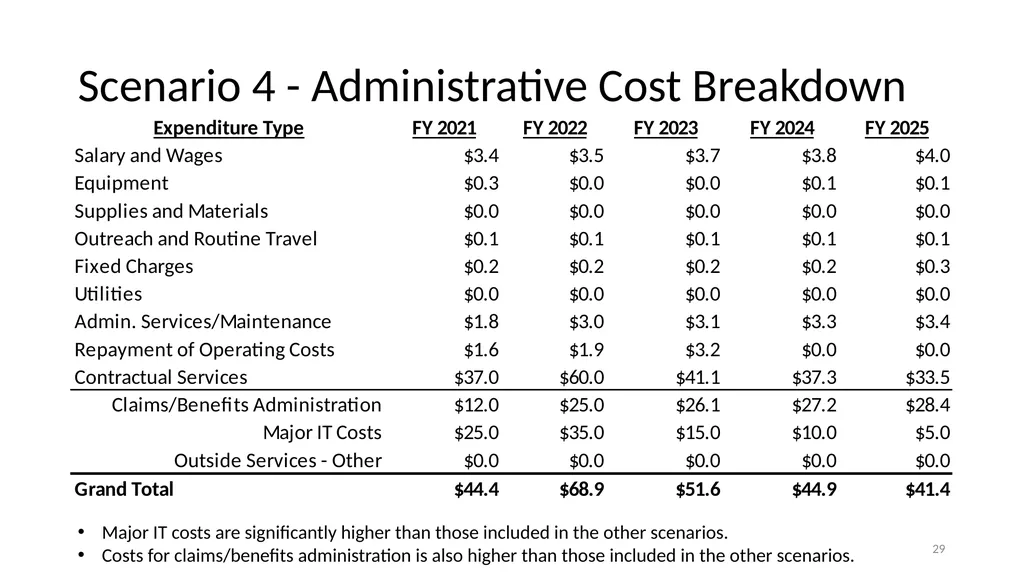
Scenario 4 - Administrative Cost Breakdown 29 Major IT costs are significantly higher than those included in the other scenarios.
Costs for claims/benefits administration is also higher than those included in the other scenarios.<br>
Costs for claims/benefits administration is also higher than those included in the other scenarios.<br>
30
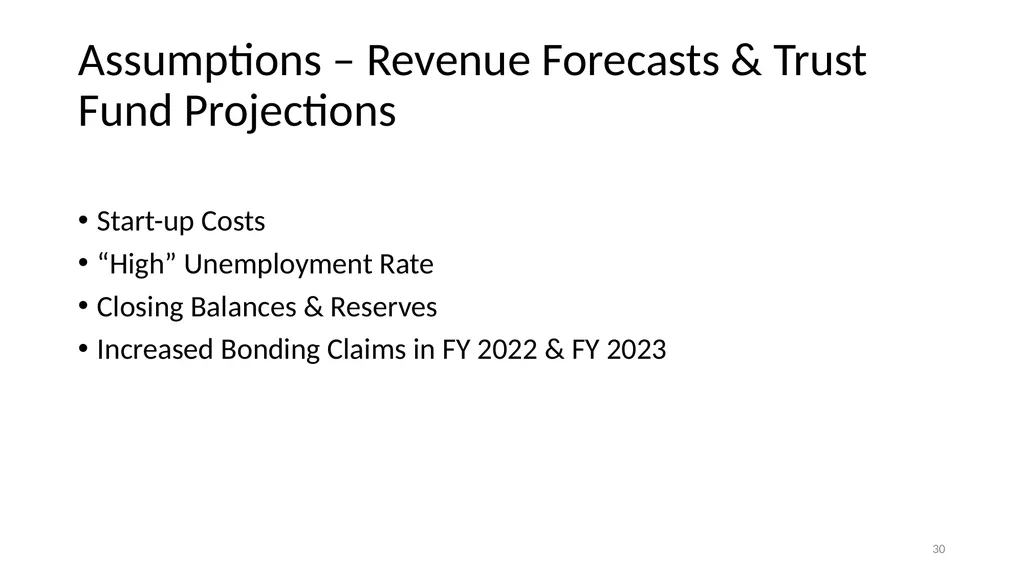
Assumptions – Revenue Forecasts & Trust Fund Projections Start-up Costs
“High” Unemployment Rate
Closing Balances & Reserves
Increased Bonding Claims in FY 2022 & FY 2023 30<br>
“High” Unemployment Rate
Closing Balances & Reserves
Increased Bonding Claims in FY 2022 & FY 2023 30<br>
31
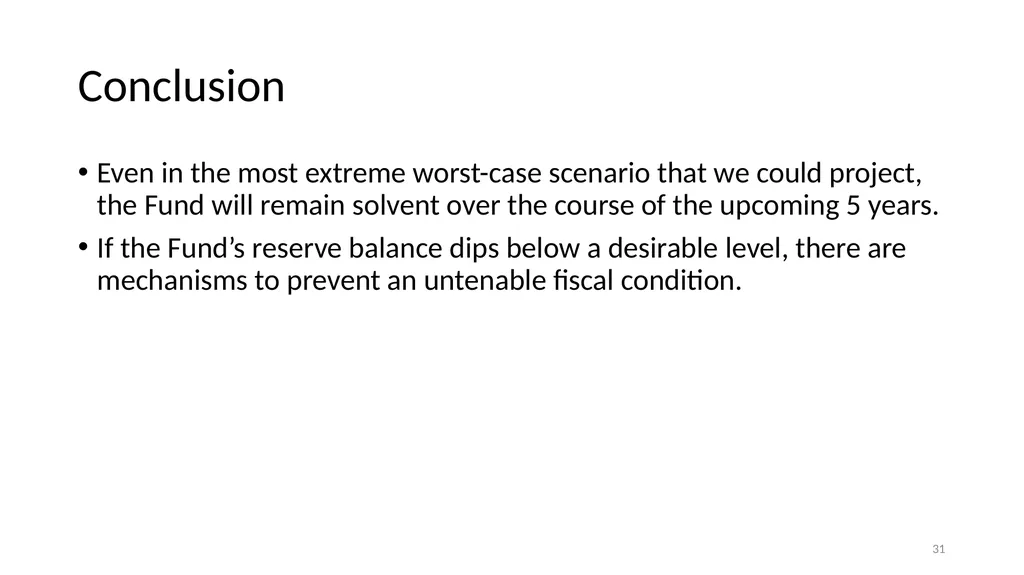
Conclusion Even in the most extreme worst-case scenario that we could project, the Fund will remain solvent over the course of the upcoming 5 years.
If the Fund’s reserve balance dips below a desirable level, there are mechanisms to prevent an untenable fiscal condition. 31<br>
If the Fund’s reserve balance dips below a desirable level, there are mechanisms to prevent an untenable fiscal condition. 31<br>
32
Reference Slides<br>
33
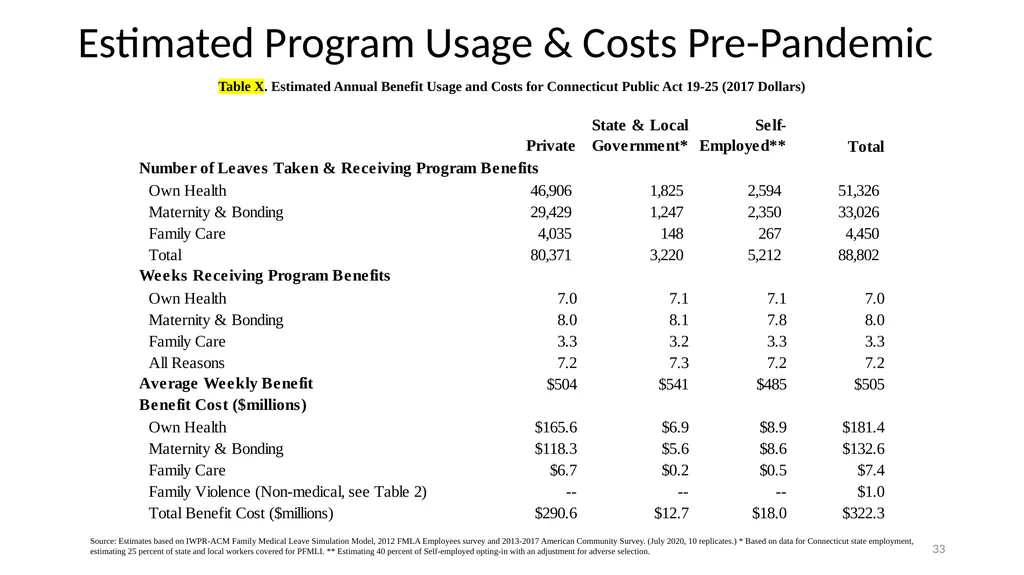
Table X. Estimated Annual Benefit Usage and Costs for Connecticut Public Act 19-25 (2017 Dollars) Estimated Program Usage & Costs Pre-Pandemic 33 Source: Estimates based on IWPR-ACM Family Medical Leave Simulation Model, 2012 FMLA Employees survey and 2013-2017 American Community Survey. (July 2020, 10 replicates.) * Based on data for Connecticut state employment, estimating 25 percent of state and local workers covered for PFMLI. ** Estimating 40 percent of Self-employed opting-in with an adjustment for adverse selection.<br>
34
Overall, number of claims paid is 8% higher under COVID-19 take-up compared to the baseline 34<br>
35
35 Table X. Estimated Benefit Usage and Costs for Connecticut Public Act 19-25 and Increased Bonding Claims (2017 Dollars). Source: Estimates based on IWPR-ACM Family Medical Leave Simulation Model, 2012 FMLA Employees survey and 2013-2017 American Community Survey. (July 2020, 10 replicates.) * Based on data for Connecticut state employment, estimating 25 percent of state and local workers covered for PFMLI. ** Estimating 40 percent of Self-employed opting-in with an adjustment for adverse selection. ***Based on new child bonding claims from children born the calendar year before benefits start (2021). Estimated Program Usage & Costs Pre-Pandemic with Increased Bonding Claims in 2022<br>