
Financial Planning Tools each School Should Have

Description: Financial Planning Tools each School Should Have (especially in preparation for Accreditation or Strategic Planning) Palmer Ball Consulting, LLC palmerballconsultinggmail.com www.palmerballconsulting.com Palmer D. Ball September 23, 2021
Related Topics
Download Presentation
"Financial Planning Tools each School Should Have" is the property of its rightful owner. Permission is granted to download and print the materials on this website for personal, non-commercial use only, and to display it on your personal computer provided you do not modify the materials and that you retain all copyright notices contained in the materials. By downloading content from our website, you accept the terms of this agreement.
Presentation Transcript
slide1. Financial Planning Tools each School Should Have
(especially in preparation for Accreditation or Strategic Planning) Palmer Ball Consulting, LLC
palmerballconsulting@gmail.com
www.palmerballconsulting.com Palmer D. Ball
September 23, 2021<br>
slide2. Opening Disclaimers I am not addressing fiduciary compliance of the board related to a number of financial matters typically addressed during the accreditation process (HR, 403(b), FMLA, endowments / UPMIFA, audits, etc.)
I am just addressing financial planning and analysis and things boards, as fiduciaries, should be asking questions about, and thus information the Business Officer should have.<br>
slide3. Tools “Toolbox” each school should have to make data informed decisions Strongly Recommend –
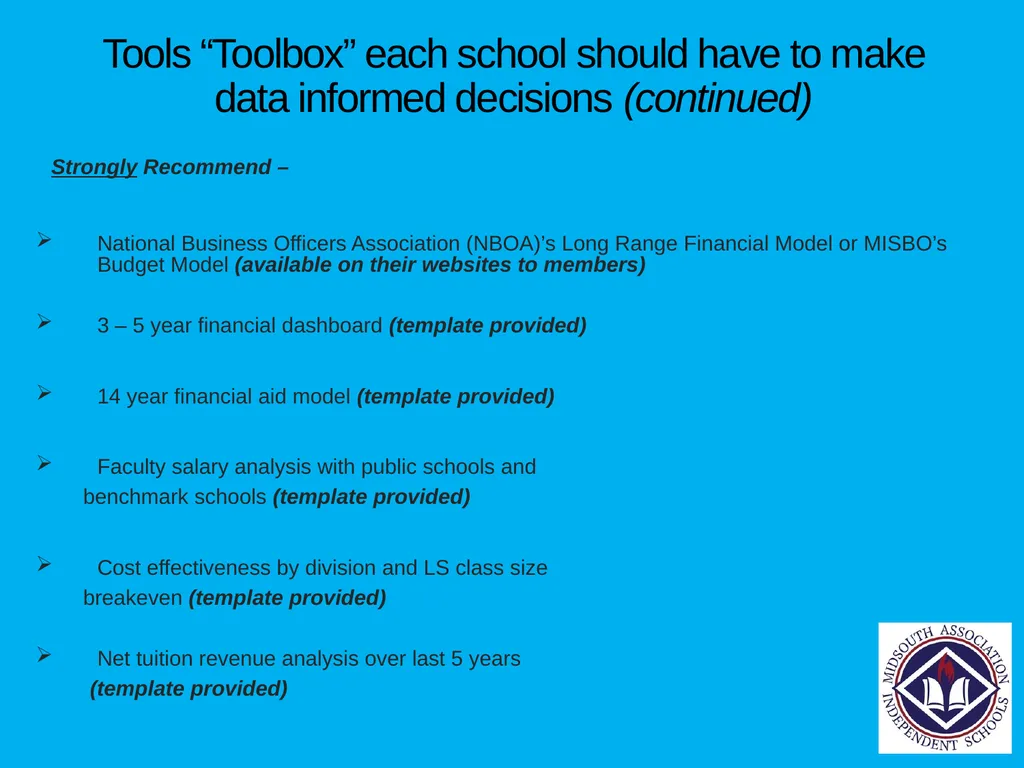
5 – 10 year NAIS DASL (Data Analysis for School Leadership) or NBOA BIIS (Business Intelligence for Independent Schools) trends for the school (NAIS DASL template provided)
For non DASL or BIIS participants, 5 – 10 year trends of important data points for the school (use NAIS DASL template
provided)
Observe the trends for each data point and identify
the most important trends and the main conclusions
that can be obtained from this chart
DASL or BIIS comparative data with benchmark schools (template
provided)
Local or regional schools
Aspirational schools
Suggestion – use ratios to normalize size differences
with other schools (i.e. endowment per student,
benefit costs as a percentage of compensation, etc.)<br>
slide4. Tools “Toolbox” each school should have to make data informed decisions (continued) Strongly Recommend –
National Business Officers Association (NBOA)’s Long Range Financial Model or MISBO’s Budget Model (available on their websites to members)
3 – 5 year financial dashboard (template provided)
14 year financial aid model (template provided)
Faculty salary analysis with public schools and
benchmark schools (template provided)
Cost effectiveness by division and LS class size
breakeven (template provided)
Net tuition revenue analysis over last 5 years
(template provided)<br>
slide5. Tools “Toolbox” each school should have to make data informed decisions (continued) Strongly Recommend -
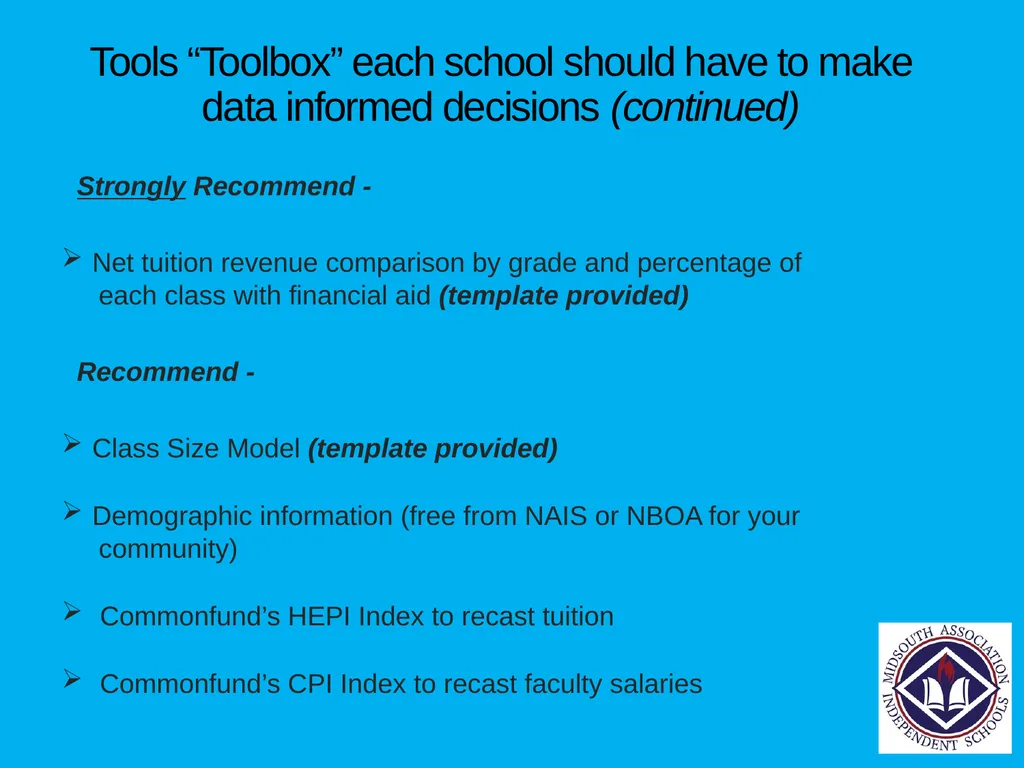
Net tuition revenue comparison by grade and percentage of
each class with financial aid (template provided)
Recommend -
Class Size Model (template provided)
Demographic information (free from NAIS or NBOA for your
community)
Commonfund’s HEPI Index to recast tuition
Commonfund’s CPI Index to recast faculty salaries<br>
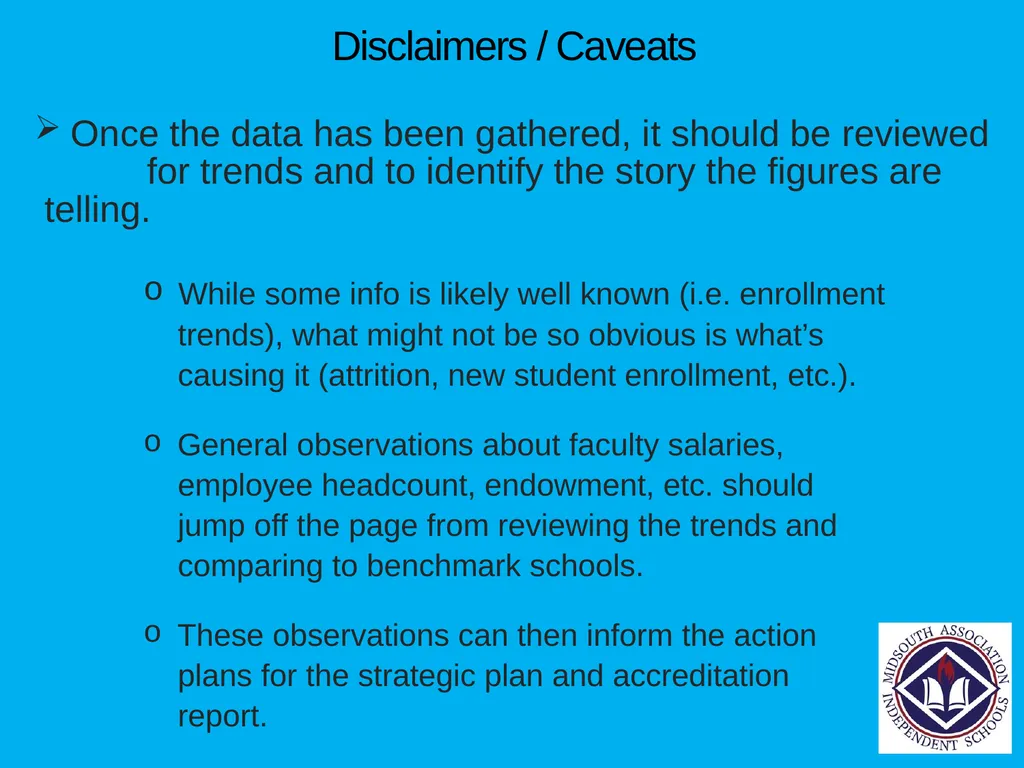
slide6. Disclaimers / Caveats Once the data has been gathered, it should be reviewed for trends and to identify the story the figures are telling.
While some info is likely well known (i.e. enrollment
trends), what might not be so obvious is what’s
causing it (attrition, new student enrollment, etc.).
General observations about faculty salaries,
employee headcount, endowment, etc. should
jump off the page from reviewing the trends and
comparing to benchmark schools.
These observations can then inform the action
plans for the strategic plan and accreditation
report.<br>
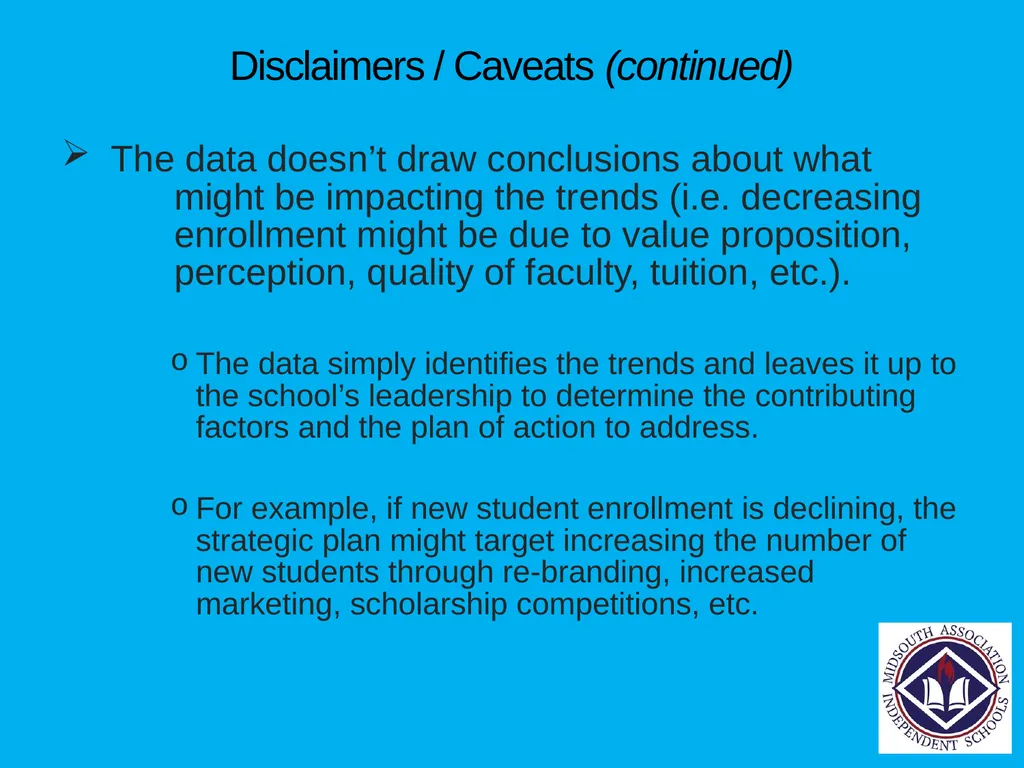
slide7. Disclaimers / Caveats (continued) The data doesn’t draw conclusions about what might be impacting the trends (i.e. decreasing enrollment might be due to value proposition, perception, quality of faculty, tuition, etc.).
The data simply identifies the trends and leaves it up to the school’s leadership to determine the contributing factors and the plan of action to address.
For example, if new student enrollment is declining, the strategic plan might target increasing the number of new students through re-branding, increased marketing, scholarship competitions, etc.<br>
slide8. Disclaimers / Caveats (continued) Finally, sample questions to ask are provided – this is not an exhaustive list of questions and it does not touch on every subject. This simply shows the types of questions that school leaders should ask to determine opportunities for improvement and inclusion in the strategic plan or accreditation report. Thus, these are questions that Business Officers need to be prepared to answer.
Some regional accreditation standards ask these exact questions, although most standards are more general and not as specific.<br>
slide9. Tools should be used to review trends in 4 major areas 1 - Enrollment
Enrollment
Financial Aid
Tuition and Fees
2 – Employment
Compensation
FTEs
Class Sizes<br>
slide10. Tools should be used to review trends in 4 major areas (continued) 3 – Financial
Net Tuition Revenue
NAIS DASL comparative data
Cost effectiveness by division
Tuition Gap (difference between NTR and total expenses)
Future budget projections
4 – Miscellaneous
Endowment
Debt
Annual Fund
Dashboard
Physical Plant<br>
slide11. 2 Major Questions to Ask Where has the school been?
What does the school’s recent historical data reveal about what the school has been doing well, or what the school hasn’t been doing well?
Where is the school going?
What does the school’s recent historical data reveal about where the school will be in 5 years if the trends continue?
Can the school focus efforts to turn around the negative trends?
What will happen if the school doesn’t turn around the negative trends?
What new actions does the school need to take to get to where they want to be?<br>
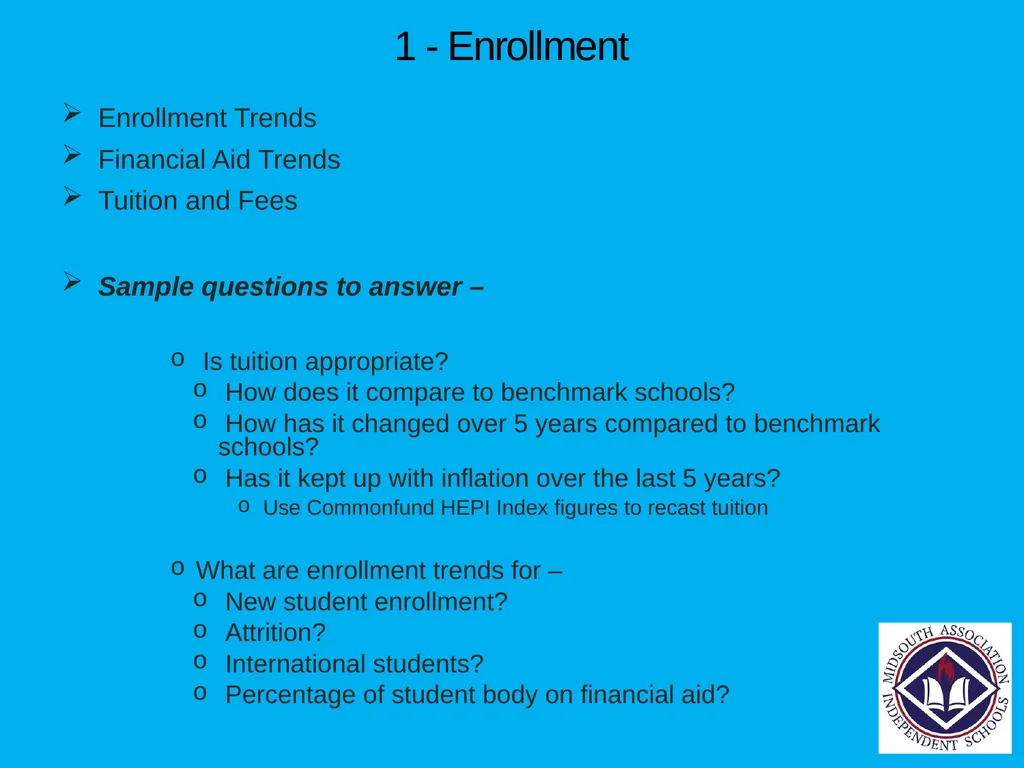
slide12. 1 - Enrollment Enrollment Trends
Financial Aid Trends
Tuition and Fees
Sample questions to answer –
Is tuition appropriate?
How does it compare to benchmark schools?
How has it changed over 5 years compared to benchmark schools?
Has it kept up with inflation over the last 5 years?
Use Commonfund HEPI Index figures to recast tuition
What are enrollment trends for –
New student enrollment?
Attrition?
International students?
Percentage of student body on financial aid?<br>
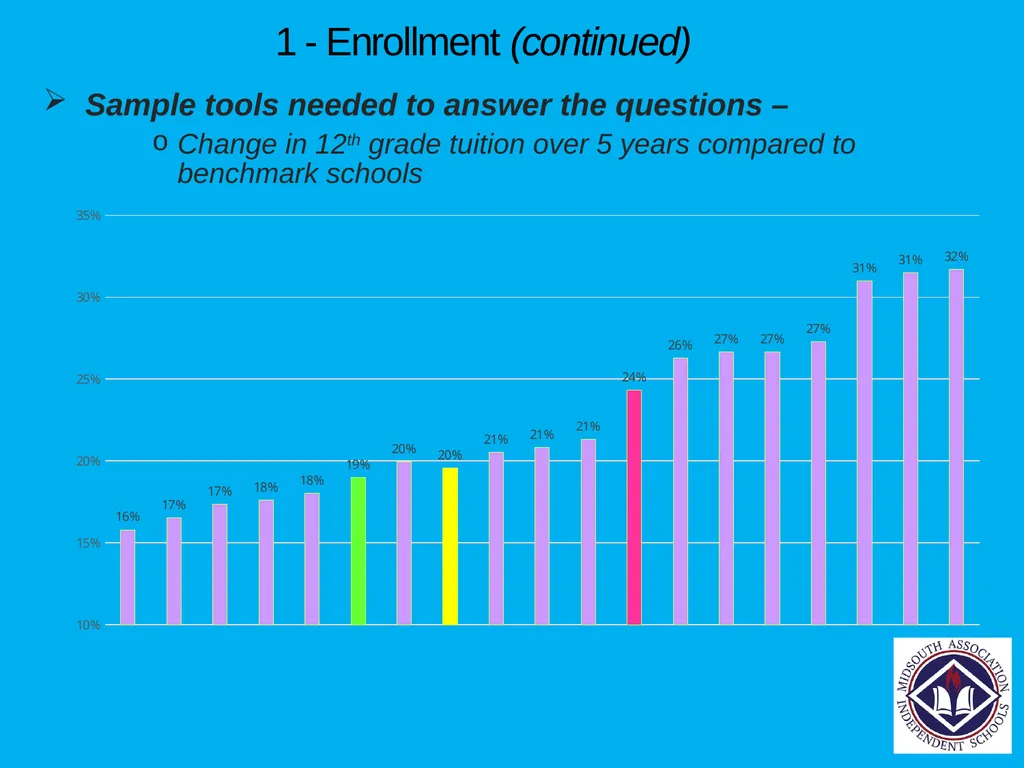
slide13. 1 - Enrollment (continued) Sample tools needed to answer the questions –
Change in 12th grade tuition over 5 years compared to benchmark schools<br>
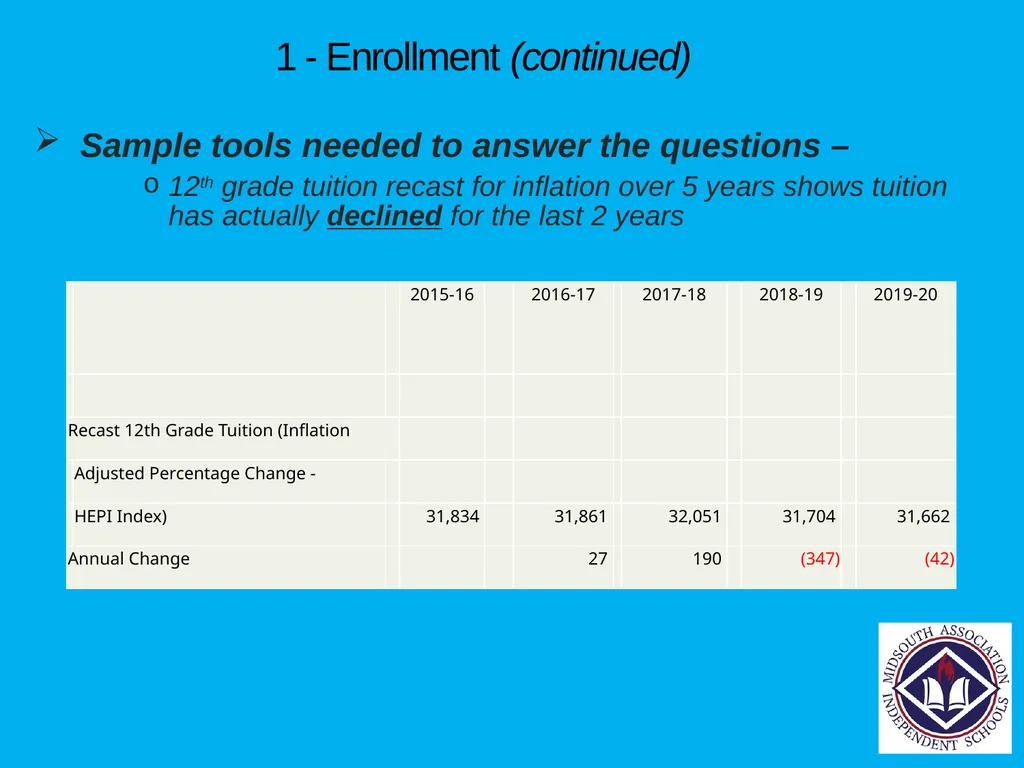
slide14. 1 - Enrollment (continued) Sample tools needed to answer the questions –
12th grade tuition recast for inflation over 5 years shows tuition has actually declined for the last 2 years<br>
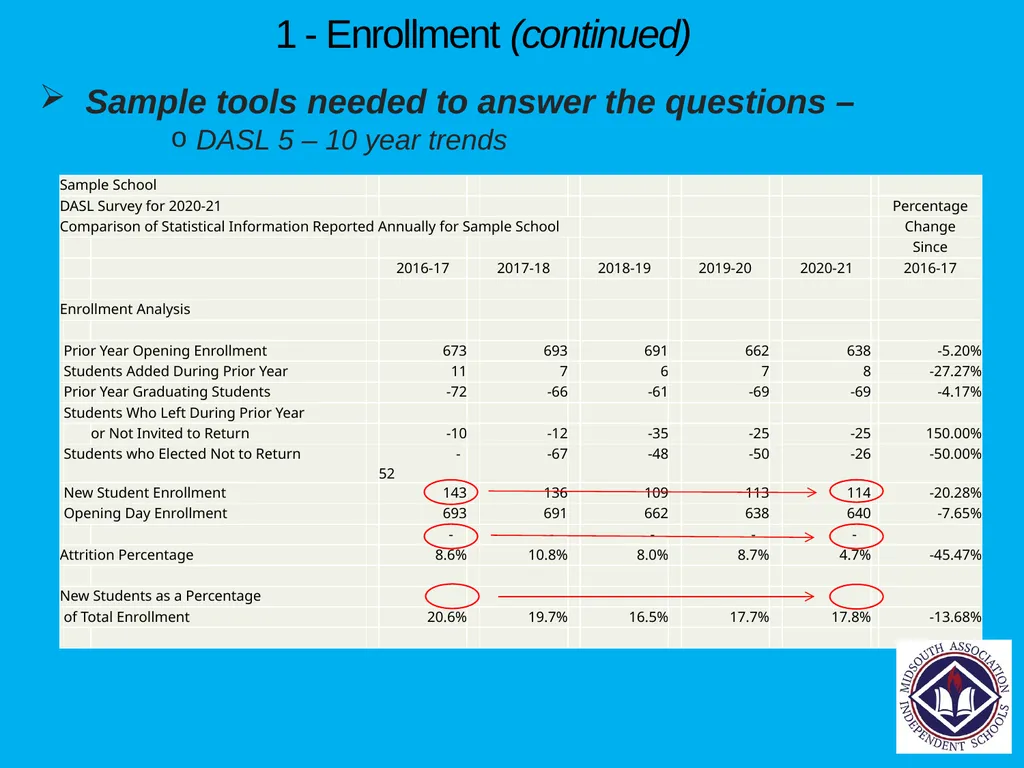
slide15. 1 - Enrollment (continued) Sample tools needed to answer the questions –
DASL 5 – 10 year trends<br>
slide16. 1 - Enrollment (continued) Sample questions to answer (continued)
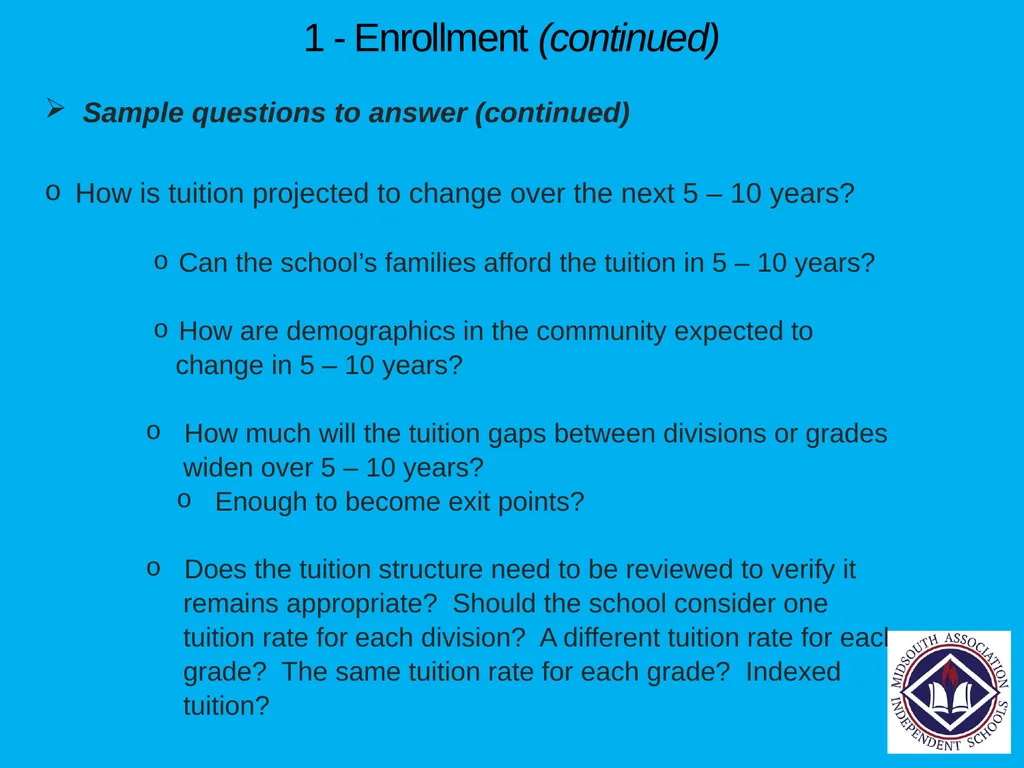
How is tuition projected to change over the next 5 – 10 years?
Can the school’s families afford the tuition in 5 – 10 years?
How are demographics in the community expected to
change in 5 – 10 years?
How much will the tuition gaps between divisions or grades
widen over 5 – 10 years?
Enough to become exit points?
Does the tuition structure need to be reviewed to verify it
remains appropriate? Should the school consider one
tuition rate for each division? A different tuition rate for each
grade? The same tuition rate for each grade? Indexed
tuition?<br>
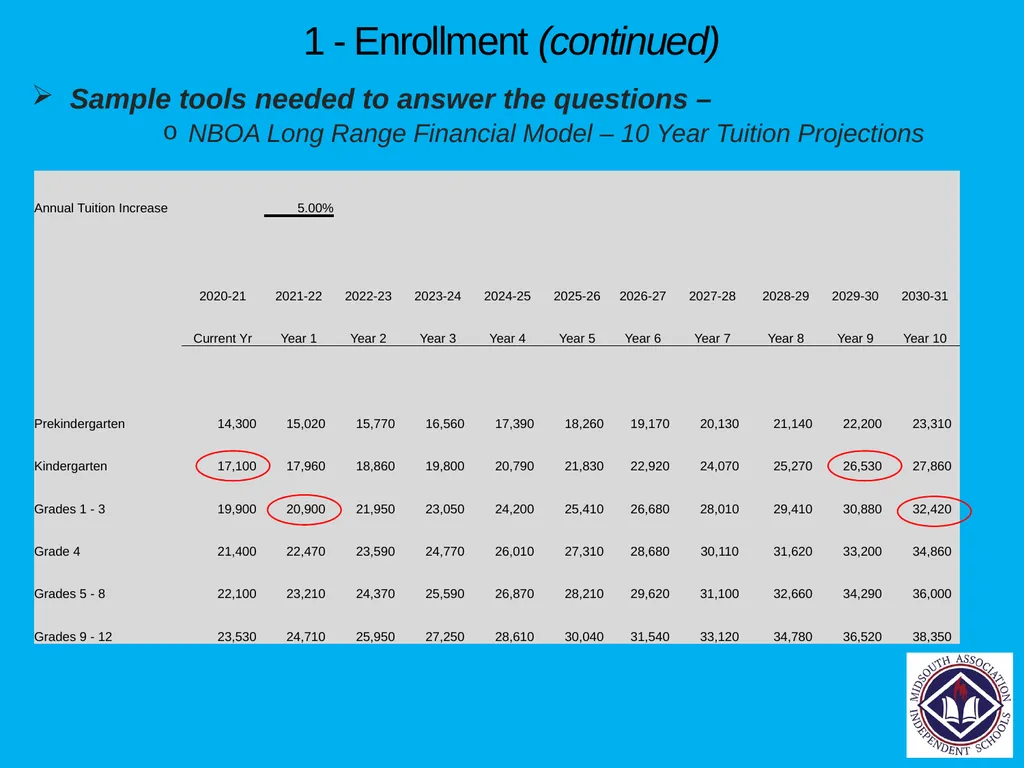
slide17. 1 - Enrollment (continued) Sample tools needed to answer the questions –
NBOA Long Range Financial Model – 10 Year Tuition Projections<br>
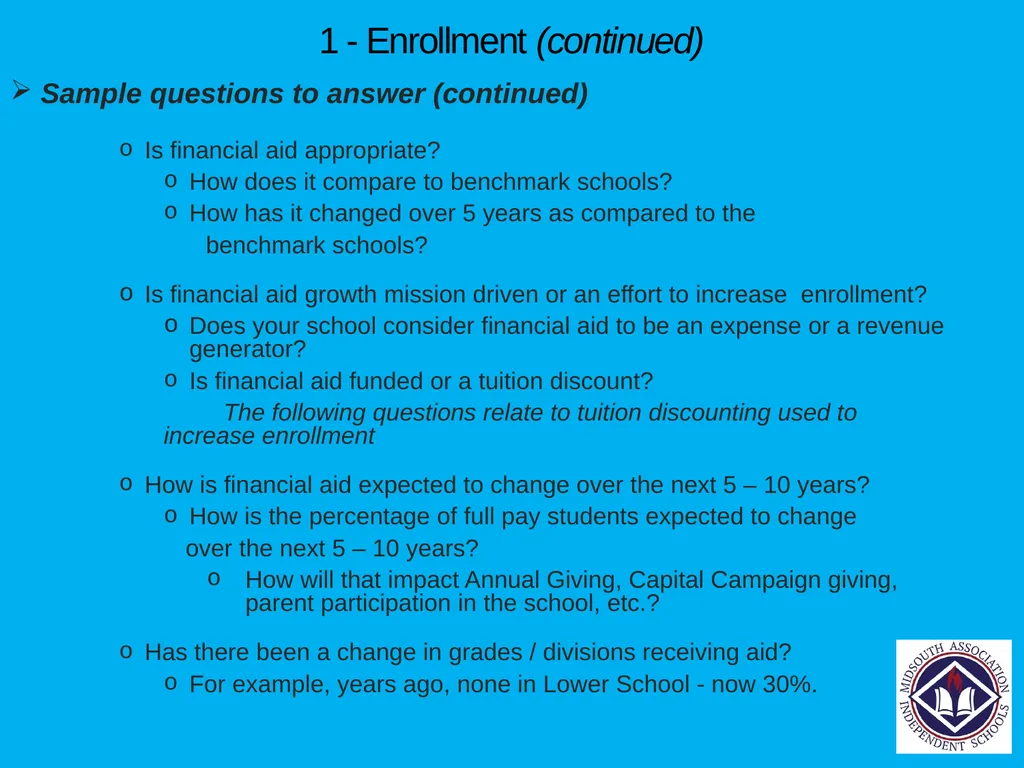
slide18. 1 - Enrollment (continued) Sample questions to answer (continued)
Is financial aid appropriate?
How does it compare to benchmark schools?
How has it changed over 5 years as compared to the
benchmark schools?
Is financial aid growth mission driven or an effort to increase enrollment?
Does your school consider financial aid to be an expense or a revenue generator?
Is financial aid funded or a tuition discount?
The following questions relate to tuition discounting used to increase enrollment
How is financial aid expected to change over the next 5 – 10 years?
How is the percentage of full pay students expected to change
over the next 5 – 10 years?
How will that impact Annual Giving, Capital Campaign giving, parent participation in the school, etc.?
Has there been a change in grades / divisions receiving aid?
For example, years ago, none in Lower School - now 30%.<br>
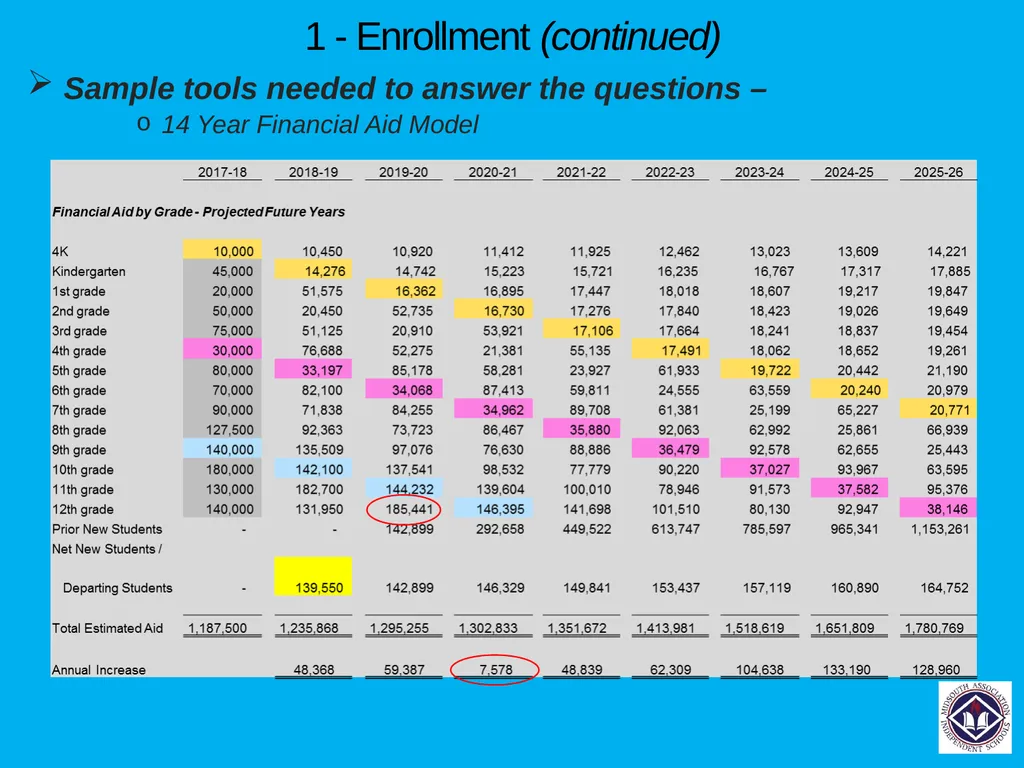
slide19. 1 - Enrollment (continued) Sample tools needed to answer the questions –
14 Year Financial Aid Model<br>
slide20. 1 - Enrollment (continued) Sample questions to answer (continued)
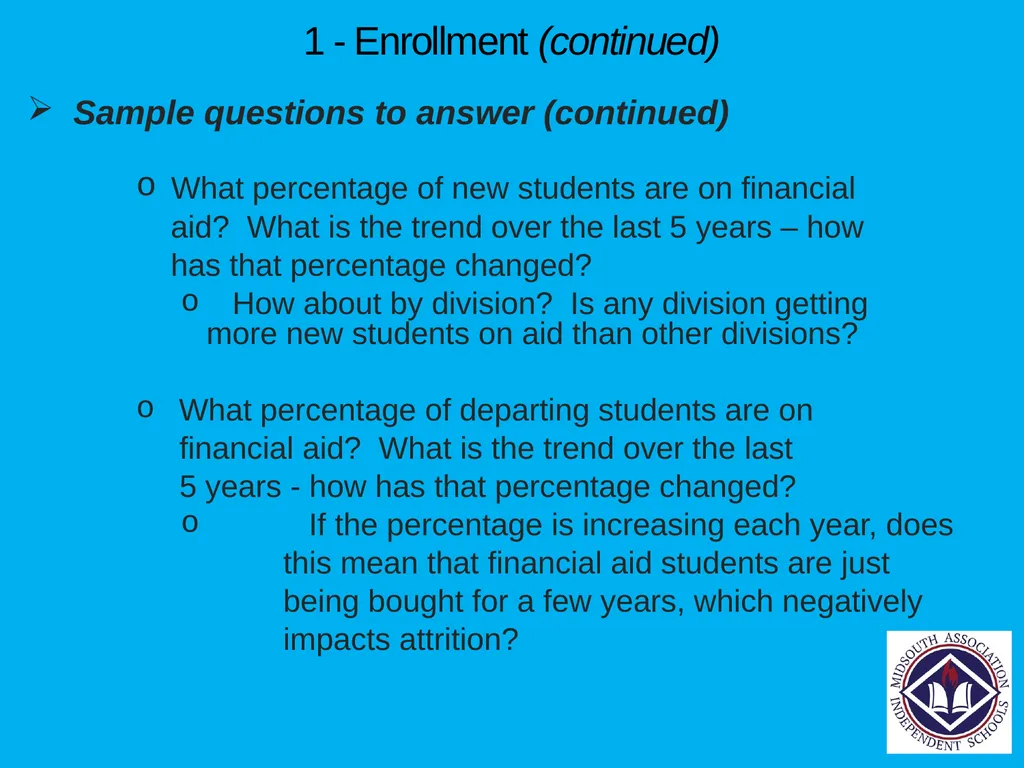
What percentage of new students are on financial
aid? What is the trend over the last 5 years – how
has that percentage changed?
How about by division? Is any division getting more new students on aid than other divisions?
What percentage of departing students are on
financial aid? What is the trend over the last
5 years - how has that percentage changed?
If the percentage is increasing each year, does
this mean that financial aid students are just
being bought for a few years, which negatively
impacts attrition?<br>
slide21. 1 - Enrollment (continued) Sample questions to answer (continued)
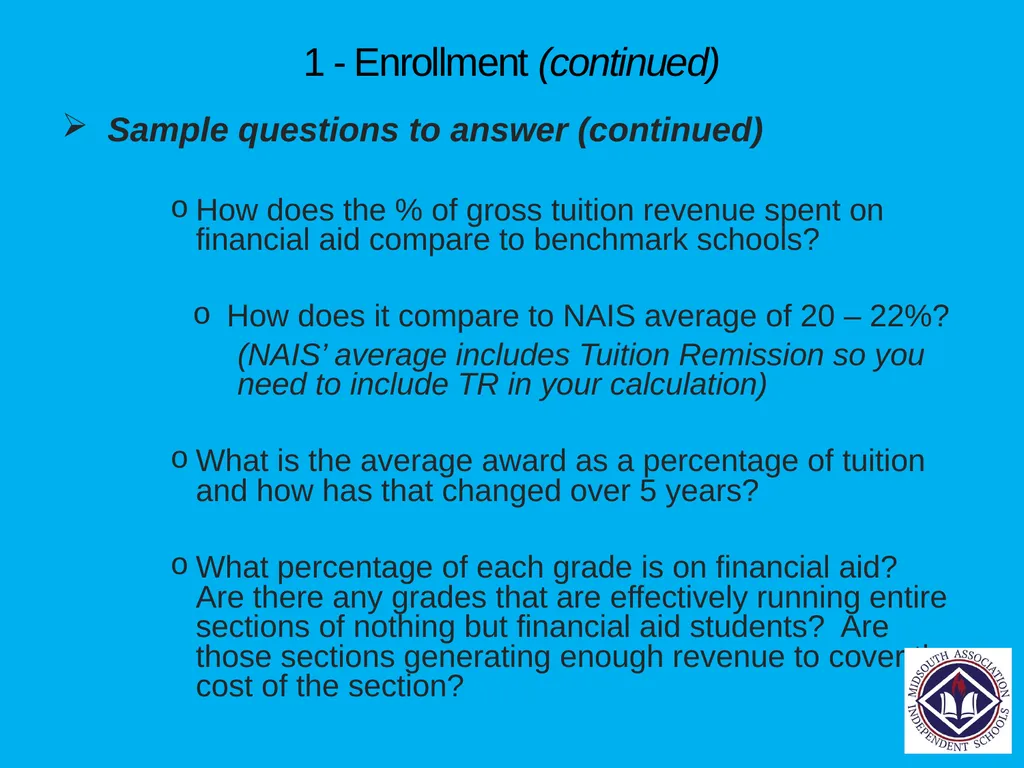
How does the % of gross tuition revenue spent on financial aid compare to benchmark schools?
How does it compare to NAIS average of 20 – 22%?
(NAIS’ average includes Tuition Remission so you need to include TR in your calculation)
What is the average award as a percentage of tuition and how has that changed over 5 years?
What percentage of each grade is on financial aid? Are there any grades that are effectively running entire sections of nothing but financial aid students? Are those sections generating enough revenue to cover the cost of the section?<br>
slide22. 1 – Enrollment (continued) Sample questions to answer –
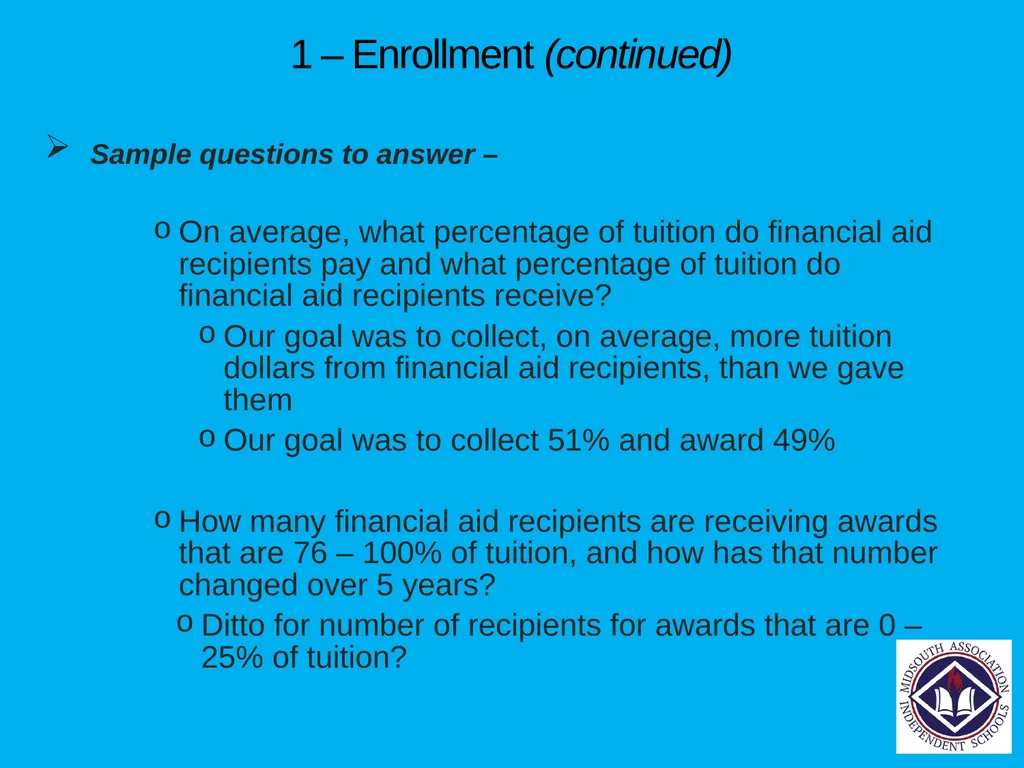
On average, what percentage of tuition do financial aid recipients pay and what percentage of tuition do financial aid recipients receive?
Our goal was to collect, on average, more tuition dollars from financial aid recipients, than we gave them
Our goal was to collect 51% and award 49%
How many financial aid recipients are receiving awards that are 76 – 100% of tuition, and how has that number changed over 5 years?
Ditto for number of recipients for awards that are 0 – 25% of tuition?<br>
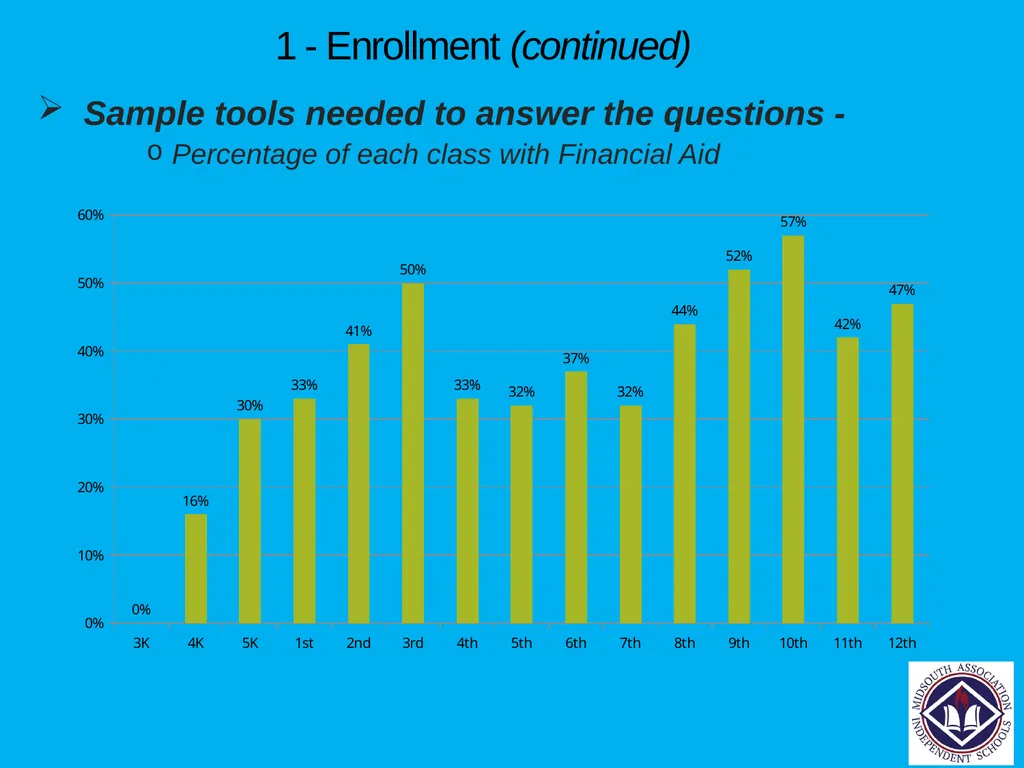
slide23. 1 - Enrollment (continued) Sample tools needed to answer the questions -
Percentage of each class with Financial Aid<br>
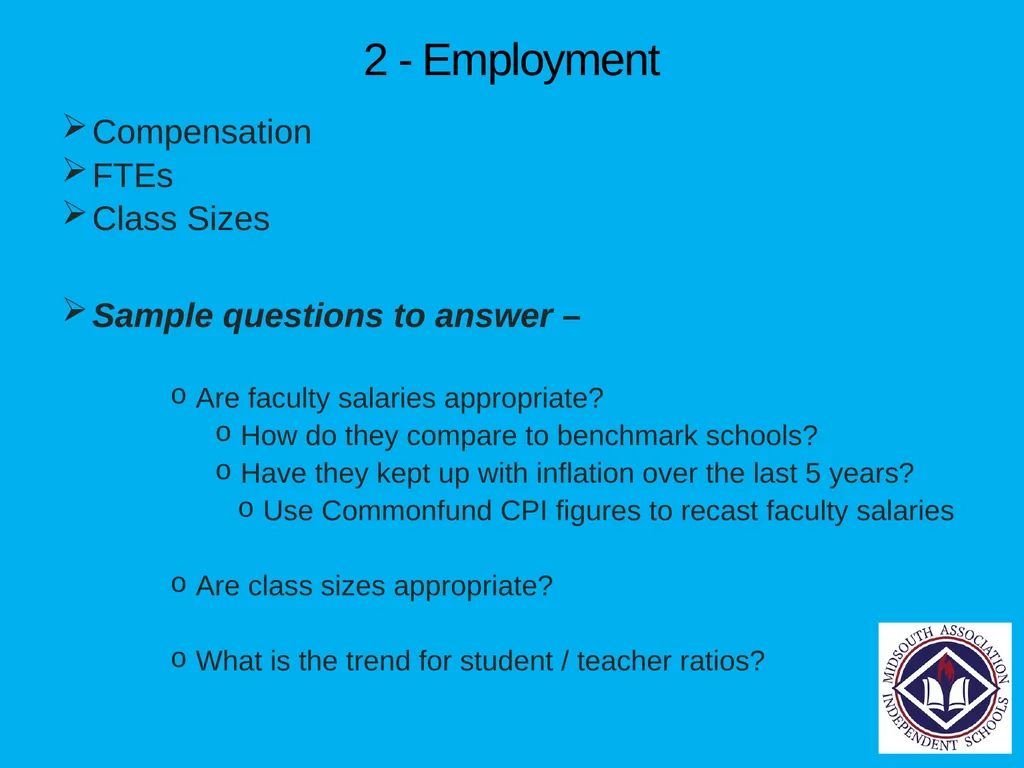
slide24. 2 - Employment Compensation
FTEs
Class Sizes
Sample questions to answer –
Are faculty salaries appropriate?
How do they compare to benchmark schools?
Have they kept up with inflation over the last 5 years?
Use Commonfund CPI figures to recast faculty salaries
Are class sizes appropriate?
What is the trend for student / teacher ratios?<br>
slide25. 2 – Employment (continued) Sample tools needed to answer the questions –
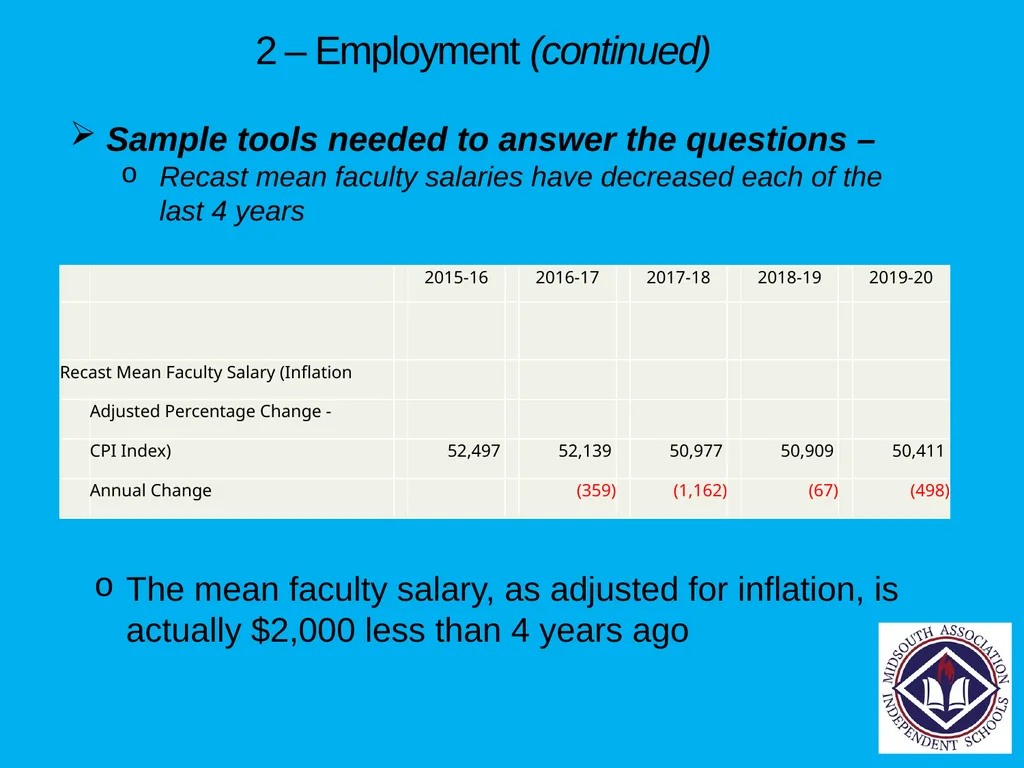
Recast mean faculty salaries have decreased each of the last 4 years The mean faculty salary, as adjusted for inflation, is actually $2,000 less than 4 years ago<br>
slide26. 2 – Employment (continued) Sample tools needed to answer the questions –
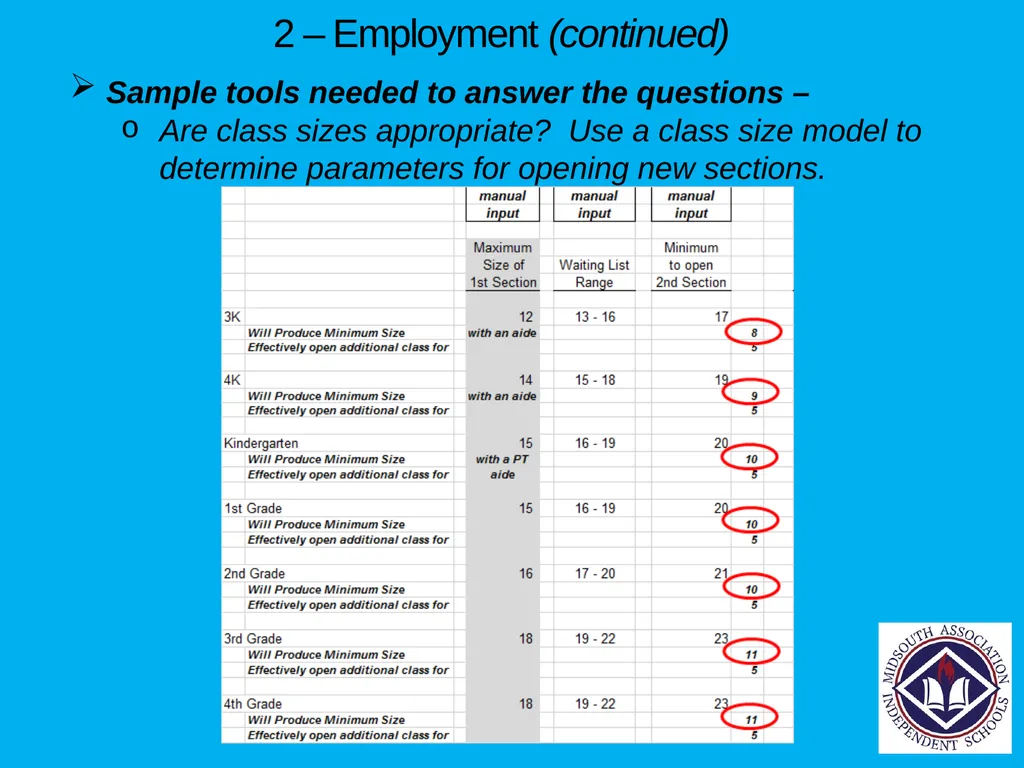
Are class sizes appropriate? Use a class size model to determine parameters for opening new sections.<br>
slide27. 2 – Employment (continued) Sample questions to answer (continued)
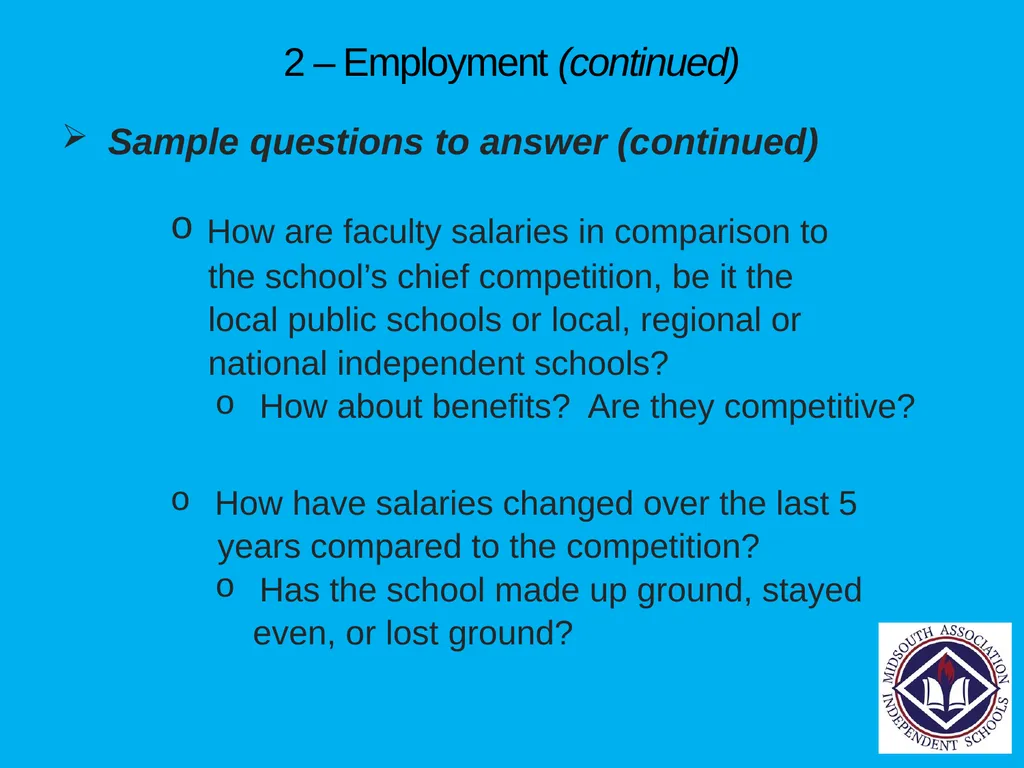
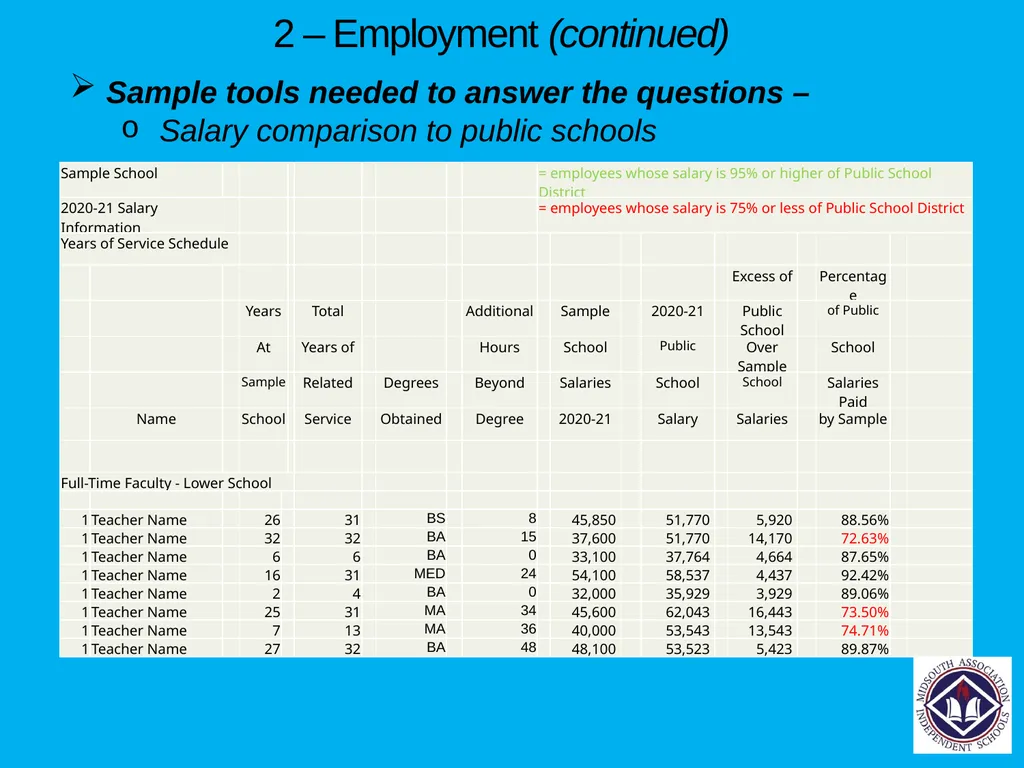
How are faculty salaries in comparison to
the school’s chief competition, be it the
local public schools or local, regional or
national independent schools?
How about benefits? Are they competitive?
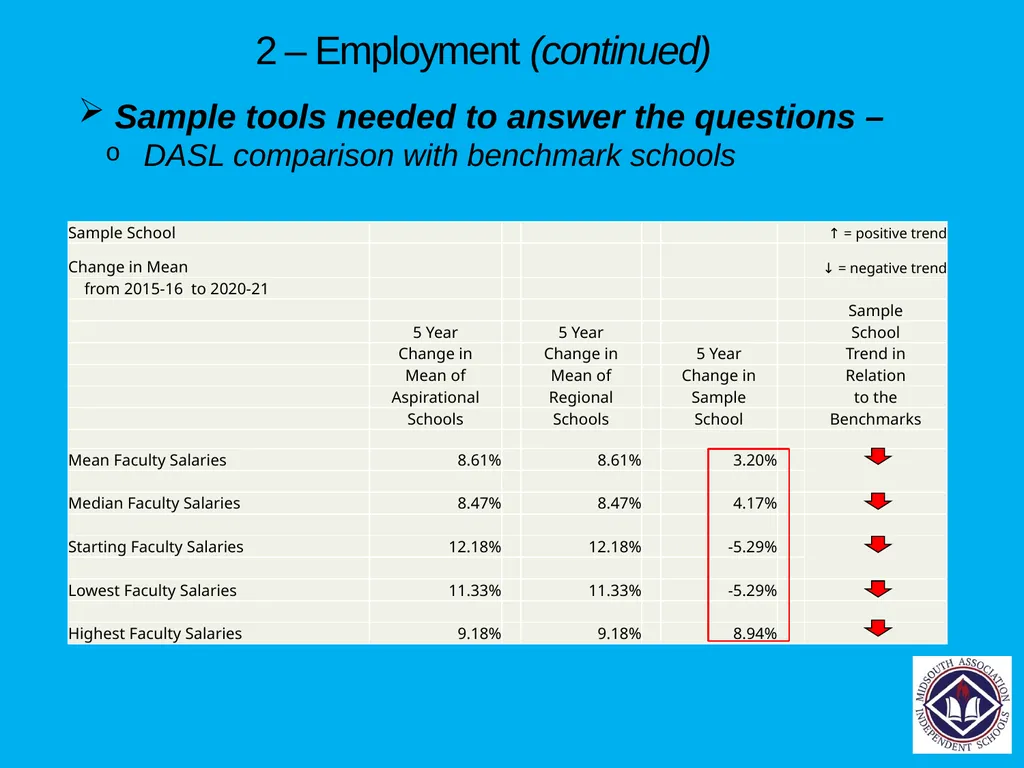
How have salaries changed over the last 5
years compared to the competition?
Has the school made up ground, stayed
even, or lost ground?<br>
slide28. 2 – Employment (continued) Sample tools needed to answer the questions –
Salary comparison to public schools<br>
slide29. 2 – Employment (continued) Sample tools needed to answer the questions –
DASL comparison with benchmark schools<br>
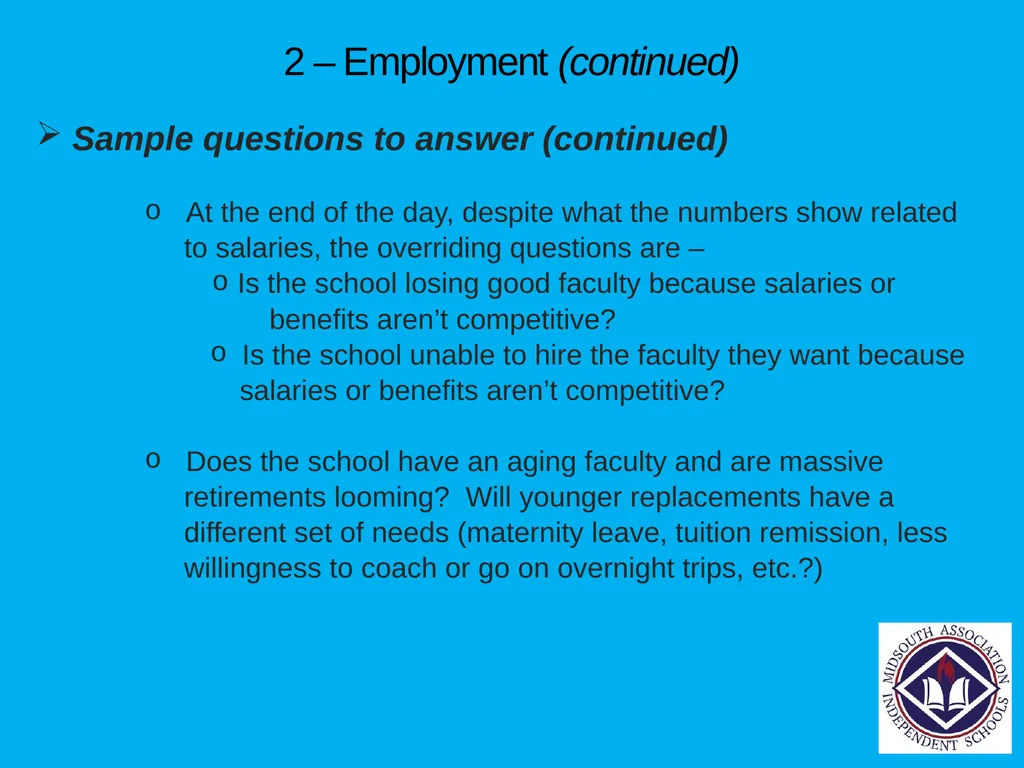
slide30. 2 – Employment (continued) Sample questions to answer (continued)
At the end of the day, despite what the numbers show related
to salaries, the overriding questions are –
Is the school losing good faculty because salaries or
benefits aren’t competitive?
Is the school unable to hire the faculty they want because
salaries or benefits aren’t competitive?
Does the school have an aging faculty and are massive
retirements looming? Will younger replacements have a
different set of needs (maternity leave, tuition remission, less
willingness to coach or go on overnight trips, etc.?)<br>
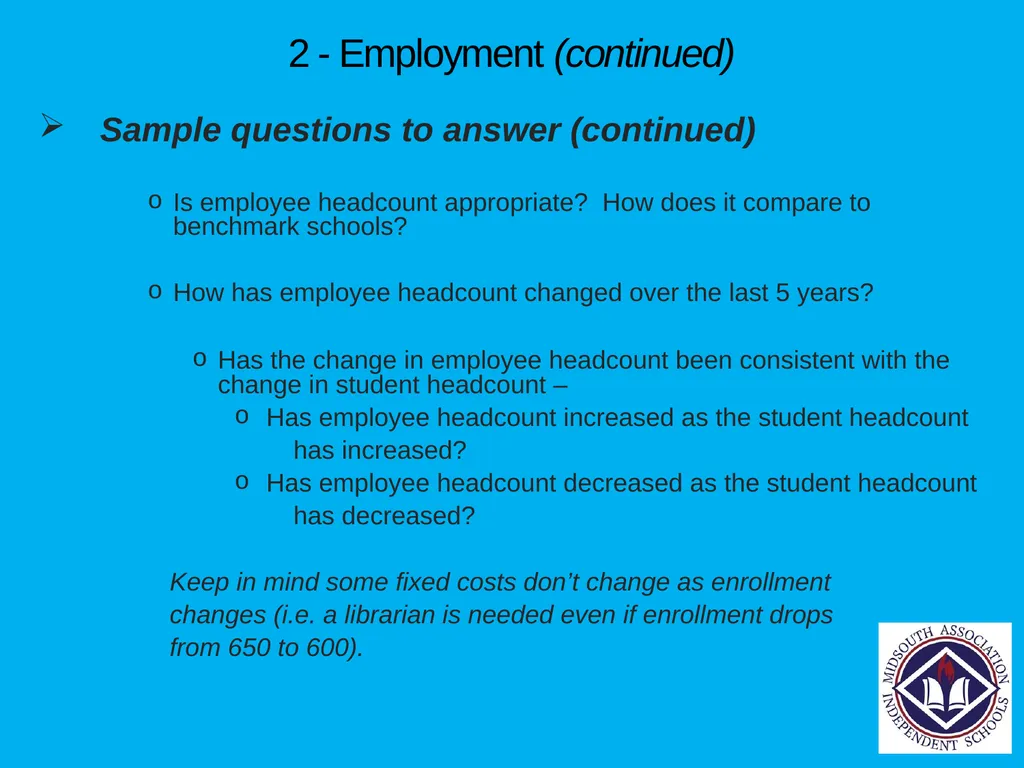
slide31. 2 - Employment (continued) Sample questions to answer (continued)
Is employee headcount appropriate? How does it compare to benchmark schools?
How has employee headcount changed over the last 5 years?
Has the change in employee headcount been consistent with the change in student headcount –
Has employee headcount increased as the student headcount
has increased?
Has employee headcount decreased as the student headcount
has decreased?
Keep in mind some fixed costs don’t change as enrollment
changes (i.e. a librarian is needed even if enrollment drops
from 650 to 600).<br>
slide32. 2 - Employment (continued) Sample questions to answer (continued)
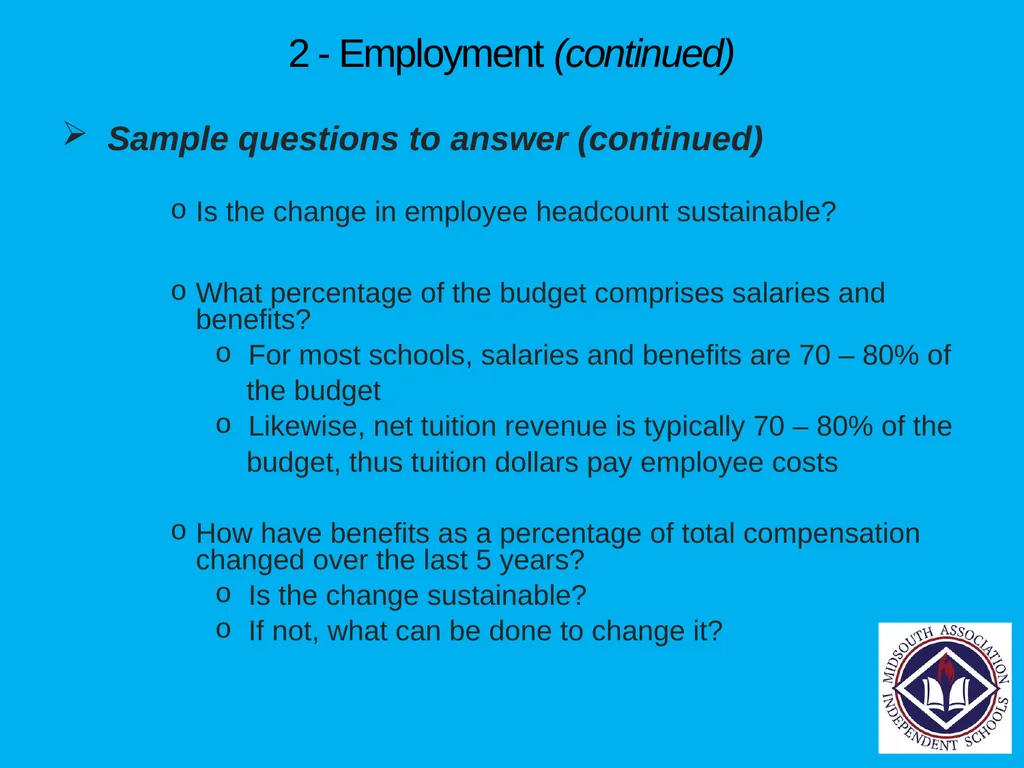
Is the change in employee headcount sustainable?
What percentage of the budget comprises salaries and benefits?
For most schools, salaries and benefits are 70 – 80% of
the budget
Likewise, net tuition revenue is typically 70 – 80% of the
budget, thus tuition dollars pay employee costs
How have benefits as a percentage of total compensation changed over the last 5 years?
Is the change sustainable?
If not, what can be done to change it?<br>
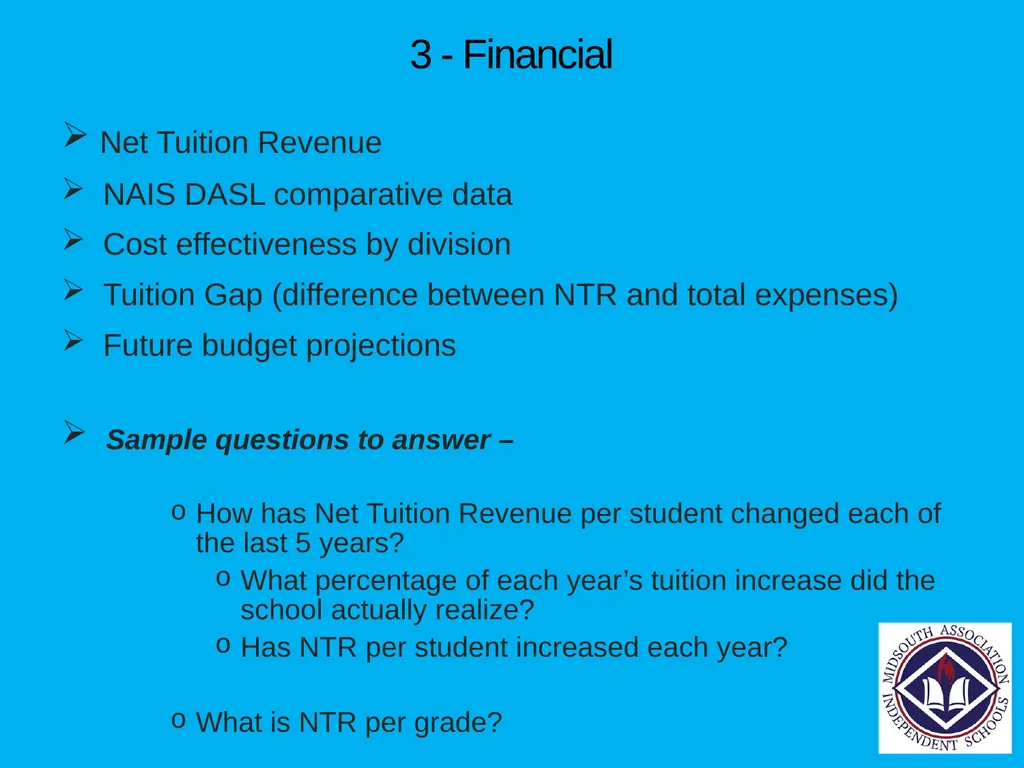
slide33. 3 - Financial Net Tuition Revenue
NAIS DASL comparative data
Cost effectiveness by division
Tuition Gap (difference between NTR and total expenses)
Future budget projections
Sample questions to answer –
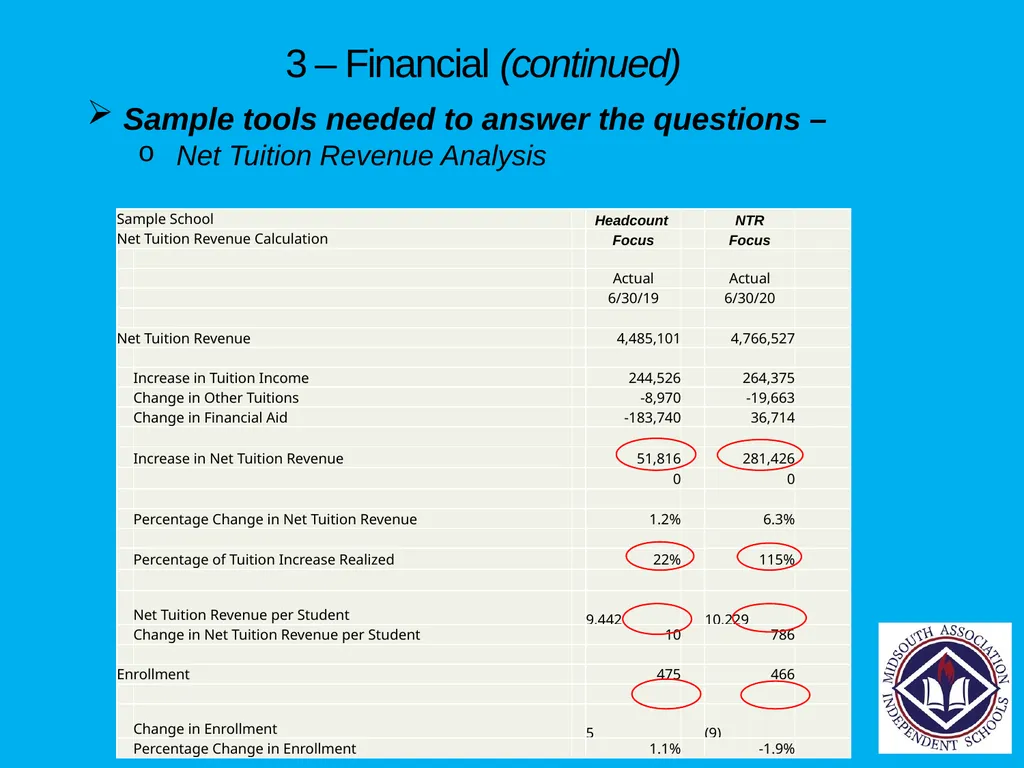
How has Net Tuition Revenue per student changed each of the last 5 years?
What percentage of each year’s tuition increase did the school actually realize?
Has NTR per student increased each year?
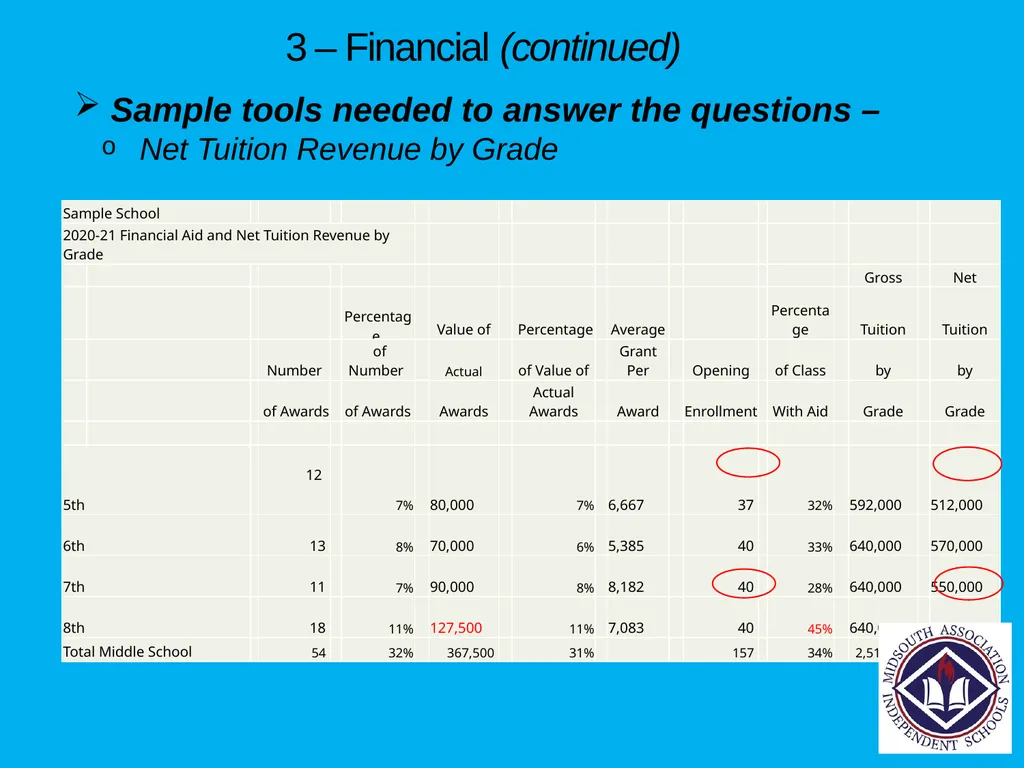
What is NTR per grade?<br>
slide34. 3 – Financial (continued) Sample tools needed to answer the questions –
Net Tuition Revenue Analysis<br>
slide35. 3 – Financial (continued) Sample tools needed to answer the questions –
Net Tuition Revenue by Grade<br>
slide36. 3 – Financial (continued) Sample questions to answer –
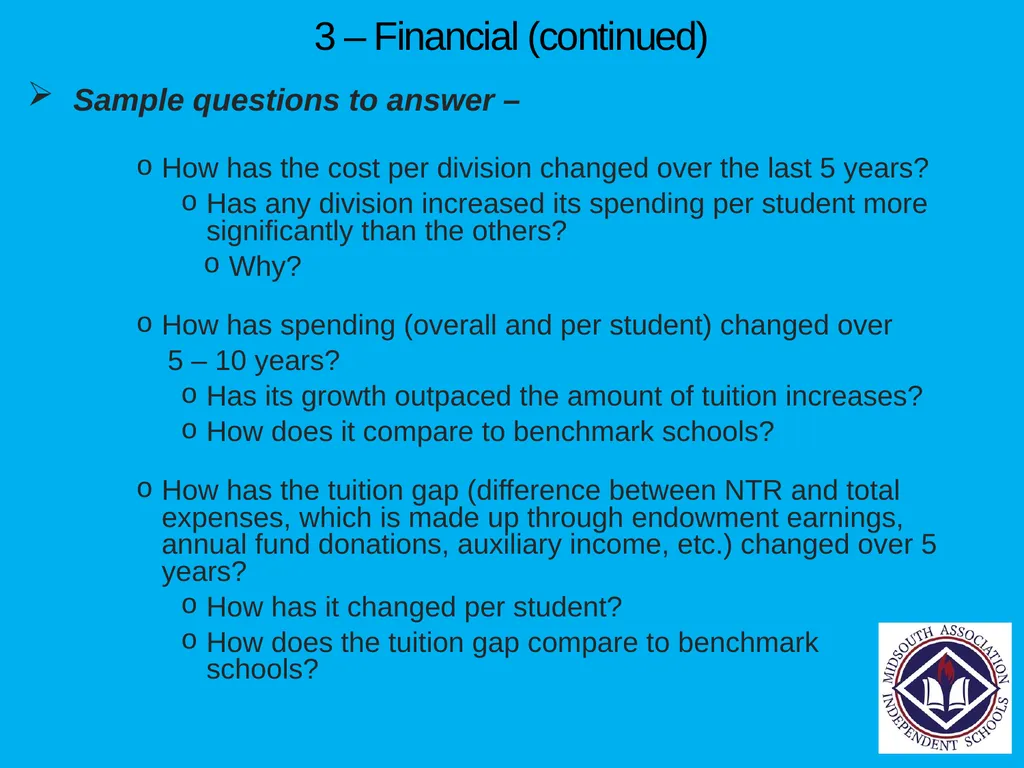
How has the cost per division changed over the last 5 years?
Has any division increased its spending per student more significantly than the others?
Why?
How has spending (overall and per student) changed over
5 – 10 years?
Has its growth outpaced the amount of tuition increases?
How does it compare to benchmark schools?
How has the tuition gap (difference between NTR and total expenses, which is made up through endowment earnings, annual fund donations, auxiliary income, etc.) changed over 5 years?
How has it changed per student?
How does the tuition gap compare to benchmark schools?<br>
slide37. 3 – Financial (continued) Sample tools needed to answer the questions –
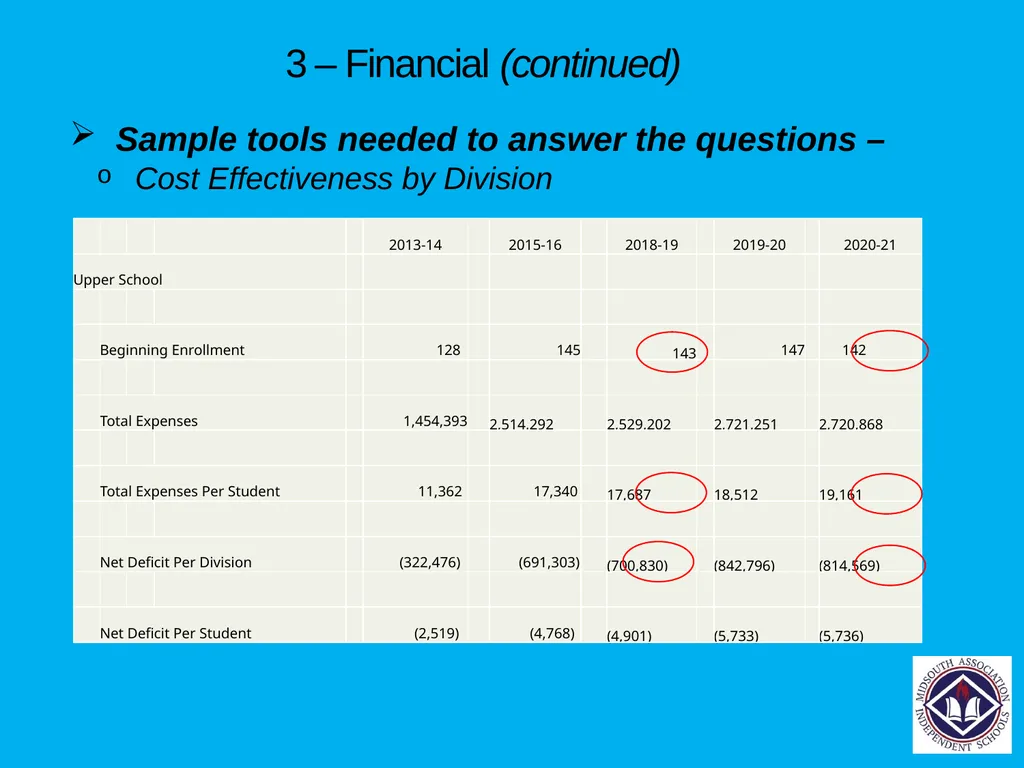
Cost Effectiveness by Division<br>
slide38. 3 – Financial (continued) Sample tools needed to answer the questions –
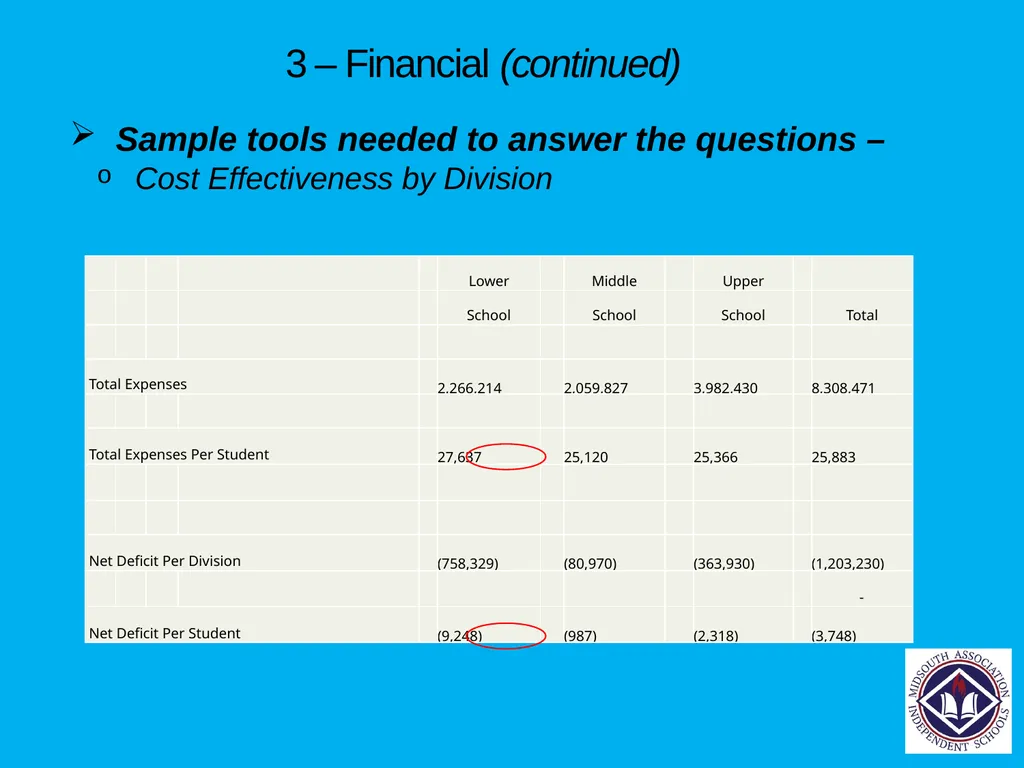
Cost Effectiveness by Division<br>
slide39. 3 – Financial (continued) Sample questions to answer –
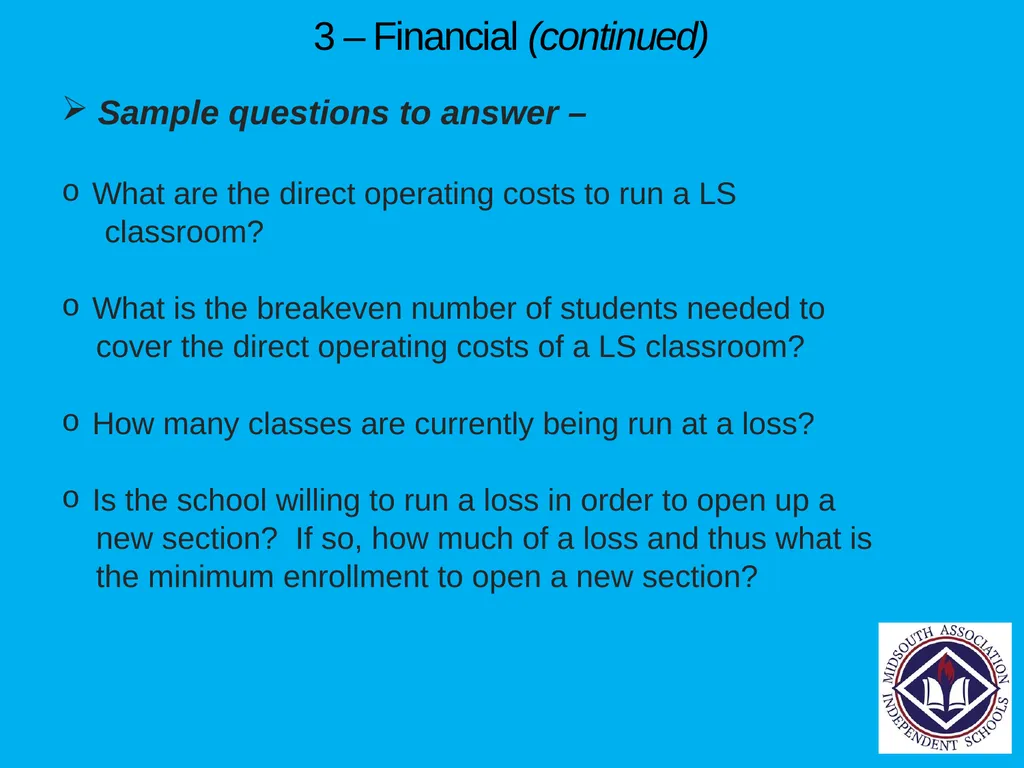
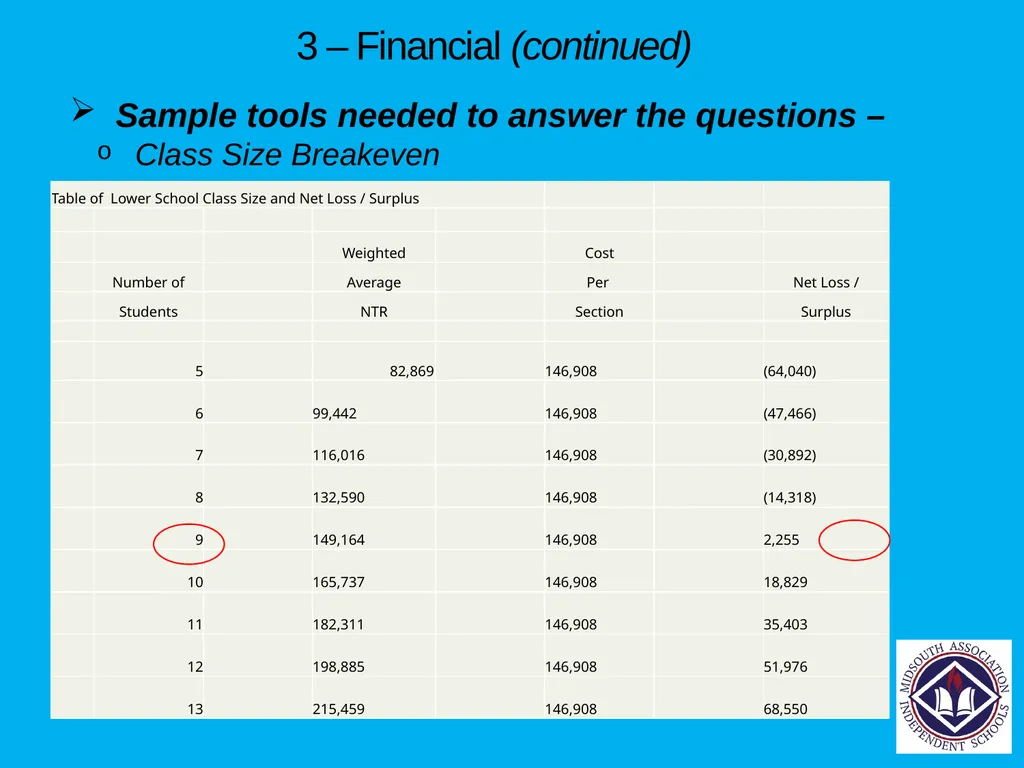
What are the direct operating costs to run a LS
classroom?
What is the breakeven number of students needed to
cover the direct operating costs of a LS classroom?
How many classes are currently being run at a loss?
Is the school willing to run a loss in order to open up a
new section? If so, how much of a loss and thus what is
the minimum enrollment to open a new section?<br>
slide40. 3 – Financial (continued) Sample tools needed to answer the questions –
Class Size Breakeven<br>
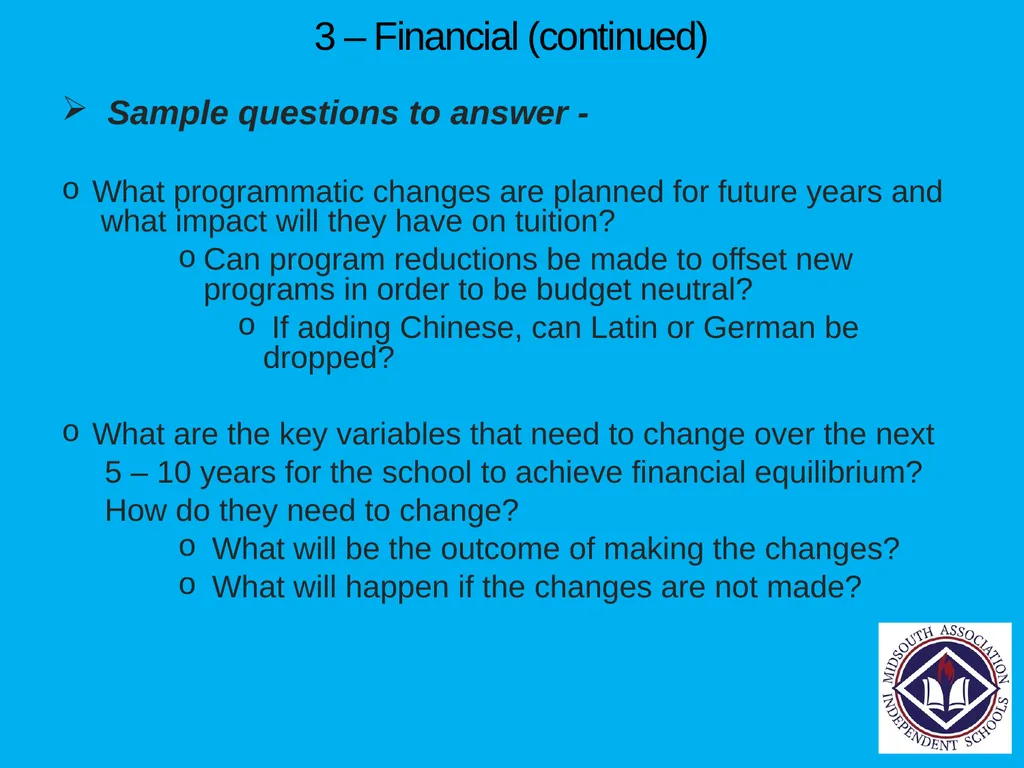
slide41. 3 – Financial (continued) Sample questions to answer -
What programmatic changes are planned for future years and what impact will they have on tuition?
Can program reductions be made to offset new programs in order to be budget neutral?
If adding Chinese, can Latin or German be dropped?
What are the key variables that need to change over the next
5 – 10 years for the school to achieve financial equilibrium?
How do they need to change?
What will be the outcome of making the changes?
What will happen if the changes are not made?<br>
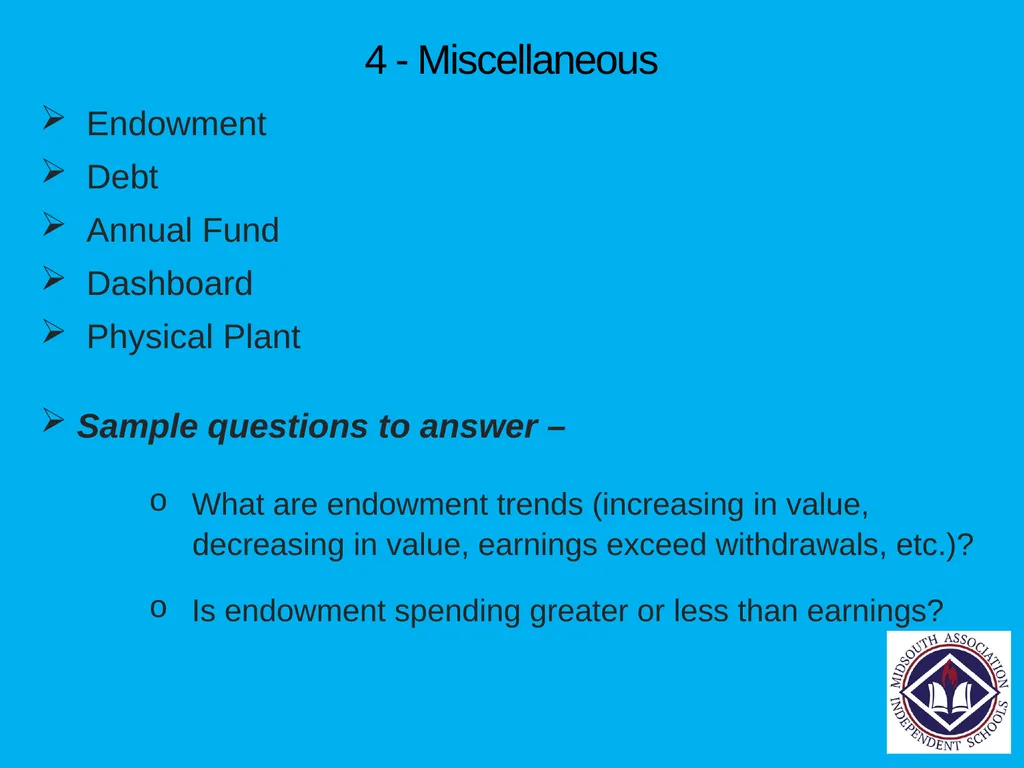
slide42. 4 - Miscellaneous Endowment
Debt
Annual Fund
Dashboard
Physical Plant
Sample questions to answer –
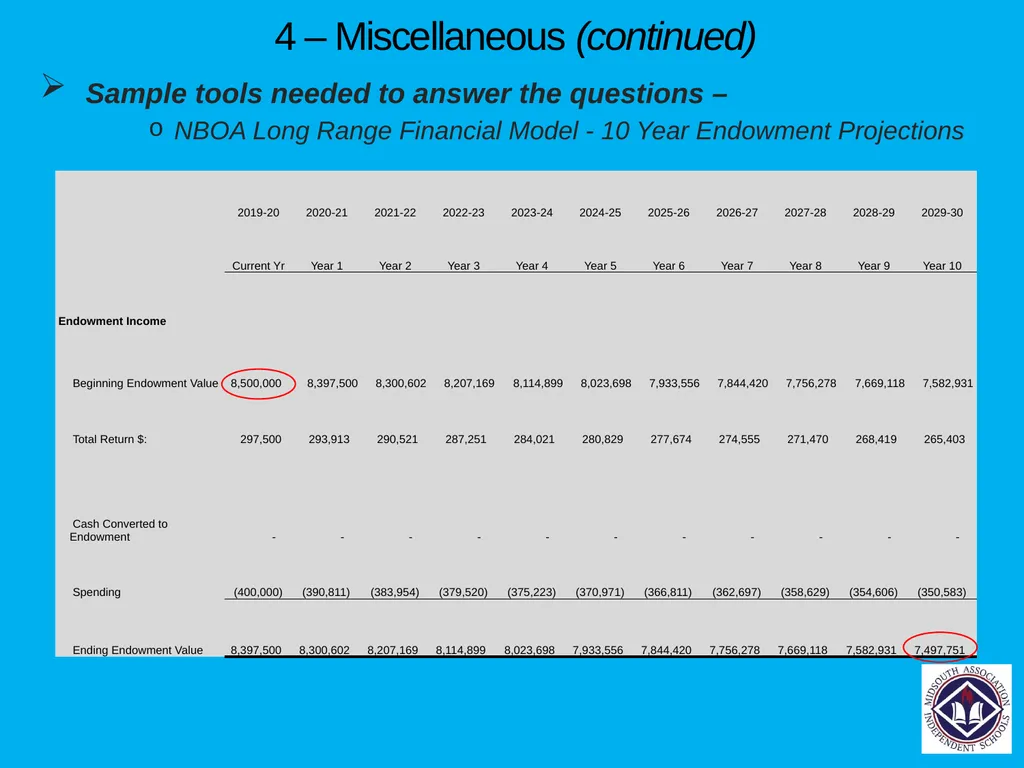
What are endowment trends (increasing in value,
decreasing in value, earnings exceed withdrawals, etc.)?
Is endowment spending greater or less than earnings?<br>
slide43. 4 – Miscellaneous (continued) Sample tools needed to answer the questions –
NBOA Long Range Financial Model - 10 Year Endowment Projections<br>
slide44. 4 – Miscellaneous (continued) Sample questions to answer (continued) –
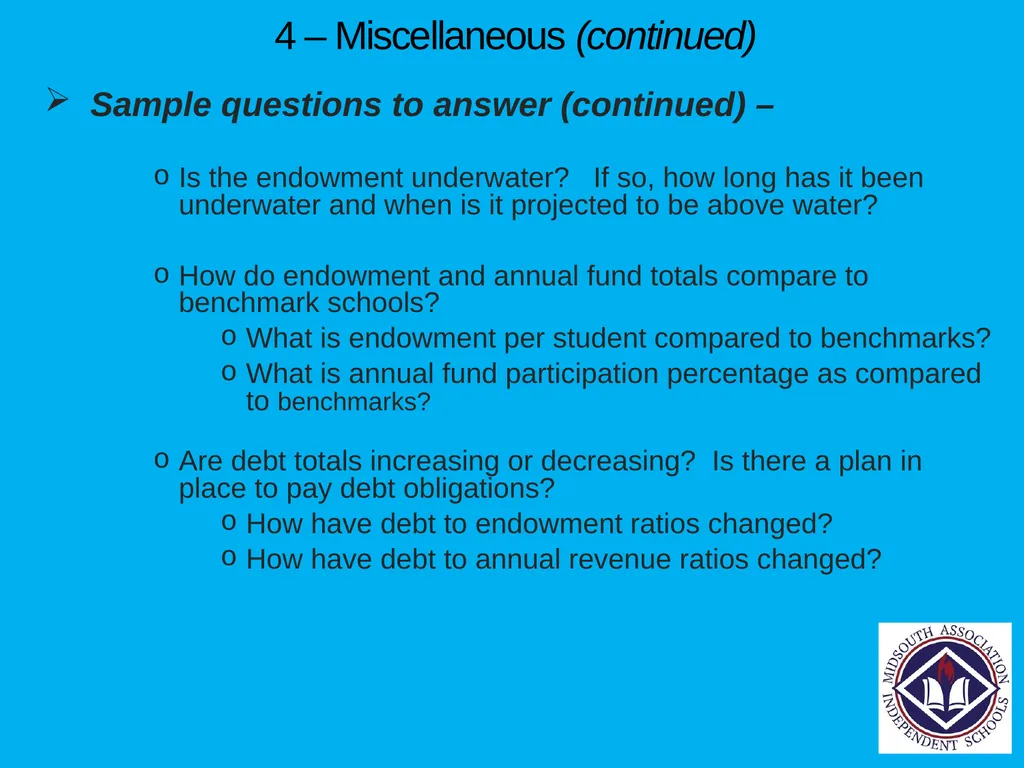
Is the endowment underwater? If so, how long has it been underwater and when is it projected to be above water?
How do endowment and annual fund totals compare to benchmark schools?
What is endowment per student compared to benchmarks?
What is annual fund participation percentage as compared to benchmarks?
Are debt totals increasing or decreasing? Is there a plan in place to pay debt obligations?
How have debt to endowment ratios changed?
How have debt to annual revenue ratios changed?<br>
slide45. 4 – Miscellaneous (continued) Sample questions to answer (continued) –
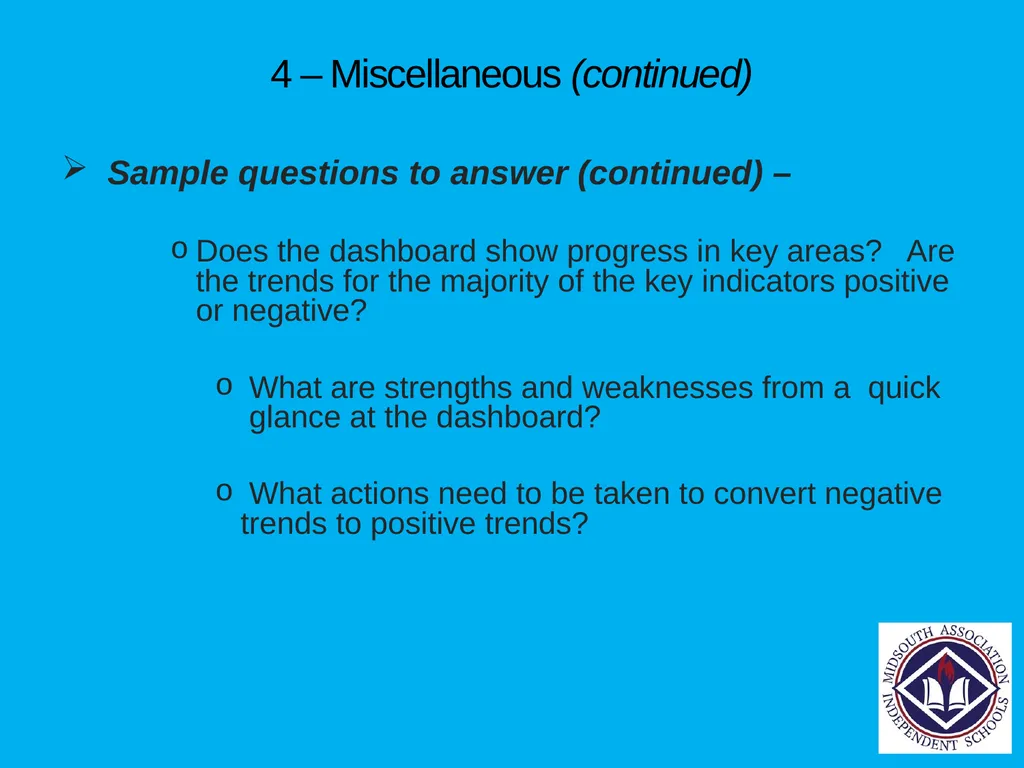
Does the dashboard show progress in key areas? Are the trends for the majority of the key indicators positive or negative?
What are strengths and weaknesses from a quick glance at the dashboard?
What actions need to be taken to convert negative trends to positive trends?<br>
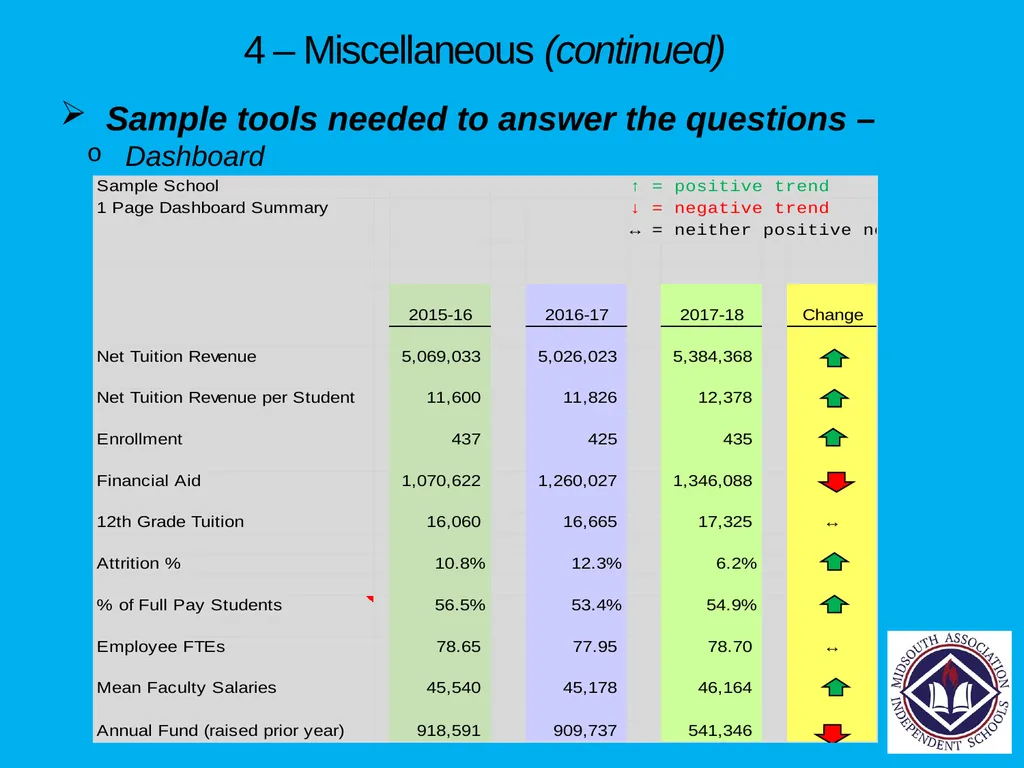
slide46. 4 – Miscellaneous (continued) Sample tools needed to answer the questions –
Dashboard<br>
slide47. 4 – Miscellaneous (continued) Sample questions to answer (continued) –
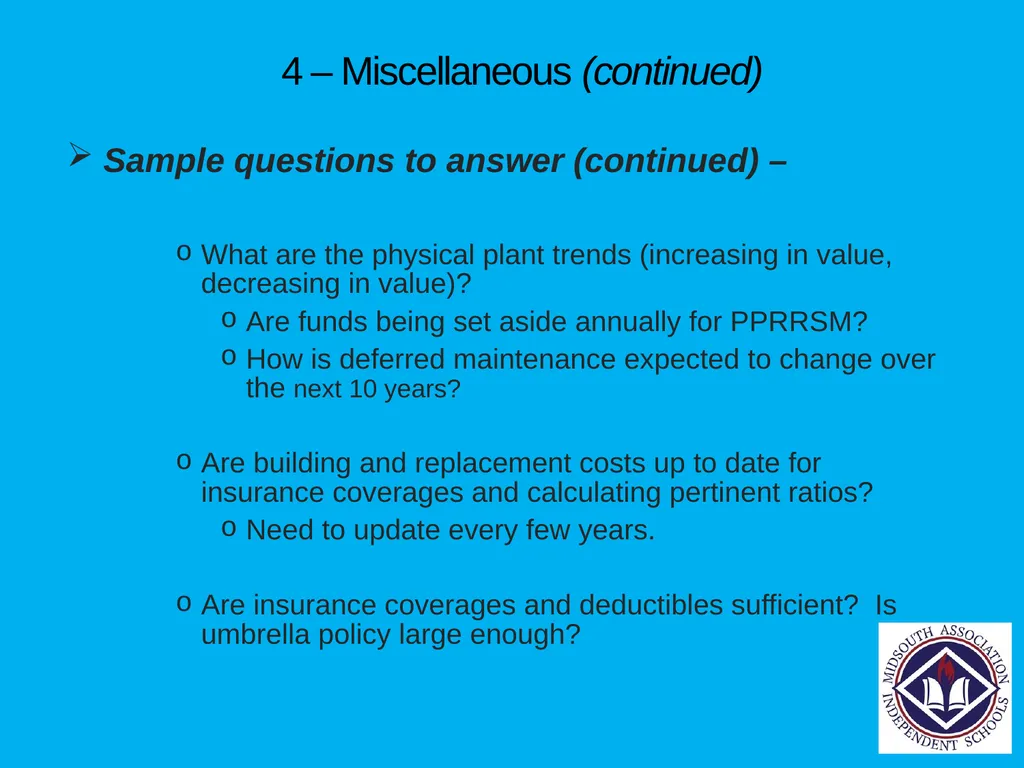
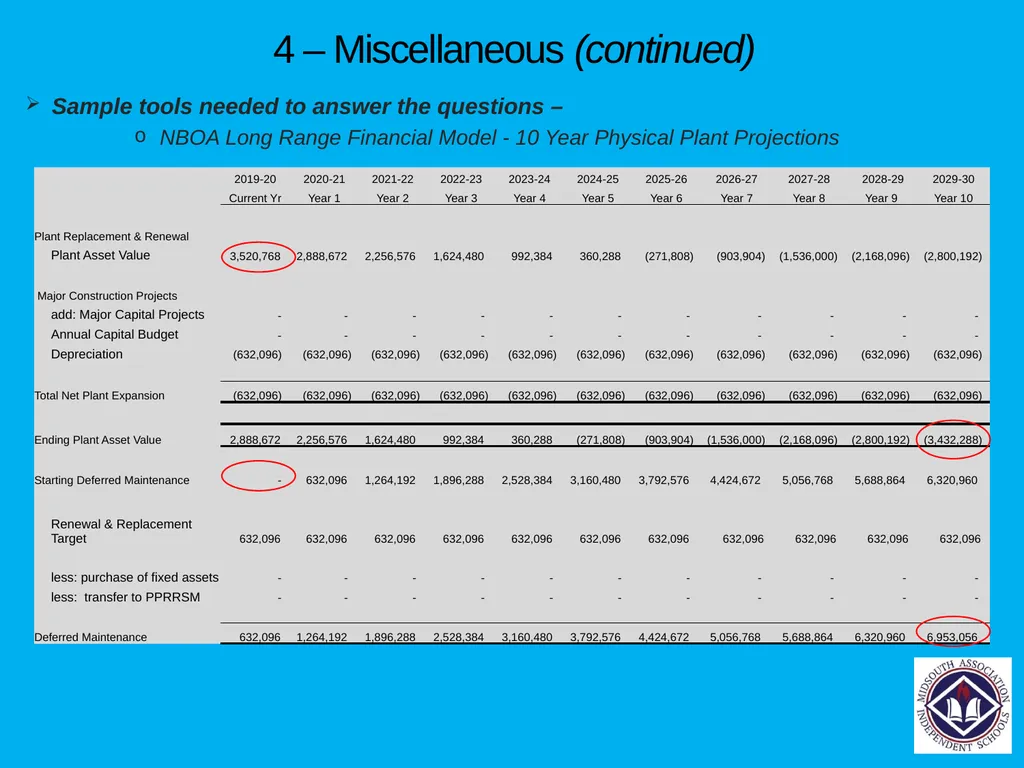
What are the physical plant trends (increasing in value, decreasing in value)?
Are funds being set aside annually for PPRRSM?
How is deferred maintenance expected to change over the next 10 years?
Are building and replacement costs up to date for insurance coverages and calculating pertinent ratios?
Need to update every few years.
Are insurance coverages and deductibles sufficient? Is umbrella policy large enough?<br>
slide48. 4 – Miscellaneous (continued) Sample tools needed to answer the questions –
NBOA Long Range Financial Model - 10 Year Physical Plant Projections<br>
slide49. Conclusion Thoughts or suggestions for your school?
Will this data be easy to obtain?
Will this data be helpful in analyzing the school’s financial status?
Will this data be helpful in preparing for the next strategic plan or accreditation process?
Who at the School will benefit from having this information –
Admissions?
Business Office?
Development?
Board Committees?
Marketing Consultants?<br>
slide50. The End –
Any questions?<br>
slide51. Additional Information / Resources Specific tools needed to answer the Enrollment
questions listed above –
DASL 5 – 10 year trends
DASL comparative data with benchmark schools (tuition, financial aid, etc.)
NBOA’s long range financial model
10 year projections for tuition, financial aid, etc.
14 year financial aid model
Percentage of each class with financial aid
Demographic information (NAIS or NBOA)
Commonfund HEPI Index to recast tuition<br>
slide52. Specific tools needed to answer the Employment
questions listed above –
DASL 5 – 10 year trends
DASL comparative data with benchmark schools
(compensation, FTEs, etc.)
NBOA’s long range financial model
Compensation, FTEs, etc.
Salary and benefits comparison to local public
schools
Commonfund CPI Index (to recast salaries) Additional Information / Resources (continued)<br>
slide53. Specific tools needed to answer the Financial
questions listed above –
DASL 5 – 10 year trends
DASL comparative data with benchmark schools (tuition,
financial aid, etc.)
NBOA’s long range financial model
10 year projections for net tuition revenue, budget shortfall,
etc.
Per student analysis (expenditures, endowment, etc.)
Cost effectiveness per division
Net tuition revenue by grade
Net tuition revenue analysis over 5 years Additional Information / Resources (continued)<br>
slide54. Specific tools needed to answer the Miscellaneous
questions listed above –
DASL 5 – 10 year trends
NBOA’s long range financial model
10 year projections for endowment and physical plant balances
3 – 5 year financial dashboard
Identify markers that are important to your school that your board wants to track and monitor Additional Information / Resources (continued)<br>
palmerballconsulting@gmail.com
www.palmerballconsulting.com Palmer D. Ball
September 23, 2021<br>
slide2. Opening Disclaimers I am not addressing fiduciary compliance of the board related to a number of financial matters typically addressed during the accreditation process (HR, 403(b), FMLA, endowments / UPMIFA, audits, etc.)
I am just addressing financial planning and analysis and things boards, as fiduciaries, should be asking questions about, and thus information the Business Officer should have.<br>
slide3. Tools “Toolbox” each school should have to make data informed decisions Strongly Recommend –
5 – 10 year NAIS DASL (Data Analysis for School Leadership) or NBOA BIIS (Business Intelligence for Independent Schools) trends for the school (NAIS DASL template provided)
For non DASL or BIIS participants, 5 – 10 year trends of important data points for the school (use NAIS DASL template
provided)
Observe the trends for each data point and identify
the most important trends and the main conclusions
that can be obtained from this chart
DASL or BIIS comparative data with benchmark schools (template
provided)
Local or regional schools
Aspirational schools
Suggestion – use ratios to normalize size differences
with other schools (i.e. endowment per student,
benefit costs as a percentage of compensation, etc.)<br>
slide4. Tools “Toolbox” each school should have to make data informed decisions (continued) Strongly Recommend –
National Business Officers Association (NBOA)’s Long Range Financial Model or MISBO’s Budget Model (available on their websites to members)
3 – 5 year financial dashboard (template provided)
14 year financial aid model (template provided)
Faculty salary analysis with public schools and
benchmark schools (template provided)
Cost effectiveness by division and LS class size
breakeven (template provided)
Net tuition revenue analysis over last 5 years
(template provided)<br>
slide5. Tools “Toolbox” each school should have to make data informed decisions (continued) Strongly Recommend -
Net tuition revenue comparison by grade and percentage of
each class with financial aid (template provided)
Recommend -
Class Size Model (template provided)
Demographic information (free from NAIS or NBOA for your
community)
Commonfund’s HEPI Index to recast tuition
Commonfund’s CPI Index to recast faculty salaries<br>
slide6. Disclaimers / Caveats Once the data has been gathered, it should be reviewed for trends and to identify the story the figures are telling.
While some info is likely well known (i.e. enrollment
trends), what might not be so obvious is what’s
causing it (attrition, new student enrollment, etc.).
General observations about faculty salaries,
employee headcount, endowment, etc. should
jump off the page from reviewing the trends and
comparing to benchmark schools.
These observations can then inform the action
plans for the strategic plan and accreditation
report.<br>
slide7. Disclaimers / Caveats (continued) The data doesn’t draw conclusions about what might be impacting the trends (i.e. decreasing enrollment might be due to value proposition, perception, quality of faculty, tuition, etc.).
The data simply identifies the trends and leaves it up to the school’s leadership to determine the contributing factors and the plan of action to address.
For example, if new student enrollment is declining, the strategic plan might target increasing the number of new students through re-branding, increased marketing, scholarship competitions, etc.<br>
slide8. Disclaimers / Caveats (continued) Finally, sample questions to ask are provided – this is not an exhaustive list of questions and it does not touch on every subject. This simply shows the types of questions that school leaders should ask to determine opportunities for improvement and inclusion in the strategic plan or accreditation report. Thus, these are questions that Business Officers need to be prepared to answer.
Some regional accreditation standards ask these exact questions, although most standards are more general and not as specific.<br>
slide9. Tools should be used to review trends in 4 major areas 1 - Enrollment
Enrollment
Financial Aid
Tuition and Fees
2 – Employment
Compensation
FTEs
Class Sizes<br>
slide10. Tools should be used to review trends in 4 major areas (continued) 3 – Financial
Net Tuition Revenue
NAIS DASL comparative data
Cost effectiveness by division
Tuition Gap (difference between NTR and total expenses)
Future budget projections
4 – Miscellaneous
Endowment
Debt
Annual Fund
Dashboard
Physical Plant<br>
slide11. 2 Major Questions to Ask Where has the school been?
What does the school’s recent historical data reveal about what the school has been doing well, or what the school hasn’t been doing well?
Where is the school going?
What does the school’s recent historical data reveal about where the school will be in 5 years if the trends continue?
Can the school focus efforts to turn around the negative trends?
What will happen if the school doesn’t turn around the negative trends?
What new actions does the school need to take to get to where they want to be?<br>
slide12. 1 - Enrollment Enrollment Trends
Financial Aid Trends
Tuition and Fees
Sample questions to answer –
Is tuition appropriate?
How does it compare to benchmark schools?
How has it changed over 5 years compared to benchmark schools?
Has it kept up with inflation over the last 5 years?
Use Commonfund HEPI Index figures to recast tuition
What are enrollment trends for –
New student enrollment?
Attrition?
International students?
Percentage of student body on financial aid?<br>
slide13. 1 - Enrollment (continued) Sample tools needed to answer the questions –
Change in 12th grade tuition over 5 years compared to benchmark schools<br>
slide14. 1 - Enrollment (continued) Sample tools needed to answer the questions –
12th grade tuition recast for inflation over 5 years shows tuition has actually declined for the last 2 years<br>
slide15. 1 - Enrollment (continued) Sample tools needed to answer the questions –
DASL 5 – 10 year trends<br>
slide16. 1 - Enrollment (continued) Sample questions to answer (continued)
How is tuition projected to change over the next 5 – 10 years?
Can the school’s families afford the tuition in 5 – 10 years?
How are demographics in the community expected to
change in 5 – 10 years?
How much will the tuition gaps between divisions or grades
widen over 5 – 10 years?
Enough to become exit points?
Does the tuition structure need to be reviewed to verify it
remains appropriate? Should the school consider one
tuition rate for each division? A different tuition rate for each
grade? The same tuition rate for each grade? Indexed
tuition?<br>
slide17. 1 - Enrollment (continued) Sample tools needed to answer the questions –
NBOA Long Range Financial Model – 10 Year Tuition Projections<br>
slide18. 1 - Enrollment (continued) Sample questions to answer (continued)
Is financial aid appropriate?
How does it compare to benchmark schools?
How has it changed over 5 years as compared to the
benchmark schools?
Is financial aid growth mission driven or an effort to increase enrollment?
Does your school consider financial aid to be an expense or a revenue generator?
Is financial aid funded or a tuition discount?
The following questions relate to tuition discounting used to increase enrollment
How is financial aid expected to change over the next 5 – 10 years?
How is the percentage of full pay students expected to change
over the next 5 – 10 years?
How will that impact Annual Giving, Capital Campaign giving, parent participation in the school, etc.?
Has there been a change in grades / divisions receiving aid?
For example, years ago, none in Lower School - now 30%.<br>
slide19. 1 - Enrollment (continued) Sample tools needed to answer the questions –
14 Year Financial Aid Model<br>
slide20. 1 - Enrollment (continued) Sample questions to answer (continued)
What percentage of new students are on financial
aid? What is the trend over the last 5 years – how
has that percentage changed?
How about by division? Is any division getting more new students on aid than other divisions?
What percentage of departing students are on
financial aid? What is the trend over the last
5 years - how has that percentage changed?
If the percentage is increasing each year, does
this mean that financial aid students are just
being bought for a few years, which negatively
impacts attrition?<br>
slide21. 1 - Enrollment (continued) Sample questions to answer (continued)
How does the % of gross tuition revenue spent on financial aid compare to benchmark schools?
How does it compare to NAIS average of 20 – 22%?
(NAIS’ average includes Tuition Remission so you need to include TR in your calculation)
What is the average award as a percentage of tuition and how has that changed over 5 years?
What percentage of each grade is on financial aid? Are there any grades that are effectively running entire sections of nothing but financial aid students? Are those sections generating enough revenue to cover the cost of the section?<br>
slide22. 1 – Enrollment (continued) Sample questions to answer –
On average, what percentage of tuition do financial aid recipients pay and what percentage of tuition do financial aid recipients receive?
Our goal was to collect, on average, more tuition dollars from financial aid recipients, than we gave them
Our goal was to collect 51% and award 49%
How many financial aid recipients are receiving awards that are 76 – 100% of tuition, and how has that number changed over 5 years?
Ditto for number of recipients for awards that are 0 – 25% of tuition?<br>
slide23. 1 - Enrollment (continued) Sample tools needed to answer the questions -
Percentage of each class with Financial Aid<br>
slide24. 2 - Employment Compensation
FTEs
Class Sizes
Sample questions to answer –
Are faculty salaries appropriate?
How do they compare to benchmark schools?
Have they kept up with inflation over the last 5 years?
Use Commonfund CPI figures to recast faculty salaries
Are class sizes appropriate?
What is the trend for student / teacher ratios?<br>
slide25. 2 – Employment (continued) Sample tools needed to answer the questions –
Recast mean faculty salaries have decreased each of the last 4 years The mean faculty salary, as adjusted for inflation, is actually $2,000 less than 4 years ago<br>
slide26. 2 – Employment (continued) Sample tools needed to answer the questions –
Are class sizes appropriate? Use a class size model to determine parameters for opening new sections.<br>
slide27. 2 – Employment (continued) Sample questions to answer (continued)
How are faculty salaries in comparison to
the school’s chief competition, be it the
local public schools or local, regional or
national independent schools?
How about benefits? Are they competitive?
How have salaries changed over the last 5
years compared to the competition?
Has the school made up ground, stayed
even, or lost ground?<br>
slide28. 2 – Employment (continued) Sample tools needed to answer the questions –
Salary comparison to public schools<br>
slide29. 2 – Employment (continued) Sample tools needed to answer the questions –
DASL comparison with benchmark schools<br>
slide30. 2 – Employment (continued) Sample questions to answer (continued)
At the end of the day, despite what the numbers show related
to salaries, the overriding questions are –
Is the school losing good faculty because salaries or
benefits aren’t competitive?
Is the school unable to hire the faculty they want because
salaries or benefits aren’t competitive?
Does the school have an aging faculty and are massive
retirements looming? Will younger replacements have a
different set of needs (maternity leave, tuition remission, less
willingness to coach or go on overnight trips, etc.?)<br>
slide31. 2 - Employment (continued) Sample questions to answer (continued)
Is employee headcount appropriate? How does it compare to benchmark schools?
How has employee headcount changed over the last 5 years?
Has the change in employee headcount been consistent with the change in student headcount –
Has employee headcount increased as the student headcount
has increased?
Has employee headcount decreased as the student headcount
has decreased?
Keep in mind some fixed costs don’t change as enrollment
changes (i.e. a librarian is needed even if enrollment drops
from 650 to 600).<br>
slide32. 2 - Employment (continued) Sample questions to answer (continued)
Is the change in employee headcount sustainable?
What percentage of the budget comprises salaries and benefits?
For most schools, salaries and benefits are 70 – 80% of
the budget
Likewise, net tuition revenue is typically 70 – 80% of the
budget, thus tuition dollars pay employee costs
How have benefits as a percentage of total compensation changed over the last 5 years?
Is the change sustainable?
If not, what can be done to change it?<br>
slide33. 3 - Financial Net Tuition Revenue
NAIS DASL comparative data
Cost effectiveness by division
Tuition Gap (difference between NTR and total expenses)
Future budget projections
Sample questions to answer –
How has Net Tuition Revenue per student changed each of the last 5 years?
What percentage of each year’s tuition increase did the school actually realize?
Has NTR per student increased each year?
What is NTR per grade?<br>
slide34. 3 – Financial (continued) Sample tools needed to answer the questions –
Net Tuition Revenue Analysis<br>
slide35. 3 – Financial (continued) Sample tools needed to answer the questions –
Net Tuition Revenue by Grade<br>
slide36. 3 – Financial (continued) Sample questions to answer –
How has the cost per division changed over the last 5 years?
Has any division increased its spending per student more significantly than the others?
Why?
How has spending (overall and per student) changed over
5 – 10 years?
Has its growth outpaced the amount of tuition increases?
How does it compare to benchmark schools?
How has the tuition gap (difference between NTR and total expenses, which is made up through endowment earnings, annual fund donations, auxiliary income, etc.) changed over 5 years?
How has it changed per student?
How does the tuition gap compare to benchmark schools?<br>
slide37. 3 – Financial (continued) Sample tools needed to answer the questions –
Cost Effectiveness by Division<br>
slide38. 3 – Financial (continued) Sample tools needed to answer the questions –
Cost Effectiveness by Division<br>
slide39. 3 – Financial (continued) Sample questions to answer –
What are the direct operating costs to run a LS
classroom?
What is the breakeven number of students needed to
cover the direct operating costs of a LS classroom?
How many classes are currently being run at a loss?
Is the school willing to run a loss in order to open up a
new section? If so, how much of a loss and thus what is
the minimum enrollment to open a new section?<br>
slide40. 3 – Financial (continued) Sample tools needed to answer the questions –
Class Size Breakeven<br>
slide41. 3 – Financial (continued) Sample questions to answer -
What programmatic changes are planned for future years and what impact will they have on tuition?
Can program reductions be made to offset new programs in order to be budget neutral?
If adding Chinese, can Latin or German be dropped?
What are the key variables that need to change over the next
5 – 10 years for the school to achieve financial equilibrium?
How do they need to change?
What will be the outcome of making the changes?
What will happen if the changes are not made?<br>
slide42. 4 - Miscellaneous Endowment
Debt
Annual Fund
Dashboard
Physical Plant
Sample questions to answer –
What are endowment trends (increasing in value,
decreasing in value, earnings exceed withdrawals, etc.)?
Is endowment spending greater or less than earnings?<br>
slide43. 4 – Miscellaneous (continued) Sample tools needed to answer the questions –
NBOA Long Range Financial Model - 10 Year Endowment Projections<br>
slide44. 4 – Miscellaneous (continued) Sample questions to answer (continued) –
Is the endowment underwater? If so, how long has it been underwater and when is it projected to be above water?
How do endowment and annual fund totals compare to benchmark schools?
What is endowment per student compared to benchmarks?
What is annual fund participation percentage as compared to benchmarks?
Are debt totals increasing or decreasing? Is there a plan in place to pay debt obligations?
How have debt to endowment ratios changed?
How have debt to annual revenue ratios changed?<br>
slide45. 4 – Miscellaneous (continued) Sample questions to answer (continued) –
Does the dashboard show progress in key areas? Are the trends for the majority of the key indicators positive or negative?
What are strengths and weaknesses from a quick glance at the dashboard?
What actions need to be taken to convert negative trends to positive trends?<br>
slide46. 4 – Miscellaneous (continued) Sample tools needed to answer the questions –
Dashboard<br>
slide47. 4 – Miscellaneous (continued) Sample questions to answer (continued) –
What are the physical plant trends (increasing in value, decreasing in value)?
Are funds being set aside annually for PPRRSM?
How is deferred maintenance expected to change over the next 10 years?
Are building and replacement costs up to date for insurance coverages and calculating pertinent ratios?
Need to update every few years.
Are insurance coverages and deductibles sufficient? Is umbrella policy large enough?<br>
slide48. 4 – Miscellaneous (continued) Sample tools needed to answer the questions –
NBOA Long Range Financial Model - 10 Year Physical Plant Projections<br>
slide49. Conclusion Thoughts or suggestions for your school?
Will this data be easy to obtain?
Will this data be helpful in analyzing the school’s financial status?
Will this data be helpful in preparing for the next strategic plan or accreditation process?
Who at the School will benefit from having this information –
Admissions?
Business Office?
Development?
Board Committees?
Marketing Consultants?<br>
slide50. The End –
Any questions?<br>
slide51. Additional Information / Resources Specific tools needed to answer the Enrollment
questions listed above –
DASL 5 – 10 year trends
DASL comparative data with benchmark schools (tuition, financial aid, etc.)
NBOA’s long range financial model
10 year projections for tuition, financial aid, etc.
14 year financial aid model
Percentage of each class with financial aid
Demographic information (NAIS or NBOA)
Commonfund HEPI Index to recast tuition<br>
slide52. Specific tools needed to answer the Employment
questions listed above –
DASL 5 – 10 year trends
DASL comparative data with benchmark schools
(compensation, FTEs, etc.)
NBOA’s long range financial model
Compensation, FTEs, etc.
Salary and benefits comparison to local public
schools
Commonfund CPI Index (to recast salaries) Additional Information / Resources (continued)<br>
slide53. Specific tools needed to answer the Financial
questions listed above –
DASL 5 – 10 year trends
DASL comparative data with benchmark schools (tuition,
financial aid, etc.)
NBOA’s long range financial model
10 year projections for net tuition revenue, budget shortfall,
etc.
Per student analysis (expenditures, endowment, etc.)
Cost effectiveness per division
Net tuition revenue by grade
Net tuition revenue analysis over 5 years Additional Information / Resources (continued)<br>
slide54. Specific tools needed to answer the Miscellaneous
questions listed above –
DASL 5 – 10 year trends
NBOA’s long range financial model
10 year projections for endowment and physical plant balances
3 – 5 year financial dashboard
Identify markers that are important to your school that your board wants to track and monitor Additional Information / Resources (continued)<br>