Financial Reporting and Analysis Seventh Edition Chapter 5 Essentials of Financial Statement Analysis McGraw-Hill Education. All rights reserved. Authorized only for instructor use in the classroom. No reproduction or further distribution
"Financial Reporting and Analysis Seventh Edition" is the property of its rightful owner. Permission is granted to
download and print the materials on this website for personal, non-commercial use only, and to display it
on your personal computer provided you do not modify the materials and that you retain all copyright
notices contained in the materials. By downloading content from our website, you accept the terms of this
agreement.
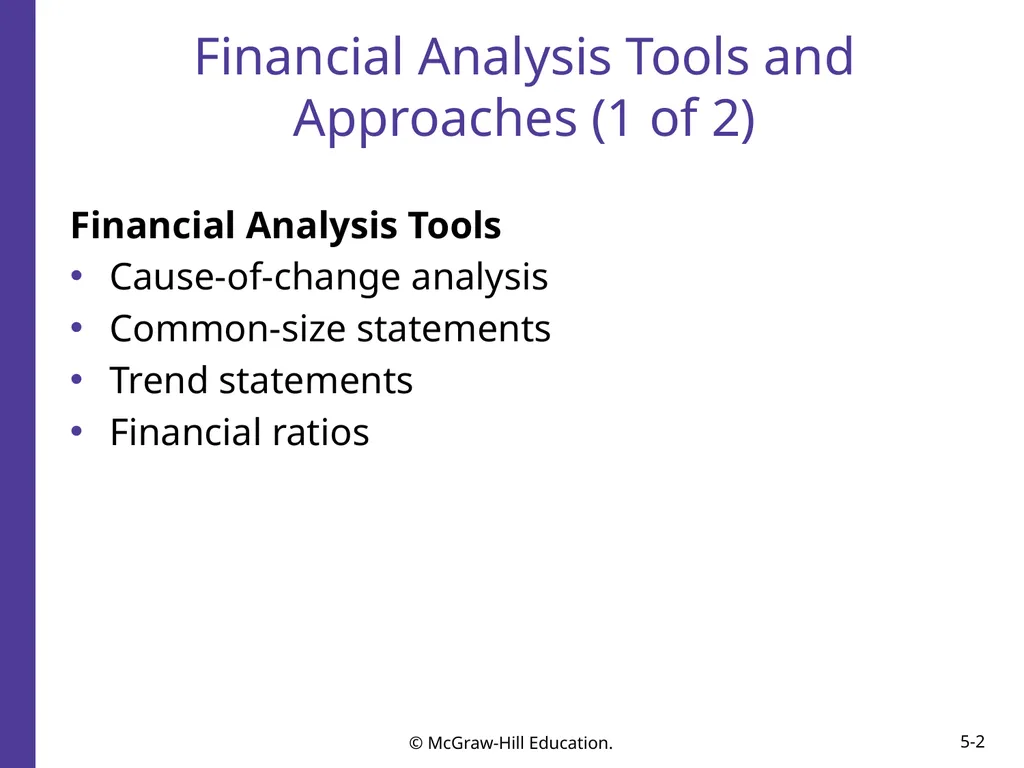
Financial Analysis Tools and Approaches (1 of 2) Financial Analysis Tools
Cause-of-change analysis
Common-size statements
Trend statements
Financial ratios<br>
03
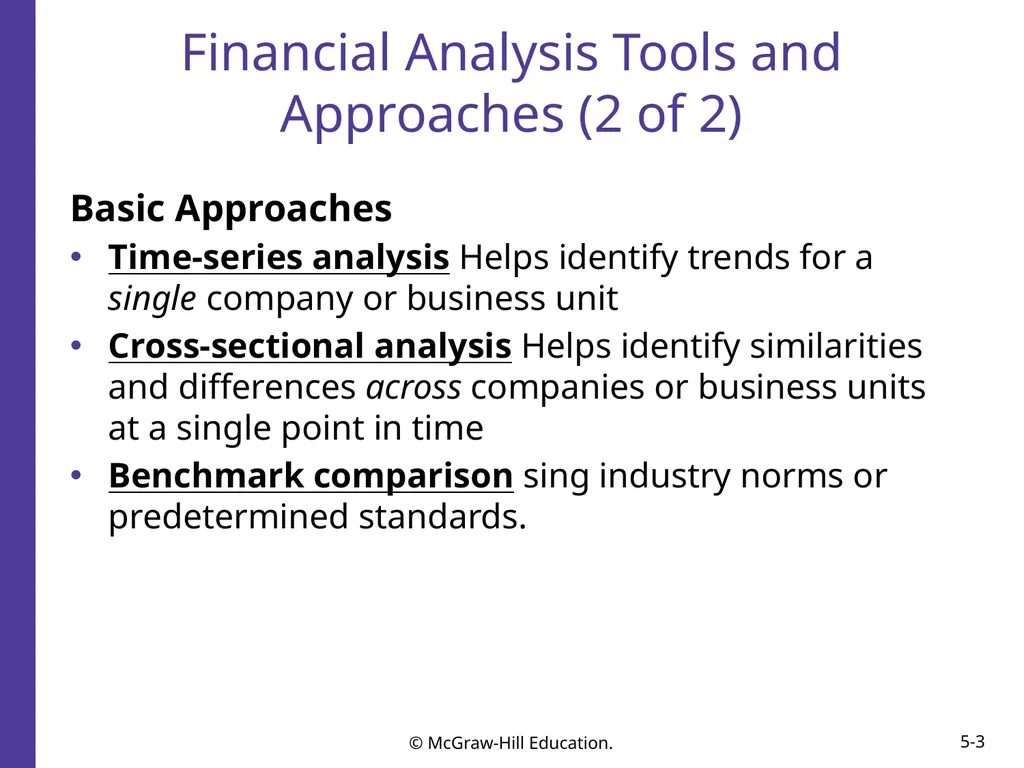
Financial Analysis Tools and Approaches (2 of 2) Basic Approaches
Time-series analysis Helps identify trends for a single company or business unit
Cross-sectional analysis Helps identify similarities and differences across companies or business units at a single point in time
Benchmark comparison sing industry norms or predetermined standards.<br>
04
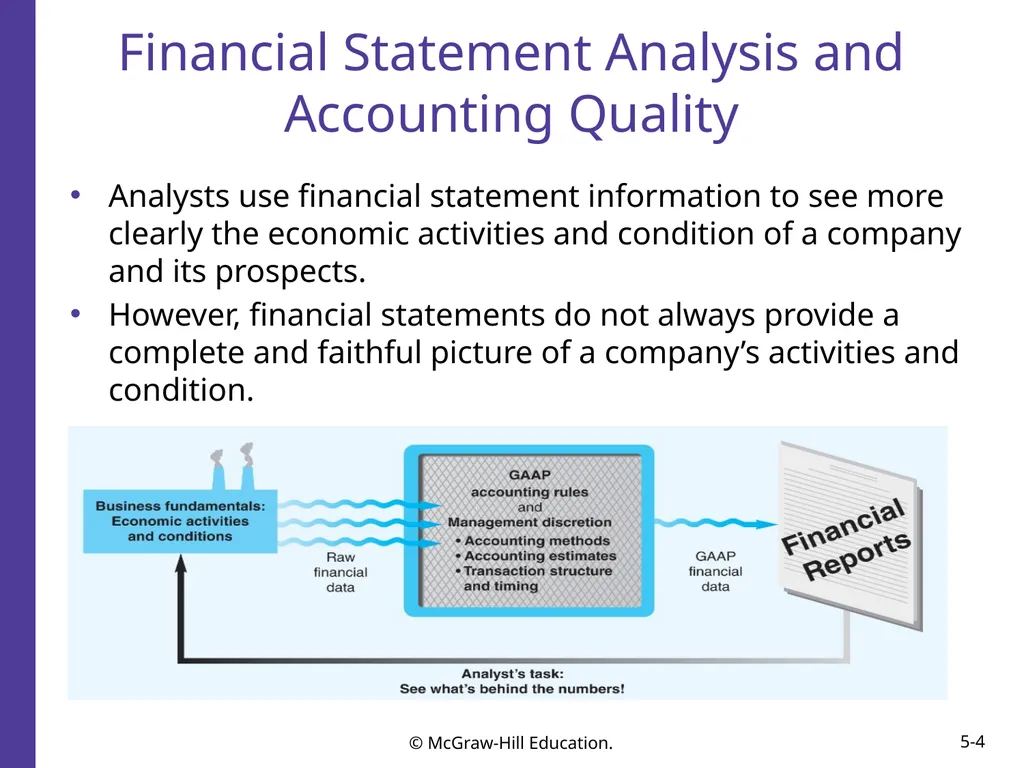
Financial Statement Analysis and Accounting Quality Analysts use financial statement information to see more clearly the economic activities and condition of a company and its prospects.
However, financial statements do not always provide a complete and faithful picture of a company’s activities and condition.<br>
05
Examples of How the Financial Accounting “Filter” Works (1 of 2) GAAP accounting rules
Managers can structure transactions to achieve particular financial reporting results. For example, GAAP requires reporting of capital leases on the balance sheet; operating leases are “off-balance-sheet.”<br>
06
Examples of How the Financial Accounting “Filter” Works (2 of 2) Management discretion
Accounting methods
GAAP allows managers to choose between methods (e.g., LIFO vs. FIFO); the balance sheet and income statement and financial ratios and comparisons are affected.
Accounting estimates
Managers have discretion over accounting estimates, such as estimated bad debt expense, which can results in “earnings management.”
Transaction structure and timing
Managers have some discretion over the timing of business transactions such as discretionary expenditures for advertising.<br>
07
Another Potential Threat to Quality: Conflicts of Interest Conflicts of interest pose another potential threat to the quality of financial reports.
Conflicts of interest arise when what is good for one party (for example, management) isn’t necessarily good for another party (say, lenders or outside investors).
Companies have an obligation to disclose business transactions that involve potential conflicts of interest.<br>
08
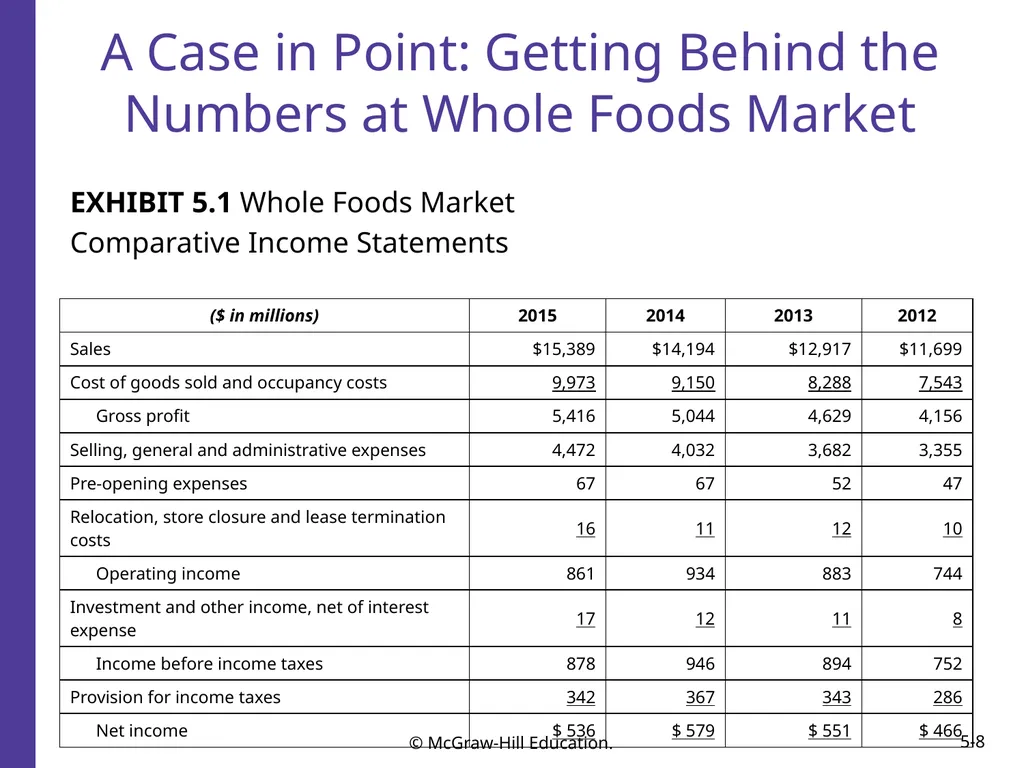
A Case in Point: Getting Behind the Numbers at Whole Foods Market EXHIBIT 5.1 Whole Foods Market
Comparative Income Statements<br>
09
Cause-of-Change Analysis (1 of 2) One way to quantify the components of change is with a “cause-of-change analysis,” which shows the effects of individual changes on the change in net income.
Operating income = Sales × Operating margin %
Income before income taxes = Operating income + Interest and investment income (expense), net
Net income = Income before income taxes × (1 – Effective income tax rate)<br>
10
Cause-of-Change Analysis (2 of 2) EXHIBIT 5.2 Whole Foods Market
Simple Financial Model Representation of Net Income<br>
11
Whole Foods Market: Cause-of-Change Analysis 2015 vs. 2012 (1 of 2) Let’s change sales from the 2012 level to the 2015 level, holding all other inputs to the model constant at the 2012 level.
EXHIBIT 5.3 Whole Foods Market
Panel (a): Cause-of-Change Analysis 2015 vs. 2012<br>
12
Whole Foods Market: Cause-of-Change Analysis 2015 vs. 2012 (2 of 2) $ 536: Hypothetical operating income that would have been achieved if sales had grown as they did, but operating margin percentage remained unchanged.<br>
13
Whole Foods Market: Cause-of-Change Analysis 2015 versus 2014 (1 of 2) We can use cause-of-change analysis to compare any two years.
EXHIBIT 5.3 Whole Foods Market
Panel (b): Cause-of-change Analysis 2015 vs. 2014
($ in millions)<br>
14
Whole Foods Market: Cause-of-Change Analysis 2015 versus 2014 (2 of 2) (2015 sales – 2014 sales) × 2014 margin % × (1 – 2014 effective tax rate)
2015 sales × (2015 margin % – 2014 margin %) × (1 – 2014 effective tax rate)
(2015 interest and investment income – 2014 interest and investment income) × (1 – 2014 effective tax rate)
2015 pretax income × [– (2015 effective income tax rate – 2014 effective income tax rate)]
48: Impact of sales growth
(93):Income-reducing impact of margin reductions<br>
15
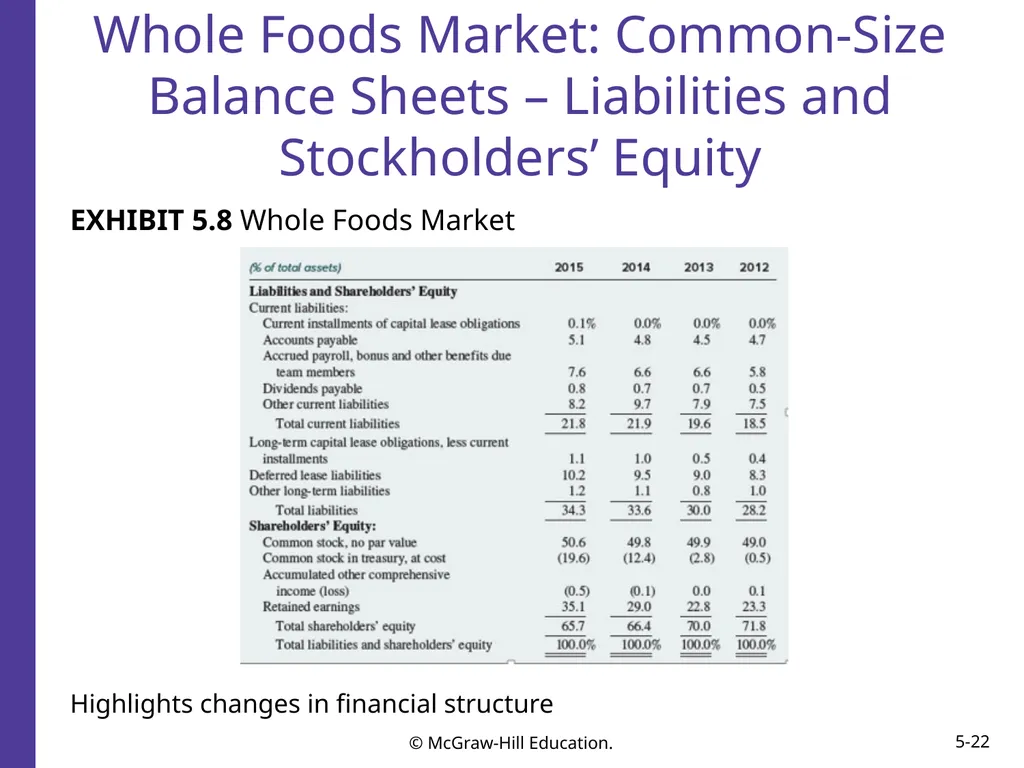
Common-Size Statements Financial analysts use common-size and trend statements of net income to help spot changes in a company’s cost structure and profit performance.
Common-size income statements recast each statement item as a percentage of sales.
Common-size income statements show how much of each sales dollar the company spent on operating expenses and other business costs and how much of each sales dollar hit the bottom line as profit.
Common-size balance sheets recast each statement item as a percentage of total assets.<br>
16
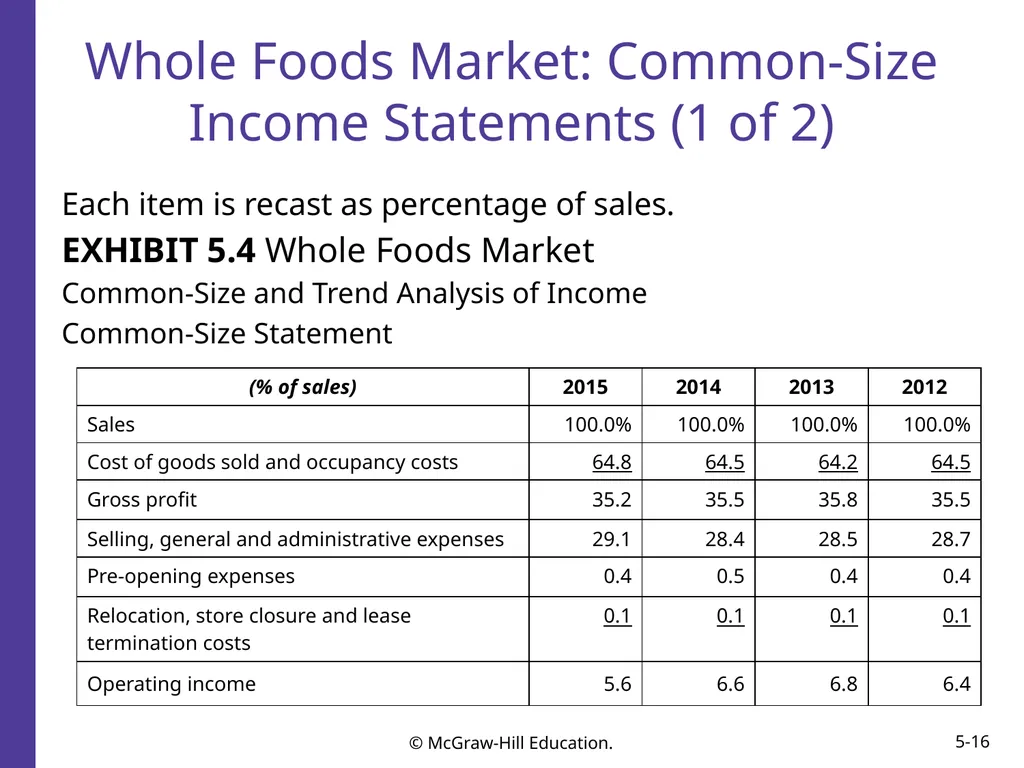
Whole Foods Market: Common-Size Income Statements (1 of 2) Each item is recast as percentage of sales.
EXHIBIT 5.4 Whole Foods Market
Common-Size and Trend Analysis of Income
Common-Size Statement<br>
17
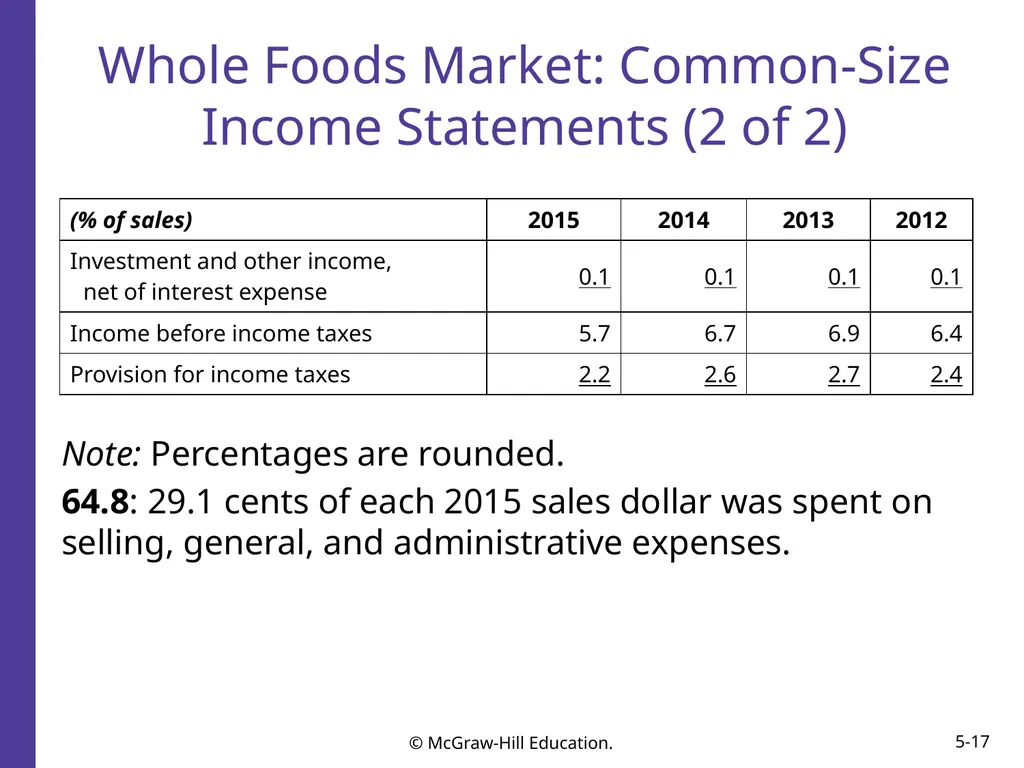
Whole Foods Market: Common-Size Income Statements (2 of 2) Note: Percentages are rounded.
64.8: 29.1 cents of each 2015 sales dollar was spent on selling, general, and administrative expenses.<br>
18
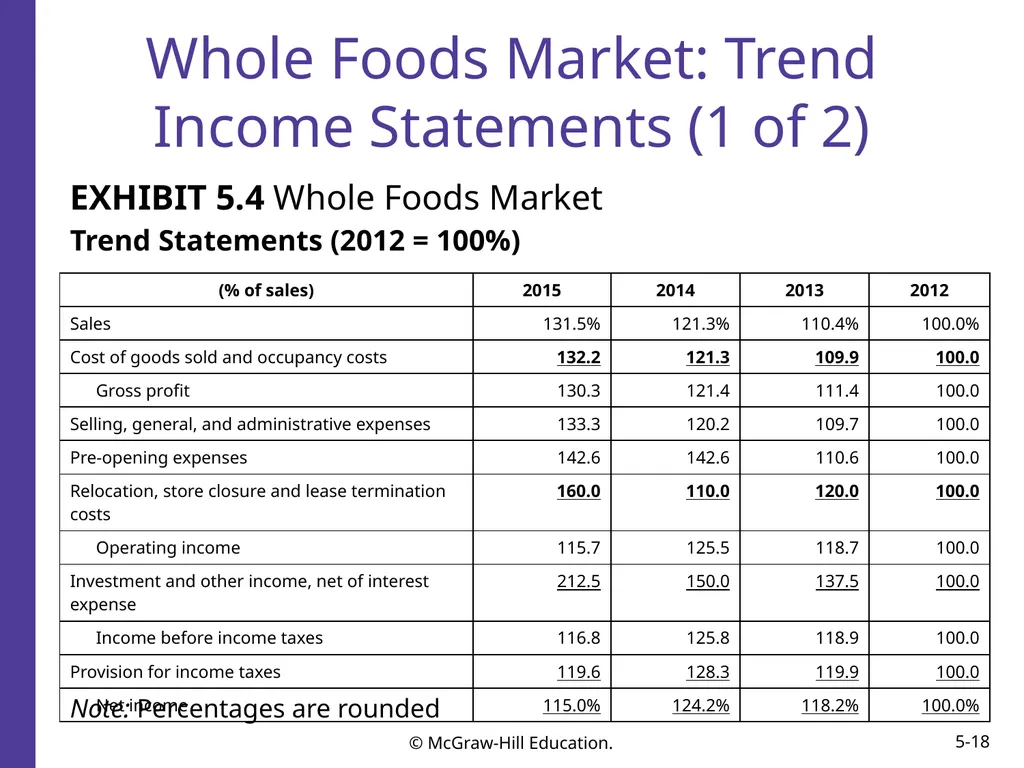
Whole Foods Market: Trend Income Statements (1 of 2) EXHIBIT 5.4 Whole Foods Market
Trend Statements (2012 = 100%) Note: Percentages are rounded<br>
19
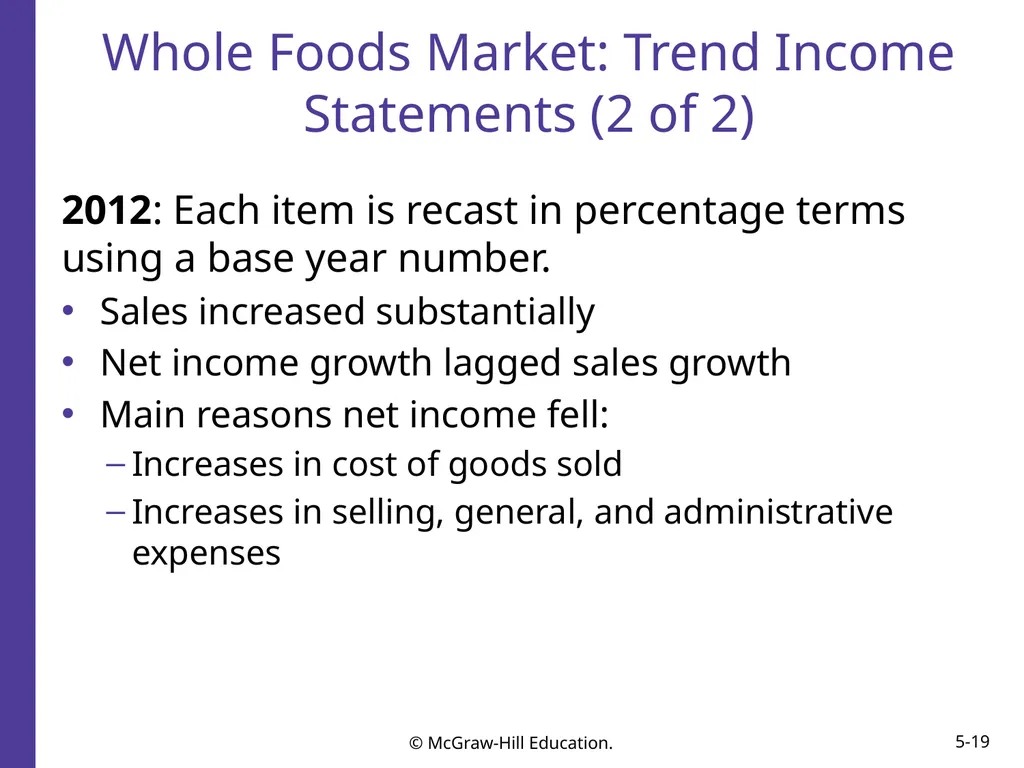
Whole Foods Market: Trend Income Statements (2 of 2) 2012: Each item is recast in percentage terms using a base year number.
Sales increased substantially
Net income growth lagged sales growth
Main reasons net income fell:
Increases in cost of goods sold
Increases in selling, general, and administrative expenses<br>
20
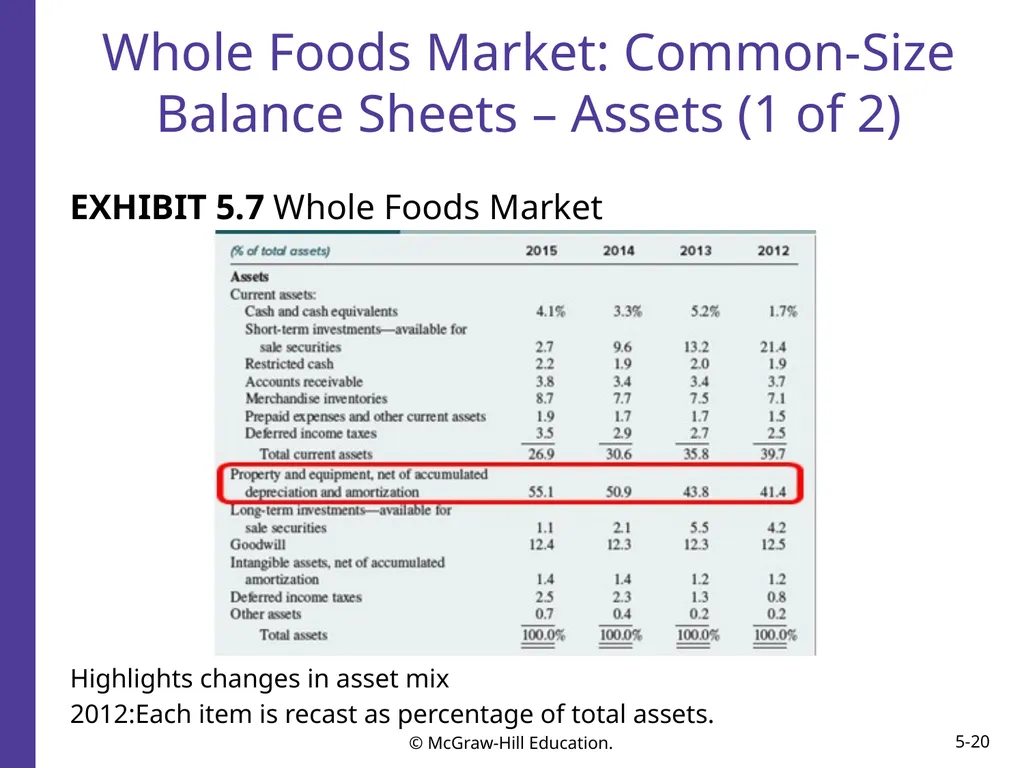
Whole Foods Market: Common-Size Balance Sheets – Assets (1 of 2) EXHIBIT 5.7 Whole Foods Market Highlights changes in asset mix
2012:Each item is recast as percentage of total assets.<br>
21
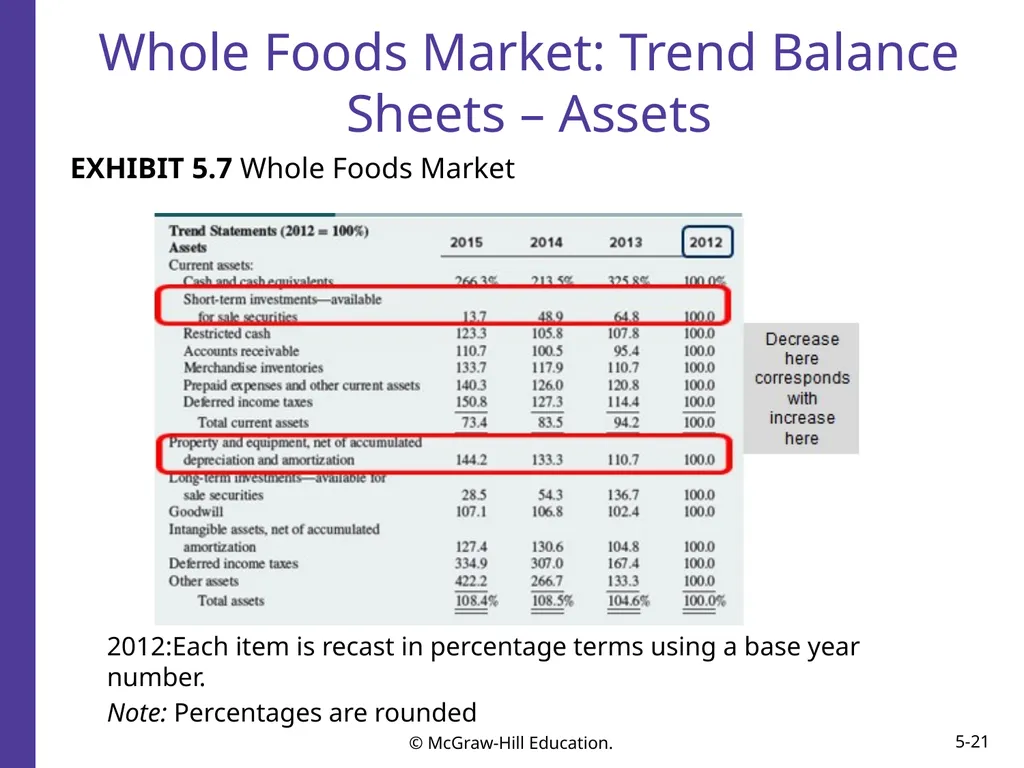
Whole Foods Market: Trend Balance Sheets – Assets EXHIBIT 5.7 Whole Foods Market 2012:Each item is recast in percentage terms using a base year number.
Note: Percentages are rounded<br>
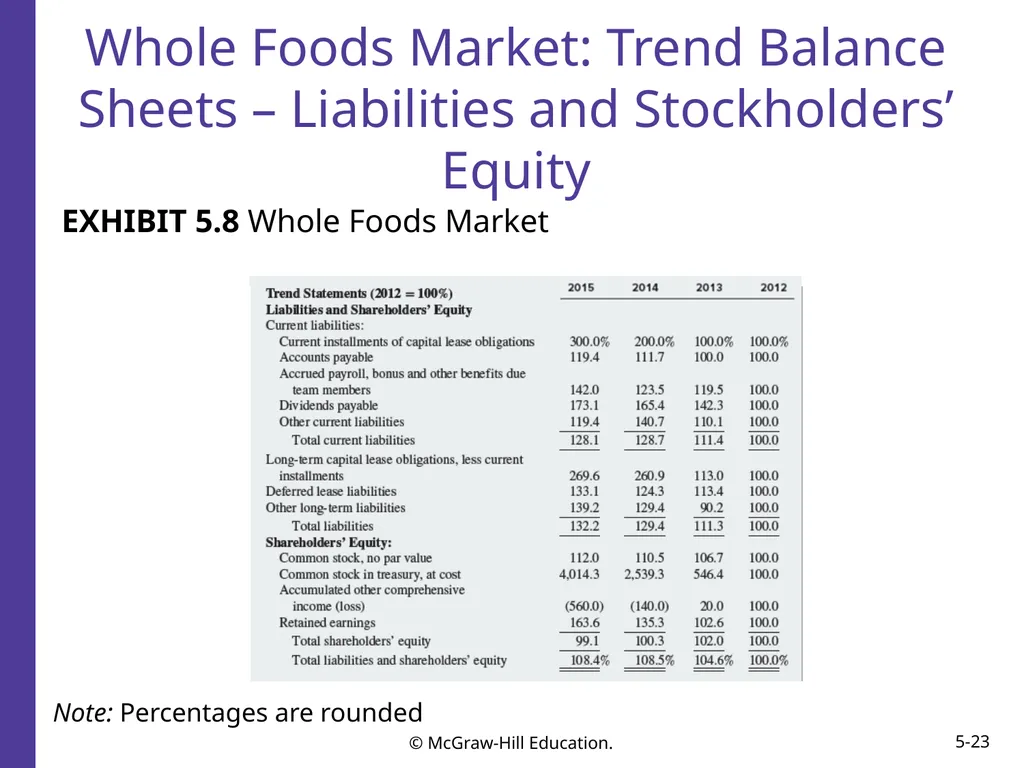
Whole Foods Market: Trend Balance Sheets – Liabilities and Stockholders’ Equity EXHIBIT 5.8 Whole Foods Market Note: Percentages are rounded<br>
24
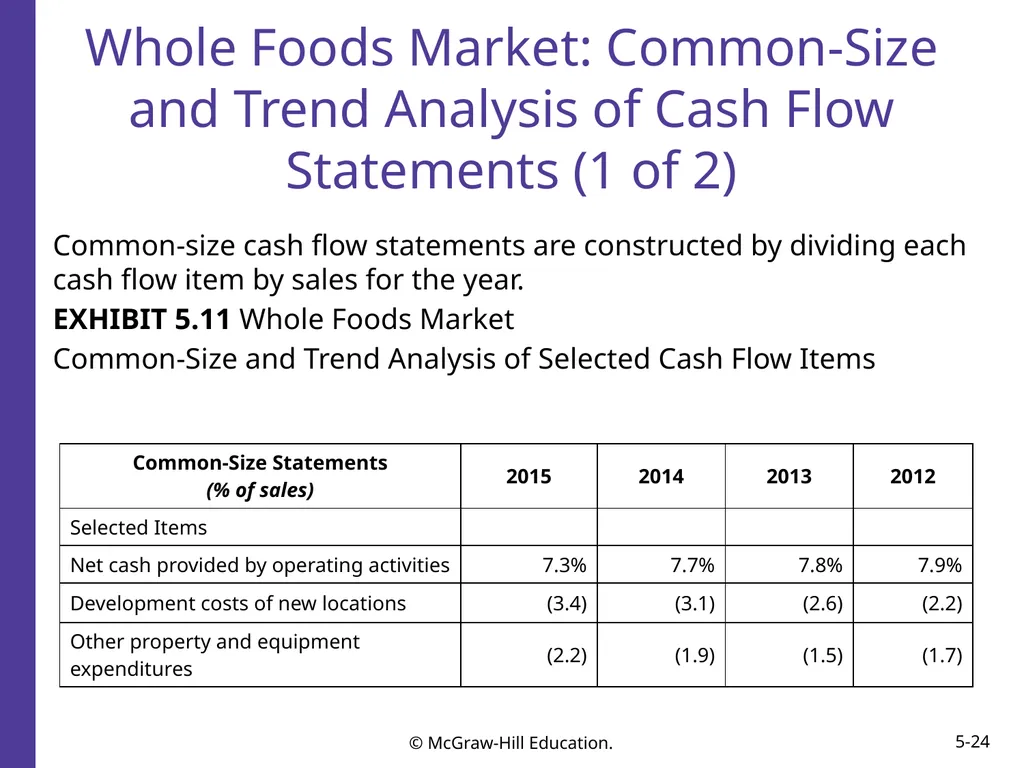
Whole Foods Market: Common-Size and Trend Analysis of Cash Flow Statements (1 of 2) Common-size cash flow statements are constructed by dividing each cash flow item by sales for the year.
EXHIBIT 5.11 Whole Foods Market
Common-Size and Trend Analysis of Selected Cash Flow Items<br>
25
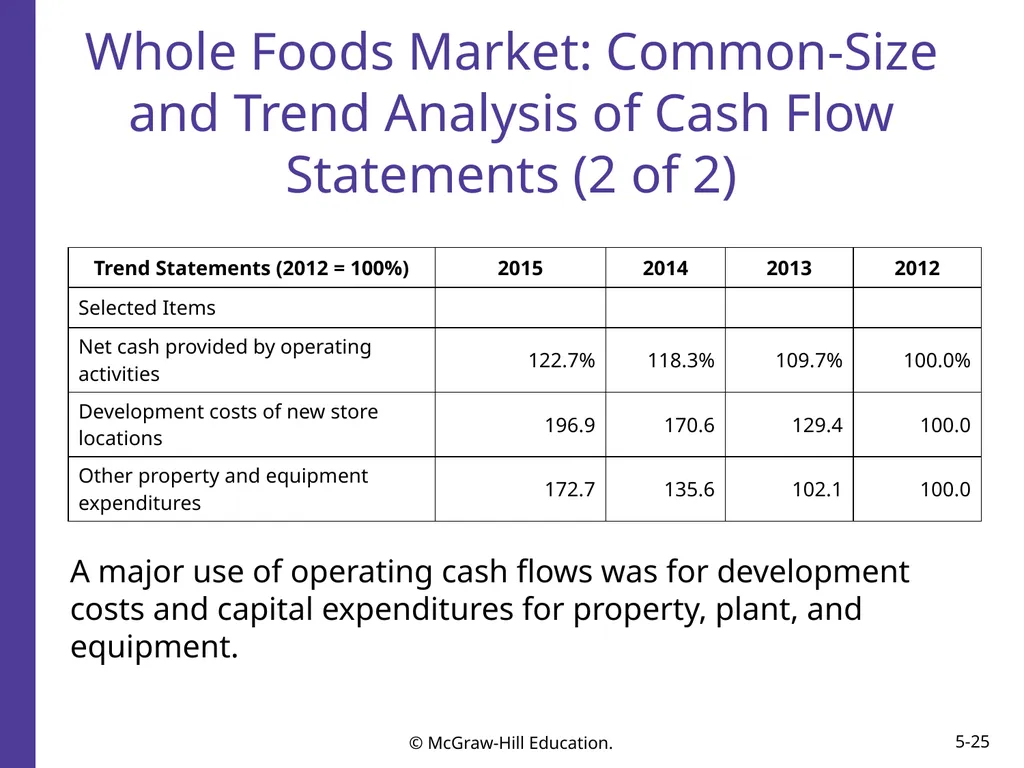
Whole Foods Market: Common-Size and Trend Analysis of Cash Flow Statements (2 of 2) A major use of operating cash flows was for development costs and capital expenditures for property, plant, and equipment.<br>