FirstService Corporation Investors Presentation February 2025 Certain statements included herein constitute forwardlooking statements within the meaning of the U.S. Private Securities Litigation Reform Act of 1995. Such forwardlooking
"FirstService Corporation Investors Presentation" is the property of its rightful owner. Permission is granted to
download and print the materials on this website for personal, non-commercial use only, and to display it
on your personal computer provided you do not modify the materials and that you retain all copyright
notices contained in the materials. By downloading content from our website, you accept the terms of this
agreement.
Presentation Transcript
01
FirstService Corporation Investors Presentation February 2025<br>
02
Certain statements included herein constitute “forward‐looking statements” within the meaning of the U.S. Private Securities Litigation Reform Act of 1995. Such forward‐looking statements involve known and unknown risks, uncertainties and other factors which may cause the actual results, performance or achievements of the Company, or industry results, to be materially different from any future results, performance or achievements expressed or implied by such forward‐looking statements. Such factors include, among others, the following: general economic and business conditions, which will, among other things, impact demand for the Company’s services, service industry conditions and capacity; the ability of the Company to implement its business strategy, including the Company’s ability to acquire suitable acquisition candidates on acceptable terms and successfully integrate newly acquired businesses with its existing businesses; changes in or the failure to comply with government regulations (especially safety and environmental laws and regulations); and other factors which are described in the Company’s filings with the Canadian securities regulators and the U.S. Securities and Exchange Commission. Forward Looking Statements<br>
03
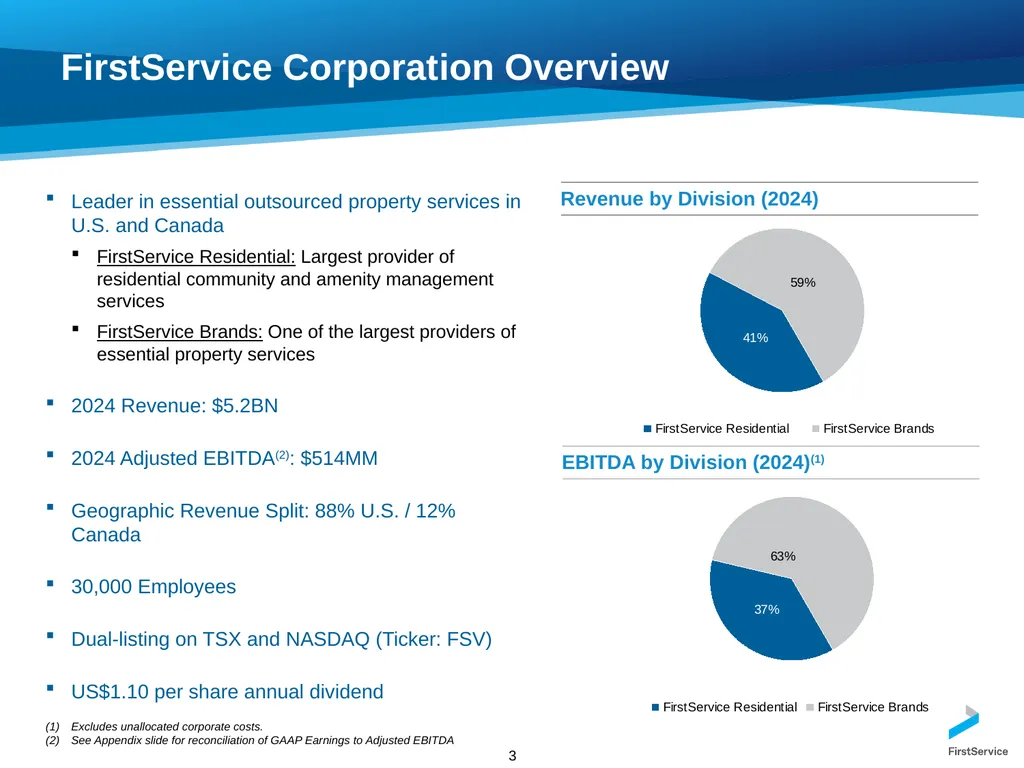
FirstService Corporation Overview Leader in essential outsourced property services in U.S. and Canada
FirstService Residential: Largest provider of residential community and amenity management services
FirstService Brands: One of the largest providers of essential property services
2024 Revenue: $5.2BN
2024 Adjusted EBITDA(2): $514MM
Geographic Revenue Split: 88% U.S. / 12% Canada
30,000 Employees
Dual-listing on TSX and NASDAQ (Ticker: FSV)
US$1.10 per share annual dividend 3 Excludes unallocated corporate costs.
See Appendix slide for reconciliation of GAAP Earnings to Adjusted EBITDA<br>
04
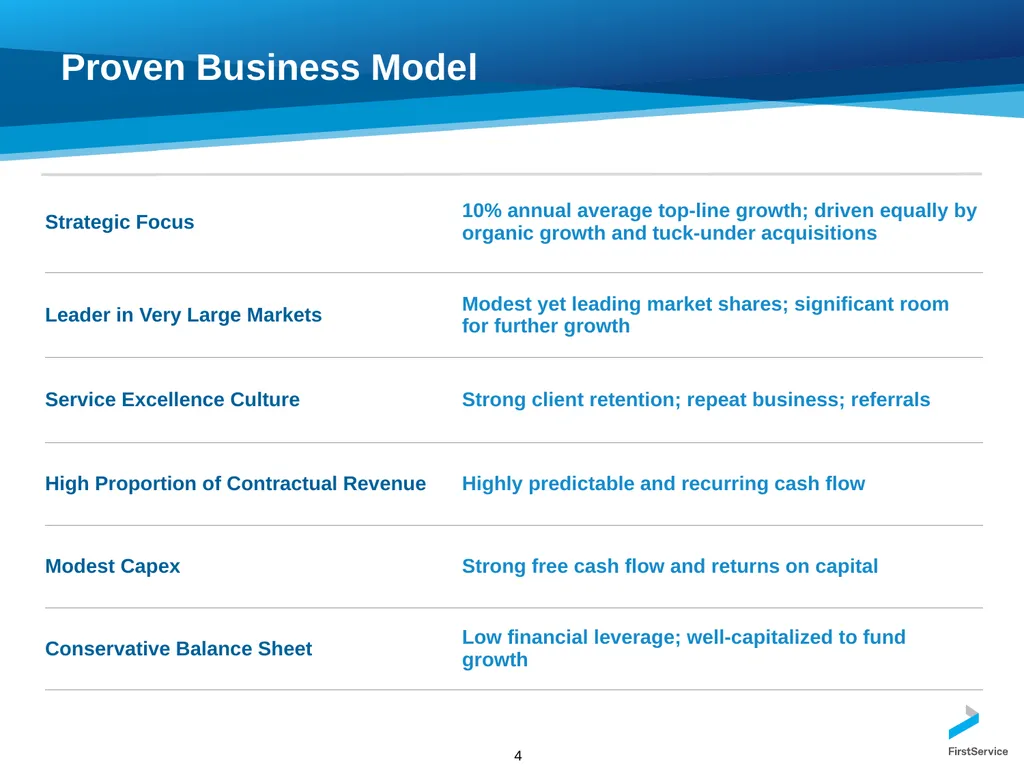
4 Proven Business Model<br>
05
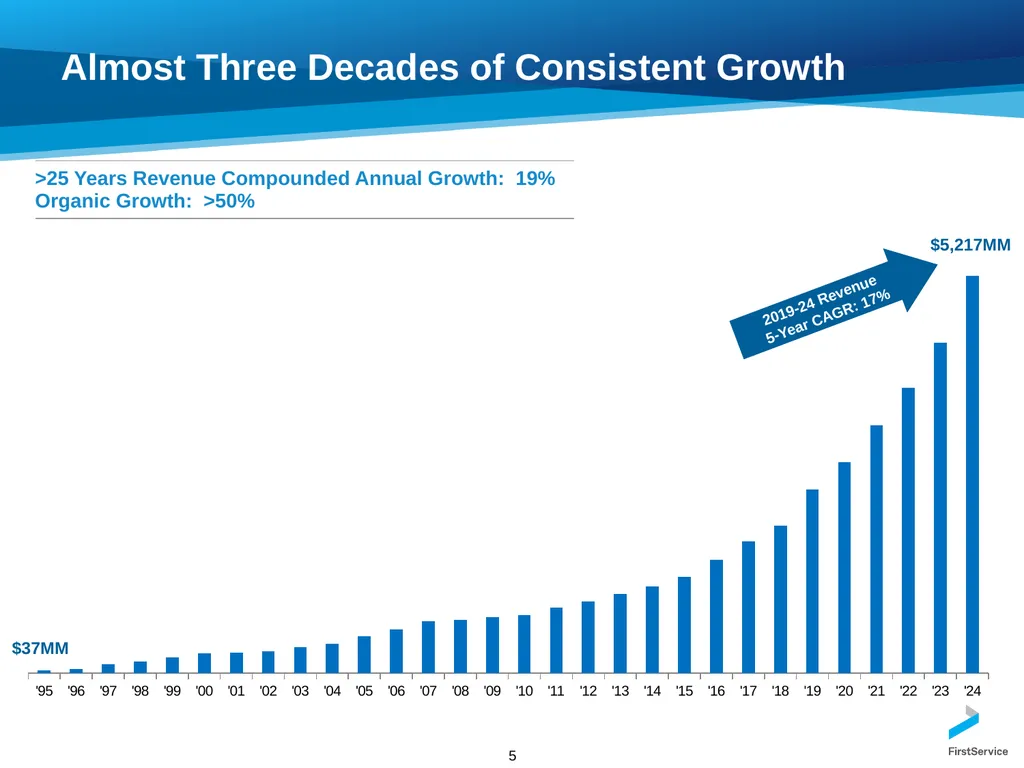
Almost Three Decades of Consistent Growth 5 $37MM 2019-24 Revenue
5-Year CAGR: 17% $5,217MM<br>
06
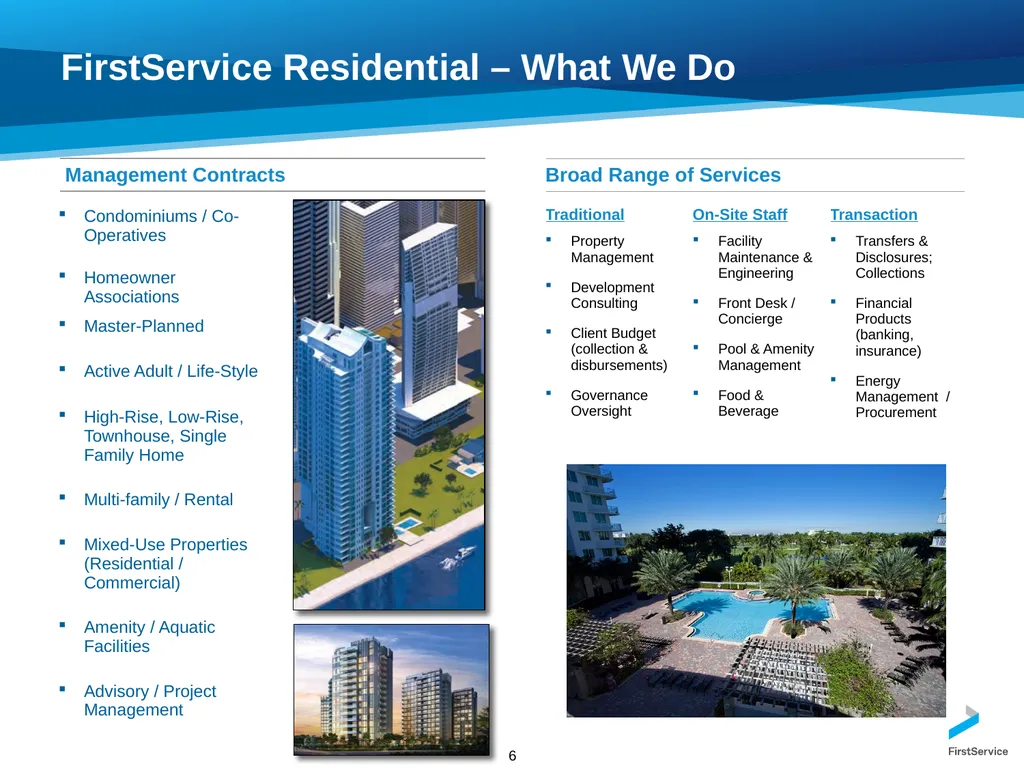
FirstService Residential – What We Do 6<br>
07
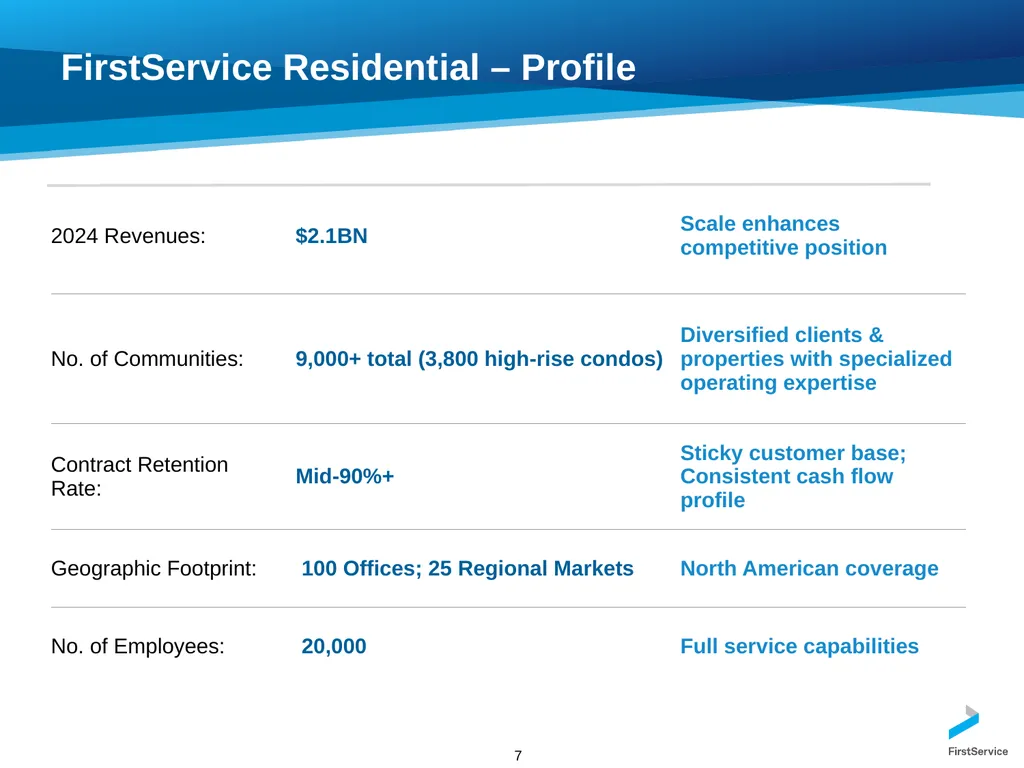
7 FirstService Residential – Profile<br>
08
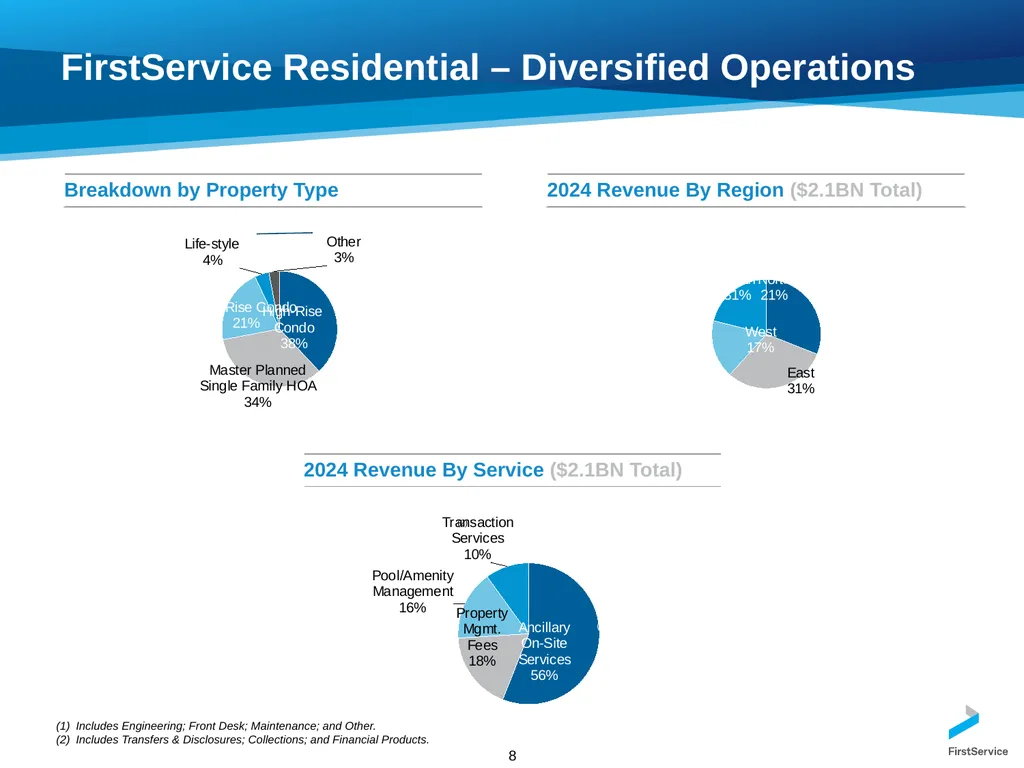
FirstService Residential – Diversified Operations Includes Engineering; Front Desk; Maintenance; and Other.
Includes Transfers & Disclosures; Collections; and Financial Products. (1) (2) 8<br>
09
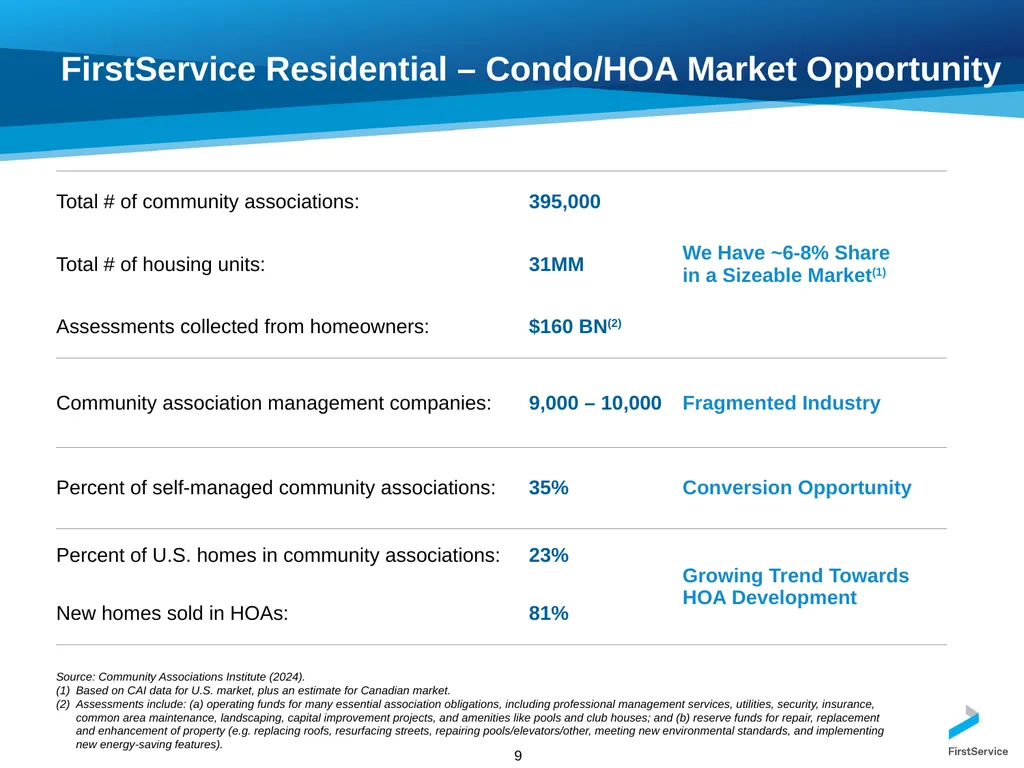
FirstService Residential – Condo/HOA Market Opportunity Source: Community Associations Institute (2024).
Based on CAI data for U.S. market, plus an estimate for Canadian market.
Assessments include: (a) operating funds for many essential association obligations, including professional management services, utilities, security, insurance, common area maintenance, landscaping, capital improvement projects, and amenities like pools and club houses; and (b) reserve funds for repair, replacement and enhancement of property (e.g. replacing roofs, resurfacing streets, repairing pools/elevators/other, meeting new environmental standards, and implementing new energy-saving features). 9<br>
10
FirstService Brands – What We Do 10 Leading provider of eight branded essential property services to commercial and residential customers through company-owned operations and franchised systems<br>
11
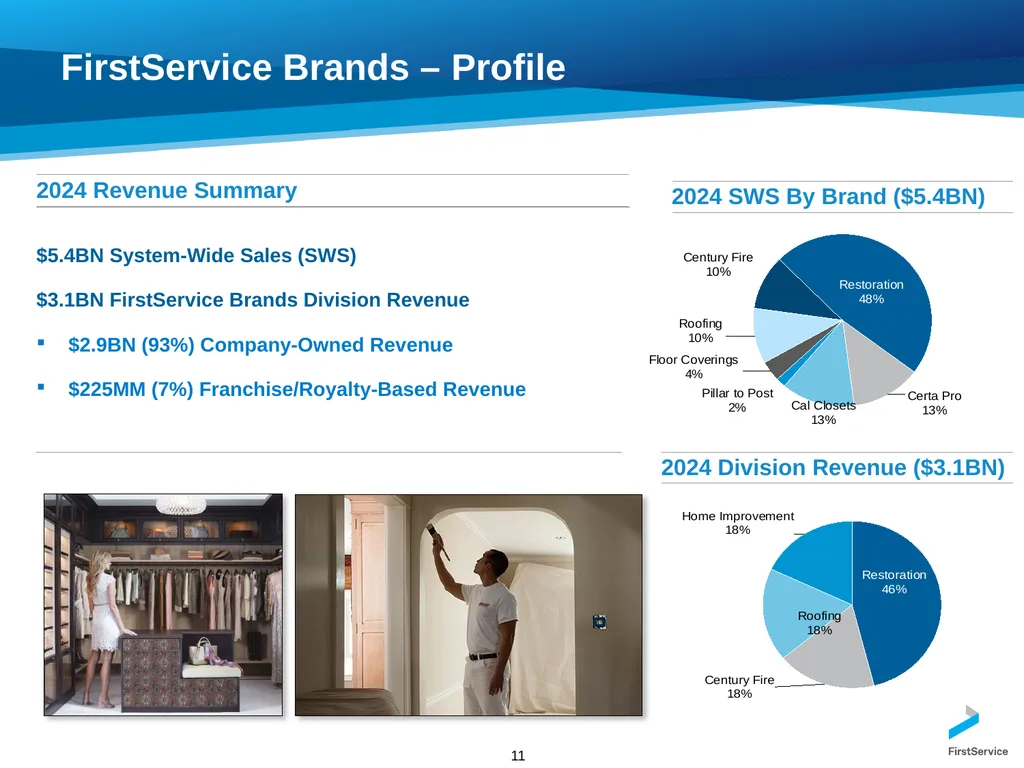
11 FirstService Brands – Profile<br>
12
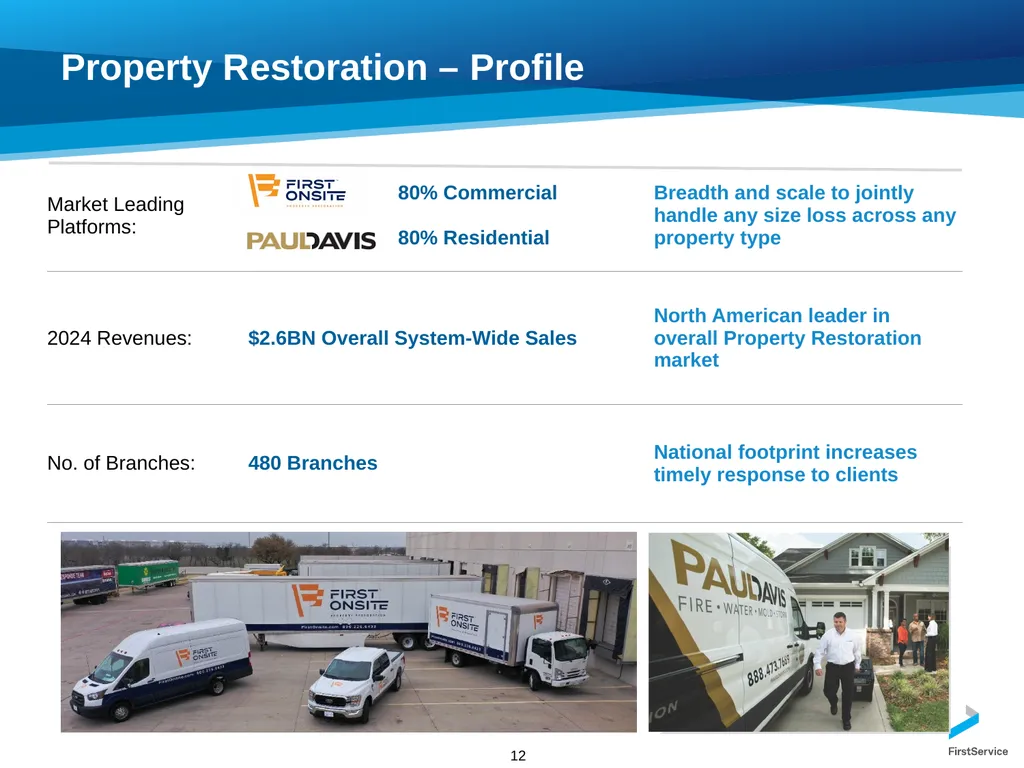
12 Property Restoration – Profile<br>
13
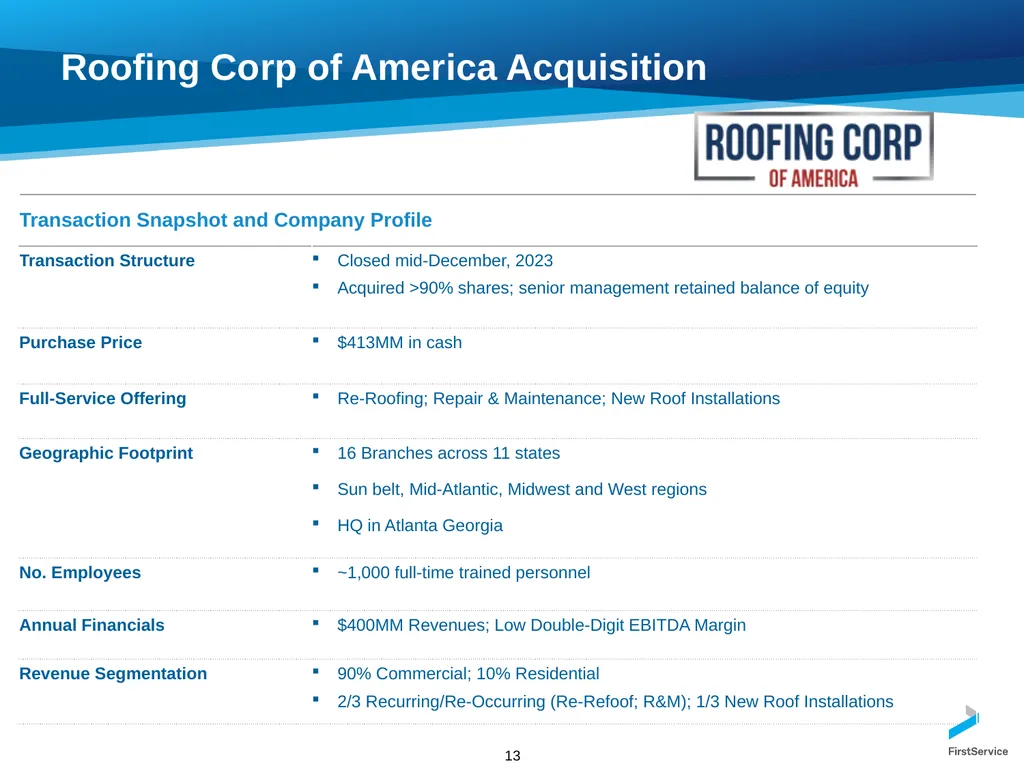
13 Roofing Corp of America Acquisition<br>
14
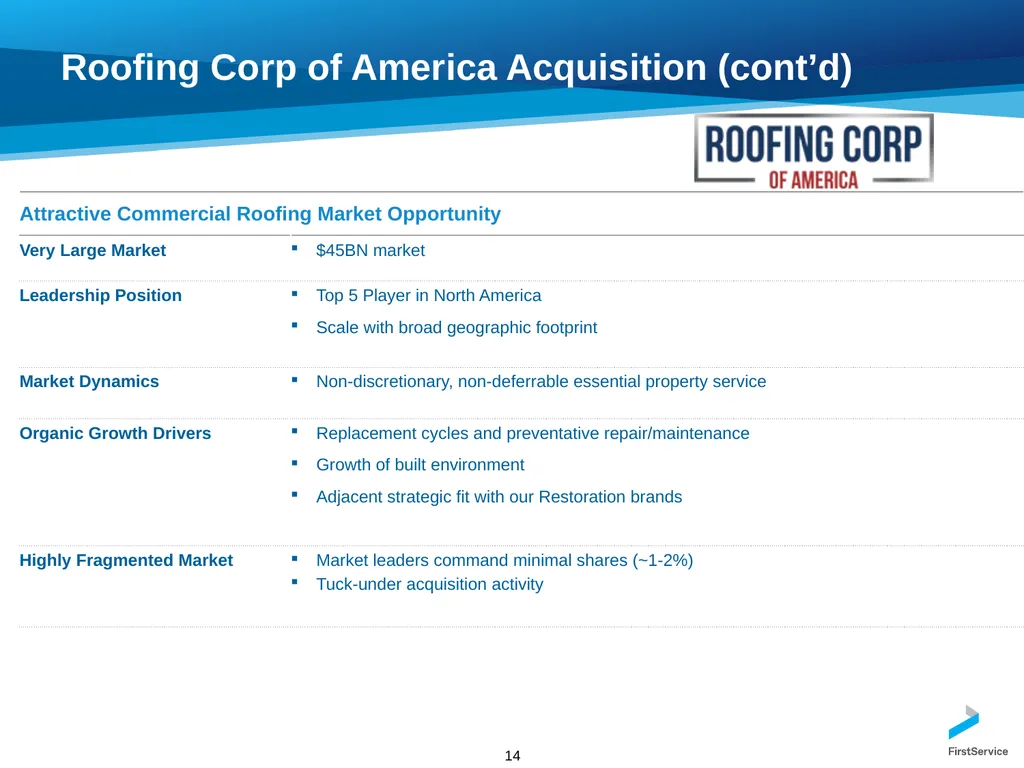
14 Roofing Corp of America Acquisition (cont’d)<br>
15
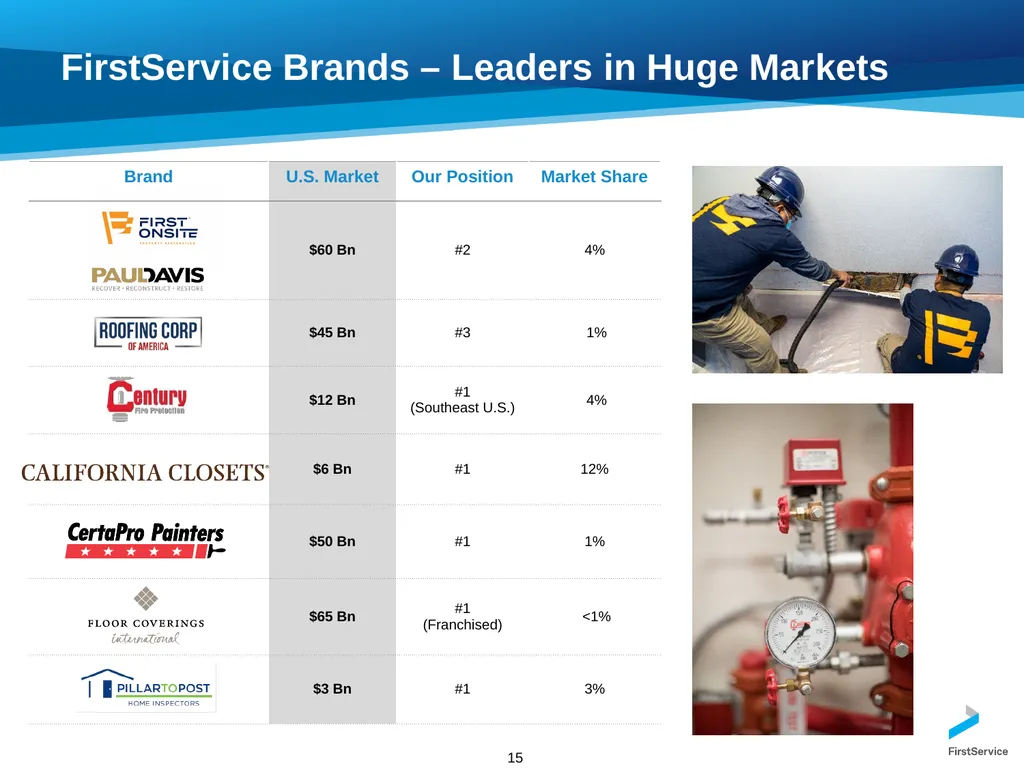
FirstService Brands – Leaders in Huge Markets 15<br>
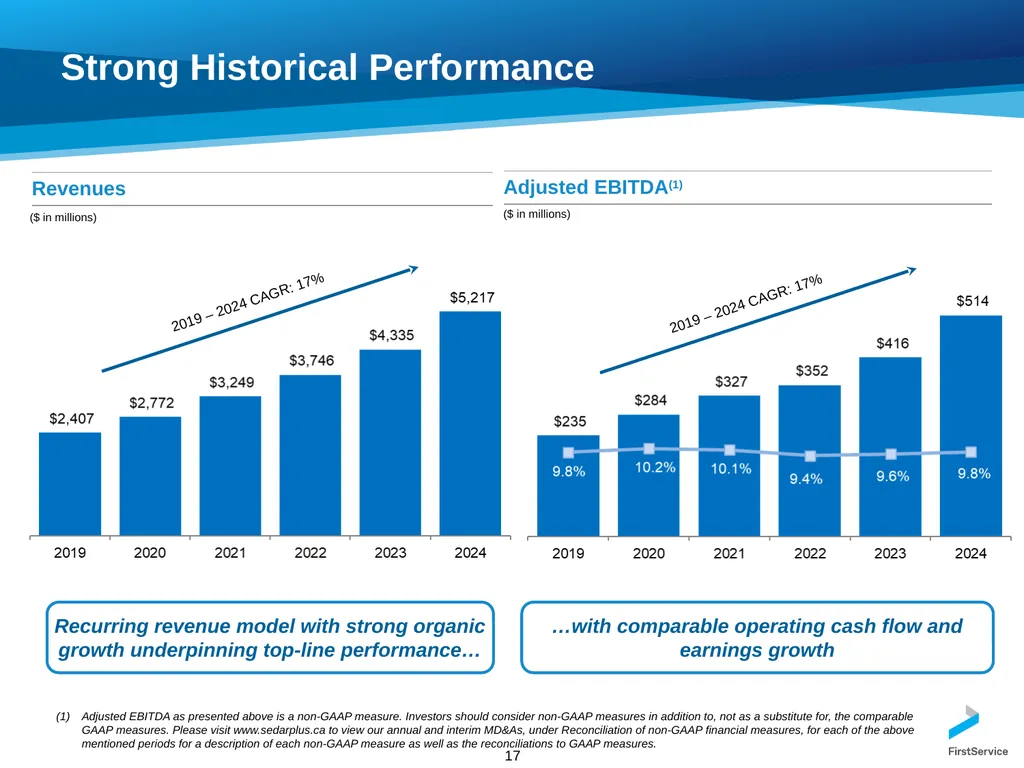
Strong Historical Performance Adjusted EBITDA as presented above is a non-GAAP measure. Investors should consider non-GAAP measures in addition to, not as a substitute for, the comparable GAAP measures. Please visit www.sedarplus.ca to view our annual and interim MD&As, under Reconciliation of non-GAAP financial measures, for each of the above mentioned periods for a description of each non-GAAP measure as well as the reconciliations to GAAP measures. 17 Recurring revenue model with strong organic growth underpinning top-line performance… …with comparable operating cash flow and earnings growth ($ in millions) ($ in millions) 2019 – 2024 CAGR: 17% 2019 – 2024 CAGR: 17%<br>
18
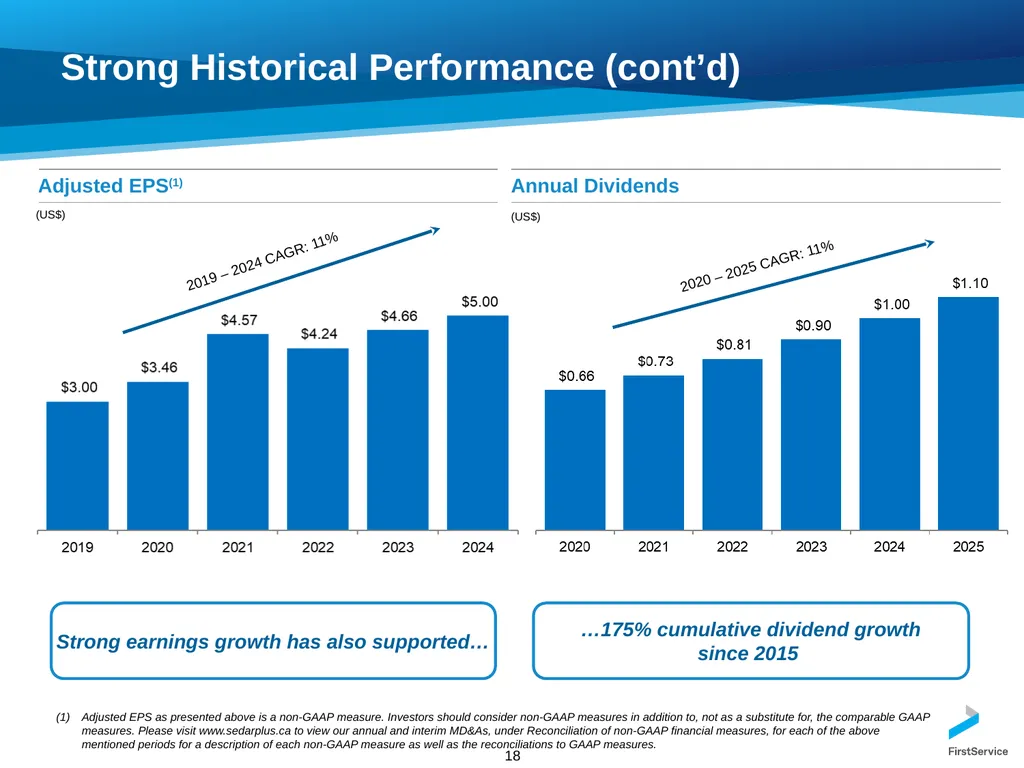
Strong Historical Performance (cont’d) (US$) (US$) 18 Strong earnings growth has also supported… …175% cumulative dividend growth
since 2015 Adjusted EPS as presented above is a non-GAAP measure. Investors should consider non-GAAP measures in addition to, not as a substitute for, the comparable GAAP measures. Please visit www.sedarplus.ca to view our annual and interim MD&As, under Reconciliation of non-GAAP financial measures, for each of the above mentioned periods for a description of each non-GAAP measure as well as the reconciliations to GAAP measures. 2020 – 2025 CAGR: 11% 2019 – 2024 CAGR: 11%<br>
19
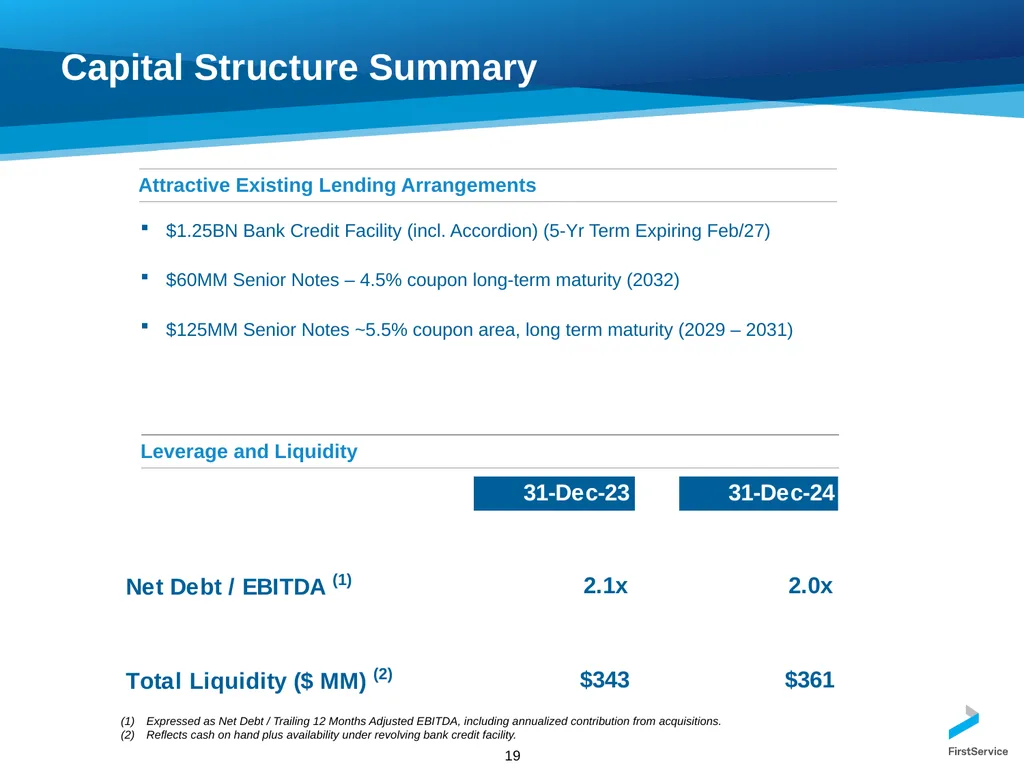
Capital Structure Summary $1.25BN Bank Credit Facility (incl. Accordion) (5-Yr Term Expiring Feb/27)
$60MM Senior Notes – 4.5% coupon long-term maturity (2032)
$125MM Senior Notes ~5.5% coupon area, long term maturity (2029 – 2031) Expressed as Net Debt / Trailing 12 Months Adjusted EBITDA, including annualized contribution from acquisitions.
Reflects cash on hand plus availability under revolving bank credit facility. 19<br>
20
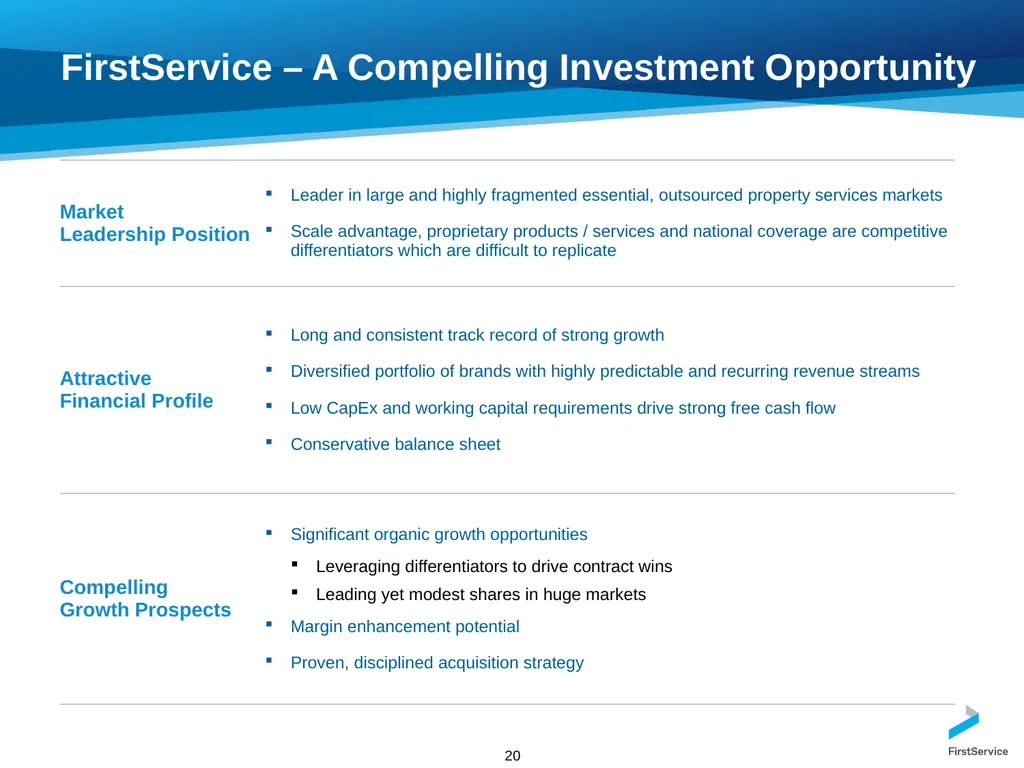
FirstService – A Compelling Investment Opportunity 20<br>
21
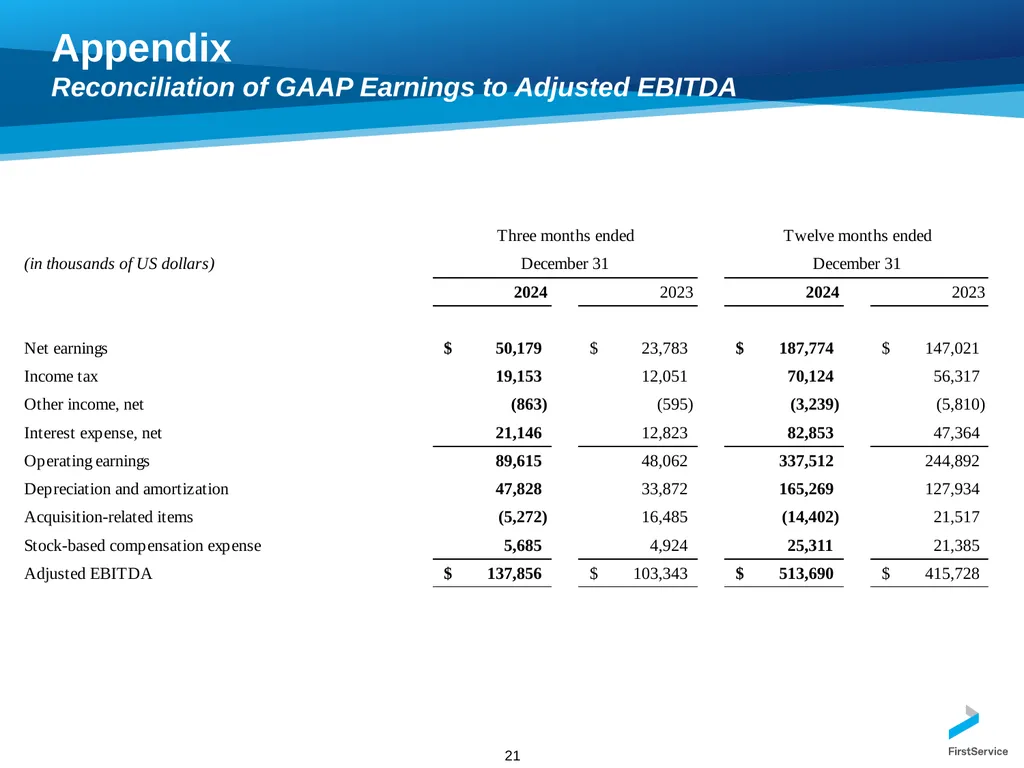
21 Appendix Reconciliation of GAAP Earnings to Adjusted EBITDA<br>
22
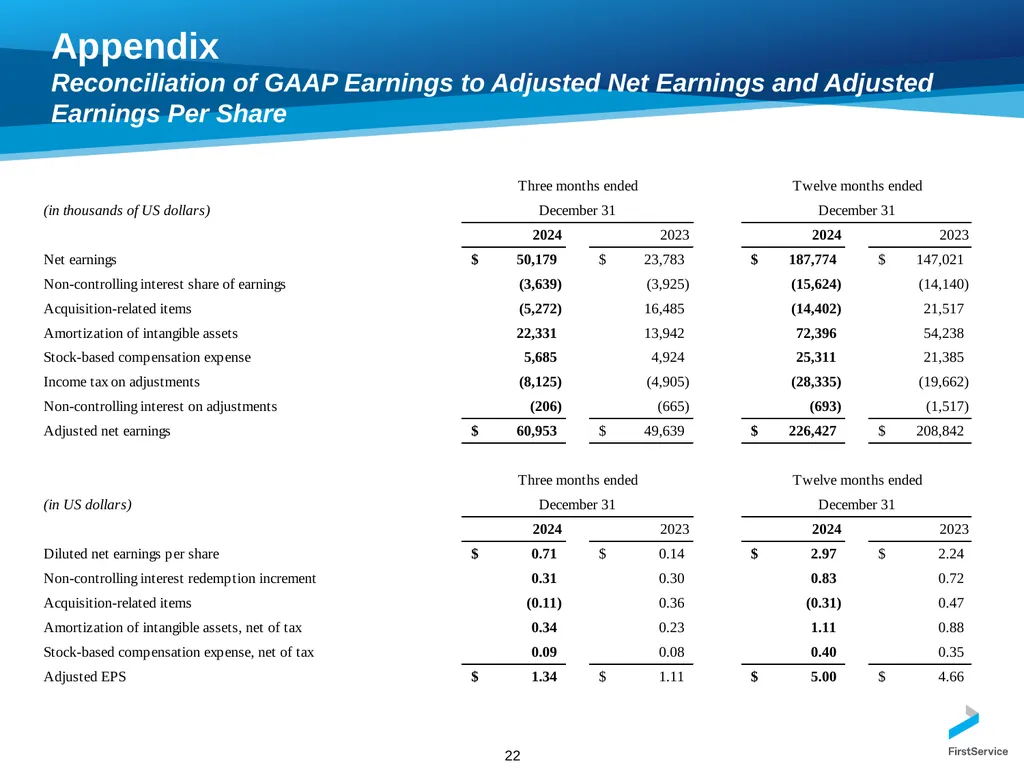
22 Appendix Reconciliation of GAAP Earnings to Adjusted Net Earnings and Adjusted Earnings Per Share<br>