FY17 Research Management Annual Financial Update
Description: FY17 Research Management Annual Financial Update October 31, 2017 Proposals Awards Research PHS Research Revenue Trends Source: PHS Research Revenues FY07- FY17 Actual. PHS includes BWH, MGH, McL, SRH, and all other PHS entities. Note:
Related Topics
Download Presentation
"FY17 Research Management Annual Financial Update" is the property of its rightful owner. Permission is granted to download and print the materials on this website for personal, non-commercial use only, and to display it on your personal computer provided you do not modify the materials and that you retain all copyright notices contained in the materials. By downloading content from our website, you accept the terms of this agreement.
Presentation Transcript
slide1. FY17 Research Management Annual Financial Update October 31, 2017 Proposals Awards Research $<br>
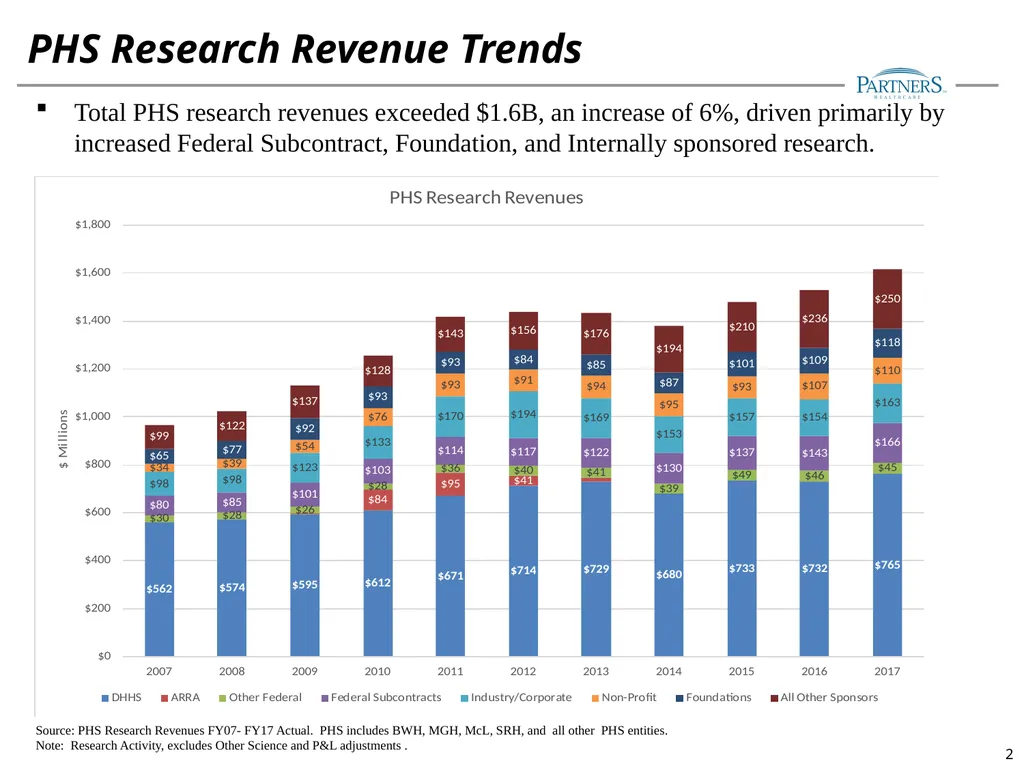
slide2. PHS Research Revenue Trends Source: PHS Research Revenues FY07- FY17 Actual. PHS includes BWH, MGH, McL, SRH, and all other PHS entities.
Note: Research Activity, excludes Other Science and P&L adjustments . Total PHS research revenues exceeded $1.6B, an increase of 6%, driven primarily by increased Federal Subcontract, Foundation, and Internally sponsored research. 2<br>
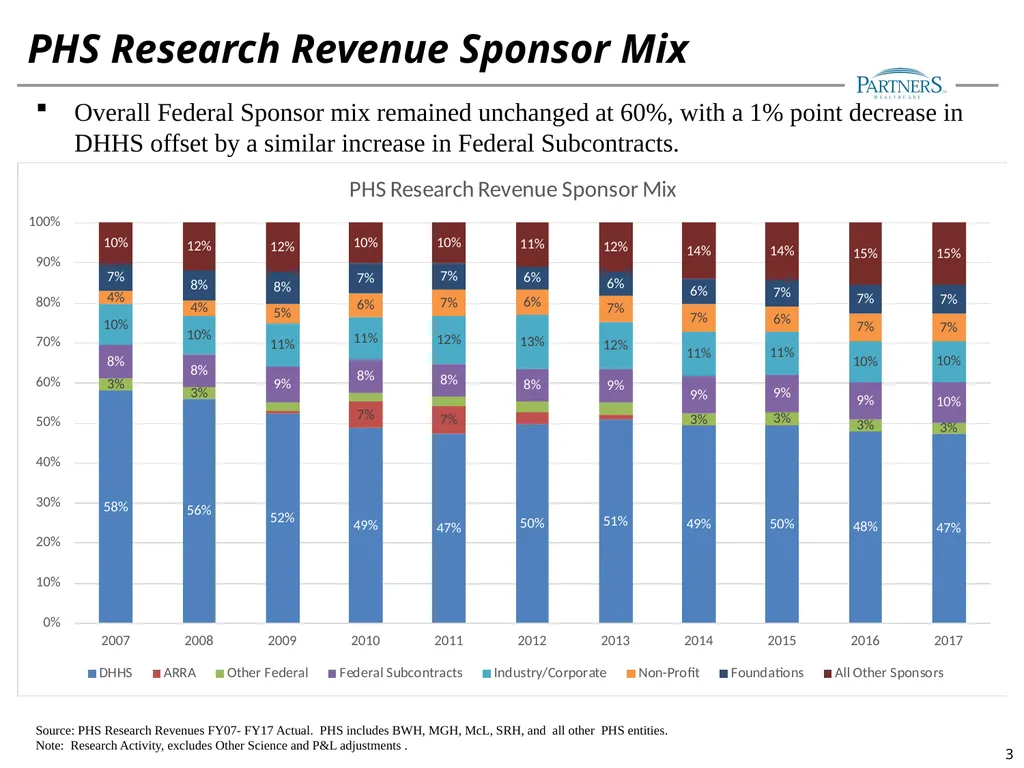
slide3. PHS Research Revenue Sponsor Mix Source: PHS Research Revenues FY07- FY17 Actual. PHS includes BWH, MGH, McL, SRH, and all other PHS entities.
Note: Research Activity, excludes Other Science and P&L adjustments . Overall Federal Sponsor mix remained unchanged at 60%, with a 1% point decrease in DHHS offset by a similar increase in Federal Subcontracts. 3<br>
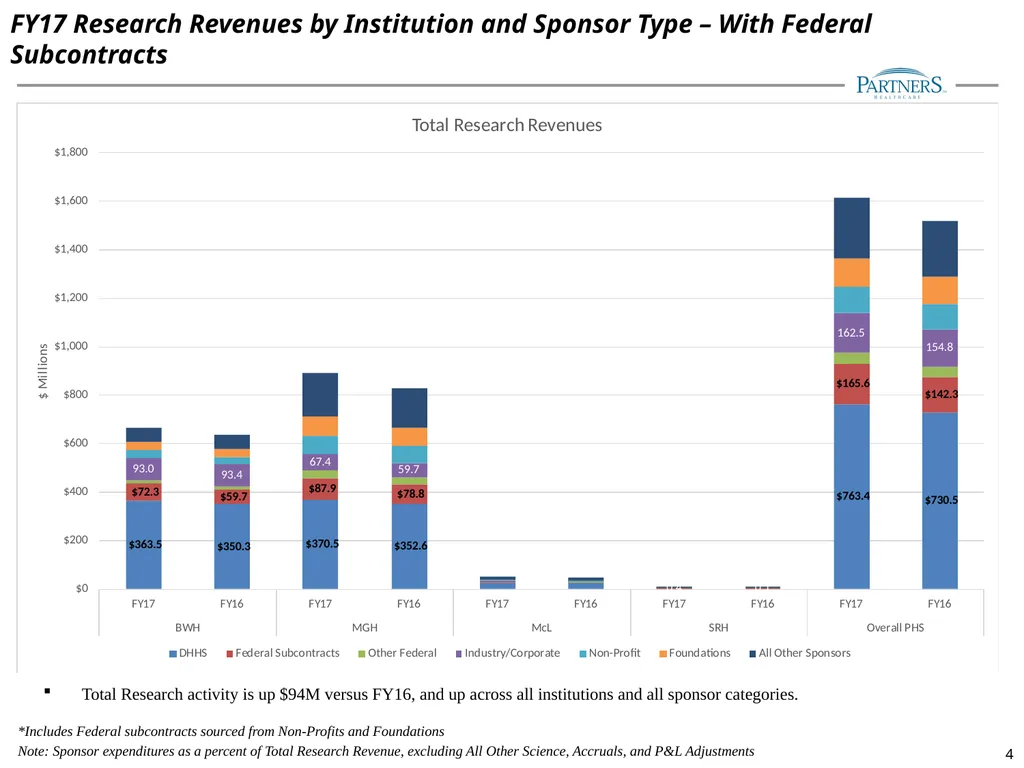
slide4. FY17 Research Revenues by Institution and Sponsor Type – With Federal Subcontracts *Includes Federal subcontracts sourced from Non-Profits and Foundations
Note: Sponsor expenditures as a percent of Total Research Revenue, excluding All Other Science, Accruals, and P&L Adjustments 4 Total Research activity is up $94M versus FY16, and up across all institutions and all sponsor categories.<br>
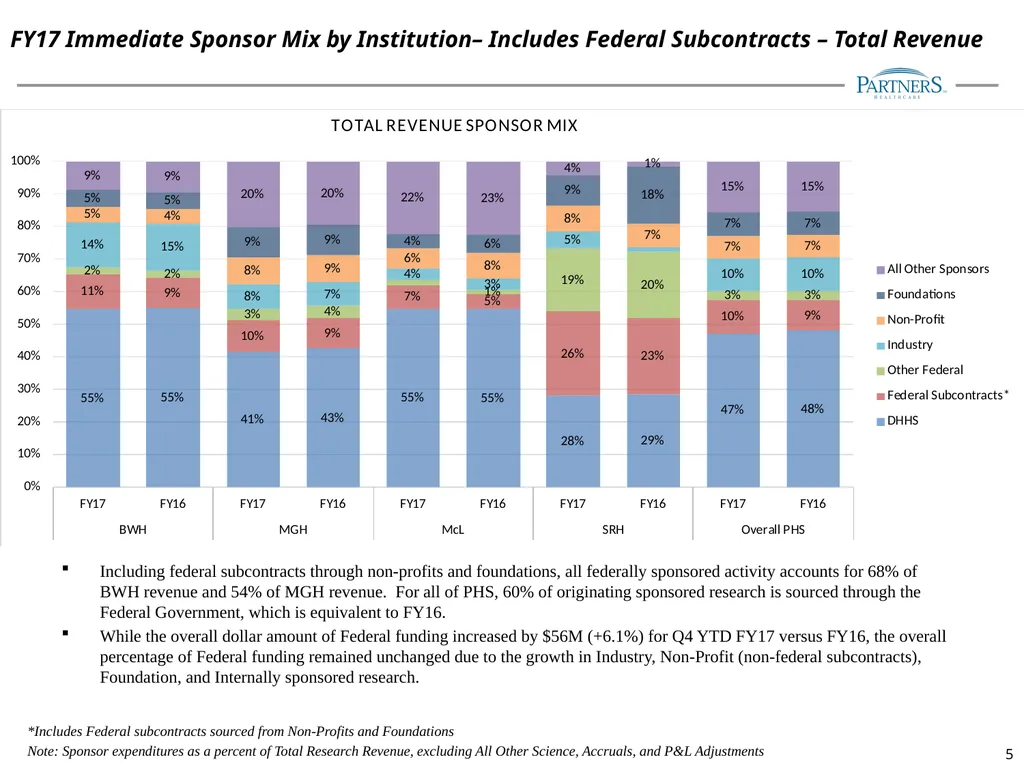
slide5. FY17 Immediate Sponsor Mix by Institution– Includes Federal Subcontracts – Total Revenue *Includes Federal subcontracts sourced from Non-Profits and Foundations
Note: Sponsor expenditures as a percent of Total Research Revenue, excluding All Other Science, Accruals, and P&L Adjustments 5 Including federal subcontracts through non-profits and foundations, all federally sponsored activity accounts for 68% of BWH revenue and 54% of MGH revenue. For all of PHS, 60% of originating sponsored research is sourced through the Federal Government, which is equivalent to FY16.
While the overall dollar amount of Federal funding increased by $56M (+6.1%) for Q4 YTD FY17 versus FY16, the overall percentage of Federal funding remained unchanged due to the growth in Industry, Non-Profit (non-federal subcontracts), Foundation, and Internally sponsored research.<br>
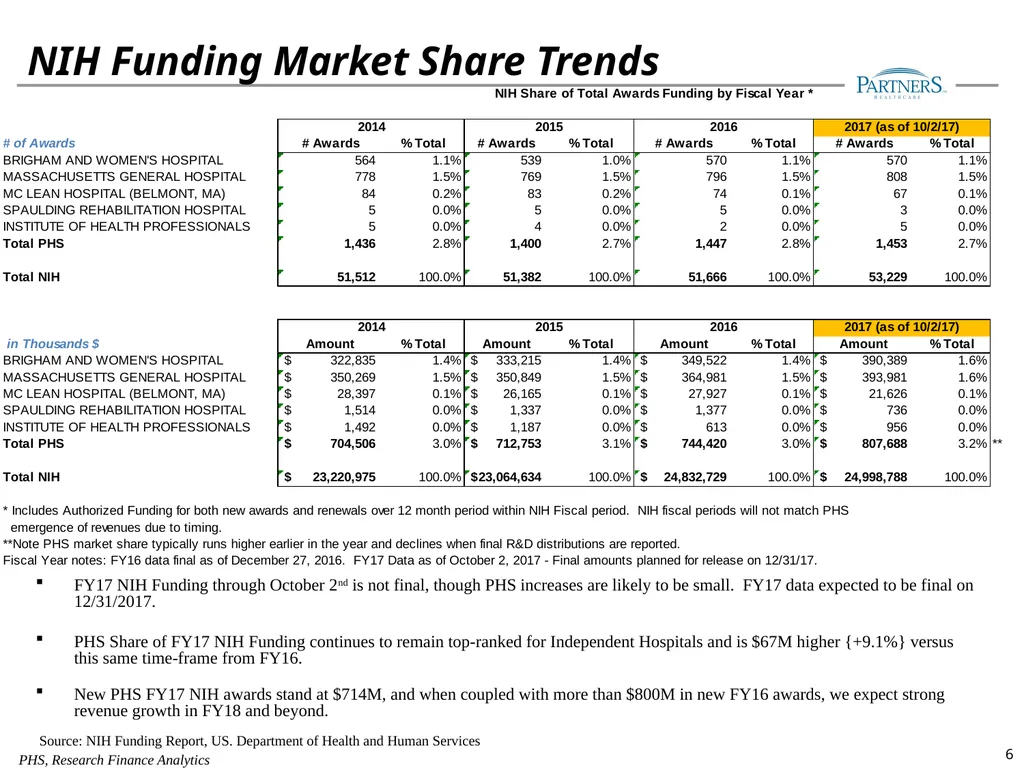
slide6. FY17 NIH Funding through October 2nd is not final, though PHS increases are likely to be small. FY17 data expected to be final on 12/31/2017.
PHS Share of FY17 NIH Funding continues to remain top-ranked for Independent Hospitals and is $67M higher {+9.1%} versus this same time-frame from FY16.
New PHS FY17 NIH awards stand at $714M, and when coupled with more than $800M in new FY16 awards, we expect strong revenue growth in FY18 and beyond. Source: NIH Funding Report, US. Department of Health and Human Services NIH Funding Market Share Trends 6 PHS, Research Finance Analytics<br>
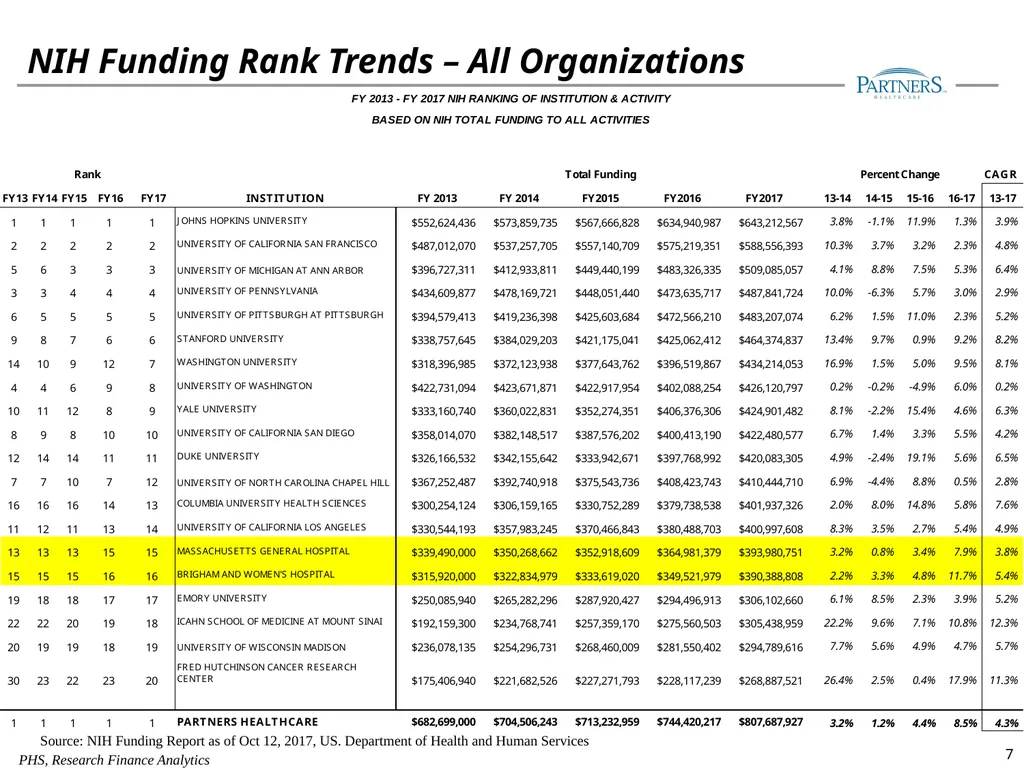
slide7. Source: NIH Funding Report as of Oct 12, 2017, US. Department of Health and Human Services NIH Funding Rank Trends – All Organizations 7 PHS, Research Finance Analytics<br>
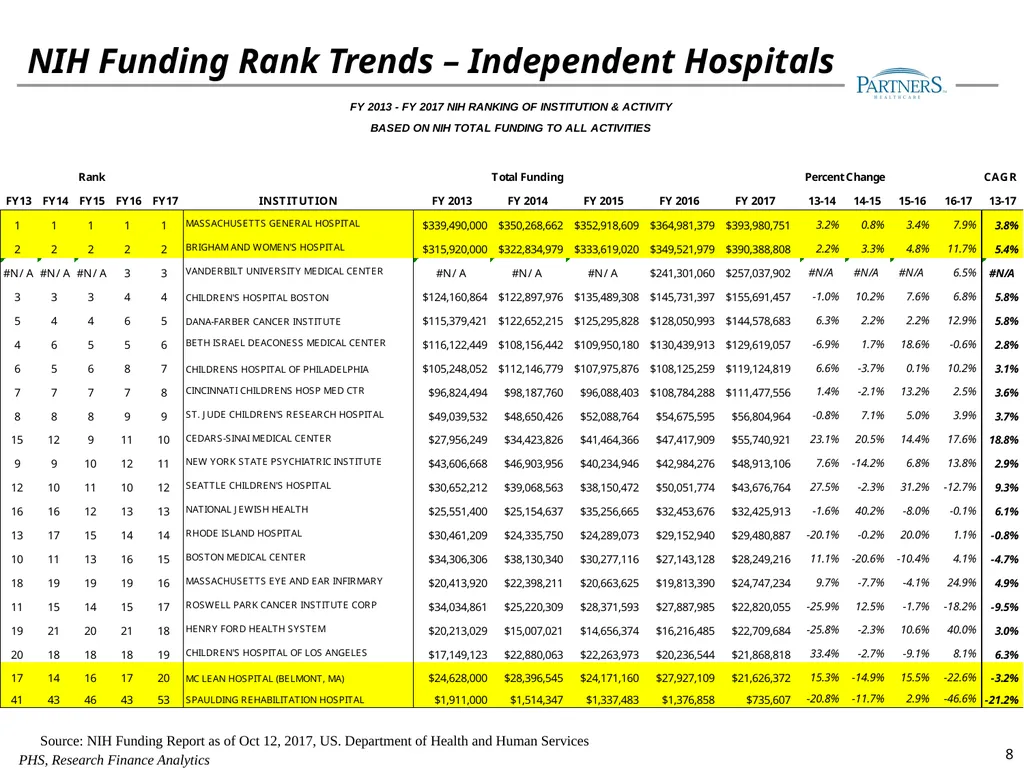
slide8. Source: NIH Funding Report as of Oct 12, 2017, US. Department of Health and Human Services NIH Funding Rank Trends – Independent Hospitals 8 PHS, Research Finance Analytics<br>
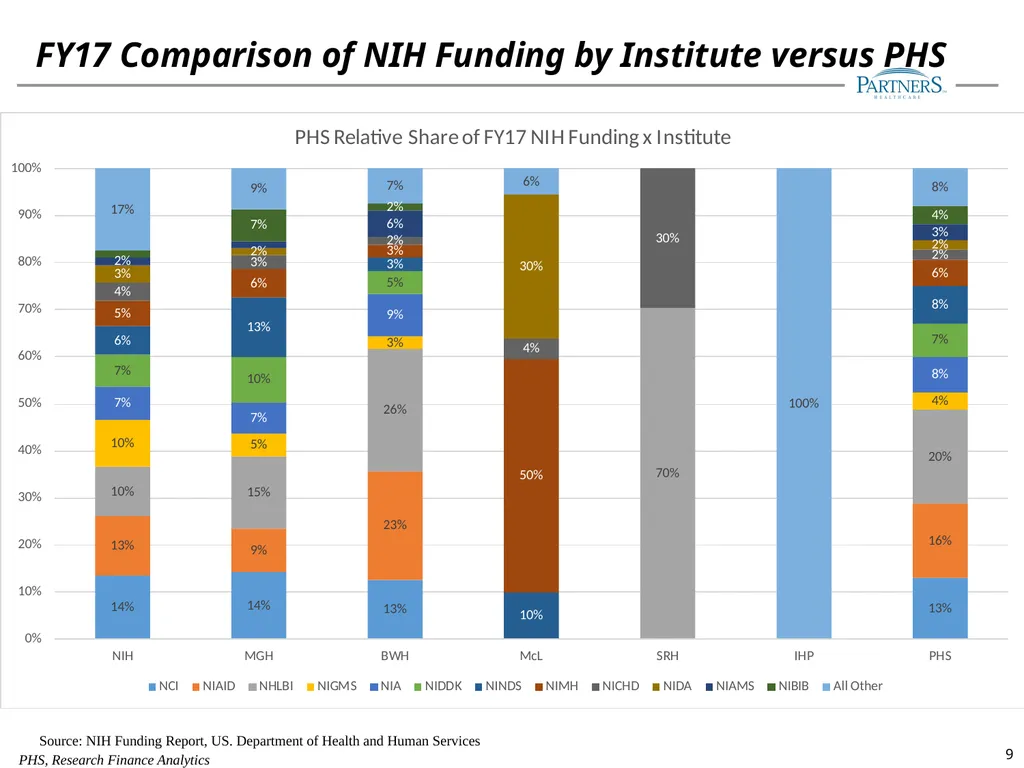
slide9. Source: NIH Funding Report, US. Department of Health and Human Services FY17 Comparison of NIH Funding by Institute versus PHS 9 PHS, Research Finance Analytics<br>
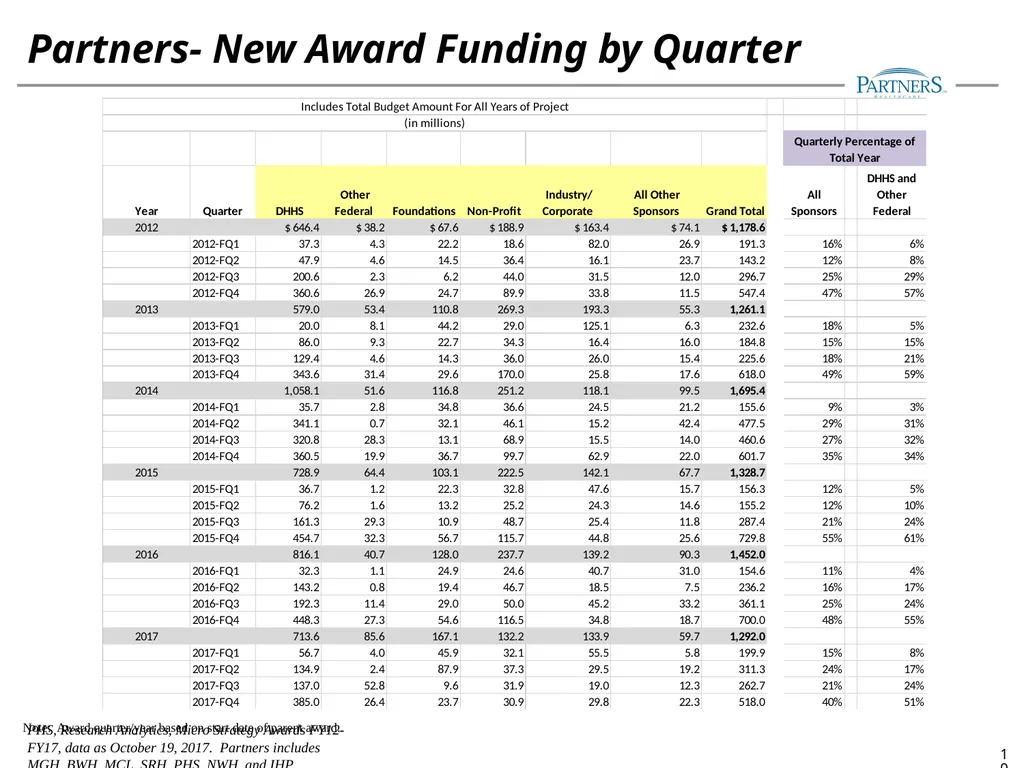
slide10. Partners- New Award Funding by Quarter PHS, Research Analytics, Micro Strategy Awards FY12-FY17, data as October 19, 2017. Partners includes MGH, BWH, MCL, SRH, PHS, NWH, and IHP. 10 Note: Award quarter/year based on start date of parent award.<br>
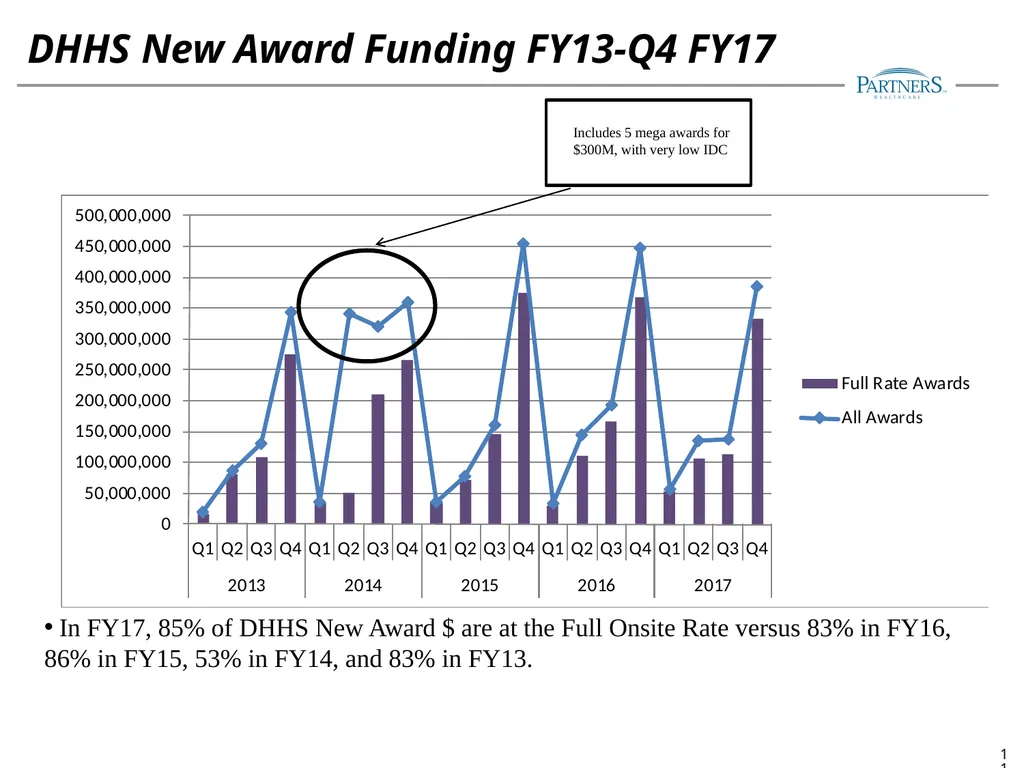
slide11. Last Updated 1/30/2018 DHHS New Award Funding FY13-Q4 FY17 In FY17, 85% of DHHS New Award $ are at the Full Onsite Rate versus 83% in FY16, 86% in FY15, 53% in FY14, and 83% in FY13. 11 Includes 5 mega awards for $300M, with very low IDC<br>
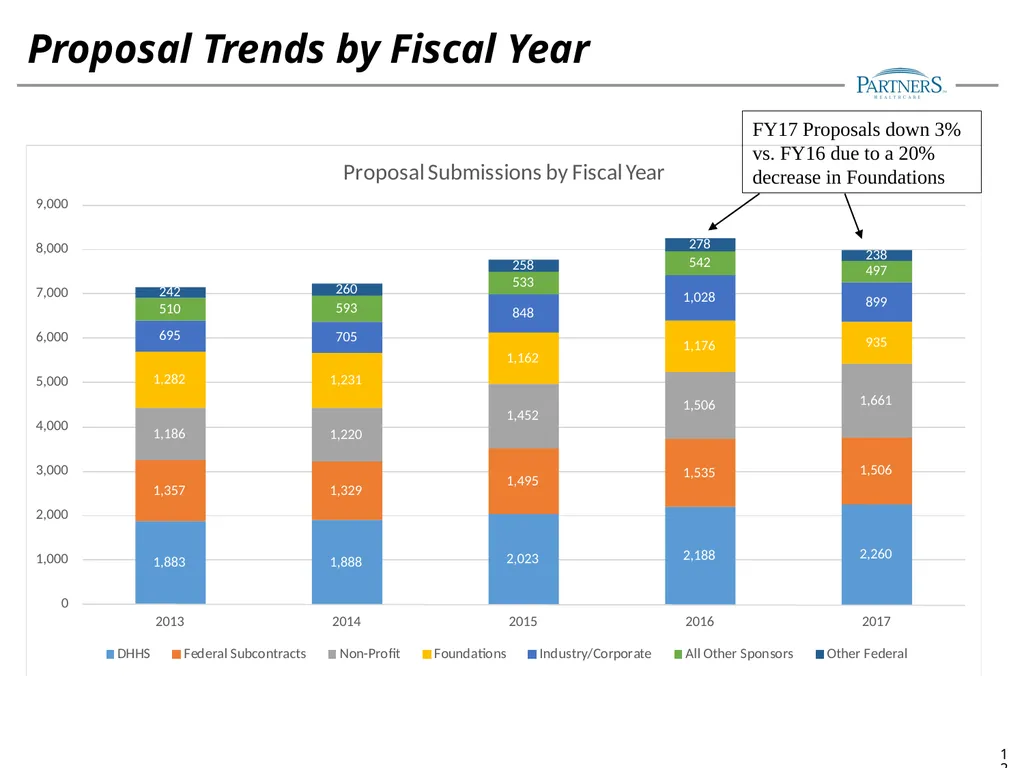
slide12. Last Updated 1/30/2018 Proposal Trends by Fiscal Year 12 FY17 Proposals down 3% vs. FY16 due to a 20% decrease in Foundations<br>
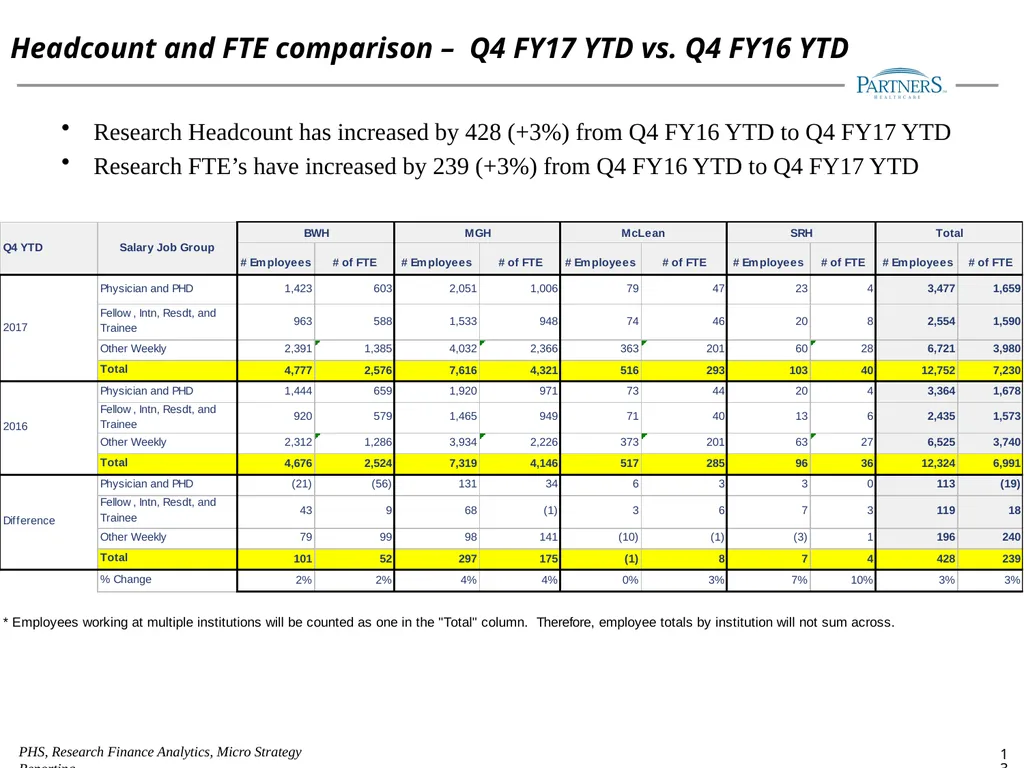
slide13. Headcount and FTE comparison – Q4 FY17 YTD vs. Q4 FY16 YTD Research Headcount has increased by 428 (+3%) from Q4 FY16 YTD to Q4 FY17 YTD
Research FTE’s have increased by 239 (+3%) from Q4 FY16 YTD to Q4 FY17 YTD PHS, Research Finance Analytics, Micro Strategy Reporting 13<br>
slide14. BWH Research Revenue Trends Source: PHS Research Revenues FY07- FY17 Actual.
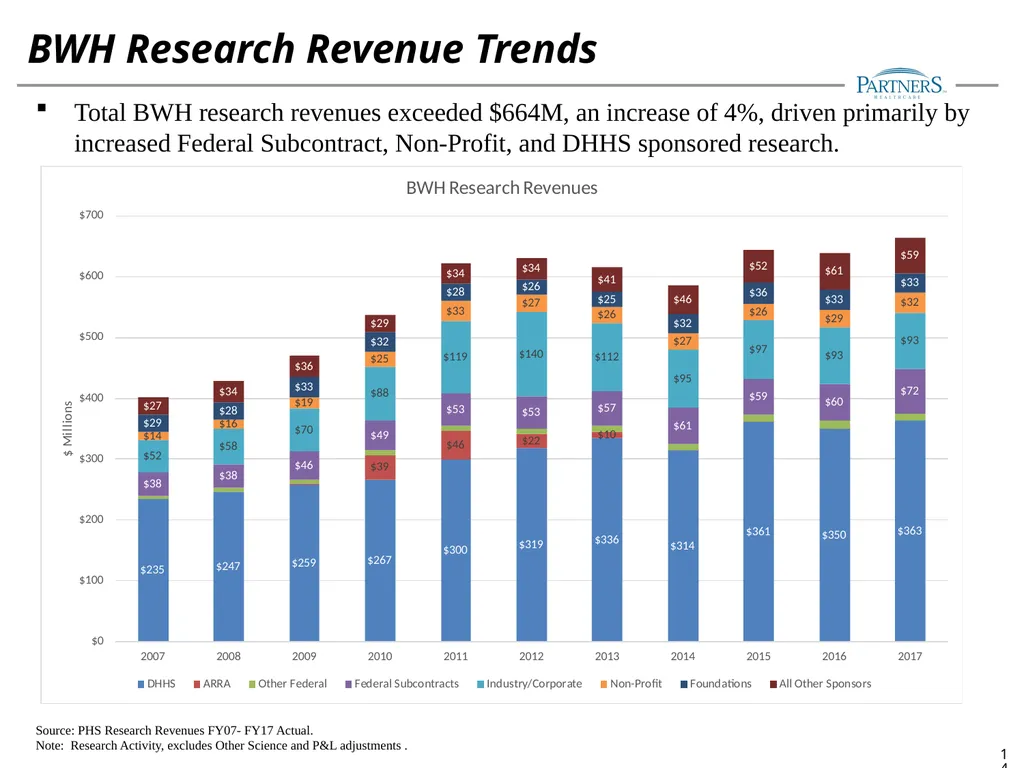
Note: Research Activity, excludes Other Science and P&L adjustments . Total BWH research revenues exceeded $664M, an increase of 4%, driven primarily by increased Federal Subcontract, Non-Profit, and DHHS sponsored research. 14<br>
slide15. BWH Research Revenue Sponsor Mix Source: PHS Research Revenues FY07- FY17 Actual.
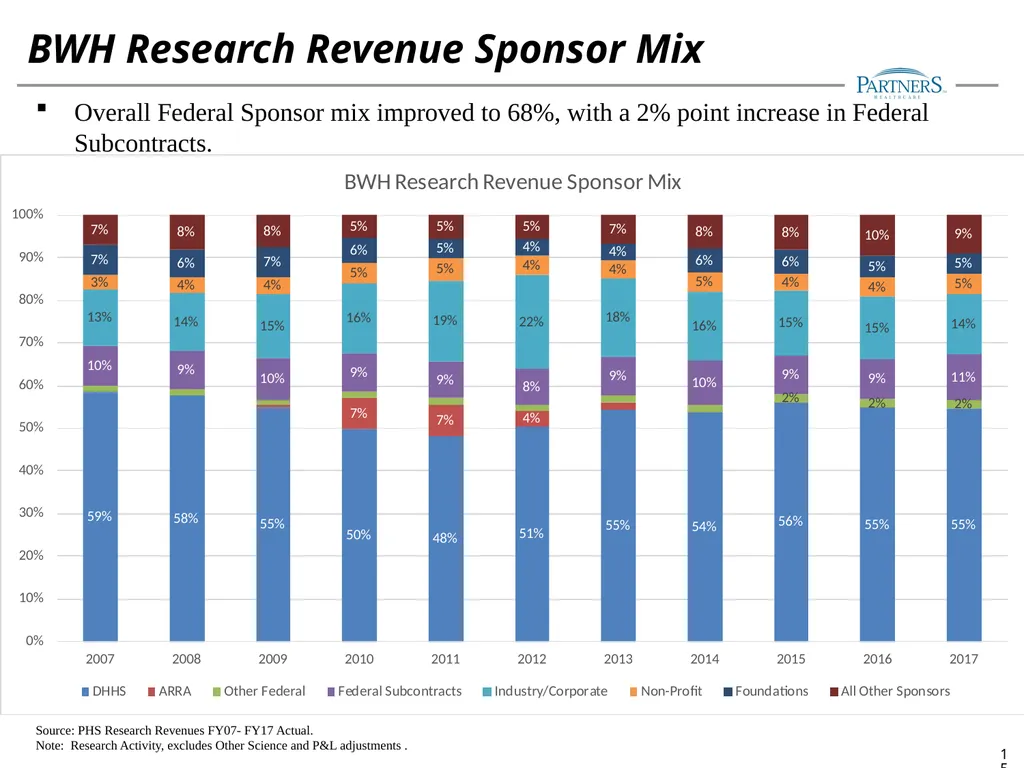
Note: Research Activity, excludes Other Science and P&L adjustments . Overall Federal Sponsor mix improved to 68%, with a 2% point increase in Federal Subcontracts. 15<br>
slide16. MGH Research Revenue Trends Source: PHS Research Revenues FY07- FY17 Actual.
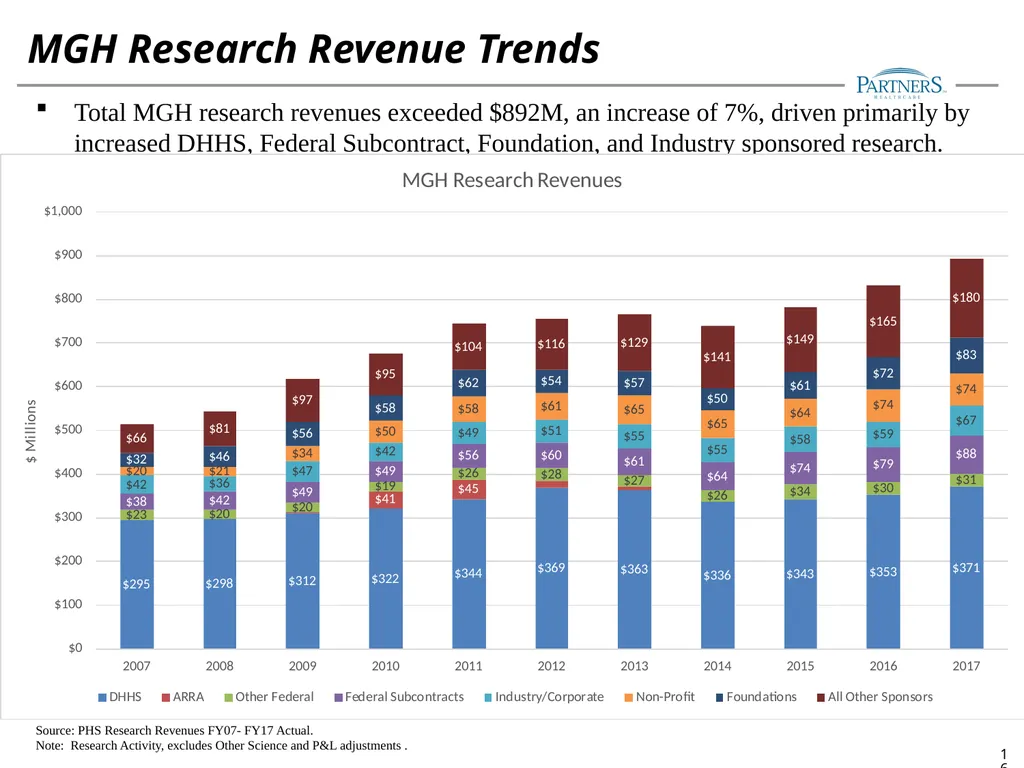
Note: Research Activity, excludes Other Science and P&L adjustments . Total MGH research revenues exceeded $892M, an increase of 7%, driven primarily by increased DHHS, Federal Subcontract, Foundation, and Industry sponsored research. 16<br>
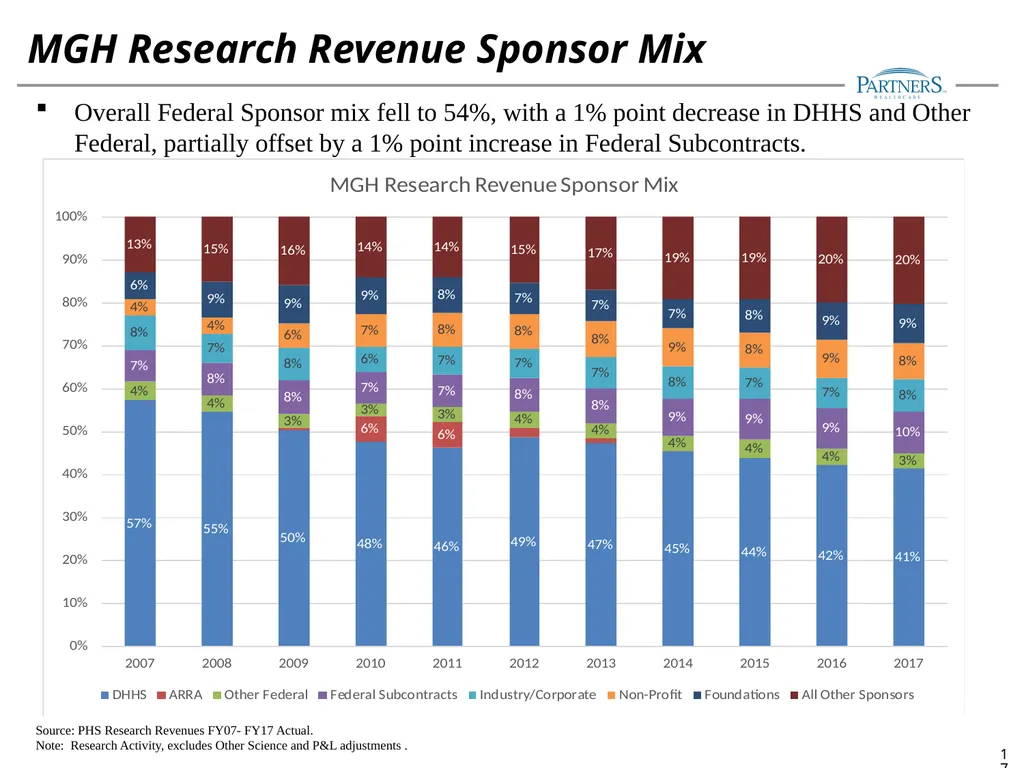
slide17. MGH Research Revenue Sponsor Mix Source: PHS Research Revenues FY07- FY17 Actual.
Note: Research Activity, excludes Other Science and P&L adjustments . Overall Federal Sponsor mix fell to 54%, with a 1% point decrease in DHHS and Other Federal, partially offset by a 1% point increase in Federal Subcontracts. 17<br>
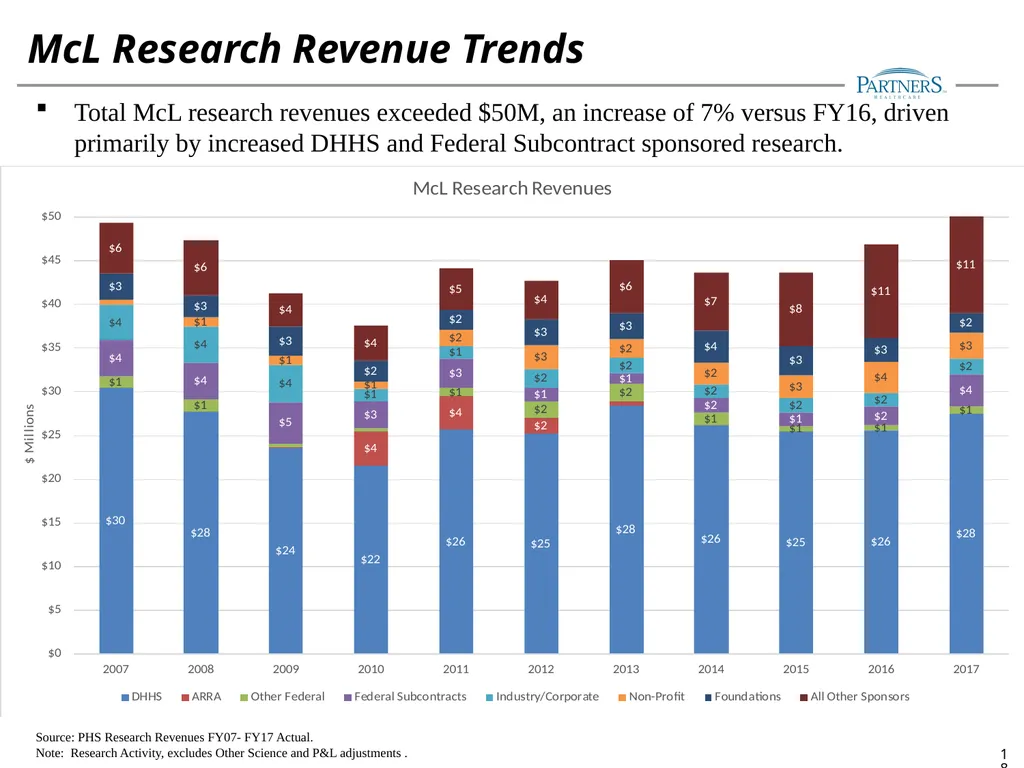
slide18. McL Research Revenue Trends Source: PHS Research Revenues FY07- FY17 Actual.
Note: Research Activity, excludes Other Science and P&L adjustments . Total McL research revenues exceeded $50M, an increase of 7% versus FY16, driven primarily by increased DHHS and Federal Subcontract sponsored research. 18<br>
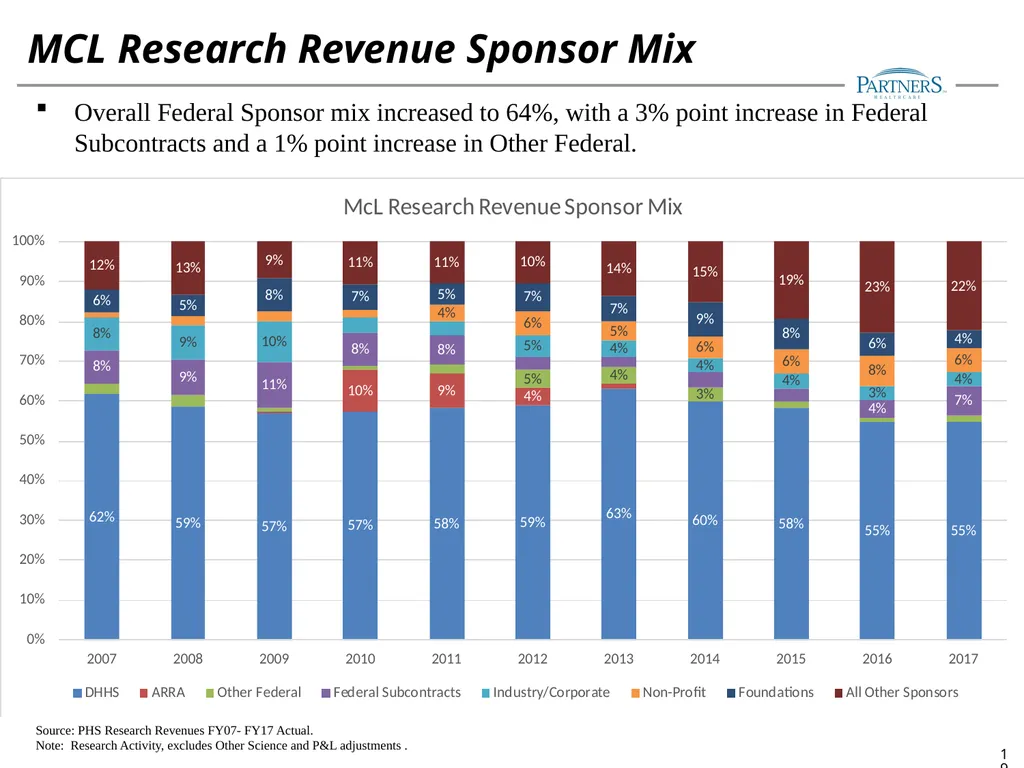
slide19. MCL Research Revenue Sponsor Mix Source: PHS Research Revenues FY07- FY17 Actual.
Note: Research Activity, excludes Other Science and P&L adjustments . Overall Federal Sponsor mix increased to 64%, with a 3% point increase in Federal Subcontracts and a 1% point increase in Other Federal. 19<br>
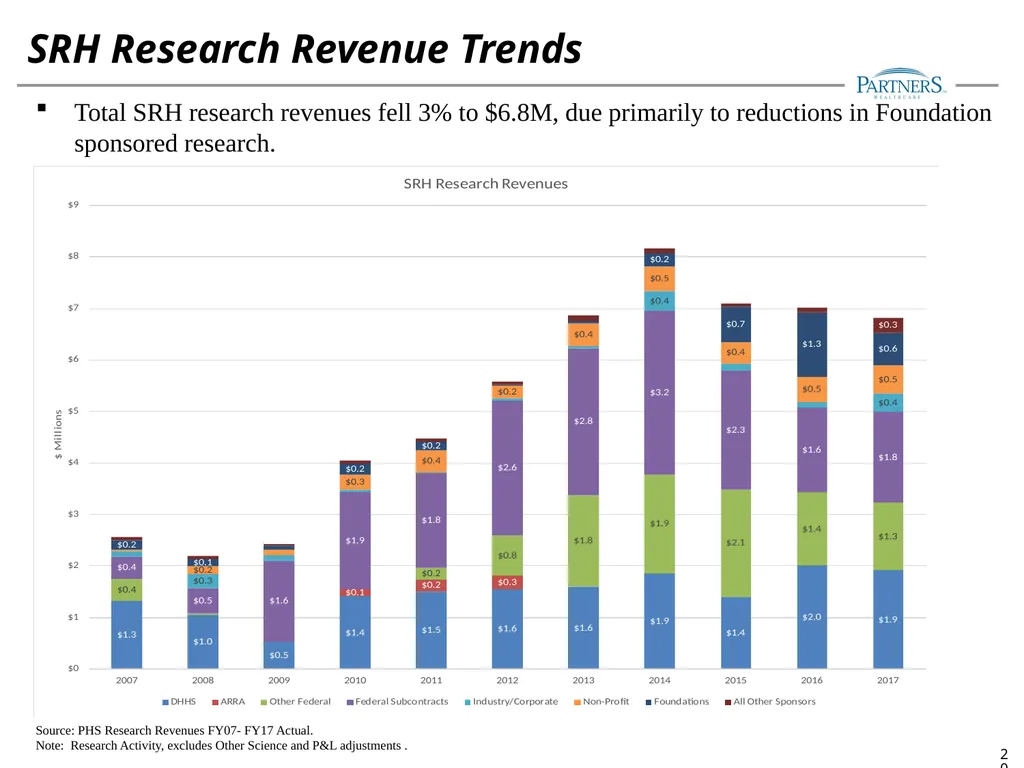
slide20. SRH Research Revenue Trends Source: PHS Research Revenues FY07- FY17 Actual.
Note: Research Activity, excludes Other Science and P&L adjustments . Total SRH research revenues fell 3% to $6.8M, due primarily to reductions in Foundation sponsored research. 20<br>
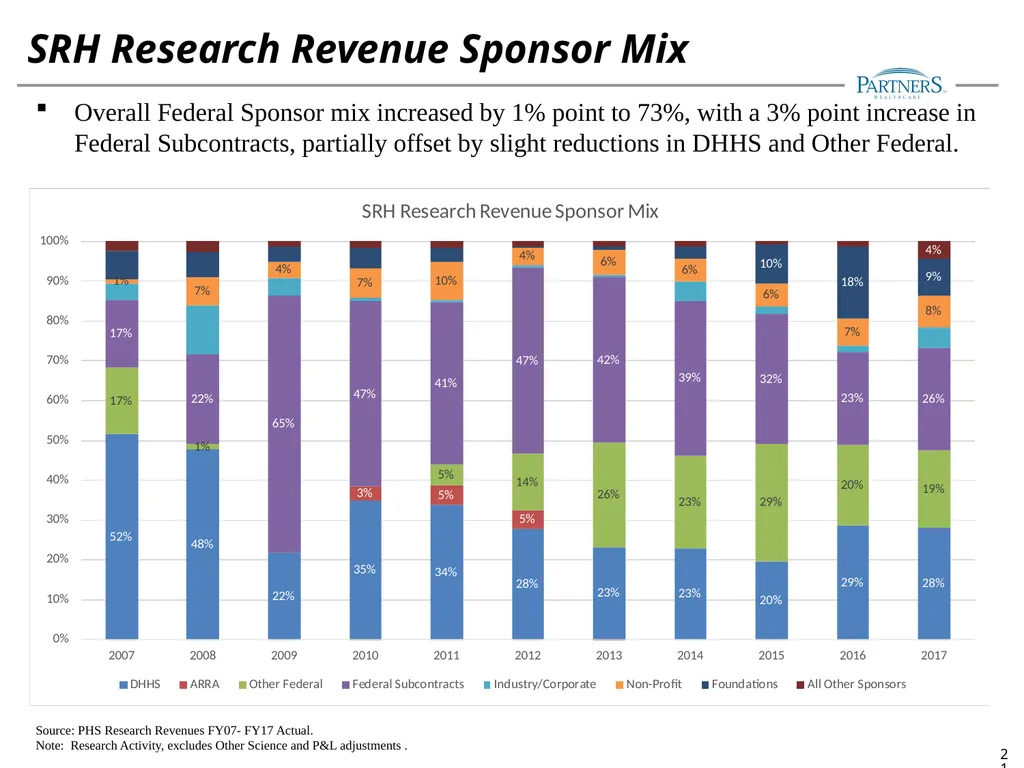
slide21. SRH Research Revenue Sponsor Mix Source: PHS Research Revenues FY07- FY17 Actual.
Note: Research Activity, excludes Other Science and P&L adjustments . Overall Federal Sponsor mix increased by 1% point to 73%, with a 3% point increase in Federal Subcontracts, partially offset by slight reductions in DHHS and Other Federal. 21<br>
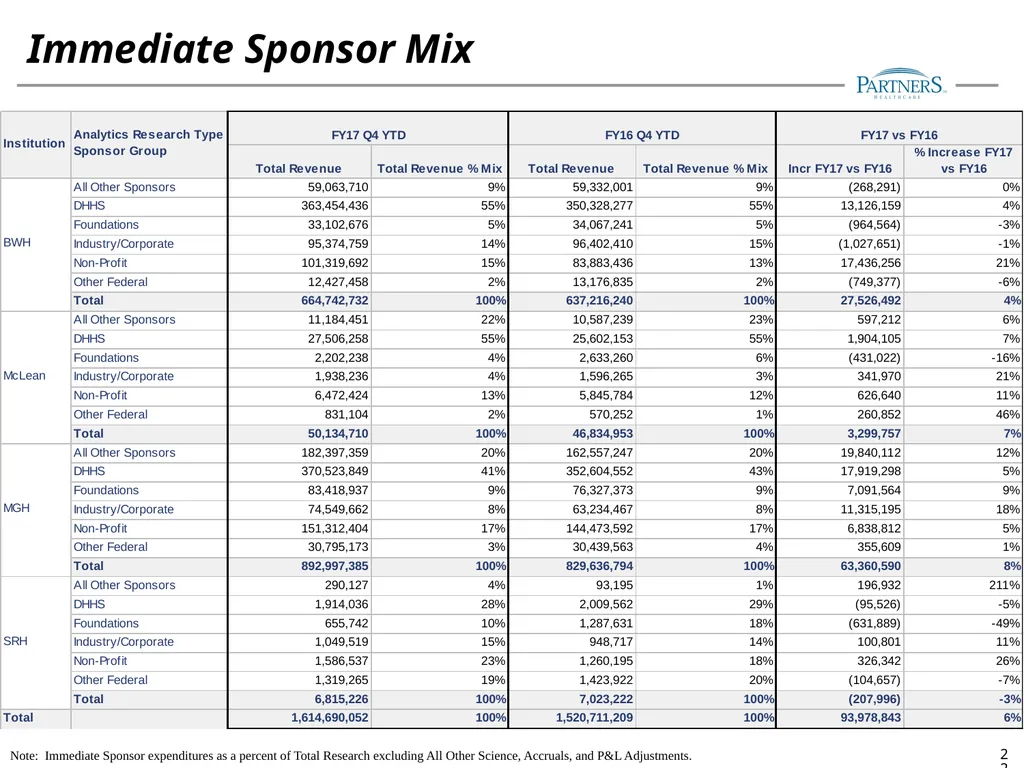
slide22. Immediate Sponsor Mix 22 Note: Immediate Sponsor expenditures as a percent of Total Research excluding All Other Science, Accruals, and P&L Adjustments.<br>
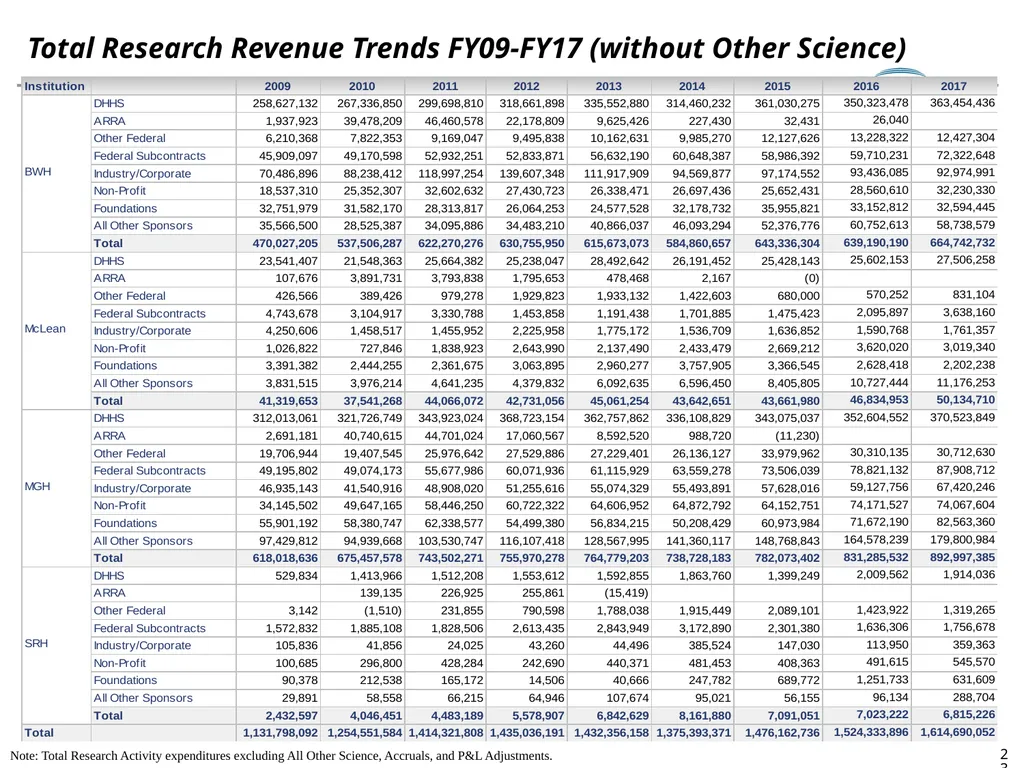
slide23. Total Research Revenue Trends FY09-FY17 (without Other Science) 23 Note: Total Research Activity expenditures excluding All Other Science, Accruals, and P&L Adjustments.<br>
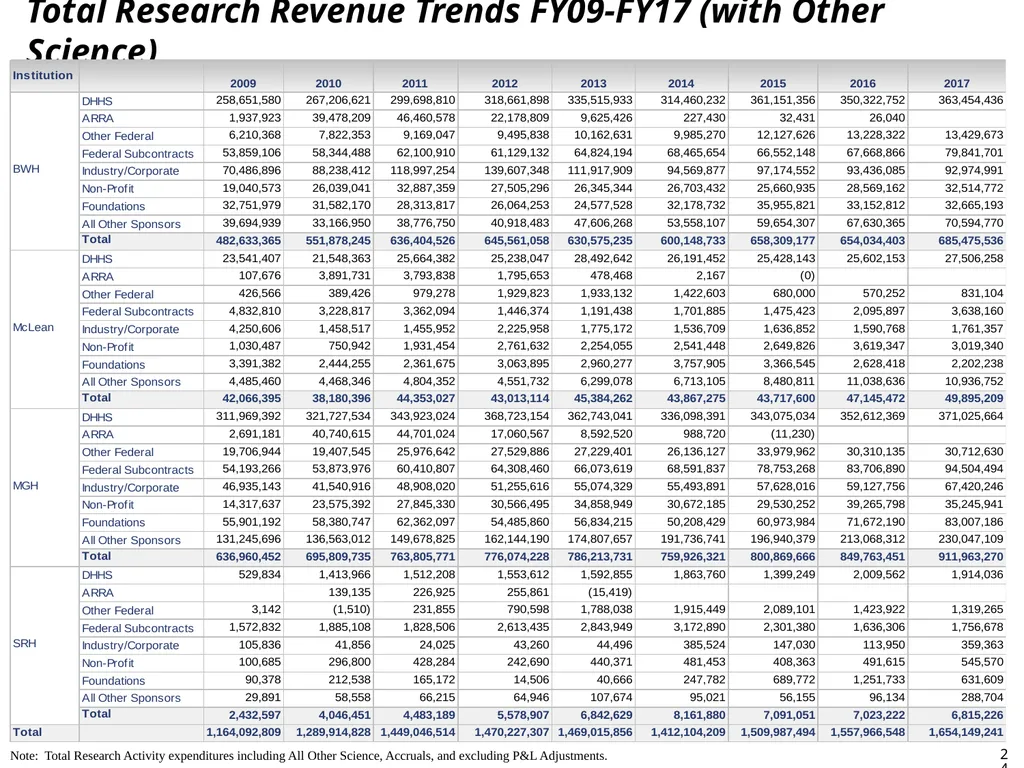
slide24. Total Research Revenue Trends FY09-FY17 (with Other Science) 24 Note: Total Research Activity expenditures including All Other Science, Accruals, and excluding P&L Adjustments.<br>
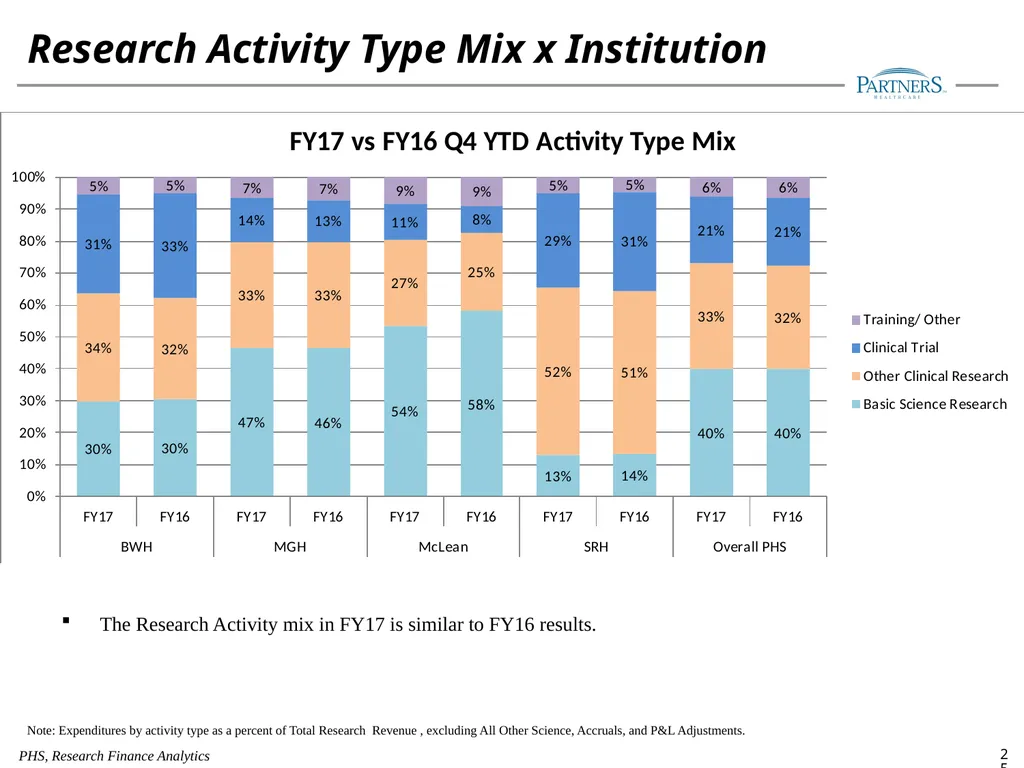
slide25. The Research Activity mix in FY17 is similar to FY16 results. Research Activity Type Mix x Institution 25 PHS, Research Finance Analytics Note: Expenditures by activity type as a percent of Total Research Revenue , excluding All Other Science, Accruals, and P&L Adjustments.<br>
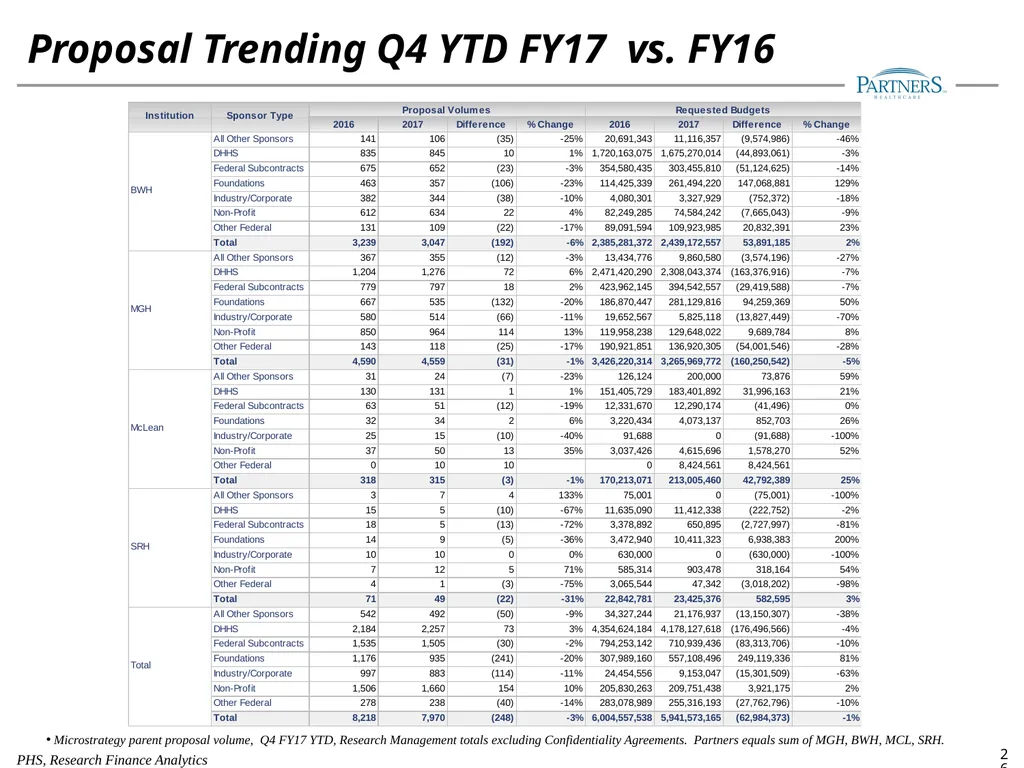
slide26. Proposal Trending Q4 YTD FY17 vs. FY16 PHS, Research Finance Analytics 26 Microstrategy parent proposal volume, Q4 FY17 YTD, Research Management totals excluding Confidentiality Agreements. Partners equals sum of MGH, BWH, MCL, SRH.<br>
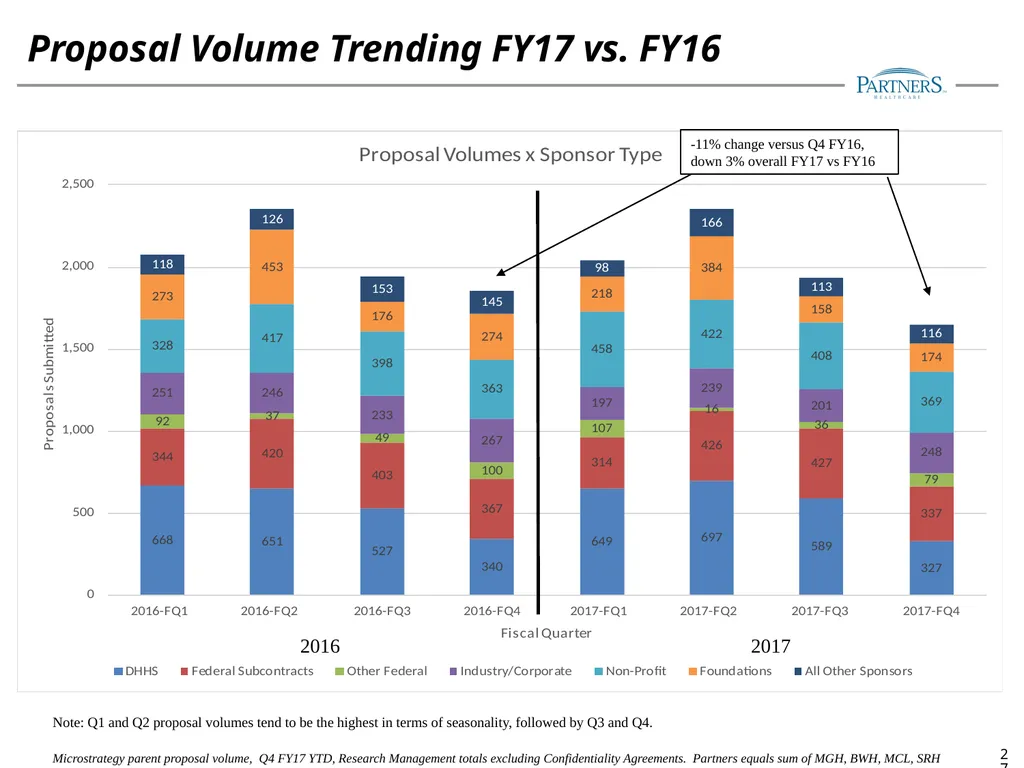
slide27. Proposal Volume Trending FY17 vs. FY16 27 Microstrategy parent proposal volume, Q4 FY17 YTD, Research Management totals excluding Confidentiality Agreements. Partners equals sum of MGH, BWH, MCL, SRH Note: Q1 and Q2 proposal volumes tend to be the highest in terms of seasonality, followed by Q3 and Q4. -11% change versus Q4 FY16, down 3% overall FY17 vs FY16 2016 2017<br>
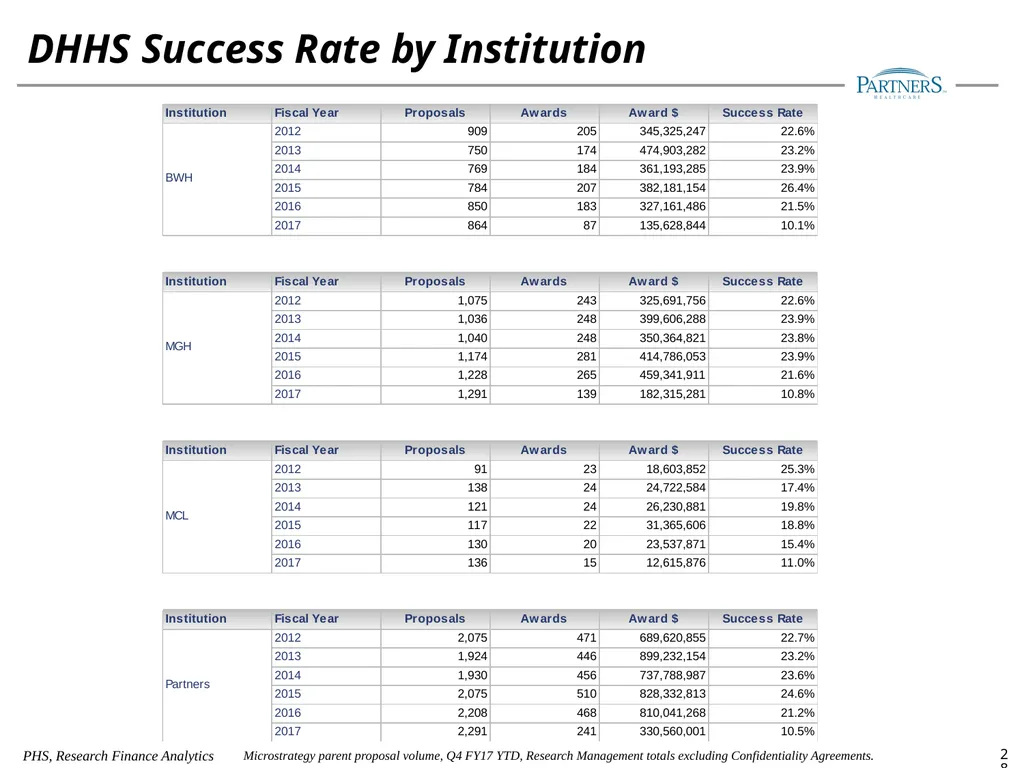
slide28. DHHS Success Rate by Institution PHS, Research Finance Analytics 28 Microstrategy parent proposal volume, Q4 FY17 YTD, Research Management totals excluding Confidentiality Agreements.<br>

slide2. PHS Research Revenue Trends Source: PHS Research Revenues FY07- FY17 Actual. PHS includes BWH, MGH, McL, SRH, and all other PHS entities.
Note: Research Activity, excludes Other Science and P&L adjustments . Total PHS research revenues exceeded $1.6B, an increase of 6%, driven primarily by increased Federal Subcontract, Foundation, and Internally sponsored research. 2<br>
slide3. PHS Research Revenue Sponsor Mix Source: PHS Research Revenues FY07- FY17 Actual. PHS includes BWH, MGH, McL, SRH, and all other PHS entities.
Note: Research Activity, excludes Other Science and P&L adjustments . Overall Federal Sponsor mix remained unchanged at 60%, with a 1% point decrease in DHHS offset by a similar increase in Federal Subcontracts. 3<br>
slide4. FY17 Research Revenues by Institution and Sponsor Type – With Federal Subcontracts *Includes Federal subcontracts sourced from Non-Profits and Foundations
Note: Sponsor expenditures as a percent of Total Research Revenue, excluding All Other Science, Accruals, and P&L Adjustments 4 Total Research activity is up $94M versus FY16, and up across all institutions and all sponsor categories.<br>
slide5. FY17 Immediate Sponsor Mix by Institution– Includes Federal Subcontracts – Total Revenue *Includes Federal subcontracts sourced from Non-Profits and Foundations
Note: Sponsor expenditures as a percent of Total Research Revenue, excluding All Other Science, Accruals, and P&L Adjustments 5 Including federal subcontracts through non-profits and foundations, all federally sponsored activity accounts for 68% of BWH revenue and 54% of MGH revenue. For all of PHS, 60% of originating sponsored research is sourced through the Federal Government, which is equivalent to FY16.
While the overall dollar amount of Federal funding increased by $56M (+6.1%) for Q4 YTD FY17 versus FY16, the overall percentage of Federal funding remained unchanged due to the growth in Industry, Non-Profit (non-federal subcontracts), Foundation, and Internally sponsored research.<br>
slide6. FY17 NIH Funding through October 2nd is not final, though PHS increases are likely to be small. FY17 data expected to be final on 12/31/2017.
PHS Share of FY17 NIH Funding continues to remain top-ranked for Independent Hospitals and is $67M higher {+9.1%} versus this same time-frame from FY16.
New PHS FY17 NIH awards stand at $714M, and when coupled with more than $800M in new FY16 awards, we expect strong revenue growth in FY18 and beyond. Source: NIH Funding Report, US. Department of Health and Human Services NIH Funding Market Share Trends 6 PHS, Research Finance Analytics<br>
slide7. Source: NIH Funding Report as of Oct 12, 2017, US. Department of Health and Human Services NIH Funding Rank Trends – All Organizations 7 PHS, Research Finance Analytics<br>
slide8. Source: NIH Funding Report as of Oct 12, 2017, US. Department of Health and Human Services NIH Funding Rank Trends – Independent Hospitals 8 PHS, Research Finance Analytics<br>
slide9. Source: NIH Funding Report, US. Department of Health and Human Services FY17 Comparison of NIH Funding by Institute versus PHS 9 PHS, Research Finance Analytics<br>
slide10. Partners- New Award Funding by Quarter PHS, Research Analytics, Micro Strategy Awards FY12-FY17, data as October 19, 2017. Partners includes MGH, BWH, MCL, SRH, PHS, NWH, and IHP. 10 Note: Award quarter/year based on start date of parent award.<br>
slide11. Last Updated 1/30/2018 DHHS New Award Funding FY13-Q4 FY17 In FY17, 85% of DHHS New Award $ are at the Full Onsite Rate versus 83% in FY16, 86% in FY15, 53% in FY14, and 83% in FY13. 11 Includes 5 mega awards for $300M, with very low IDC<br>
slide12. Last Updated 1/30/2018 Proposal Trends by Fiscal Year 12 FY17 Proposals down 3% vs. FY16 due to a 20% decrease in Foundations<br>
slide13. Headcount and FTE comparison – Q4 FY17 YTD vs. Q4 FY16 YTD Research Headcount has increased by 428 (+3%) from Q4 FY16 YTD to Q4 FY17 YTD
Research FTE’s have increased by 239 (+3%) from Q4 FY16 YTD to Q4 FY17 YTD PHS, Research Finance Analytics, Micro Strategy Reporting 13<br>
slide14. BWH Research Revenue Trends Source: PHS Research Revenues FY07- FY17 Actual.
Note: Research Activity, excludes Other Science and P&L adjustments . Total BWH research revenues exceeded $664M, an increase of 4%, driven primarily by increased Federal Subcontract, Non-Profit, and DHHS sponsored research. 14<br>
slide15. BWH Research Revenue Sponsor Mix Source: PHS Research Revenues FY07- FY17 Actual.
Note: Research Activity, excludes Other Science and P&L adjustments . Overall Federal Sponsor mix improved to 68%, with a 2% point increase in Federal Subcontracts. 15<br>
slide16. MGH Research Revenue Trends Source: PHS Research Revenues FY07- FY17 Actual.
Note: Research Activity, excludes Other Science and P&L adjustments . Total MGH research revenues exceeded $892M, an increase of 7%, driven primarily by increased DHHS, Federal Subcontract, Foundation, and Industry sponsored research. 16<br>
slide17. MGH Research Revenue Sponsor Mix Source: PHS Research Revenues FY07- FY17 Actual.
Note: Research Activity, excludes Other Science and P&L adjustments . Overall Federal Sponsor mix fell to 54%, with a 1% point decrease in DHHS and Other Federal, partially offset by a 1% point increase in Federal Subcontracts. 17<br>
slide18. McL Research Revenue Trends Source: PHS Research Revenues FY07- FY17 Actual.
Note: Research Activity, excludes Other Science and P&L adjustments . Total McL research revenues exceeded $50M, an increase of 7% versus FY16, driven primarily by increased DHHS and Federal Subcontract sponsored research. 18<br>
slide19. MCL Research Revenue Sponsor Mix Source: PHS Research Revenues FY07- FY17 Actual.
Note: Research Activity, excludes Other Science and P&L adjustments . Overall Federal Sponsor mix increased to 64%, with a 3% point increase in Federal Subcontracts and a 1% point increase in Other Federal. 19<br>
slide20. SRH Research Revenue Trends Source: PHS Research Revenues FY07- FY17 Actual.
Note: Research Activity, excludes Other Science and P&L adjustments . Total SRH research revenues fell 3% to $6.8M, due primarily to reductions in Foundation sponsored research. 20<br>
slide21. SRH Research Revenue Sponsor Mix Source: PHS Research Revenues FY07- FY17 Actual.
Note: Research Activity, excludes Other Science and P&L adjustments . Overall Federal Sponsor mix increased by 1% point to 73%, with a 3% point increase in Federal Subcontracts, partially offset by slight reductions in DHHS and Other Federal. 21<br>
slide22. Immediate Sponsor Mix 22 Note: Immediate Sponsor expenditures as a percent of Total Research excluding All Other Science, Accruals, and P&L Adjustments.<br>
slide23. Total Research Revenue Trends FY09-FY17 (without Other Science) 23 Note: Total Research Activity expenditures excluding All Other Science, Accruals, and P&L Adjustments.<br>
slide24. Total Research Revenue Trends FY09-FY17 (with Other Science) 24 Note: Total Research Activity expenditures including All Other Science, Accruals, and excluding P&L Adjustments.<br>
slide25. The Research Activity mix in FY17 is similar to FY16 results. Research Activity Type Mix x Institution 25 PHS, Research Finance Analytics Note: Expenditures by activity type as a percent of Total Research Revenue , excluding All Other Science, Accruals, and P&L Adjustments.<br>
slide26. Proposal Trending Q4 YTD FY17 vs. FY16 PHS, Research Finance Analytics 26 Microstrategy parent proposal volume, Q4 FY17 YTD, Research Management totals excluding Confidentiality Agreements. Partners equals sum of MGH, BWH, MCL, SRH.<br>
slide27. Proposal Volume Trending FY17 vs. FY16 27 Microstrategy parent proposal volume, Q4 FY17 YTD, Research Management totals excluding Confidentiality Agreements. Partners equals sum of MGH, BWH, MCL, SRH Note: Q1 and Q2 proposal volumes tend to be the highest in terms of seasonality, followed by Q3 and Q4. -11% change versus Q4 FY16, down 3% overall FY17 vs FY16 2016 2017<br>
slide28. DHHS Success Rate by Institution PHS, Research Finance Analytics 28 Microstrategy parent proposal volume, Q4 FY17 YTD, Research Management totals excluding Confidentiality Agreements.<br>