
GIS Level 2: Introduction to Spatial Analysis
FD
Published · 70 slides · 0 views
1 / 1
Description
GIS Level 2: Introduction to Spatial Analysis Courtesy of US Air Force. Image is in the public domain. 1 Introduction to spatial analyses Use map projections metadata to understand and transform spatial data Use different types of
Related Topics
Share
Embed code
Download this presentation From Below
"GIS Level 2: Introduction to Spatial Analysis" is the property of its rightful owner. Permission is granted to download and print the materials on this website for personal, non-commercial use only, and to display it on your personal computer provided you do not modify the materials and that you retain all copyright notices contained in the materials. By downloading content from our website, you accept the terms of this agreement.
Presentation Transcript
01
GIS Level 2:
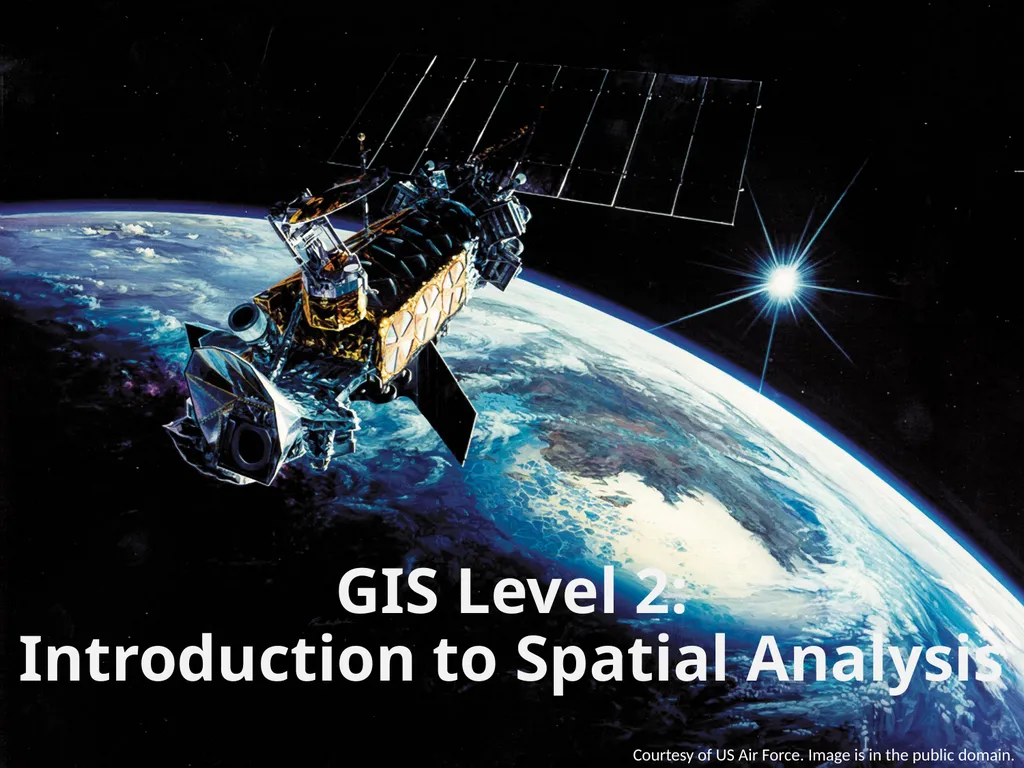
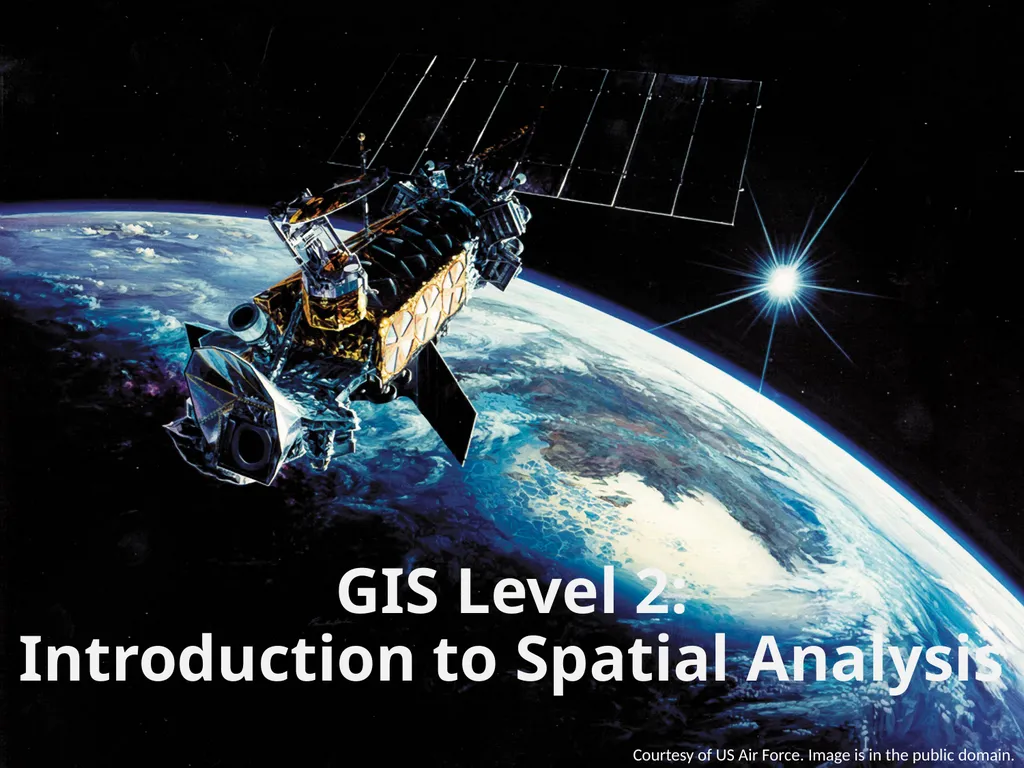
Introduction to Spatial Analysis Courtesy of US Air Force. Image is in the public domain. 1<br>
02
Introduction to spatial analyses
Use map projections & metadata to understand and transform spatial data
Use different types of processing tools in software(s) to perform a multi-step analysis
Exercise new knowledge with GIS software(s) OUTLINE Introduction » Map Projections » Metadata » Processing Tools » Exercise 2<br>
Use map projections & metadata to understand and transform spatial data
Use different types of processing tools in software(s) to perform a multi-step analysis
Exercise new knowledge with GIS software(s) OUTLINE Introduction » Map Projections » Metadata » Processing Tools » Exercise 2<br>
03
Introduction to Spatial Analysis Introduction » Map Projections » Metadata » Processing Tools » Exercise 3<br>
04
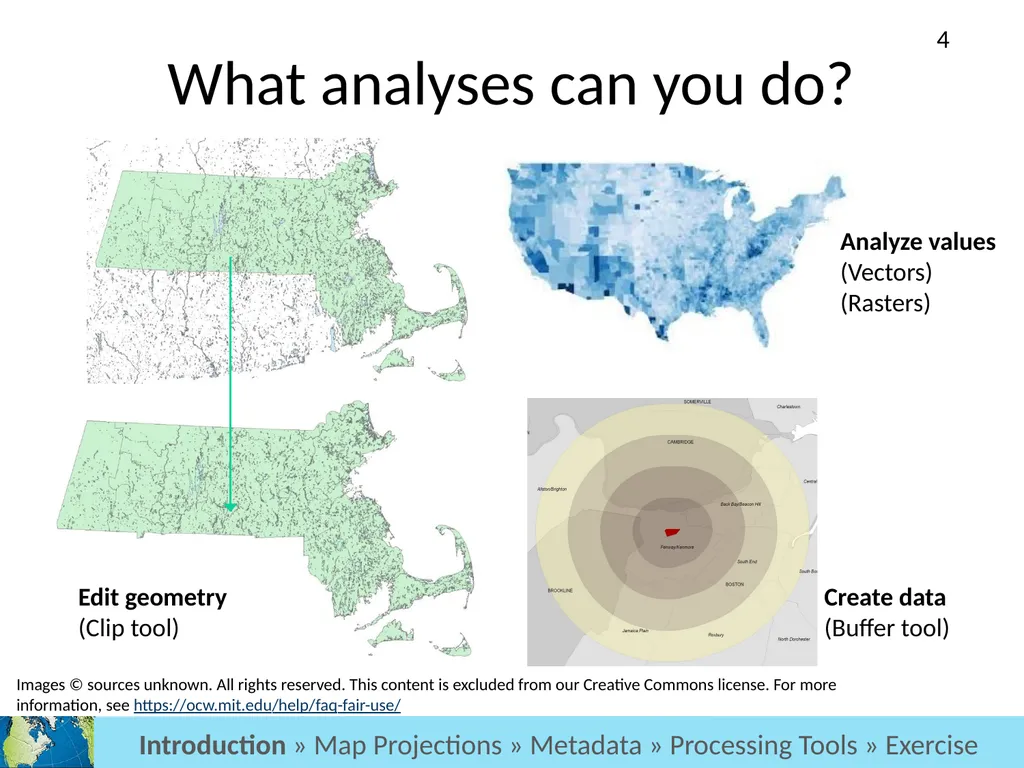
What analyses can you do? Create data
(Buffer tool) Edit geometry (Clip tool) Introduction » Map Projections » Metadata » Processing Tools » Exercise Analyze values
(Vectors)
(Rasters) Images © sources unknown. All rights reserved. This content is excluded from our Creative Commons license. For more information, see https://ocw.mit.edu/help/faq-fair-use/ 4<br>
(Buffer tool) Edit geometry (Clip tool) Introduction » Map Projections » Metadata » Processing Tools » Exercise Analyze values
(Vectors)
(Rasters) Images © sources unknown. All rights reserved. This content is excluded from our Creative Commons license. For more information, see https://ocw.mit.edu/help/faq-fair-use/ 4<br>
05
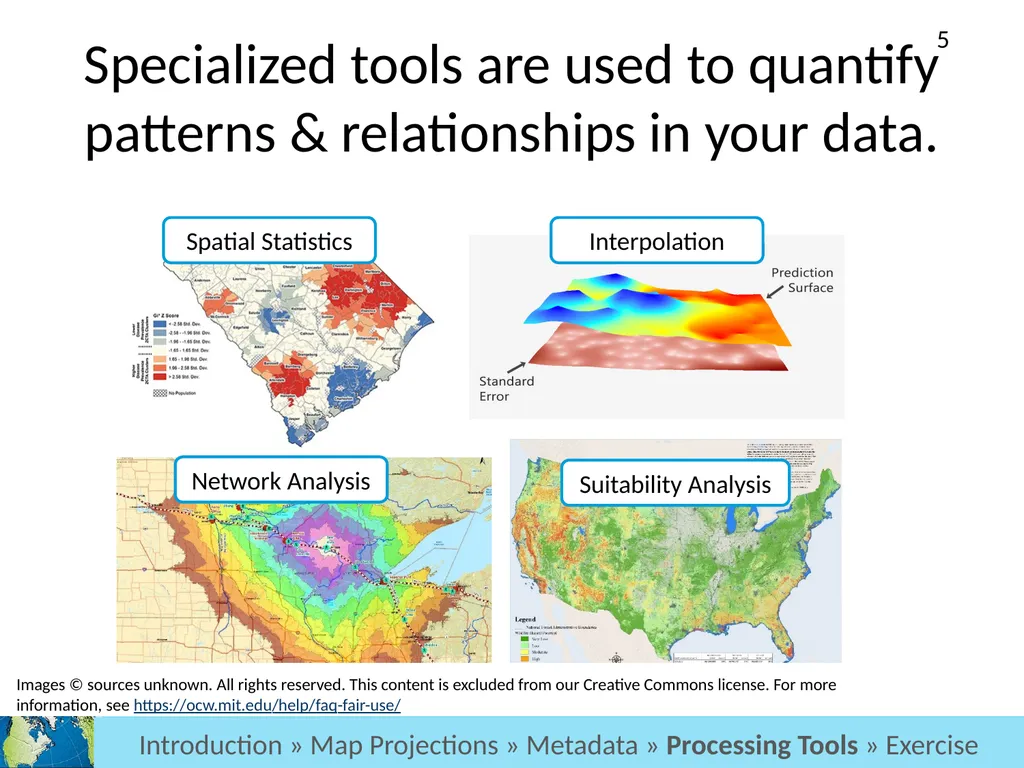
Specialized tools are used to quantify patterns & relationships in your data. Introduction > Projections > Metadata > Processing Tools > Exercise Introduction » Map Projections » Metadata » Processing Tools » Exercise Network Analysis Spatial Statistics Suitability Analysis Interpolation Images © sources unknown. All rights reserved. This content is excluded from our Creative Commons license. For more information, see https://ocw.mit.edu/help/faq-fair-use/ 5<br>
06
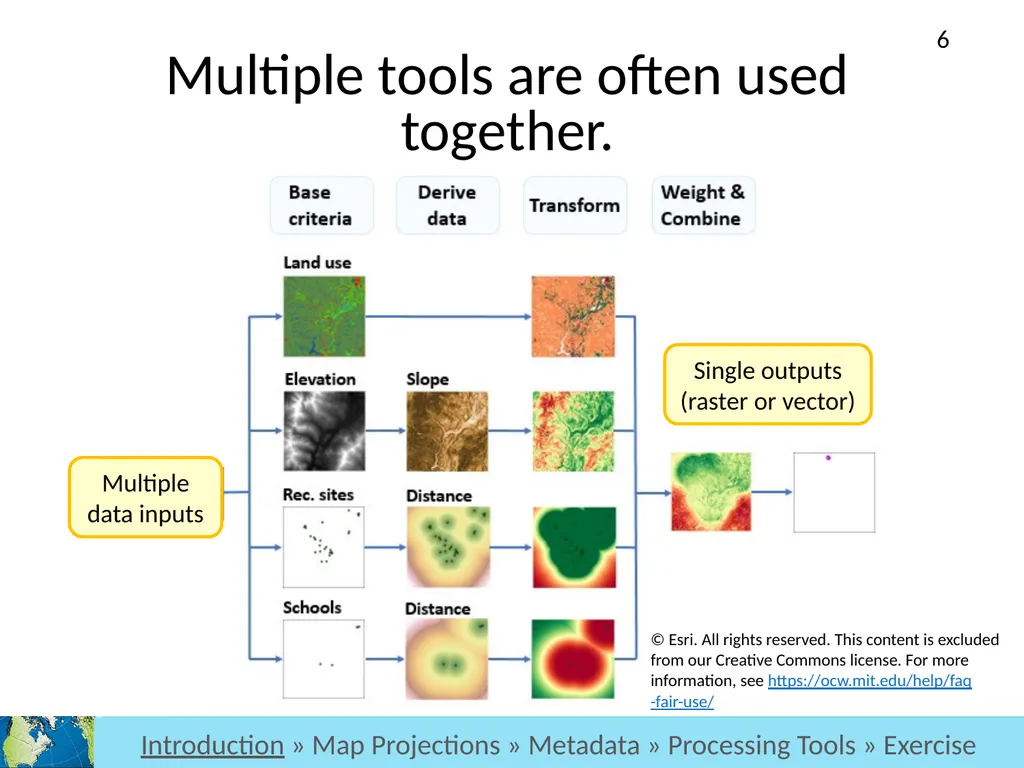
Multiple tools are often used together. Introduction > Projections > Metadata > Processing Tools > Exercise Introduction » Map Projections » Metadata » Processing Tools » Exercise Multiple data inputs Single outputs (raster or vector) © Esri. All rights reserved. This content is excluded from our Creative Commons license. For more information, see https://ocw.mit.edu/help/faq-fair-use/ 6<br>
07
MAP Projections:
Why DO WE care about them? Introduction » Map Projections » Metadata » Processing Tools » Exercise 7<br>
08
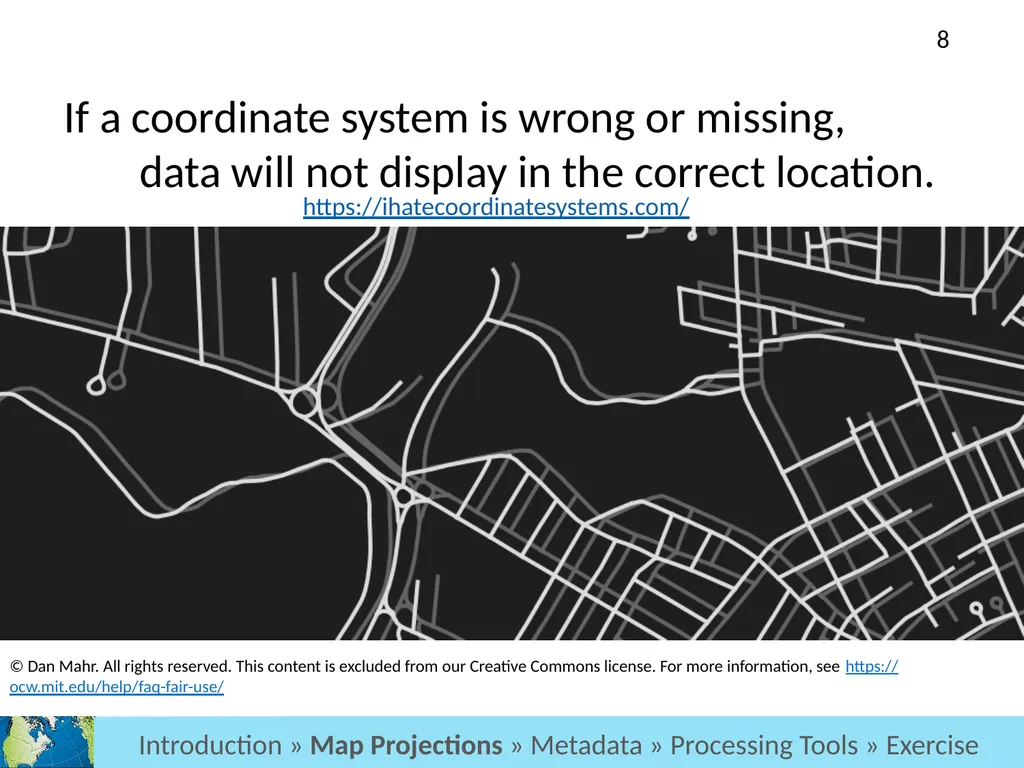
If a coordinate system is wrong or missing, data will not display in the correct location. https://ihatecoordinatesystems.com/ Introduction » Map Projections » Metadata » Processing Tools » Exercise © Dan Mahr. All rights reserved. This content is excluded from our Creative Commons license. For more information, see https://ocw.mit.edu/help/faq-fair-use/ 8<br>
09
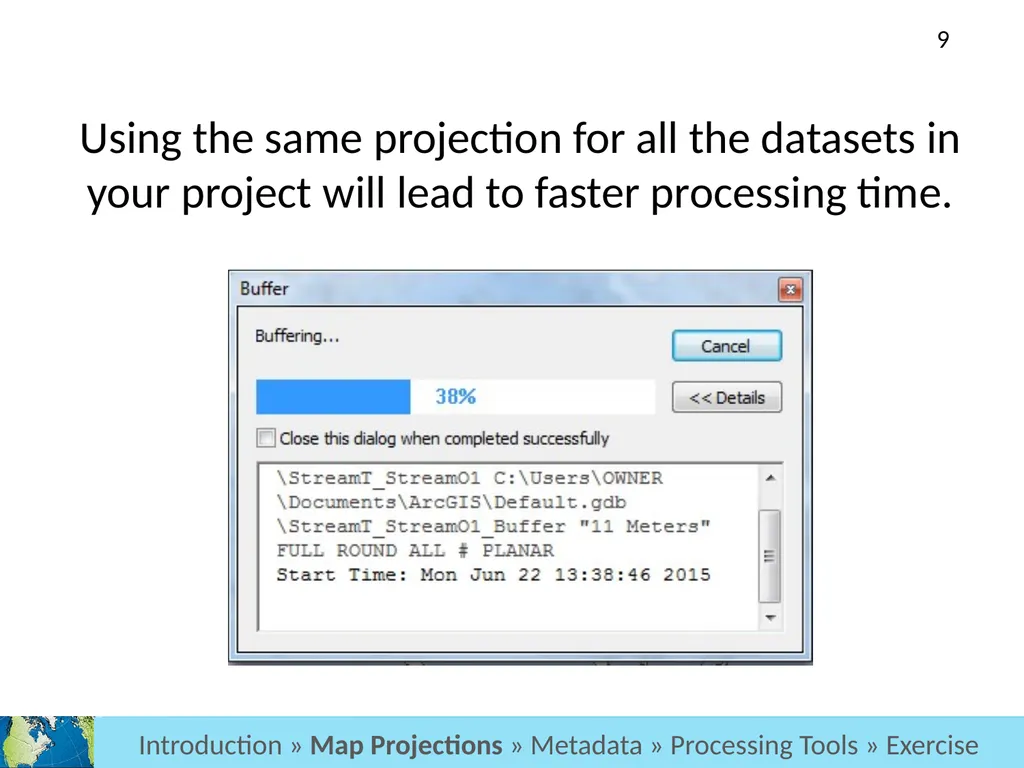
Using the same projection for all the datasets in your project will lead to faster processing time. Analysis >> Projections >> Metadata >> Processing Tools >> Exercise Introduction > Projections > Metadata > Processing Tools > Exercise Introduction » Map Projections » Metadata » Processing Tools » Exercise 9<br>
10
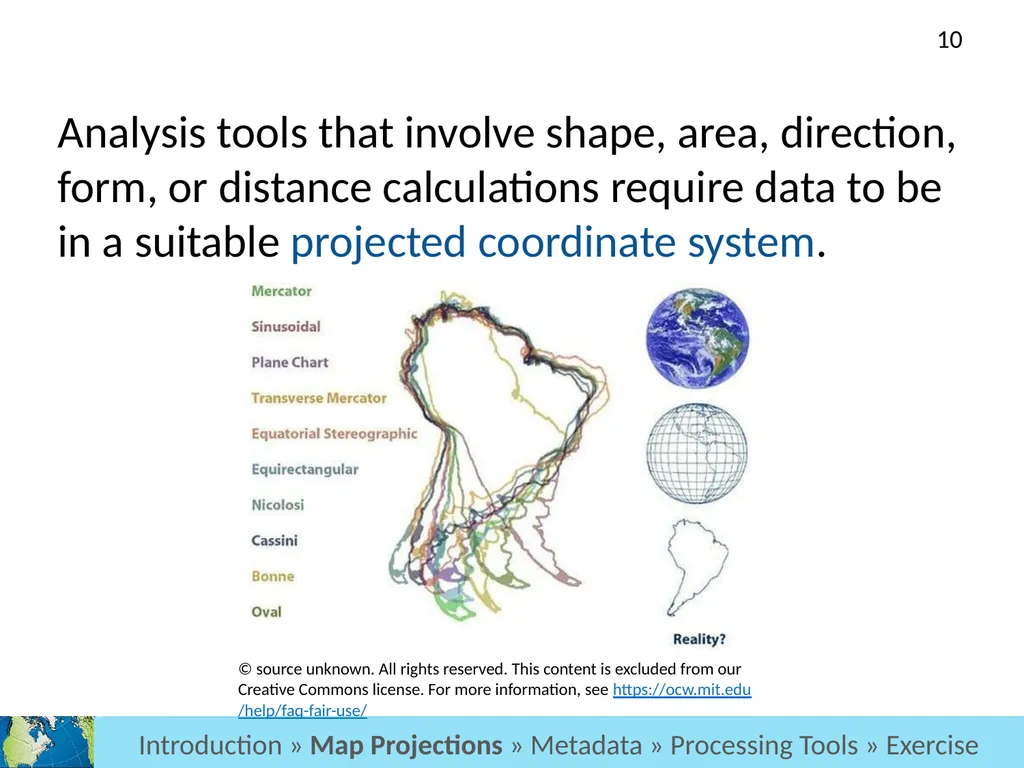
Analysis tools that involve shape, area, direction, form, or distance calculations require data to be in a suitable projected coordinate system. Analysis >> Projections >> Metadata >> Processing Tools >> Exercise Introduction > Projections > Metadata > Processing Tools > Exercise Introduction » Map Projections » Metadata » Processing Tools » Exercise © source unknown. All rights reserved. This content is excluded from our Creative Commons license. For more information, see https://ocw.mit.edu/help/faq-fair-use/ 10<br>
11
MAP Projections:
What are they? Analysis >> Projections >> Metadata >> Processing Tools >> Exercise Introduction > Projections > Metadata > Processing Tools > Exercise Introduction » Map Projections » Metadata » Processing Tools » Exercise Introduction » Map Projections » Metadata » Processing Tools » Exercise 11<br>
12
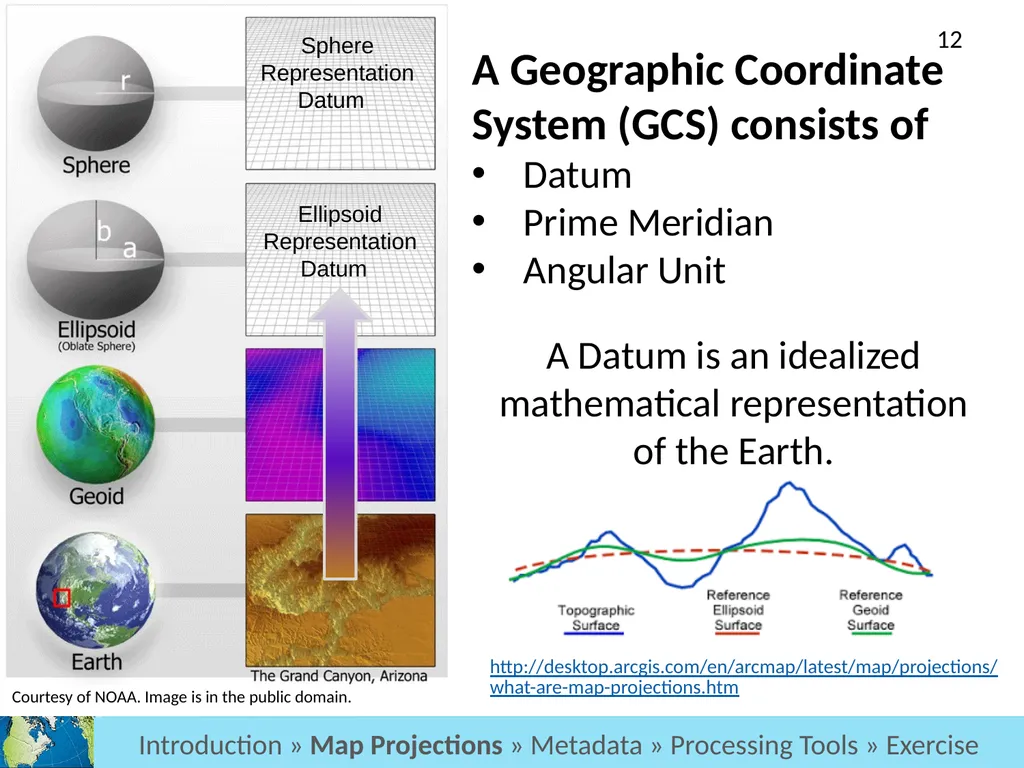
A Datum is an idealized mathematical representation of the Earth. http://desktop.arcgis.com/en/arcmap/latest/map/projections/what-are-map-projections.htm A Geographic Coordinate System (GCS) consists of
Datum
Prime Meridian
Angular Unit Introduction > Projections > Metadata > Processing Tools > Exercise Introduction » Map Projections » Metadata » Processing Tools » Exercise Ellipsoid Representation
Datum Sphere Representation
Datum Introduction » Map Projections » Metadata » Processing Tools » Exercise Courtesy of NOAA. Image is in the public domain. 12<br>
Datum
Prime Meridian
Angular Unit Introduction > Projections > Metadata > Processing Tools > Exercise Introduction » Map Projections » Metadata » Processing Tools » Exercise Ellipsoid Representation
Datum Sphere Representation
Datum Introduction » Map Projections » Metadata » Processing Tools » Exercise Courtesy of NOAA. Image is in the public domain. 12<br>
13
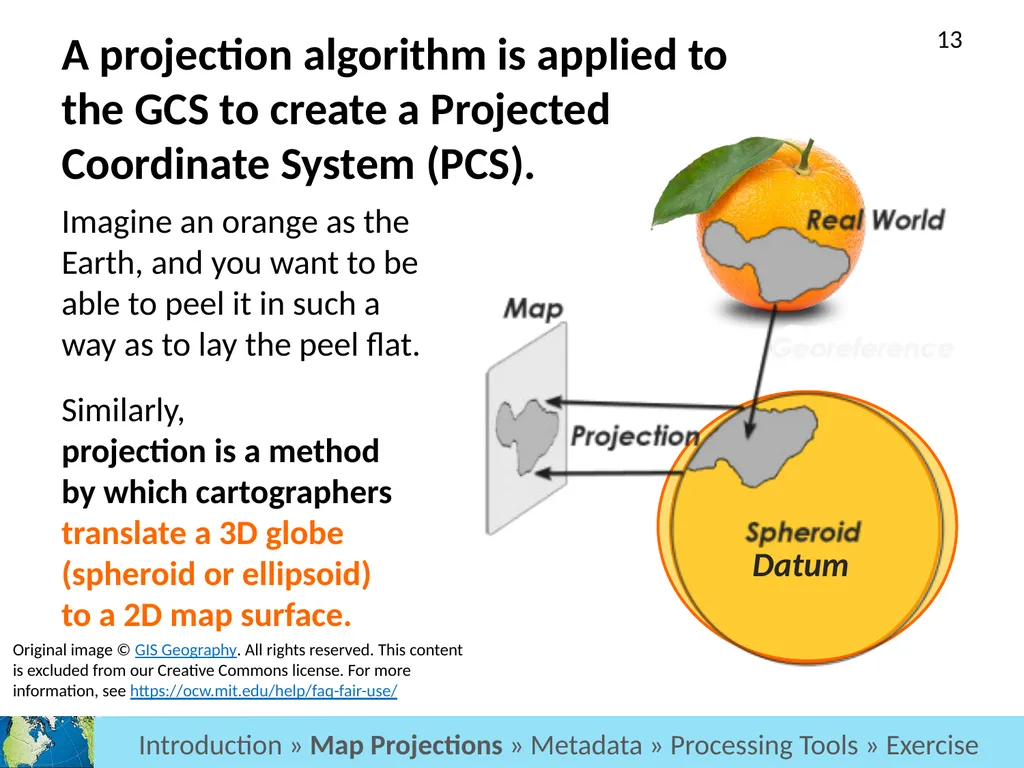
A projection algorithm is applied to the GCS to create a Projected Coordinate System (PCS). Imagine an orange as the Earth, and you want to be able to peel it in such a way as to lay the peel flat.
Similarly, projection is a method by which cartographers translate a 3D globe (spheroid or ellipsoid) to a 2D map surface. Introduction > Projections > Metadata > Processing Tools > Exercise Datum Introduction » Map Projections » Metadata » Processing Tools » Exercise Introduction » Map Projections » Metadata » Processing Tools » Exercise Original image © GIS Geography. All rights reserved. This content is excluded from our Creative Commons license. For more information, see https://ocw.mit.edu/help/faq-fair-use/ 13<br>
Similarly, projection is a method by which cartographers translate a 3D globe (spheroid or ellipsoid) to a 2D map surface. Introduction > Projections > Metadata > Processing Tools > Exercise Datum Introduction » Map Projections » Metadata » Processing Tools » Exercise Introduction » Map Projections » Metadata » Processing Tools » Exercise Original image © GIS Geography. All rights reserved. This content is excluded from our Creative Commons license. For more information, see https://ocw.mit.edu/help/faq-fair-use/ 13<br>
14
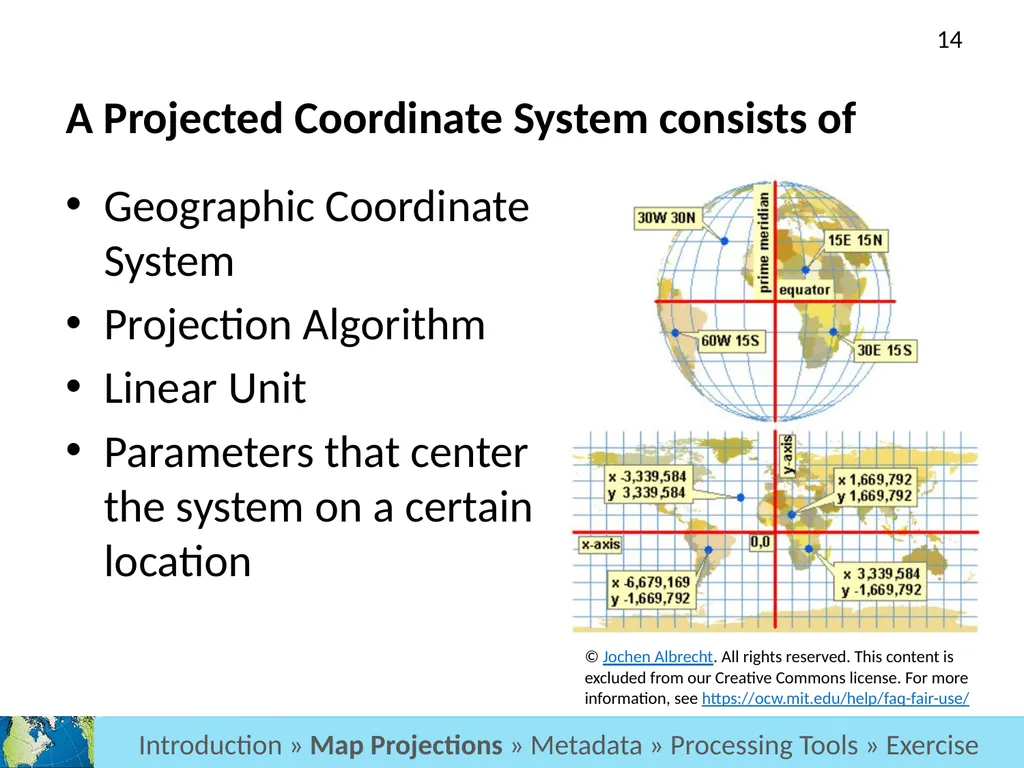
Analysis >> Projections >> Metadata >> Processing Tools >> Exercise Introduction > Projections > Metadata > Processing Tools > Exercise Introduction » Map Projections » Metadata » Processing Tools » Exercise A Projected Coordinate System consists of Geographic Coordinate System
Projection Algorithm
Linear Unit
Parameters that center the system on a certain location © Jochen Albrecht. All rights reserved. This content is excluded from our Creative Commons license. For more information, see https://ocw.mit.edu/help/faq-fair-use/ 14<br>
Projection Algorithm
Linear Unit
Parameters that center the system on a certain location © Jochen Albrecht. All rights reserved. This content is excluded from our Creative Commons license. For more information, see https://ocw.mit.edu/help/faq-fair-use/ 14<br>
15
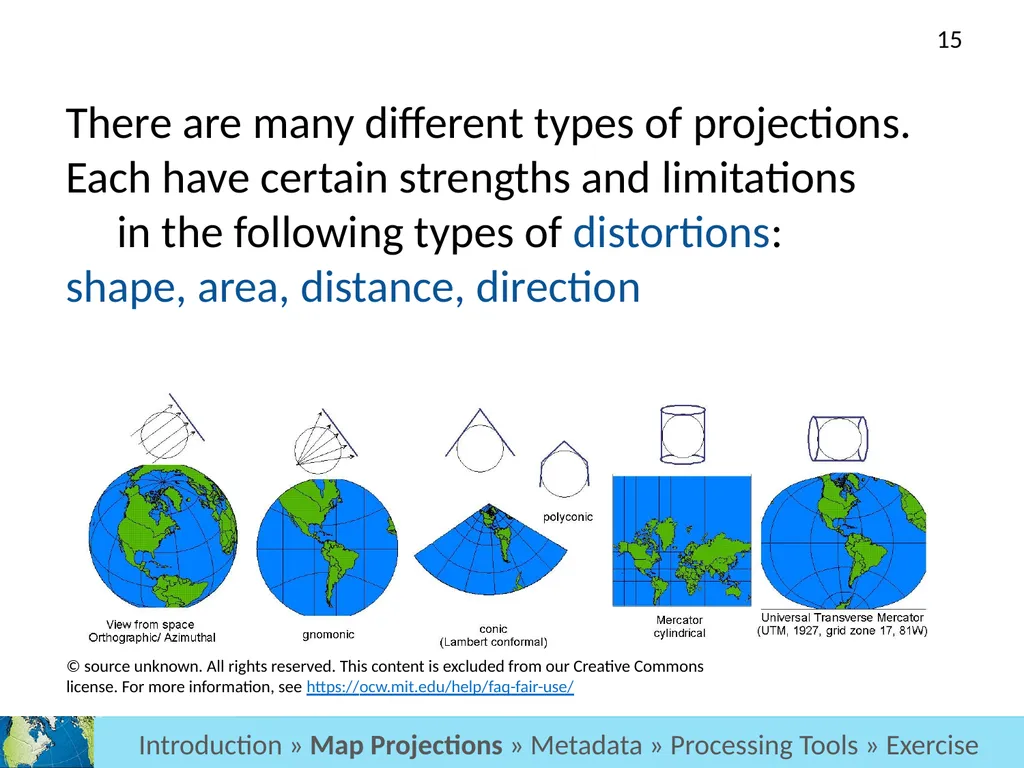
There are many different types of projections. Each have certain strengths and limitations in the following types of distortions: shape, area, distance, direction Analysis >> Projections >> Metadata >> Processing Tools >> Exercise Introduction > Projections > Metadata > Processing Tools > Exercise Introduction » Map Projections » Metadata » Processing Tools » Exercise © source unknown. All rights reserved. This content is excluded from our Creative Commons license. For more information, see https://ocw.mit.edu/help/faq-fair-use/ 15<br>
16
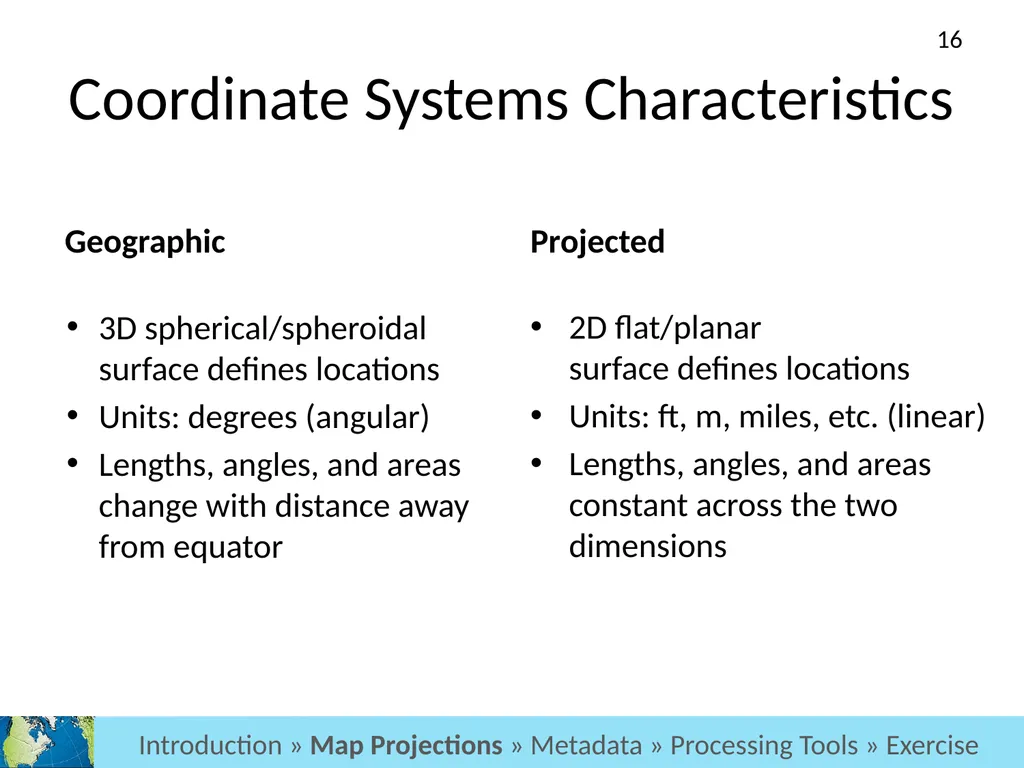
Coordinate Systems Characteristics Geographic 3D spherical/spheroidal surface defines locations
Units: degrees (angular)
Lengths, angles, and areas change with distance away from equator Projected 2D flat/planar surface defines locations
Units: ft, m, miles, etc. (linear)
Lengths, angles, and areas constant across the two dimensions Introduction » Map Projections » Metadata » Processing Tools » Exercise 16<br>
Units: degrees (angular)
Lengths, angles, and areas change with distance away from equator Projected 2D flat/planar surface defines locations
Units: ft, m, miles, etc. (linear)
Lengths, angles, and areas constant across the two dimensions Introduction » Map Projections » Metadata » Processing Tools » Exercise 16<br>
17
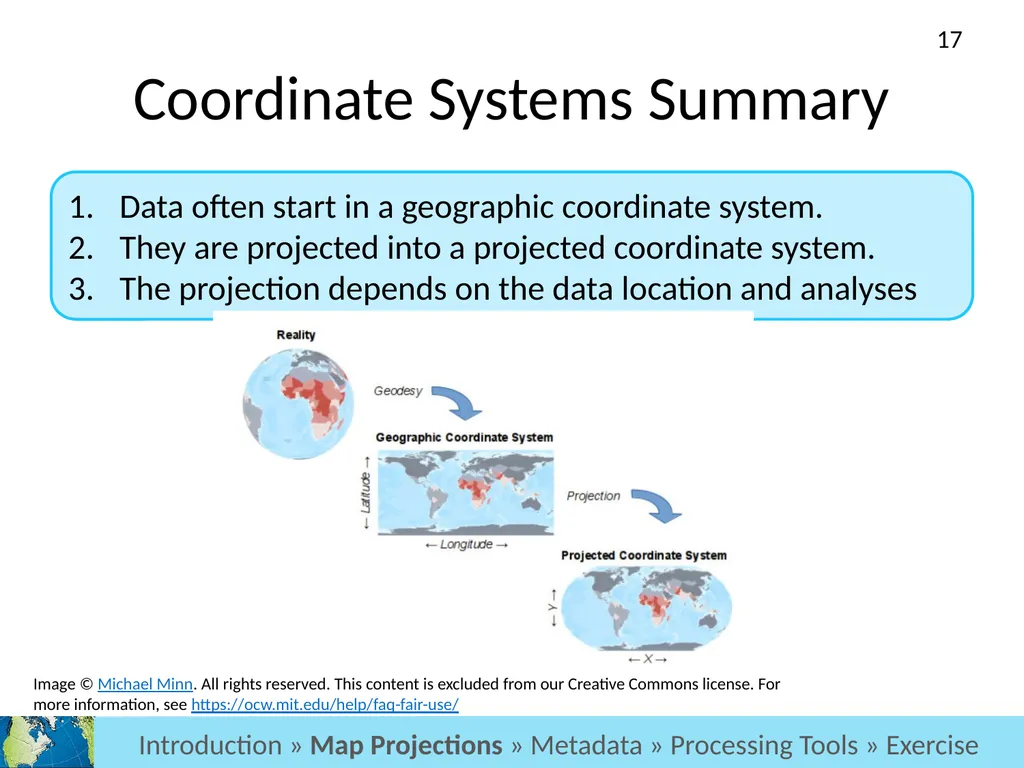
Coordinate Systems Summary Data often start in a geographic coordinate system.
They are projected into a projected coordinate system.
The projection depends on the data location and analyses Introduction » Map Projections » Metadata » Processing Tools » Exercise Image © Michael Minn. All rights reserved. This content is excluded from our Creative Commons license. For more information, see https://ocw.mit.edu/help/faq-fair-use/ 17<br>
They are projected into a projected coordinate system.
The projection depends on the data location and analyses Introduction » Map Projections » Metadata » Processing Tools » Exercise Image © Michael Minn. All rights reserved. This content is excluded from our Creative Commons license. For more information, see https://ocw.mit.edu/help/faq-fair-use/ 17<br>
18
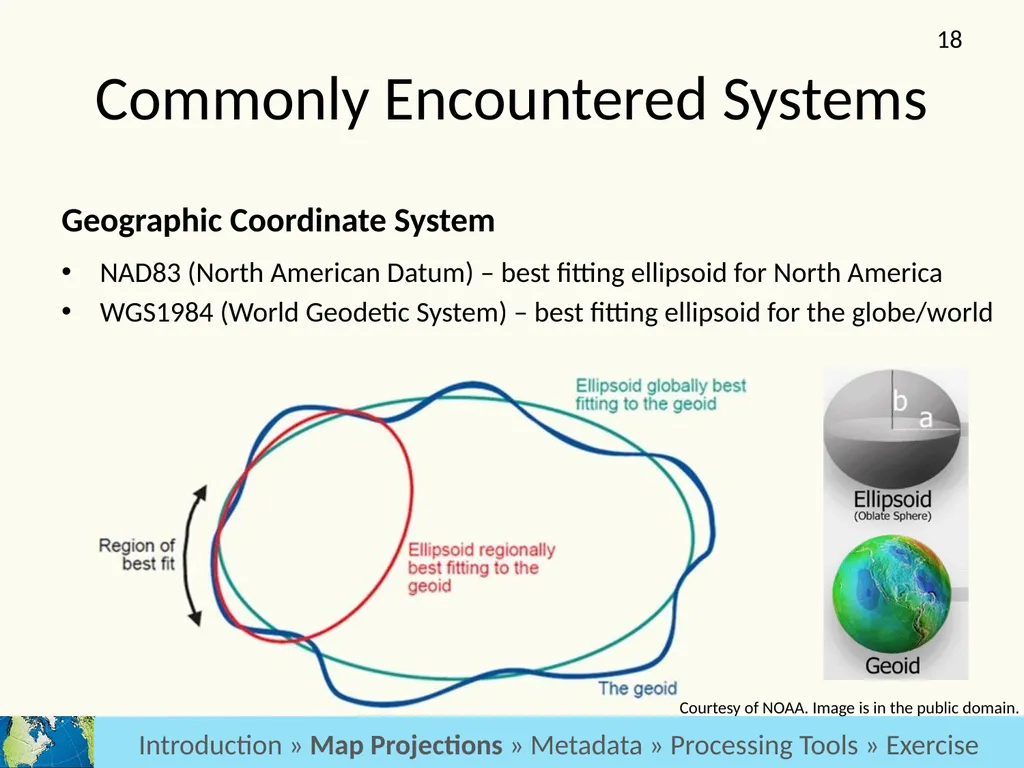
Commonly Encountered Systems NAD83 (North American Datum) – best fitting ellipsoid for North America
WGS1984 (World Geodetic System) – best fitting ellipsoid for the globe/world Geographic Coordinate System Introduction » Map Projections » Metadata » Processing Tools » Exercise Courtesy of NOAA. Image is in the public domain. 18<br>
WGS1984 (World Geodetic System) – best fitting ellipsoid for the globe/world Geographic Coordinate System Introduction » Map Projections » Metadata » Processing Tools » Exercise Courtesy of NOAA. Image is in the public domain. 18<br>
19
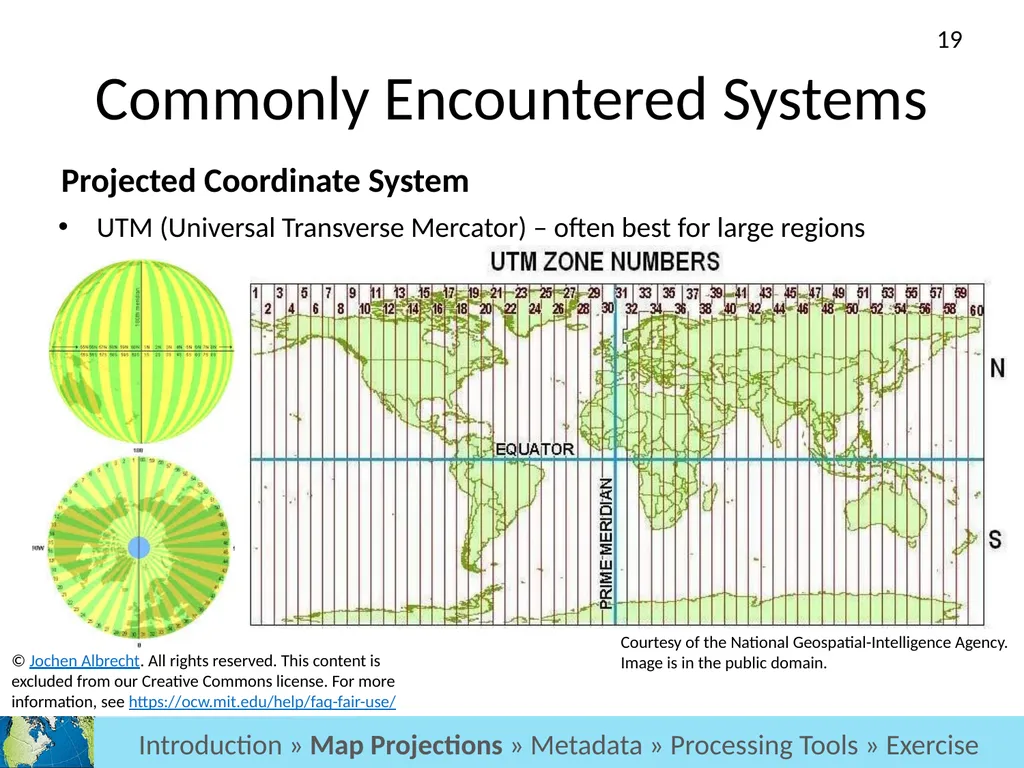
Projected Coordinate System UTM (Universal Transverse Mercator) – often best for large regions Commonly Encountered Systems Introduction » Map Projections » Metadata » Processing Tools » Exercise © Jochen Albrecht. All rights reserved. This content is excluded from our Creative Commons license. For more information, see https://ocw.mit.edu/help/faq-fair-use/ Courtesy of the National Geospatial-Intelligence Agency. Image is in the public domain. 19<br>
20
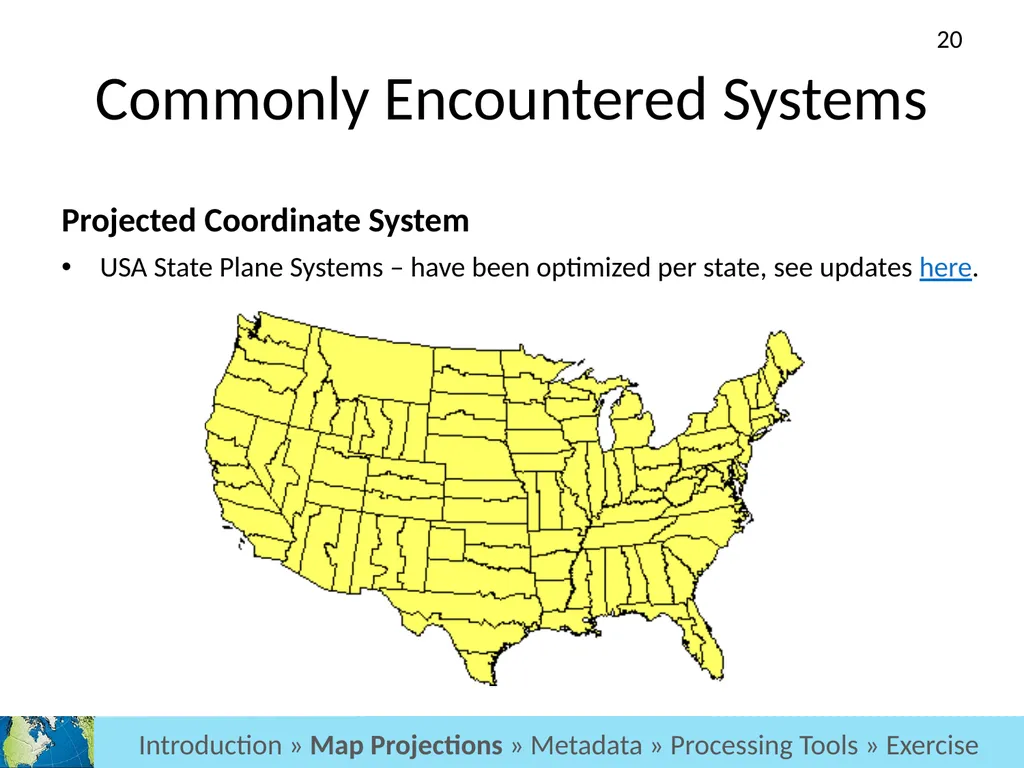
Projected Coordinate System USA State Plane Systems – have been optimized per state, see updates here. Commonly Encountered Systems Introduction » Map Projections » Metadata » Processing Tools » Exercise 20<br>
21
Tips on selecting a
Projected Coordinate System Based on your project’s analyses:
Preserve area with equal-area projections
Preserve shape with conformal projections
Preserve direction with azimuthal projections
Preserve distance with equidistant projections
Other projections compromise on the distortions
(Usually you stick with one, but can re-project) Introduction » Map Projections » Metadata » Processing Tools » Exercise 21<br>
Preserve area with equal-area projections
Preserve shape with conformal projections
Preserve direction with azimuthal projections
Preserve distance with equidistant projections
Other projections compromise on the distortions
(Usually you stick with one, but can re-project) Introduction » Map Projections » Metadata » Processing Tools » Exercise 21<br>
22
Tips on selecting a
Projected Coordinate System Based on your project’s location:
Size
Locally, the US has ‘state plane systems’
Regionally, UTM is often a good option
World, World Mercator (EPSG: 3857)
Region
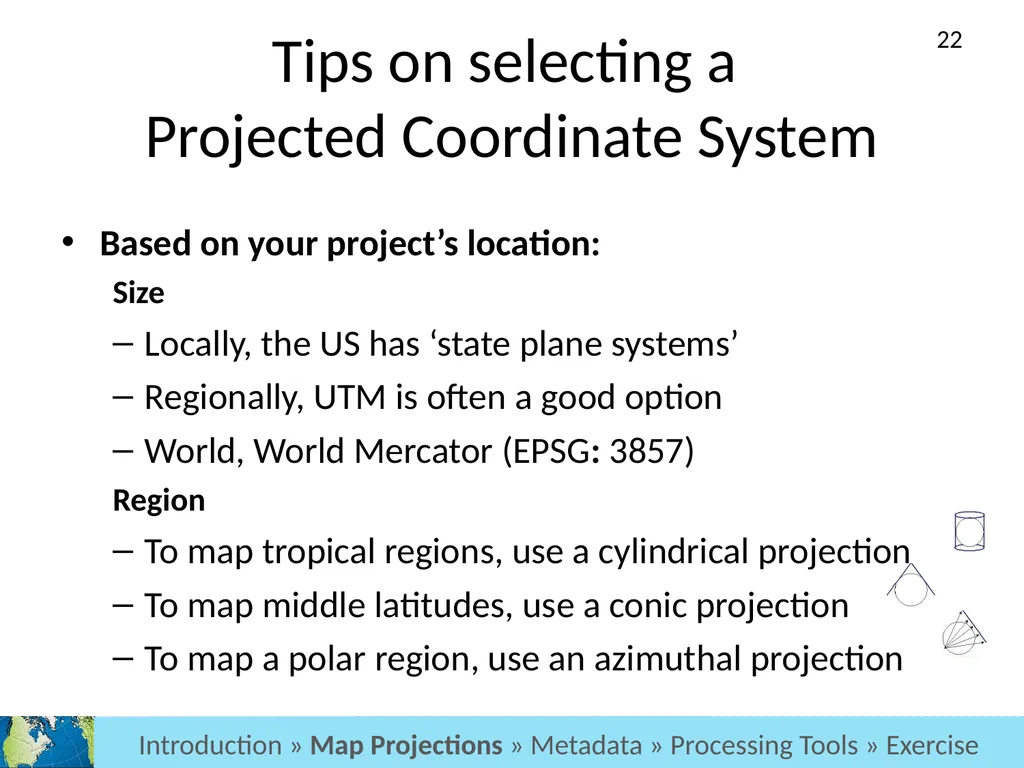
To map tropical regions, use a cylindrical projection
To map middle latitudes, use a conic projection
To map a polar region, use an azimuthal projection Introduction » Map Projections » Metadata » Processing Tools » Exercise 22<br>
Size
Locally, the US has ‘state plane systems’
Regionally, UTM is often a good option
World, World Mercator (EPSG: 3857)
Region
To map tropical regions, use a cylindrical projection
To map middle latitudes, use a conic projection
To map a polar region, use an azimuthal projection Introduction » Map Projections » Metadata » Processing Tools » Exercise 22<br>
23
MAP Projections:
How do you know the Coordinate system of your data? Analysis >> Projections >> Metadata >> Processing Tools >> Exercise Introduction > Projections > Metadata > Processing Tools > Exercise Introduction » Map Projections » Metadata » Processing Tools » Exercise 23<br>
24
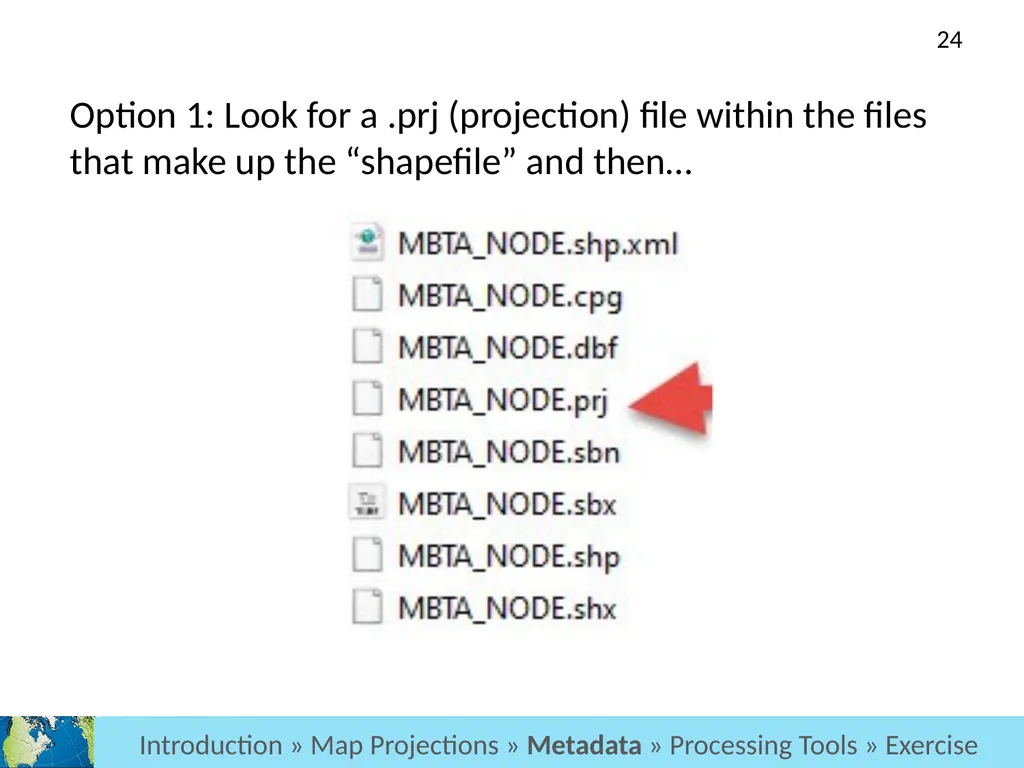
Option 1: Look for a .prj (projection) file within the files that make up the “shapefile” and then… Analysis >> Projections >> Metadata >> Processing Tools >> Exercise Introduction > Projections > Metadata > Processing Tools > Exercise Introduction » Map Projections » Metadata » Processing Tools » Exercise 24<br>
25
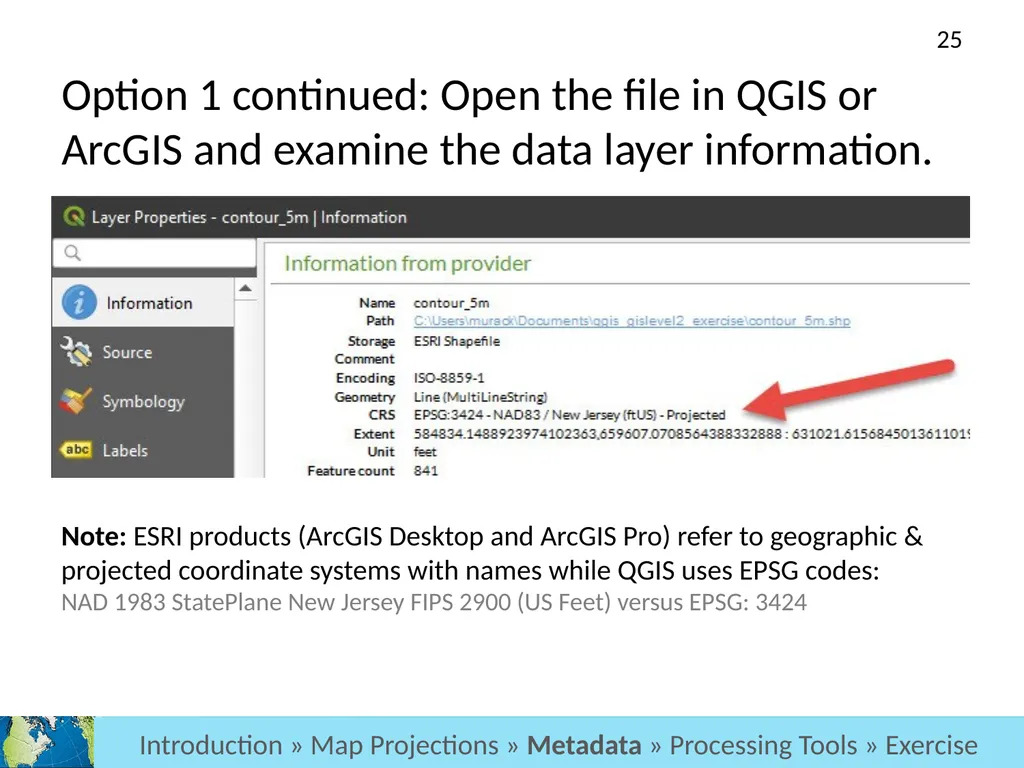
Option 1 continued: Open the file in QGIS or ArcGIS and examine the data layer information. Analysis >> Projections >> Metadata >> Processing Tools >> Exercise Introduction > Projections > Metadata > Processing Tools > Exercise Note: ESRI products (ArcGIS Desktop and ArcGIS Pro) refer to geographic & projected coordinate systems with names while QGIS uses EPSG codes: NAD 1983 StatePlane New Jersey FIPS 2900 (US Feet) versus EPSG: 3424 Introduction » Map Projections » Metadata » Processing Tools » Exercise 25<br>
26
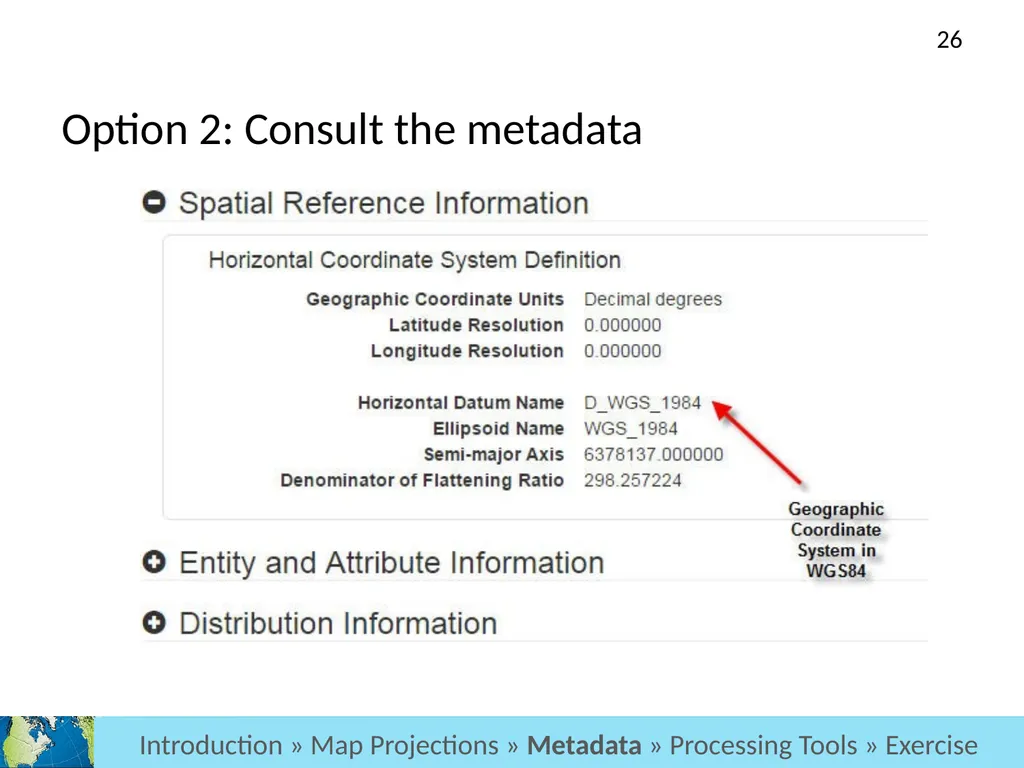
Option 2: Consult the metadata Analysis >> Projections >> Metadata >> Processing Tools >> Exercise Introduction > Projections > Metadata > Processing Tools > Exercise Introduction » Map Projections » Metadata » Processing Tools » Exercise 26<br>
27
Exercise 1: Coordinate Systems Goals
Learn how to transform a coordinate system in GIS software
Steps
Open either the QGIS or ArcGIS Pro.
You will now choose a breakout rooms and be guided through the first exercise. Introduction » Map Projections » Metadata » Processing Tools » Exercise 27<br>
Learn how to transform a coordinate system in GIS software
Steps
Open either the QGIS or ArcGIS Pro.
You will now choose a breakout rooms and be guided through the first exercise. Introduction » Map Projections » Metadata » Processing Tools » Exercise 27<br>
28
Processing Tools: OVERVIEW Analysis >> Projections >> Metadata >> Processing Tools >> Exercise Introduction > Projections > Metadata > Processing Tools > Exercise Introduction » Map Projections » Metadata » Processing Tools » Exercise 28<br>
29
Use processing tools to: “capture, store, check, integrate, manipulate, analyze and display
geospatial data” Introduction » Maps & Data » Making Maps » Software » Exercise Introduction > Projections > Metadata > Processing Tools > Exercise Introduction » Map Projections » Metadata » Processing Tools » Exercise 29<br>
geospatial data” Introduction » Maps & Data » Making Maps » Software » Exercise Introduction > Projections > Metadata > Processing Tools > Exercise Introduction » Map Projections » Metadata » Processing Tools » Exercise 29<br>
30
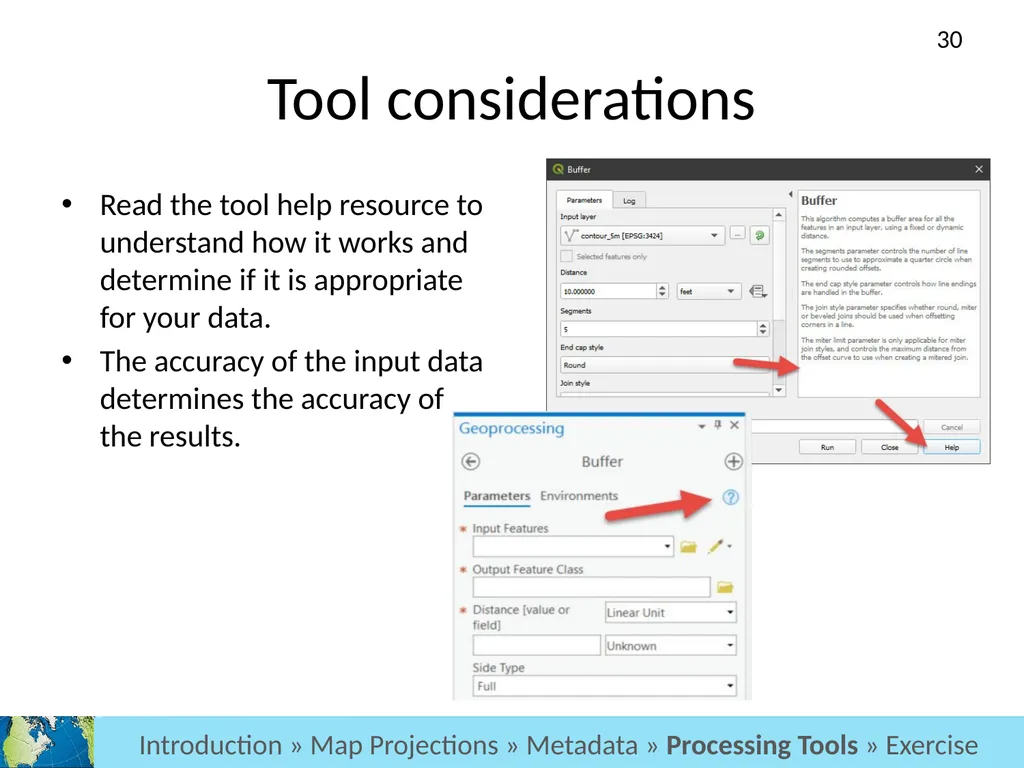
Tool considerations Read the tool help resource to understand how it works and determine if it is appropriate for your data.
The accuracy of the input data determines the accuracy of the results. Analysis >> Projections >> Metadata >> Processing Tools >> Exercise Introduction > Projections > Metadata > Processing Tools > Exercise Introduction » Map Projections » Metadata » Processing Tools » Exercise 30<br>
The accuracy of the input data determines the accuracy of the results. Analysis >> Projections >> Metadata >> Processing Tools >> Exercise Introduction > Projections > Metadata > Processing Tools > Exercise Introduction » Map Projections » Metadata » Processing Tools » Exercise 30<br>
31
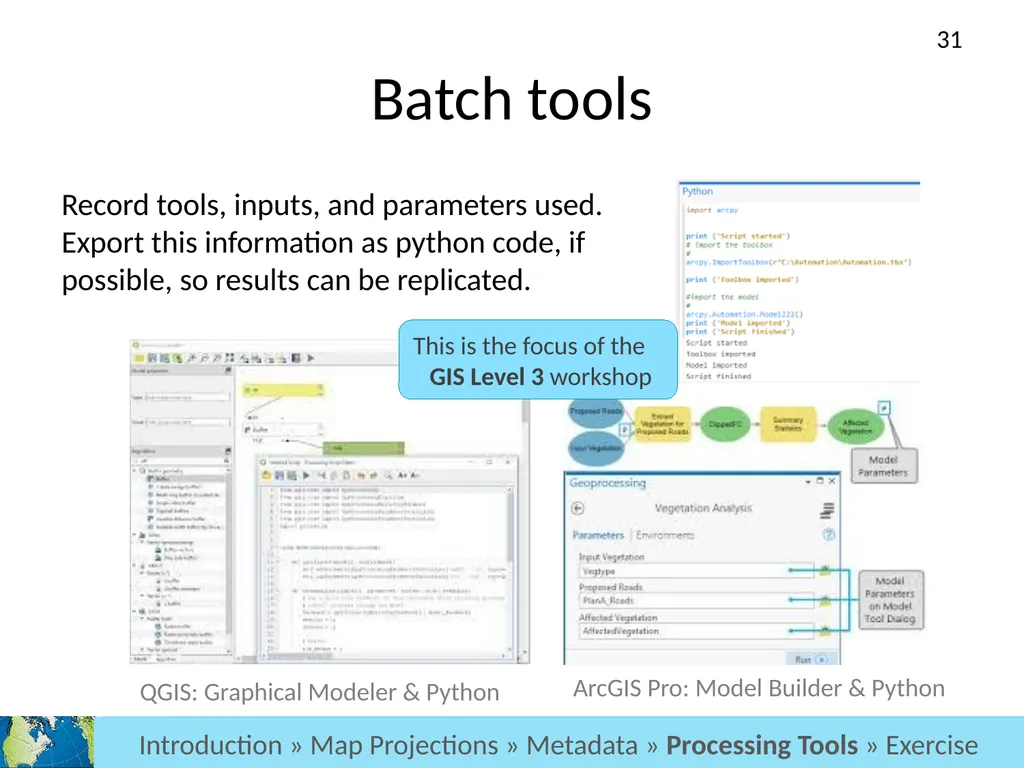
Batch tools Record tools, inputs, and parameters used. Export this information as python code, if possible, so results can be replicated. Analysis >> Projections >> Metadata >> Processing Tools >> Exercise Introduction > Projections > Metadata > Processing Tools > Exercise Introduction » Map Projections » Metadata » Processing Tools » Exercise This is the focus of the GIS Level 3 workshop QGIS: Graphical Modeler & Python ArcGIS Pro: Model Builder & Python 31<br>
32
Processing Tools: arCGIS Pro vS QGIS Analysis >> Projections >> Metadata >> Processing Tools >> Exercise Introduction > Projections > Metadata > Processing Tools > Exercise Introduction » Map Projections » Metadata » Processing Tools » Exercise 32<br>
33
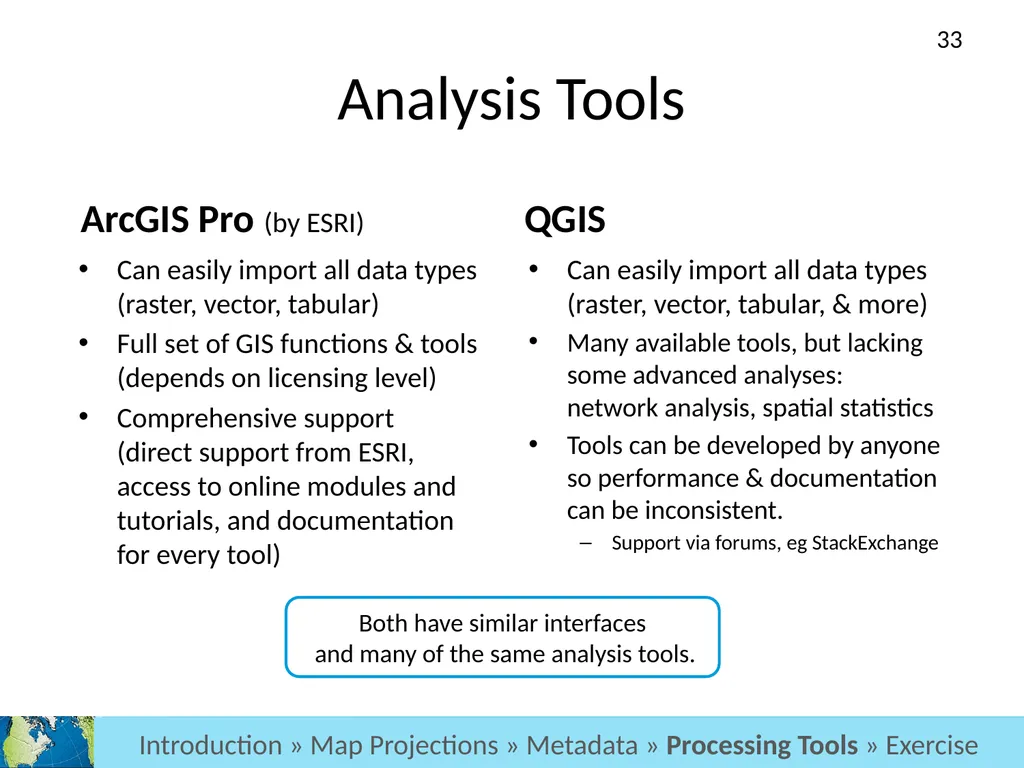
Analysis Tools ArcGIS Pro (by ESRI) QGIS Can easily import all data types (raster, vector, tabular, & more)
Many available tools, but lacking some advanced analyses: network analysis, spatial statistics
Tools can be developed by anyone so performance & documentation can be inconsistent.
Support via forums, eg StackExchange Both have similar interfaces
and many of the same analysis tools. Can easily import all data types (raster, vector, tabular)
Full set of GIS functions & tools (depends on licensing level)
Comprehensive support (direct support from ESRI, access to online modules and tutorials, and documentation for every tool) Introduction > Projections > Metadata > Processing Tools > Exercise Introduction » Map Projections » Metadata » Processing Tools » Exercise 33<br>
Many available tools, but lacking some advanced analyses: network analysis, spatial statistics
Tools can be developed by anyone so performance & documentation can be inconsistent.
Support via forums, eg StackExchange Both have similar interfaces
and many of the same analysis tools. Can easily import all data types (raster, vector, tabular)
Full set of GIS functions & tools (depends on licensing level)
Comprehensive support (direct support from ESRI, access to online modules and tutorials, and documentation for every tool) Introduction > Projections > Metadata > Processing Tools > Exercise Introduction » Map Projections » Metadata » Processing Tools » Exercise 33<br>
34
Processing Tools: arCGIS PRO Analysis >> Projections >> Metadata >> Processing Tools >> Exercise Introduction > Projections > Metadata > Processing Tools > Exercise Introduction » Map Projections » Metadata » Processing Tools » Exercise 34<br>
35
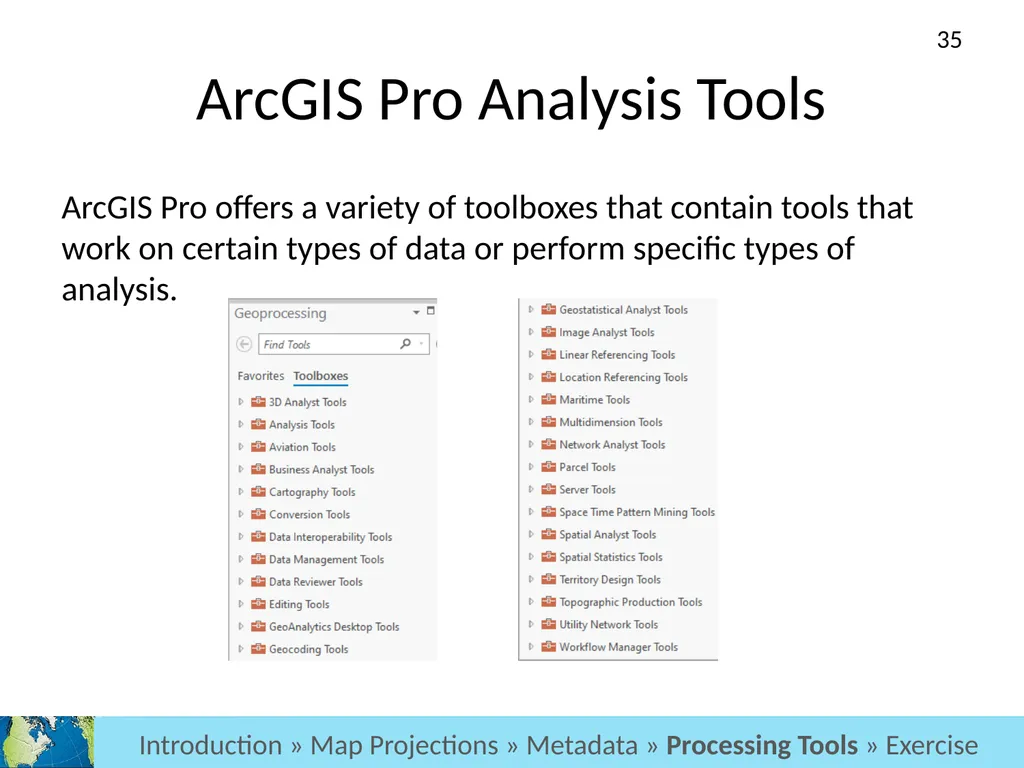
ArcGIS Pro Analysis Tools ArcGIS Pro offers a variety of toolboxes that contain tools that work on certain types of data or perform specific types of analysis. Analysis >> Projections >> Metadata >> Processing Tools >> Exercise Introduction > Projections > Metadata > Processing Tools > Exercise Introduction » Map Projections » Metadata » Processing Tools » Exercise 35<br>
36
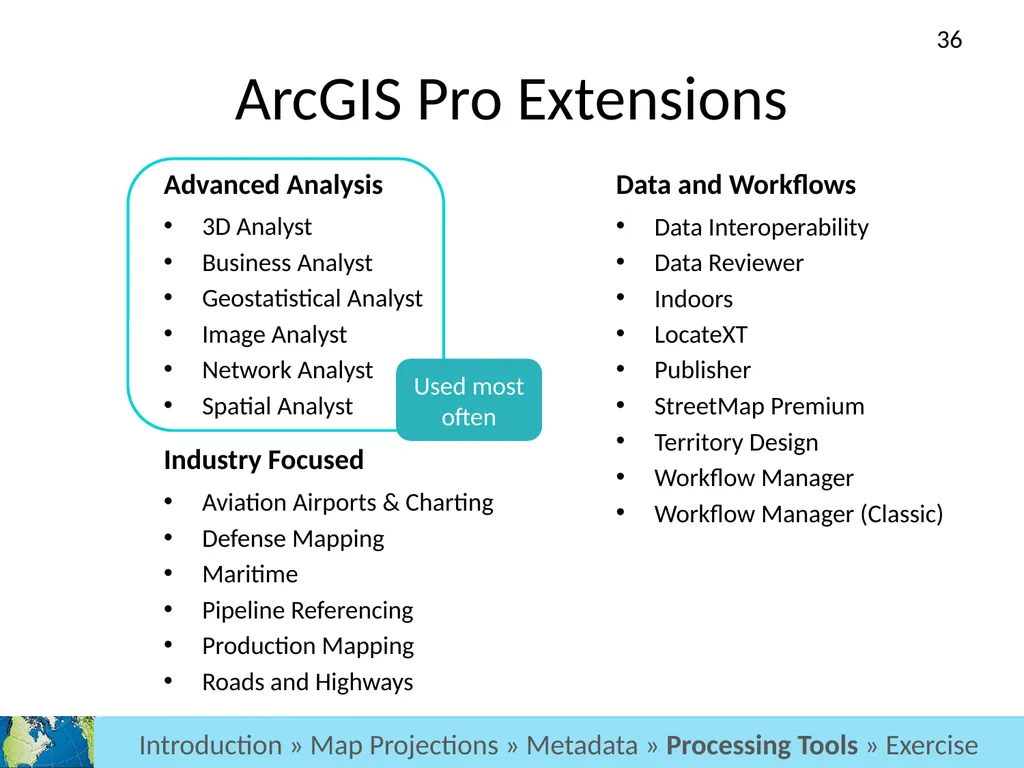
ArcGIS Pro Extensions Advanced Analysis 3D Analyst
Business Analyst
Geostatistical Analyst
Image Analyst
Network Analyst
Spatial Analyst Analysis >> Projections >> Metadata >> Processing Tools >> Exercise Introduction > Projections > Metadata > Processing Tools > Exercise Industry Focused Aviation Airports & Charting
Defense Mapping
Maritime
Pipeline Referencing
Production Mapping
Roads and Highways Data and Workflows Data Interoperability
Data Reviewer
Indoors
LocateXT
Publisher
StreetMap Premium
Territory Design
Workflow Manager
Workflow Manager (Classic) Used most often Introduction » Map Projections » Metadata » Processing Tools » Exercise 36<br>
Business Analyst
Geostatistical Analyst
Image Analyst
Network Analyst
Spatial Analyst Analysis >> Projections >> Metadata >> Processing Tools >> Exercise Introduction > Projections > Metadata > Processing Tools > Exercise Industry Focused Aviation Airports & Charting
Defense Mapping
Maritime
Pipeline Referencing
Production Mapping
Roads and Highways Data and Workflows Data Interoperability
Data Reviewer
Indoors
LocateXT
Publisher
StreetMap Premium
Territory Design
Workflow Manager
Workflow Manager (Classic) Used most often Introduction » Map Projections » Metadata » Processing Tools » Exercise 36<br>
37
Processing Tools: QGIS Analysis >> Projections >> Metadata >> Processing Tools >> Exercise Introduction > Projections > Metadata > Processing Tools > Exercise Introduction » Map Projections » Metadata » Processing Tools » Exercise 37<br>
38
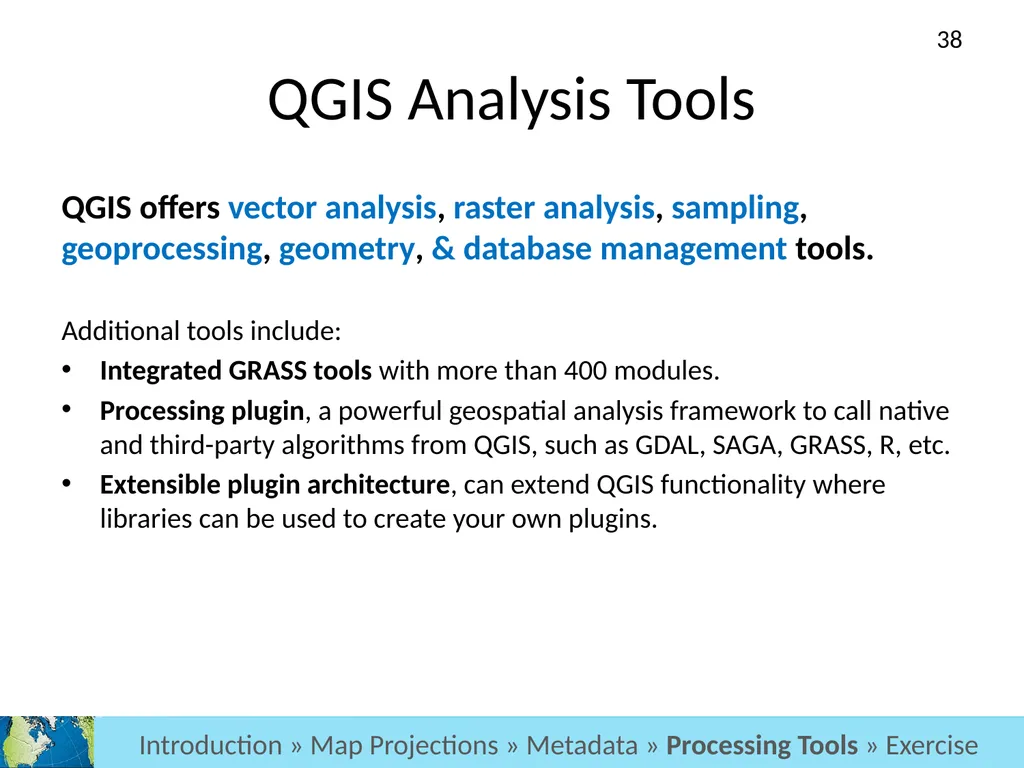
QGIS Analysis Tools QGIS offers vector analysis, raster analysis, sampling, geoprocessing, geometry, & database management tools.
Additional tools include:
Integrated GRASS tools with more than 400 modules.
Processing plugin, a powerful geospatial analysis framework to call native and third-party algorithms from QGIS, such as GDAL, SAGA, GRASS, R, etc.
Extensible plugin architecture, can extend QGIS functionality where libraries can be used to create your own plugins. Analysis >> Projections >> Metadata >> Processing Tools >> Exercise Introduction > Projections > Metadata > Processing Tools > Exercise Introduction » Map Projections » Metadata » Processing Tools » Exercise 38<br>
Additional tools include:
Integrated GRASS tools with more than 400 modules.
Processing plugin, a powerful geospatial analysis framework to call native and third-party algorithms from QGIS, such as GDAL, SAGA, GRASS, R, etc.
Extensible plugin architecture, can extend QGIS functionality where libraries can be used to create your own plugins. Analysis >> Projections >> Metadata >> Processing Tools >> Exercise Introduction > Projections > Metadata > Processing Tools > Exercise Introduction » Map Projections » Metadata » Processing Tools » Exercise 38<br>
39
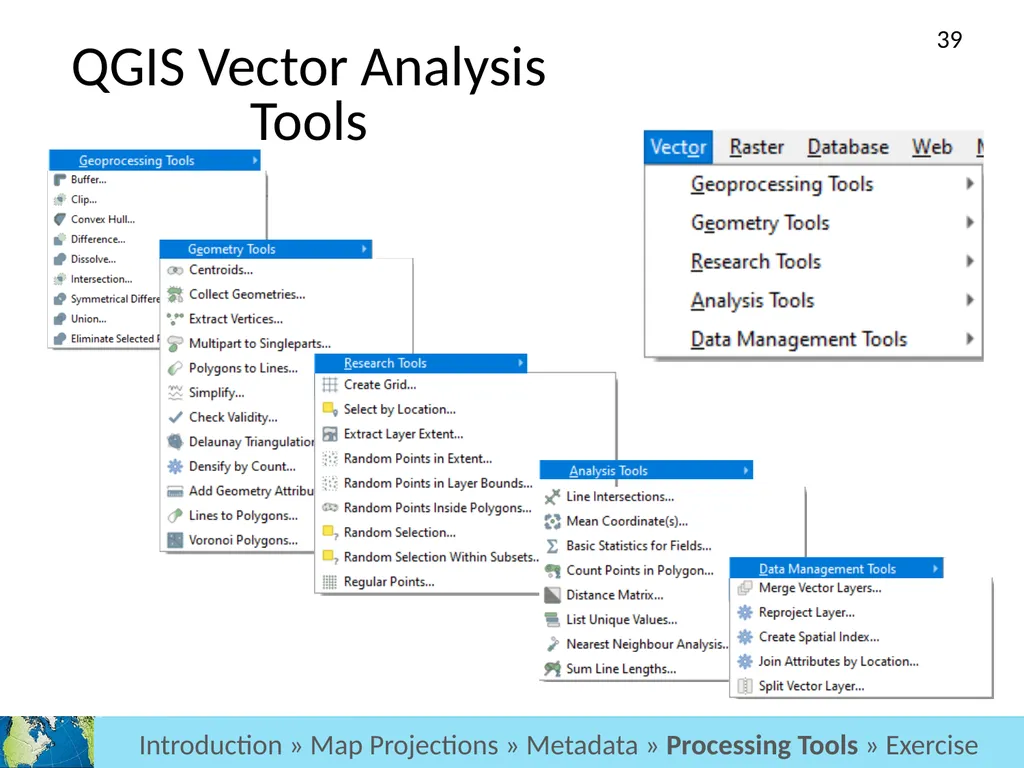
Analysis >> Projections >> Metadata >> Processing Tools >> Exercise Introduction > Projections > Metadata > Processing Tools > Exercise QGIS Vector Analysis Tools Introduction » Map Projections » Metadata » Processing Tools » Exercise 39<br>
40
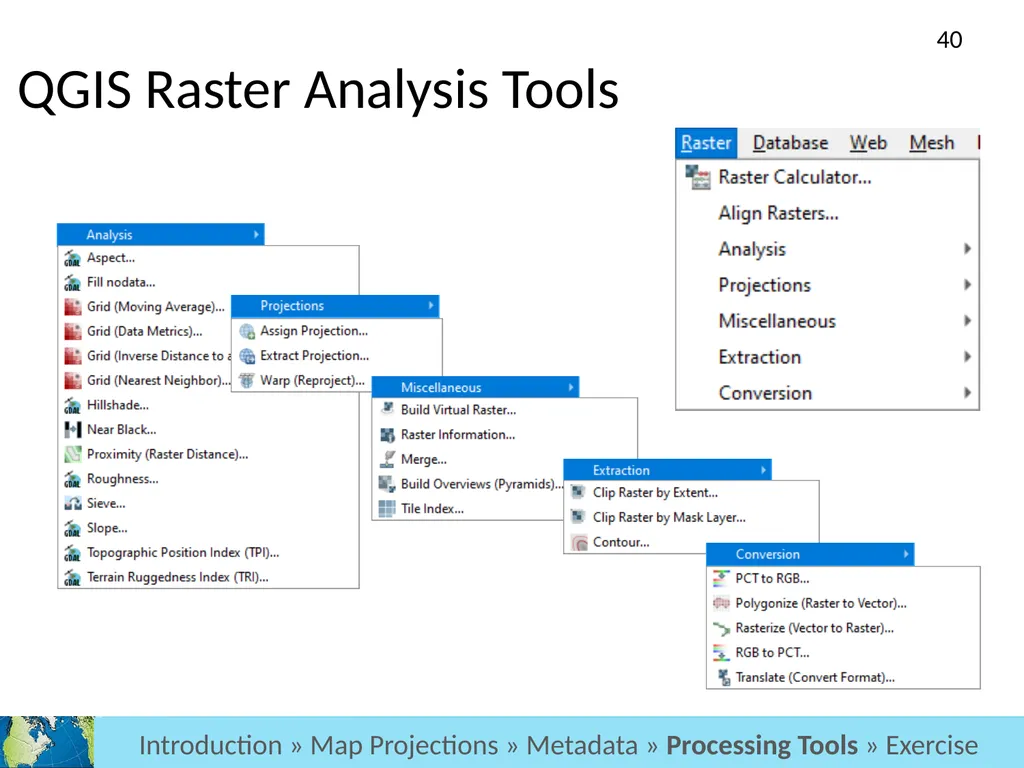
Analysis >> Projections >> Metadata >> Processing Tools >> Exercise Introduction > Projections > Metadata > Processing Tools > Exercise QGIS Raster Analysis Tools Introduction » Map Projections » Metadata » Processing Tools » Exercise 40<br>
41
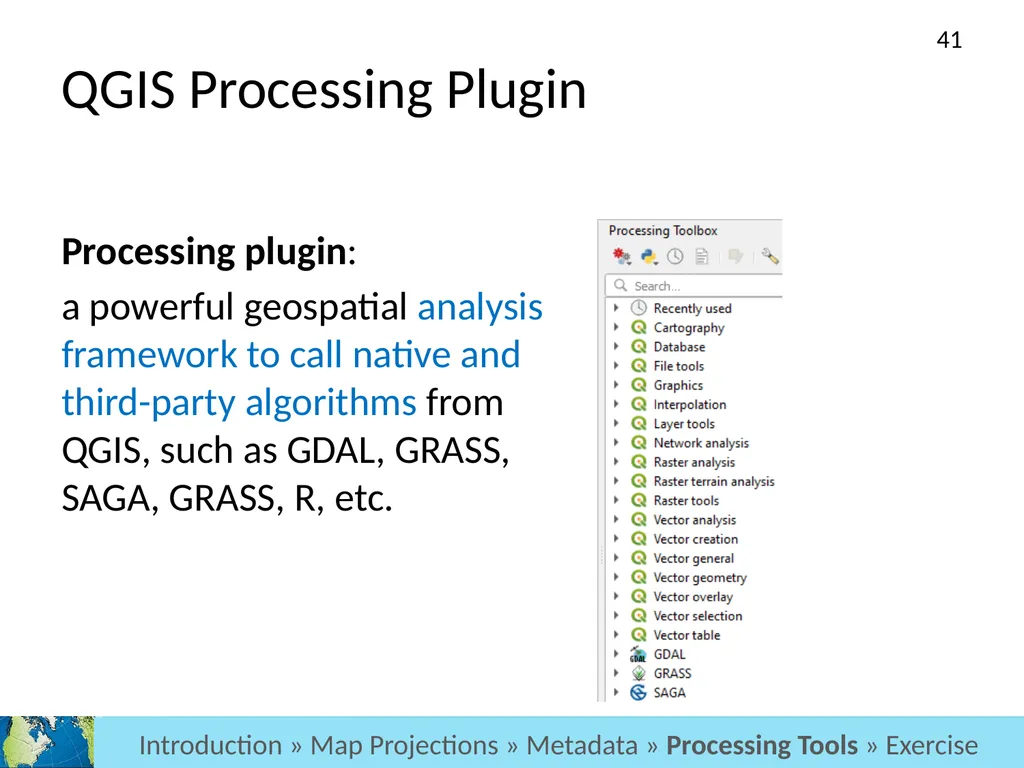
Processing plugin:
a powerful geospatial analysis framework to call native and third-party algorithms from QGIS, such as GDAL, GRASS, SAGA, GRASS, R, etc. Analysis >> Projections >> Metadata >> Processing Tools >> Exercise Introduction > Projections > Metadata > Processing Tools > Exercise QGIS Processing Plugin Introduction » Map Projections » Metadata » Processing Tools » Exercise 41<br>
a powerful geospatial analysis framework to call native and third-party algorithms from QGIS, such as GDAL, GRASS, SAGA, GRASS, R, etc. Analysis >> Projections >> Metadata >> Processing Tools >> Exercise Introduction > Projections > Metadata > Processing Tools > Exercise QGIS Processing Plugin Introduction » Map Projections » Metadata » Processing Tools » Exercise 41<br>
42
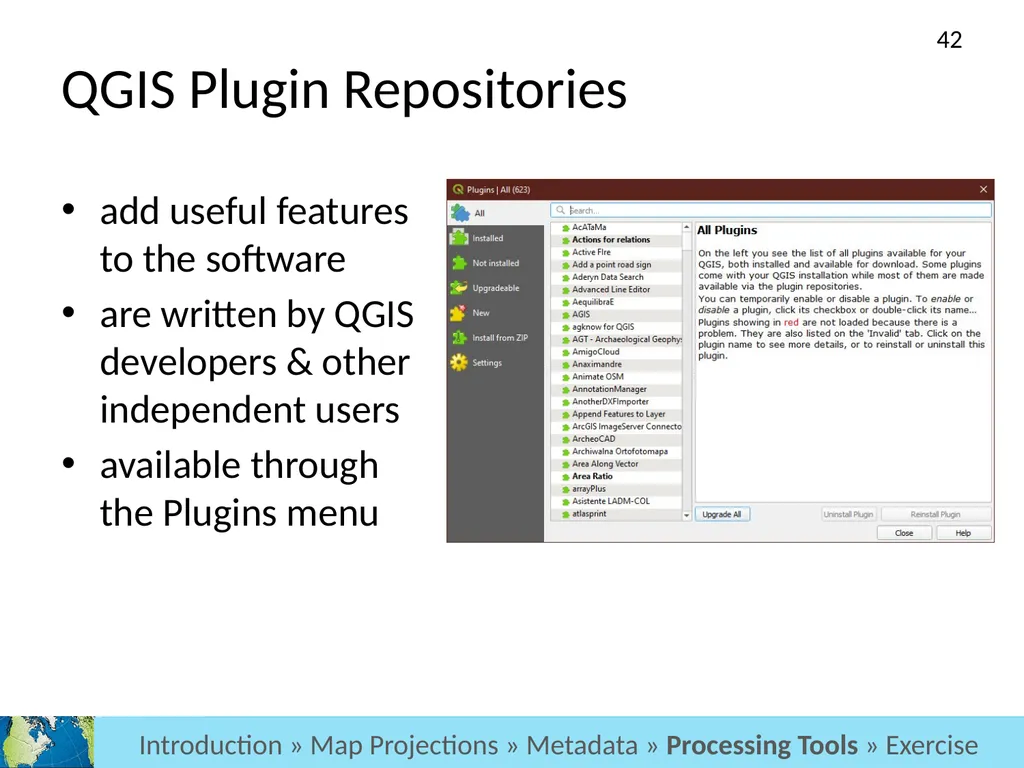
add useful features to the software
are written by QGIS developers & other independent users
available through the Plugins menu Analysis >> Projections >> Metadata >> Processing Tools >> Exercise Introduction > Projections > Metadata > Processing Tools > Exercise QGIS Plugin Repositories Introduction » Map Projections » Metadata » Processing Tools » Exercise 42<br>
are written by QGIS developers & other independent users
available through the Plugins menu Analysis >> Projections >> Metadata >> Processing Tools >> Exercise Introduction > Projections > Metadata > Processing Tools > Exercise QGIS Plugin Repositories Introduction » Map Projections » Metadata » Processing Tools » Exercise 42<br>
43
Vector Analysis Analysis >> Projections >> Metadata >> Processing Tools >> Exercise Introduction > Projections > Metadata > Processing Tools > Exercise Introduction » Map Projections » Metadata » Processing Tools » Exercise 43<br>
44
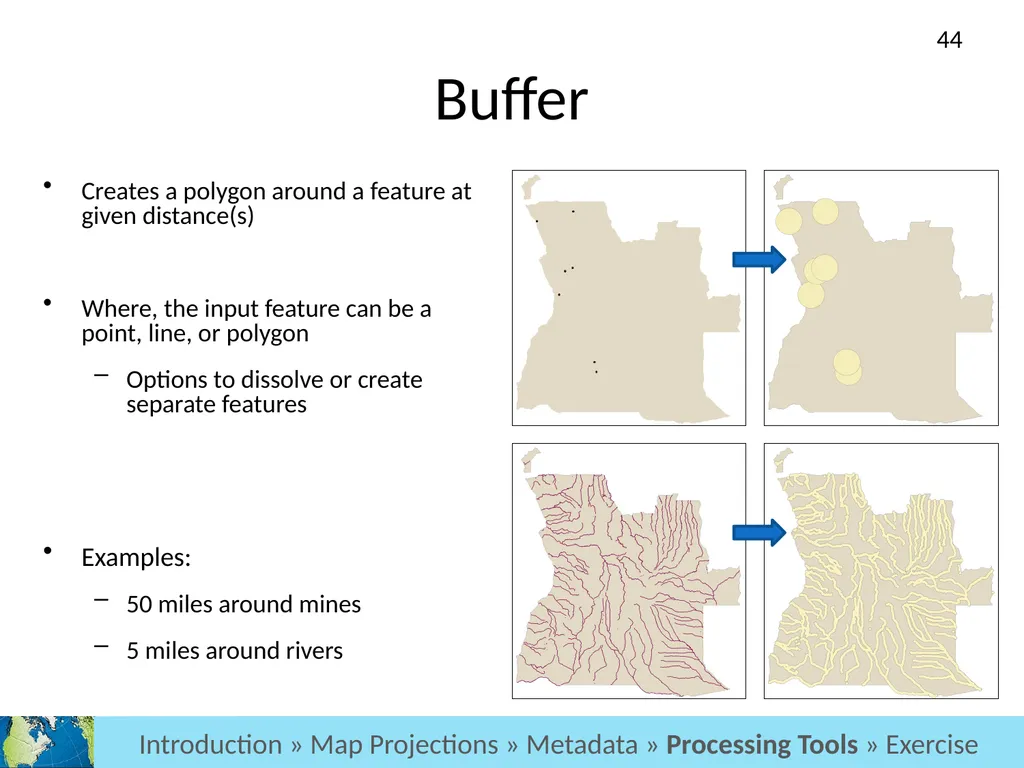
Buffer Creates a polygon around a feature at given distance(s)
Where, the input feature can be a point, line, or polygon
Options to dissolve or create separate features
Examples:
50 miles around mines
5 miles around rivers Analysis >> Projections >> Metadata >> Processing Tools >> Exercise Introduction > Projections > Metadata > Processing Tools > Exercise Introduction » Map Projections » Metadata » Processing Tools » Exercise 44<br>
Where, the input feature can be a point, line, or polygon
Options to dissolve or create separate features
Examples:
50 miles around mines
5 miles around rivers Analysis >> Projections >> Metadata >> Processing Tools >> Exercise Introduction > Projections > Metadata > Processing Tools > Exercise Introduction » Map Projections » Metadata » Processing Tools » Exercise 44<br>
45
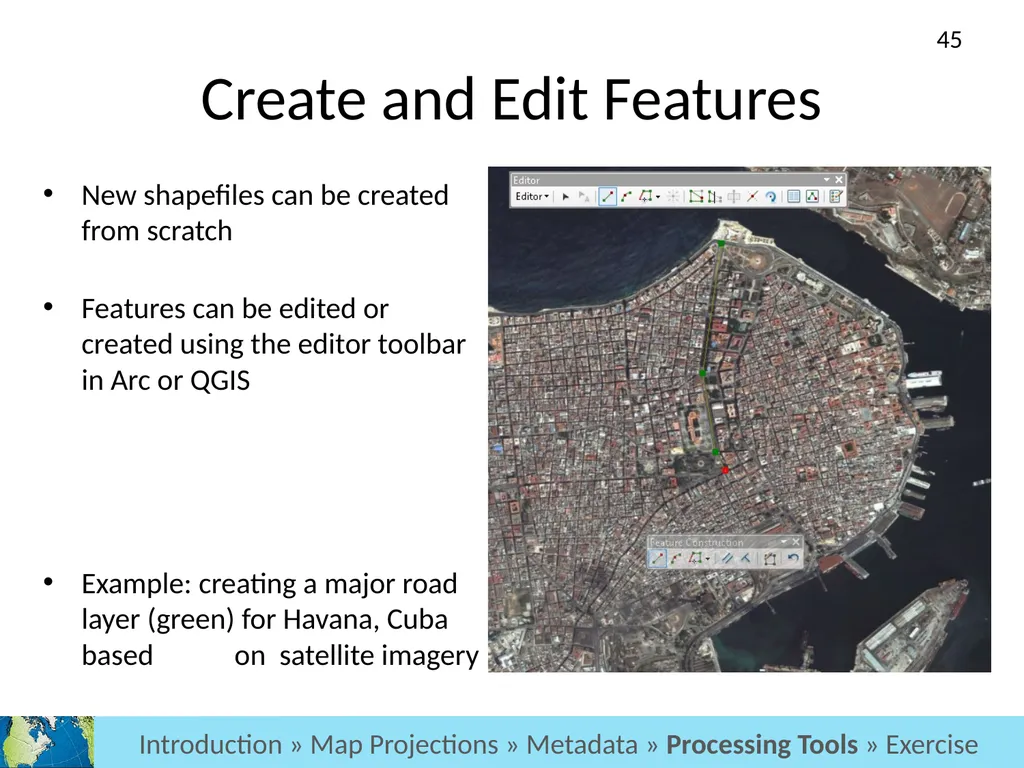
Create and Edit Features New shapefiles can be created from scratch
Features can be edited or created using the editor toolbar in Arc or QGIS
Example: creating a major road layer (green) for Havana, Cuba based on satellite imagery Analysis >> Projections >> Metadata >> Processing Tools >> Exercise Introduction > Projections > Metadata > Processing Tools > Exercise Introduction » Map Projections » Metadata » Processing Tools » Exercise 45<br>
Features can be edited or created using the editor toolbar in Arc or QGIS
Example: creating a major road layer (green) for Havana, Cuba based on satellite imagery Analysis >> Projections >> Metadata >> Processing Tools >> Exercise Introduction > Projections > Metadata > Processing Tools > Exercise Introduction » Map Projections » Metadata » Processing Tools » Exercise 45<br>
46
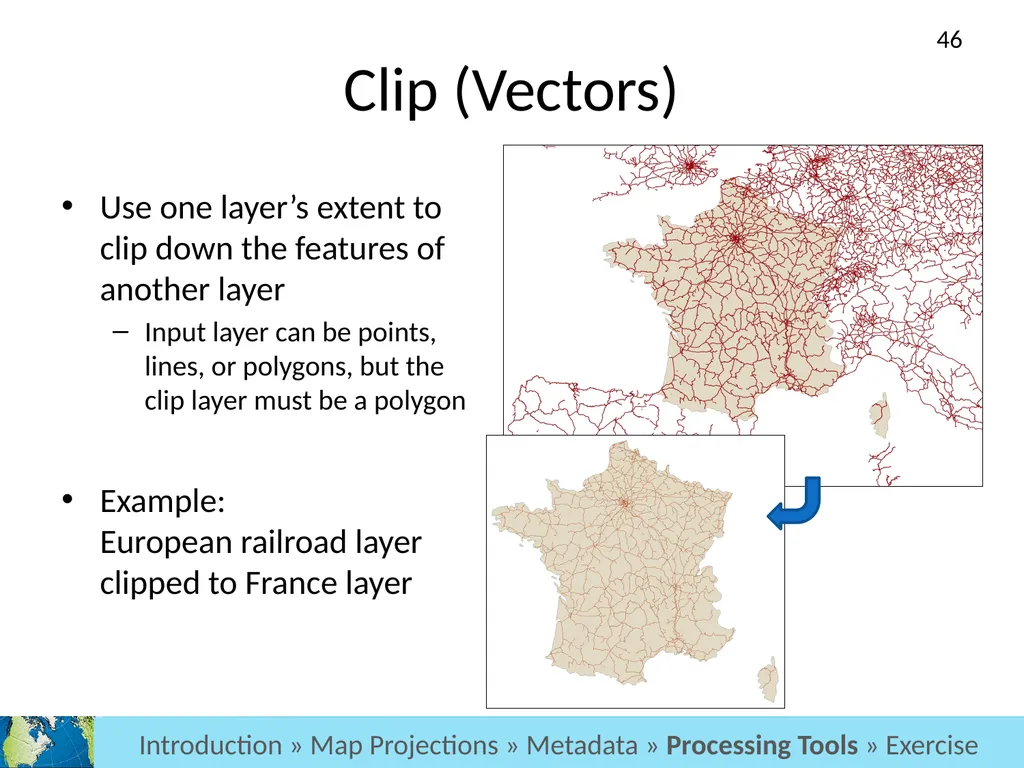
Clip (Vectors) Use one layer’s extent to clip down the features of another layer
Input layer can be points, lines, or polygons, but the clip layer must be a polygon
Example: European railroad layer clipped to France layer Analysis >> Projections >> Metadata >> Processing Tools >> Automation >> Exercise Introduction > Projections > Metadata > Processing Tools > Exercise Introduction » Map Projections » Metadata » Processing Tools » Exercise 46<br>
Input layer can be points, lines, or polygons, but the clip layer must be a polygon
Example: European railroad layer clipped to France layer Analysis >> Projections >> Metadata >> Processing Tools >> Automation >> Exercise Introduction > Projections > Metadata > Processing Tools > Exercise Introduction » Map Projections » Metadata » Processing Tools » Exercise 46<br>
47
Exercise 2: Vector Analysis Goals
Learn how to access, interpret, and troubleshoot analysis tools in GIS software
Steps
You will go back into your breakout room and be guided through the second exercise. Introduction > Projections > Metadata > Processing Tools > Exercise Introduction » Map Projections » Metadata » Processing Tools » Exercise 47<br>
Learn how to access, interpret, and troubleshoot analysis tools in GIS software
Steps
You will go back into your breakout room and be guided through the second exercise. Introduction > Projections > Metadata > Processing Tools > Exercise Introduction » Map Projections » Metadata » Processing Tools » Exercise 47<br>
48
Surface Analysis Analysis >> Projections >> Metadata >> Processing Tools >> Exercise Introduction > Projections > Metadata > Processing Tools > Exercise 48<br>
49
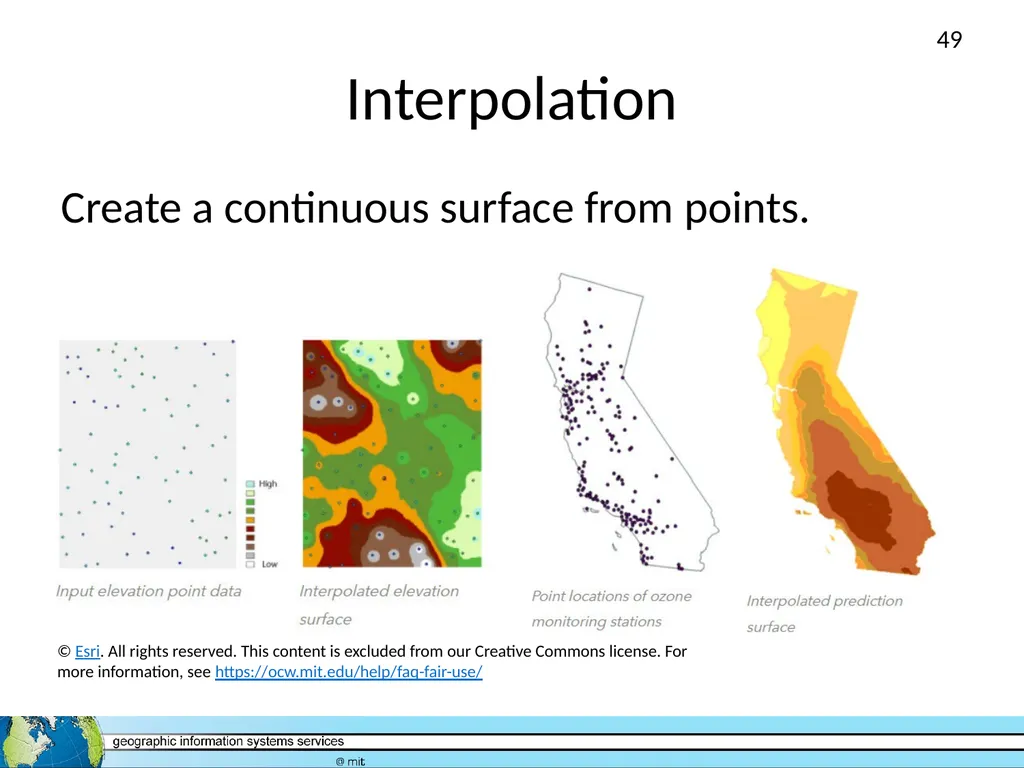
Interpolation Create a continuous surface from points. © Esri. All rights reserved. This content is excluded from our Creative Commons license. For more information, see https://ocw.mit.edu/help/faq-fair-use/ 49<br>
50
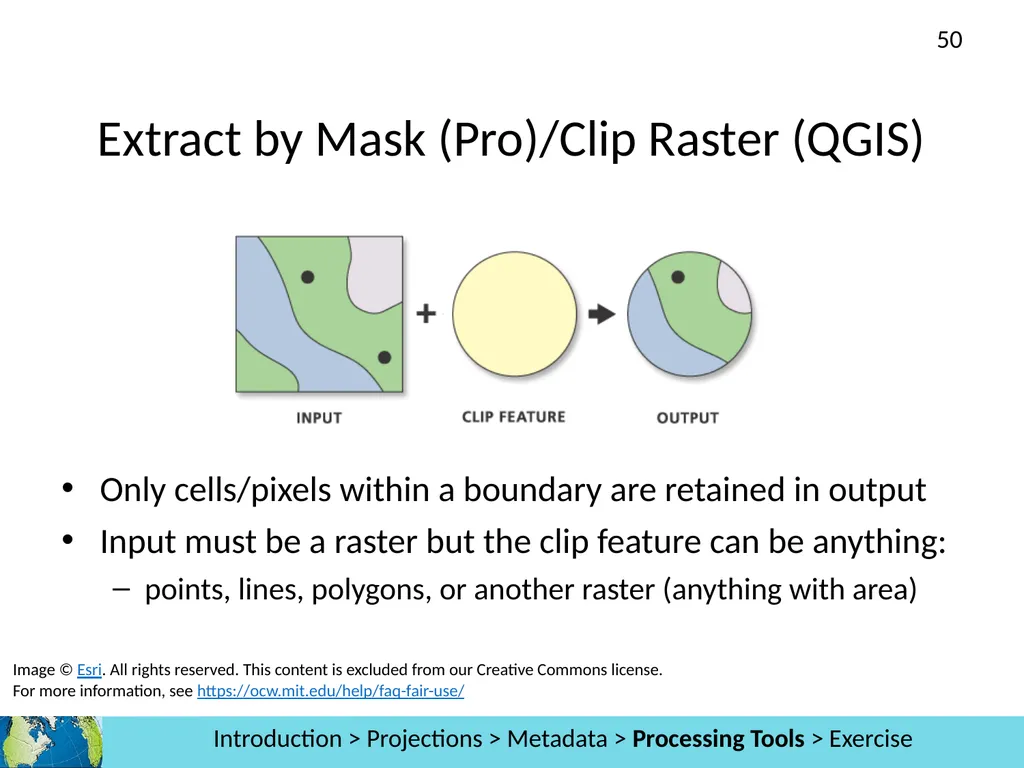
Extract by Mask (Pro)/Clip Raster (QGIS) Only cells/pixels within a boundary are retained in output
Input must be a raster but the clip feature can be anything:
points, lines, polygons, or another raster (anything with area) Introduction > Projections > Metadata > Processing Tools > Exercise Image © Esri. All rights reserved. This content is excluded from our Creative Commons license. For more information, see https://ocw.mit.edu/help/faq-fair-use/ 50<br>
Input must be a raster but the clip feature can be anything:
points, lines, polygons, or another raster (anything with area) Introduction > Projections > Metadata > Processing Tools > Exercise Image © Esri. All rights reserved. This content is excluded from our Creative Commons license. For more information, see https://ocw.mit.edu/help/faq-fair-use/ 50<br>
51
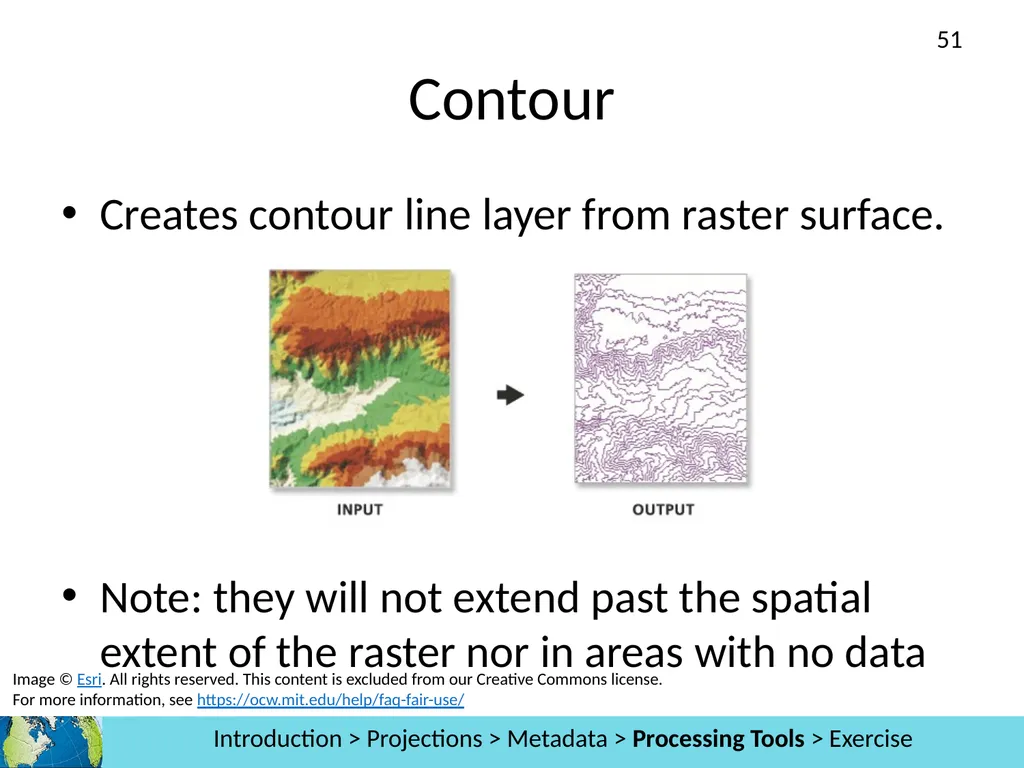
Contour Creates contour line layer from raster surface.
Note: they will not extend past the spatial extent of the raster nor in areas with no data Introduction > Projections > Metadata > Processing Tools > Exercise Image © Esri. All rights reserved. This content is excluded from our Creative Commons license. For more information, see https://ocw.mit.edu/help/faq-fair-use/ 51<br>
Note: they will not extend past the spatial extent of the raster nor in areas with no data Introduction > Projections > Metadata > Processing Tools > Exercise Image © Esri. All rights reserved. This content is excluded from our Creative Commons license. For more information, see https://ocw.mit.edu/help/faq-fair-use/ 51<br>
52
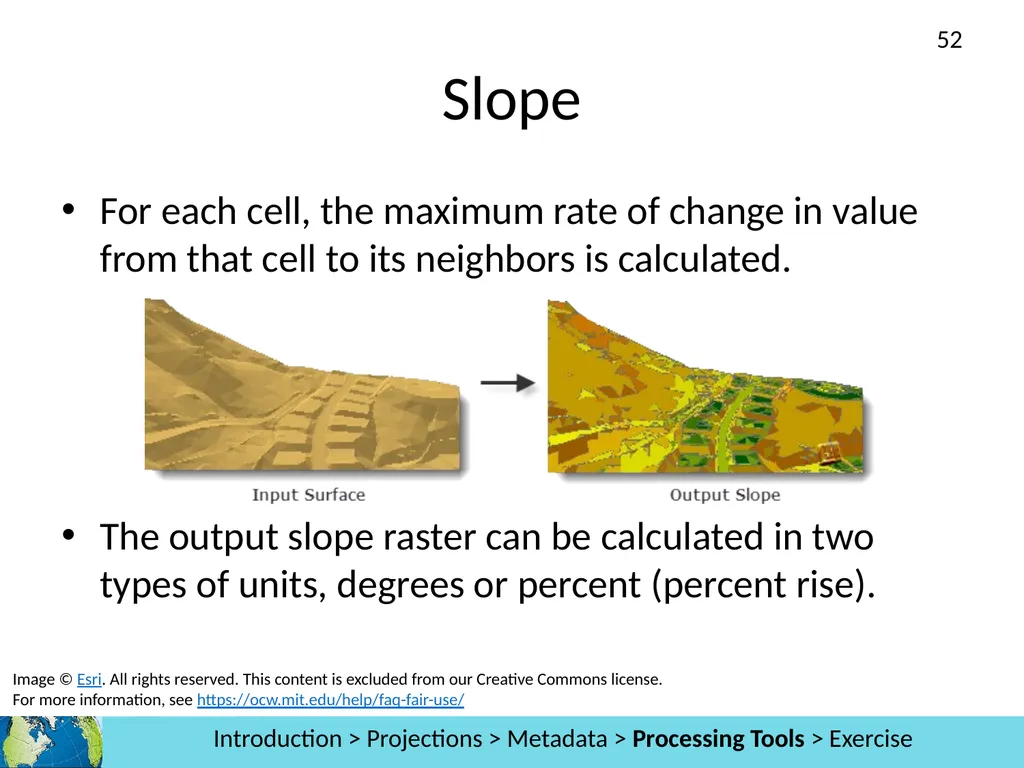
Slope For each cell, the maximum rate of change in value from that cell to its neighbors is calculated.
The output slope raster can be calculated in two types of units, degrees or percent (percent rise). Introduction > Projections > Metadata > Processing Tools > Exercise Image © Esri. All rights reserved. This content is excluded from our Creative Commons license. For more information, see https://ocw.mit.edu/help/faq-fair-use/ 52<br>
The output slope raster can be calculated in two types of units, degrees or percent (percent rise). Introduction > Projections > Metadata > Processing Tools > Exercise Image © Esri. All rights reserved. This content is excluded from our Creative Commons license. For more information, see https://ocw.mit.edu/help/faq-fair-use/ 52<br>
53
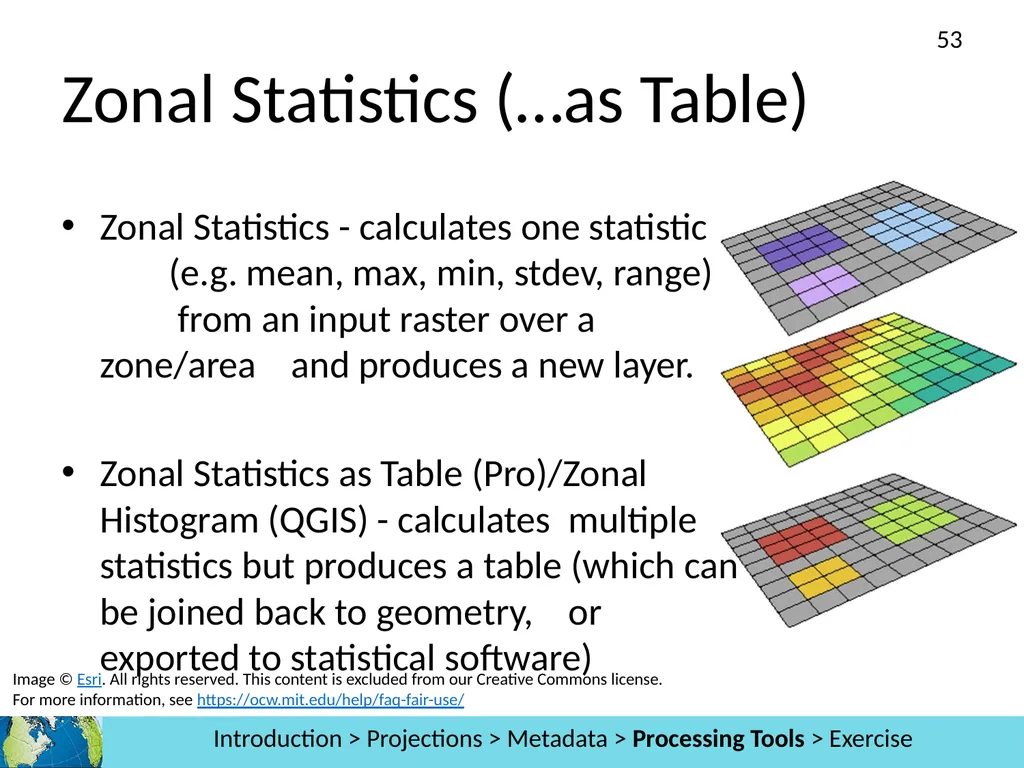
Zonal Statistics (…as Table) Zonal Statistics - calculates one statistic (e.g. mean, max, min, stdev, range) from an input raster over a zone/area and produces a new layer.
Zonal Statistics as Table (Pro)/Zonal Histogram (QGIS) - calculates multiple statistics but produces a table (which can be joined back to geometry, or exported to statistical software) Introduction > Projections > Metadata > Processing Tools > Exercise Image © Esri. All rights reserved. This content is excluded from our Creative Commons license. For more information, see https://ocw.mit.edu/help/faq-fair-use/ 53<br>
Zonal Statistics as Table (Pro)/Zonal Histogram (QGIS) - calculates multiple statistics but produces a table (which can be joined back to geometry, or exported to statistical software) Introduction > Projections > Metadata > Processing Tools > Exercise Image © Esri. All rights reserved. This content is excluded from our Creative Commons license. For more information, see https://ocw.mit.edu/help/faq-fair-use/ 53<br>
54
Surface analysis tools: also are used to… Analyze Patterns
Analyze Terrain
Generalize
Conduct hydrological analysis
Manage Data
Summarize Data
Use Proximity Introduction > Projections > Metadata > Processing Tools > Exercise 54<br>
Analyze Terrain
Generalize
Conduct hydrological analysis
Manage Data
Summarize Data
Use Proximity Introduction > Projections > Metadata > Processing Tools > Exercise 54<br>
55
Exercise 3: Raster tools Goals
Learn how to access raster tools
Steps
You will go back into your breakout room and be guided through the third exercise. 55<br>
Learn how to access raster tools
Steps
You will go back into your breakout room and be guided through the third exercise. 55<br>
56
Spatial Statistics Analysis >> Projections >> Metadata >> Processing Tools >> Exercise Introduction > Projections > Metadata > Processing Tools > Exercise Introduction » Map Projections » Metadata » Processing Tools » Exercise 56<br>
57
methods for analyzing spatial distributions, patterns, processes, and relationships
they incorporate space (proximity, area, connectivity, and/or other spatial relationships) directly into their mathematics What are spatial statistics? Analysis >> Projections >> Metadata >> Processing Tools >> Exercise Introduction > Projections > Metadata > Processing Tools > Exercise 57<br>
they incorporate space (proximity, area, connectivity, and/or other spatial relationships) directly into their mathematics What are spatial statistics? Analysis >> Projections >> Metadata >> Processing Tools >> Exercise Introduction > Projections > Metadata > Processing Tools > Exercise 57<br>
58
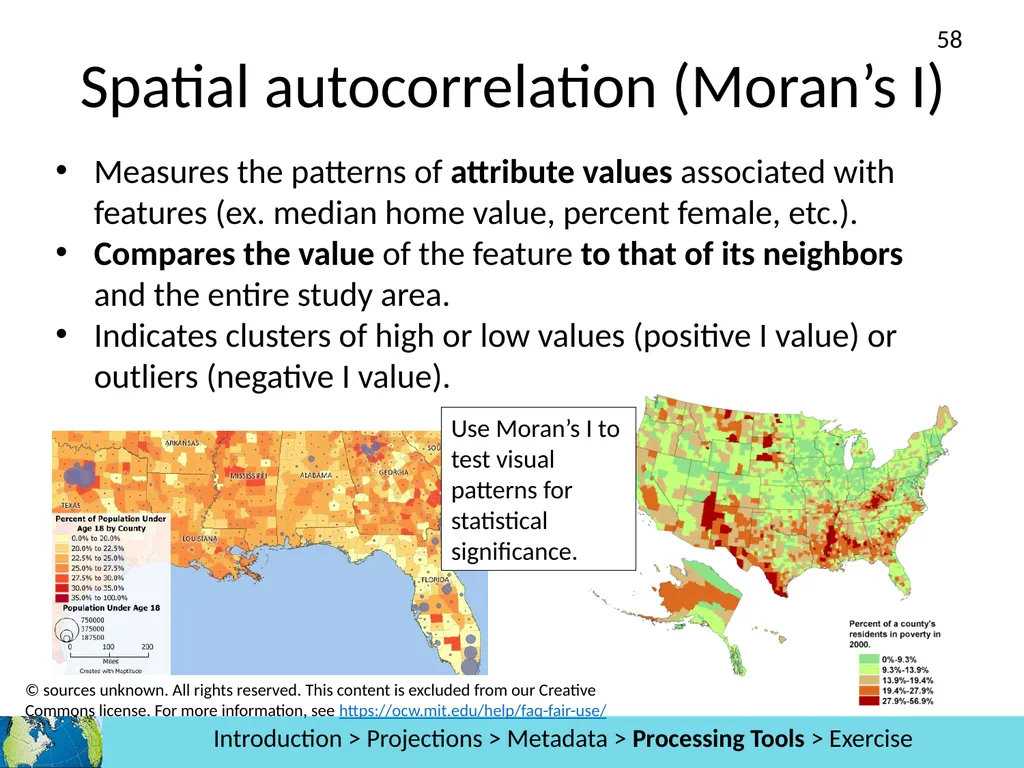
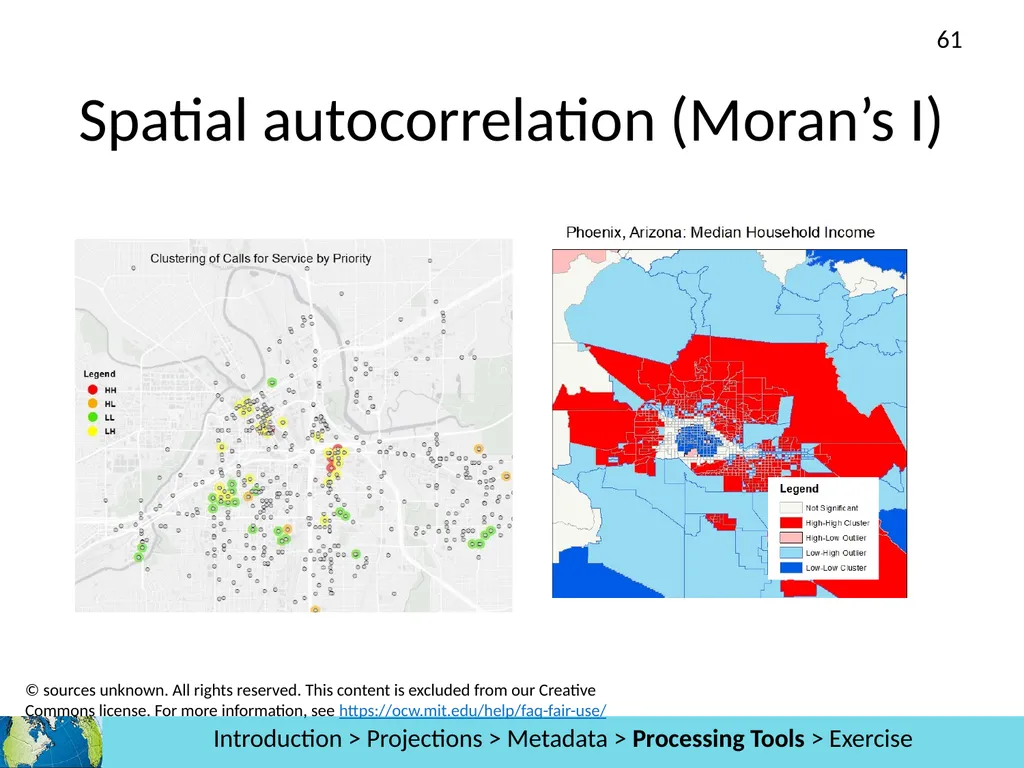
Measures the patterns of attribute values associated with features (ex. median home value, percent female, etc.).
Compares the value of the feature to that of its neighbors and the entire study area.
Indicates clusters of high or low values (positive I value) or outliers (negative I value). Analysis >> Projections >> Metadata >> Processing Tools >> Exercise Introduction > Projections > Metadata > Processing Tools > Exercise Spatial autocorrelation (Moran’s I) Use Moran’s I to test visual patterns for statistical significance. © sources unknown. All rights reserved. This content is excluded from our Creative Commons license. For more information, see https://ocw.mit.edu/help/faq-fair-use/ 58<br>
Compares the value of the feature to that of its neighbors and the entire study area.
Indicates clusters of high or low values (positive I value) or outliers (negative I value). Analysis >> Projections >> Metadata >> Processing Tools >> Exercise Introduction > Projections > Metadata > Processing Tools > Exercise Spatial autocorrelation (Moran’s I) Use Moran’s I to test visual patterns for statistical significance. © sources unknown. All rights reserved. This content is excluded from our Creative Commons license. For more information, see https://ocw.mit.edu/help/faq-fair-use/ 58<br>
59
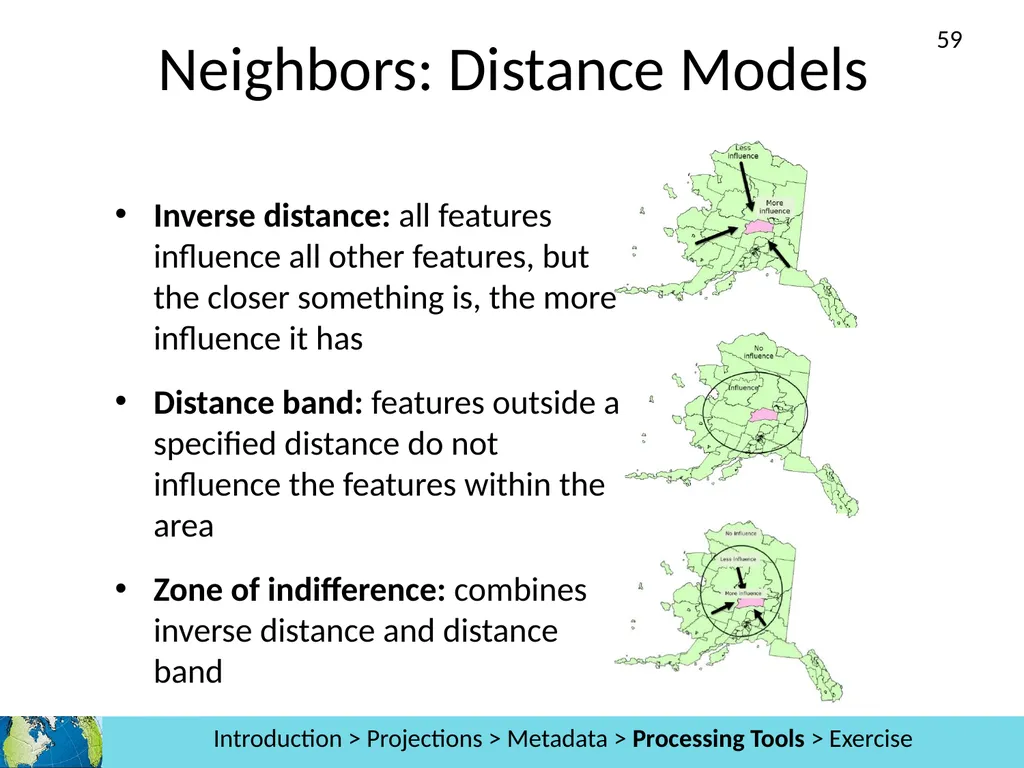
Inverse distance: all features influence all other features, but the closer something is, the more influence it has
Distance band: features outside a specified distance do not influence the features within the area
Zone of indifference: combines inverse distance and distance band Neighbors: Distance Models Analysis >> Projections >> Metadata >> Processing Tools >> Exercise Introduction > Projections > Metadata > Processing Tools > Exercise 59<br>
Distance band: features outside a specified distance do not influence the features within the area
Zone of indifference: combines inverse distance and distance band Neighbors: Distance Models Analysis >> Projections >> Metadata >> Processing Tools >> Exercise Introduction > Projections > Metadata > Processing Tools > Exercise 59<br>
60
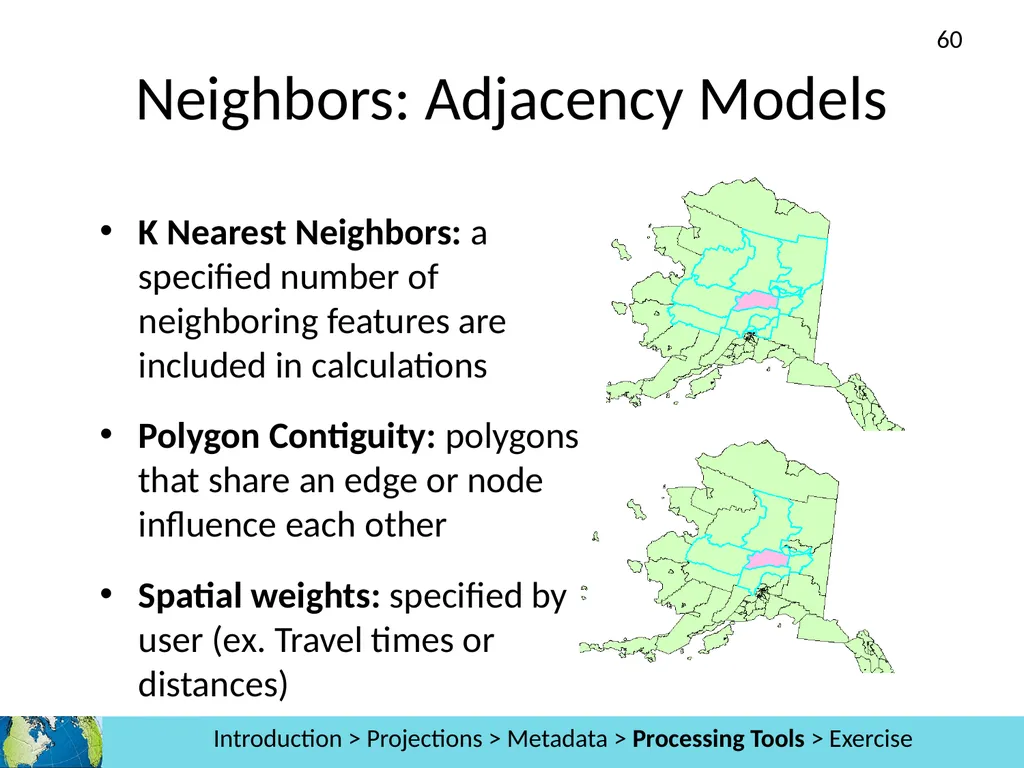
K Nearest Neighbors: a specified number of neighboring features are included in calculations
Polygon Contiguity: polygons that share an edge or node influence each other
Spatial weights: specified by user (ex. Travel times or distances) Neighbors: Adjacency Models Analysis >> Projections >> Metadata >> Processing Tools >> Exercise Introduction > Projections > Metadata > Processing Tools > Exercise 60<br>
Polygon Contiguity: polygons that share an edge or node influence each other
Spatial weights: specified by user (ex. Travel times or distances) Neighbors: Adjacency Models Analysis >> Projections >> Metadata >> Processing Tools >> Exercise Introduction > Projections > Metadata > Processing Tools > Exercise 60<br>
61
Spatial autocorrelation (Moran’s I) Analysis >> Projections >> Metadata >> Processing Tools >> Exercise Introduction > Projections > Metadata > Processing Tools > Exercise © sources unknown. All rights reserved. This content is excluded from our Creative Commons license. For more information, see https://ocw.mit.edu/help/faq-fair-use/ 61<br>
62
Other spatial statistics tools Analyzing patterns
Nearest neighbor, Ripley’s K
Geographic distributions
mean, median, directional mean
Regression
Geographic, Ordinary Least Squares (OLS) Analysis >> Projections >> Metadata >> Processing Tools >> Exercise Introduction > Projections > Metadata > Processing Tools > Exercise 62<br>
Nearest neighbor, Ripley’s K
Geographic distributions
mean, median, directional mean
Regression
Geographic, Ordinary Least Squares (OLS) Analysis >> Projections >> Metadata >> Processing Tools >> Exercise Introduction > Projections > Metadata > Processing Tools > Exercise 62<br>
63
Exercise 4: Spatial Statistics Goals
Learn how to access specialized analysis tools
Understand the results of a basic spatial autocorrelation.
Steps
You will go back into your breakout room and be guided through the fourth exercise. 63<br>
Learn how to access specialized analysis tools
Understand the results of a basic spatial autocorrelation.
Steps
You will go back into your breakout room and be guided through the fourth exercise. 63<br>
64
Distance & Network Analysis Analysis >> Projections >> Metadata >> Processing Tools >> Exercise Introduction > Projections > Metadata > Processing Tools > Exercise 64<br>
65
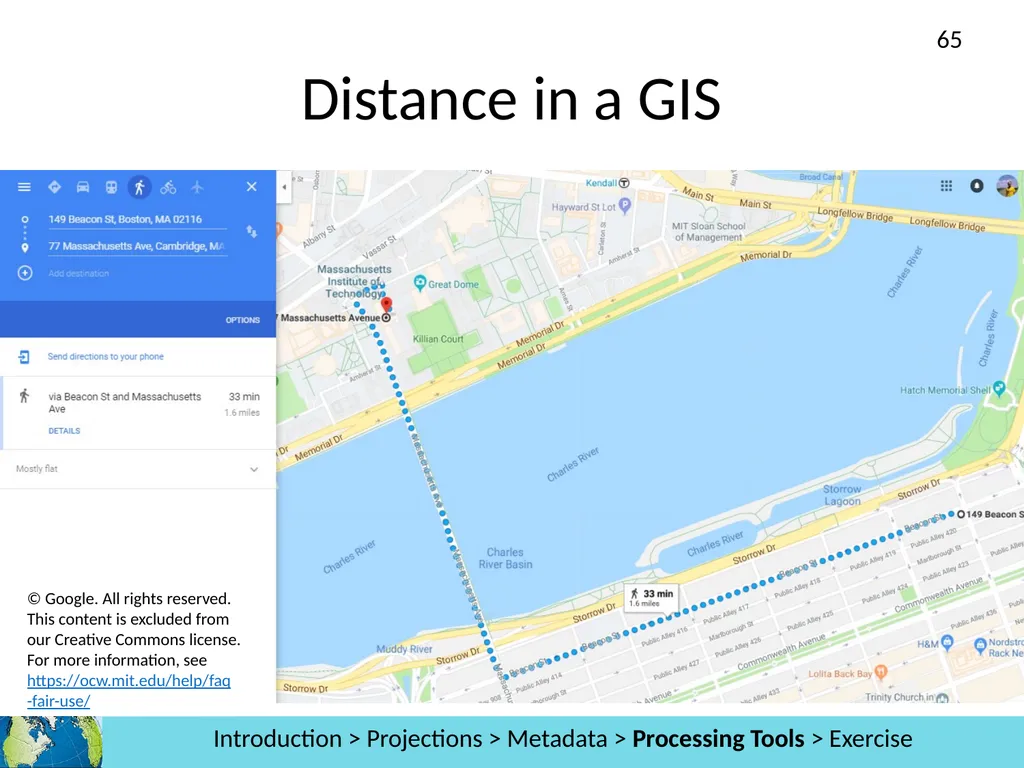
Distance in a GIS Analysis >> Projections >> Metadata >> Processing Tools >> Exercise Introduction > Projections > Metadata > Processing Tools > Exercise © Google. All rights reserved. This content is excluded from our Creative Commons license. For more information, see https://ocw.mit.edu/help/faq-fair-use/ 65<br>
66
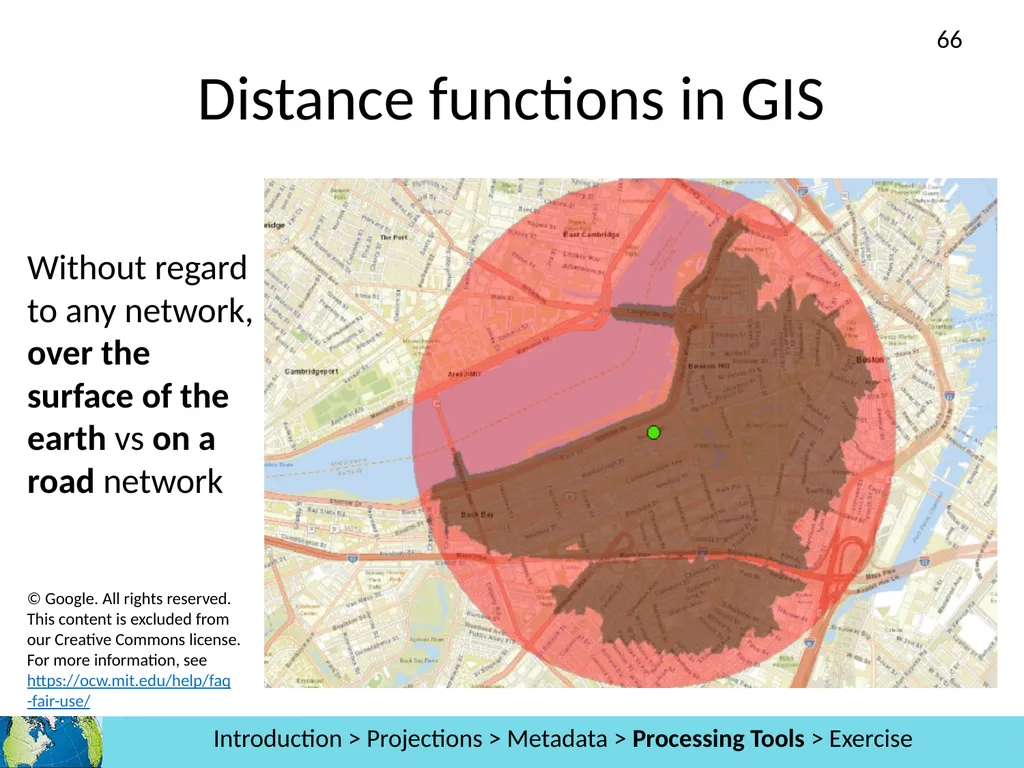
Distance functions in GIS Without regard to any network, over the surface of the earth vs on a road network Analysis >> Projections >> Metadata >> Processing Tools >> Exercise Introduction > Projections > Metadata > Processing Tools > Exercise © Google. All rights reserved. This content is excluded from our Creative Commons license. For more information, see https://ocw.mit.edu/help/faq-fair-use/ 66<br>
67
Network Analysis Tools Routing
Service Areas
Closest facility
OD Cost Matrix
Vehicle Routing Problem
Location-Allocation
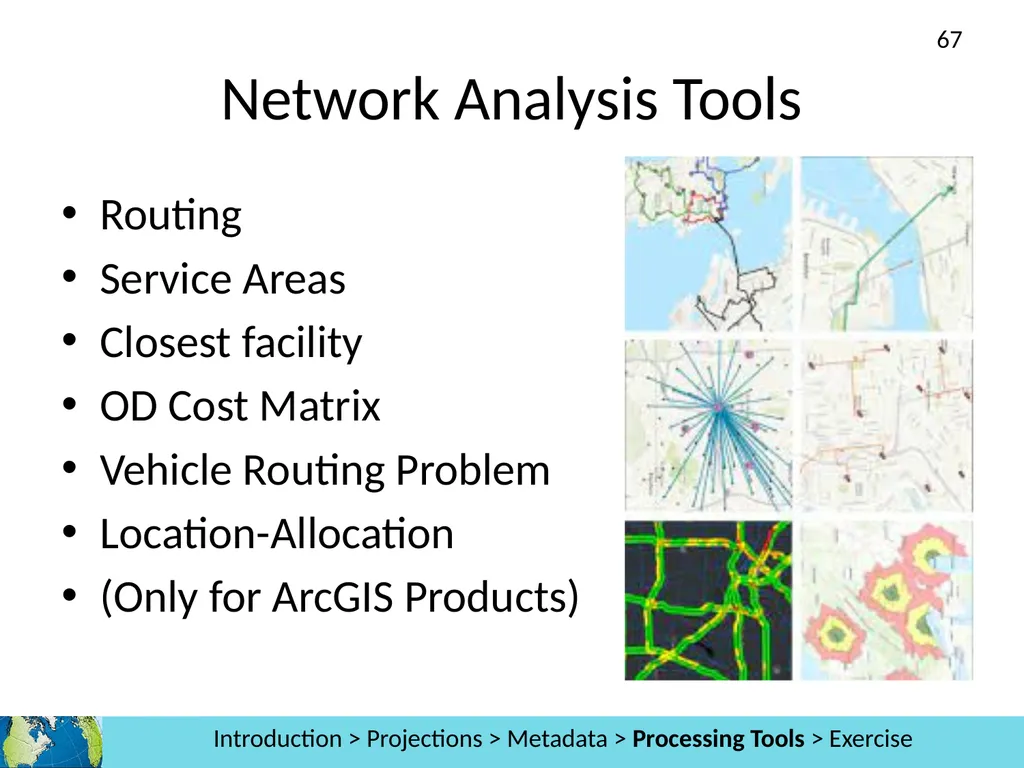
(Only for ArcGIS Products) Analysis >> Projections >> Metadata >> Processing Tools >> Exercise Introduction > Projections > Metadata > Processing Tools > Exercise 67<br>
Service Areas
Closest facility
OD Cost Matrix
Vehicle Routing Problem
Location-Allocation
(Only for ArcGIS Products) Analysis >> Projections >> Metadata >> Processing Tools >> Exercise Introduction > Projections > Metadata > Processing Tools > Exercise 67<br>
68
Take-Home Exercise Analysis >> Projections >> Metadata >> Processing Tools >> Exercise Introduction > Projections > Metadata > Processing Tools > Exercise 68<br>
69
Take-home Exercise overview Continuing with the data from GIS Level 1, explore where you may build a mixed use facility in Jersey City.
This exercise will take into account the following factors:
Clustering of unemployment
Distance to transportation
Terrain Analysis >> Projections >> Metadata >> Processing Tools >> Exercise Introduction > Projections > Metadata > Processing Tools > Exercise 69<br>
This exercise will take into account the following factors:
Clustering of unemployment
Distance to transportation
Terrain Analysis >> Projections >> Metadata >> Processing Tools >> Exercise Introduction > Projections > Metadata > Processing Tools > Exercise 69<br>
70
MIT OpenCourseWare
https://ocw.mit.edu
RES.STR-001 Geographic Information System (GIS) Tutorial
IAP 2022
For information about citing these materials or our Terms of Use, visit: https://ocw.mit.edu/terms<br>
https://ocw.mit.edu
RES.STR-001 Geographic Information System (GIS) Tutorial
IAP 2022
For information about citing these materials or our Terms of Use, visit: https://ocw.mit.edu/terms<br>