
Global Access to Improved Drinking Water and
Description: Global Access to Improved Drinking Water and Childhood Mortality Hannah Greenwald EAS 4480 Spring 2017 Motivation: Childhood Mortality 5.9 million children under the age of 5 died in 2015 Globally, 2,000 children under the age of five die
Related Topics
Download Presentation
"Global Access to Improved Drinking Water and" is the property of its rightful owner. Permission is granted to download and print the materials on this website for personal, non-commercial use only, and to display it on your personal computer provided you do not modify the materials and that you retain all copyright notices contained in the materials. By downloading content from our website, you accept the terms of this agreement.
Presentation Transcript
slide1. Global Access to Improved Drinking Water and Childhood Mortality Hannah Greenwald
EAS 4480 Spring 2017<br>
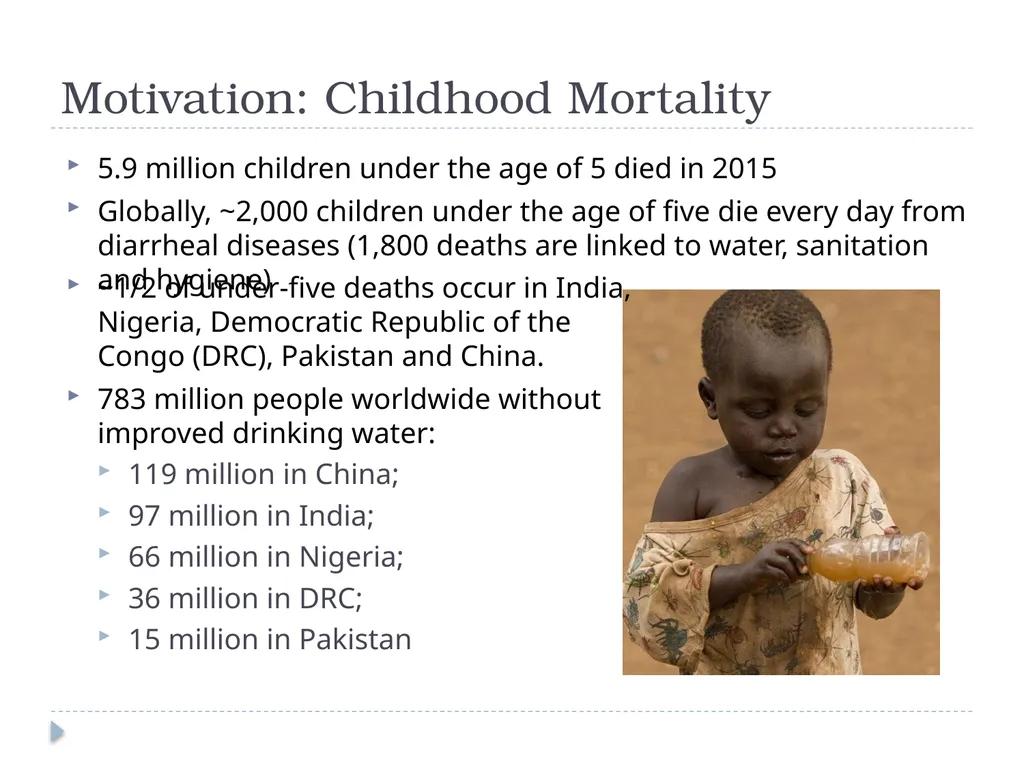
slide2. Motivation: Childhood Mortality 5.9 million children under the age of 5 died in 2015
Globally, ~2,000 children under the age of five die every day from diarrheal diseases (1,800 deaths are linked to water, sanitation and hygiene) ~1/2 of under-five deaths occur in India, Nigeria, Democratic Republic of the Congo (DRC), Pakistan and China.
783 million people worldwide without improved drinking water:
119 million in China;
97 million in India;
66 million in Nigeria;
36 million in DRC;
15 million in Pakistan<br>
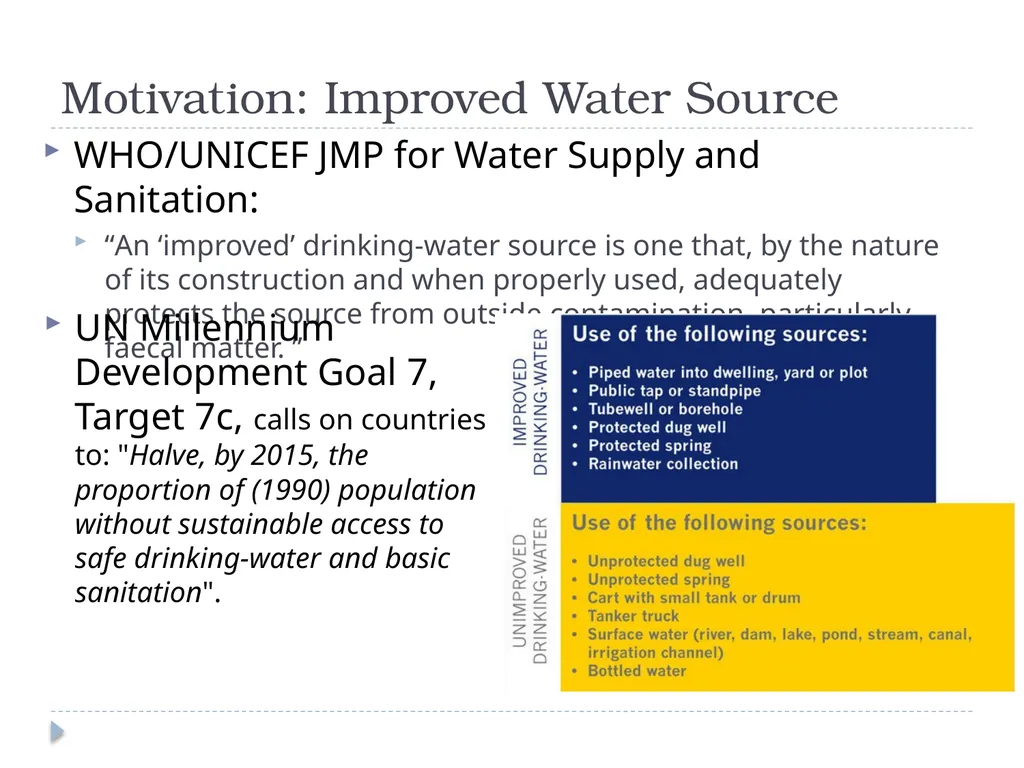
slide3. Motivation: Improved Water Source WHO/UNICEF JMP for Water Supply and Sanitation:
“An ‘improved’ drinking-water source is one that, by the nature of its construction and when properly used, adequately protects the source from outside contamination, particularly faecal matter. ” UN Millennium Development Goal 7, Target 7c, calls on countries to: "Halve, by 2015, the proportion of (1990) population without sustainable access to safe drinking-water and basic sanitation".<br>
slide4. Data Sources World Bank: Percent of Population with Access to an Improved Drinking Water Source by Country (1990-2015)
World Bank: Childhood Mortality (deaths under 5 years of age per 1000 live births) (1960-2015)<br>
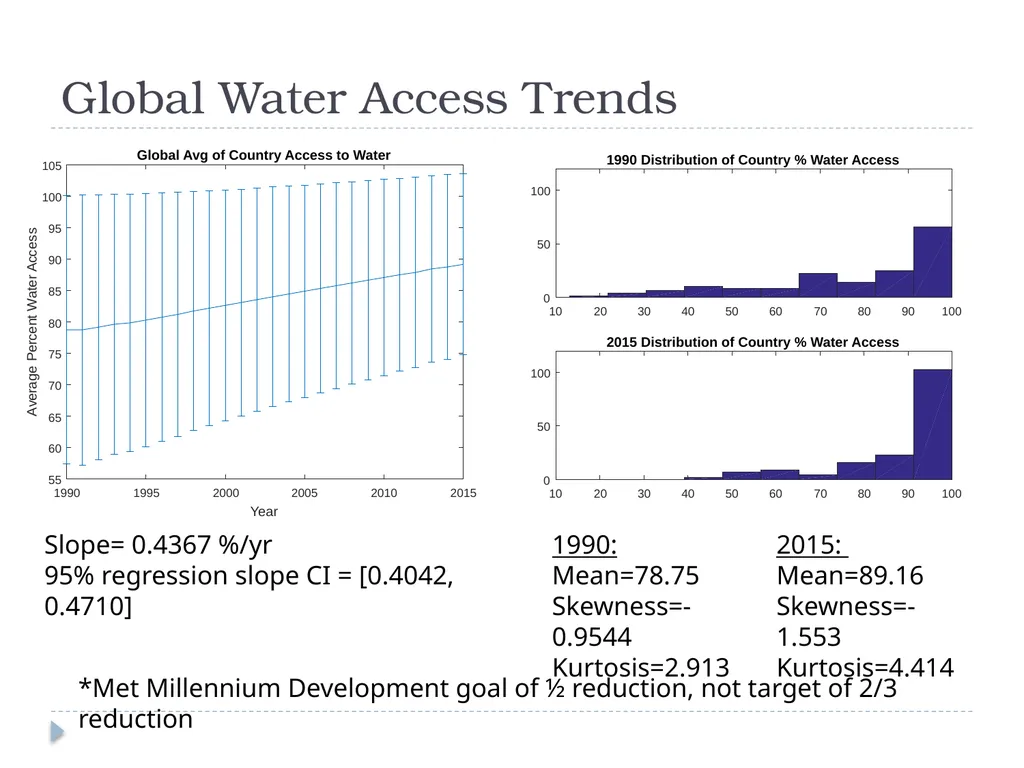
slide5. Global Water Access Trends Slope= 0.4367 %/yr
95% regression slope CI = [0.4042, 0.4710] 1990:
Mean=78.75
Skewness=-0.9544
Kurtosis=2.913 2015:
Mean=89.16
Skewness=-1.553
Kurtosis=4.414 *Met Millennium Development goal of ½ reduction, not target of 2/3 reduction<br>
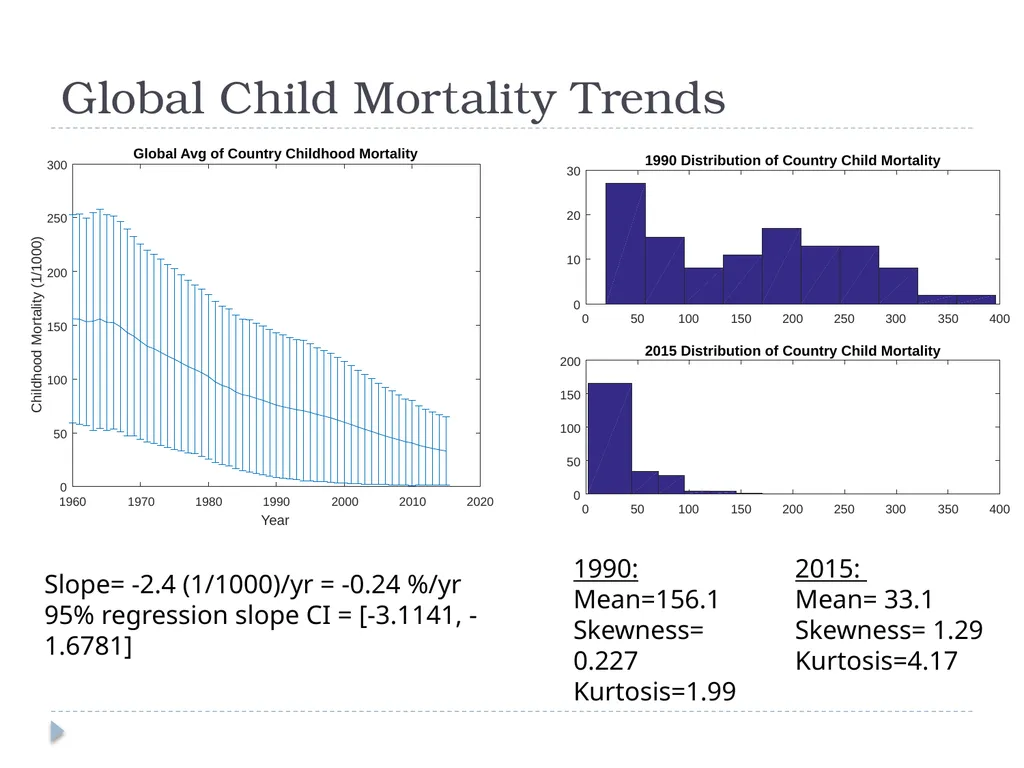
slide6. Global Child Mortality Trends Slope= -2.4 (1/1000)/yr = -0.24 %/yr
95% regression slope CI = [-3.1141, -1.6781] 1990:
Mean=156.1
Skewness= 0.227
Kurtosis=1.99 2015:
Mean= 33.1
Skewness= 1.29
Kurtosis=4.17<br>
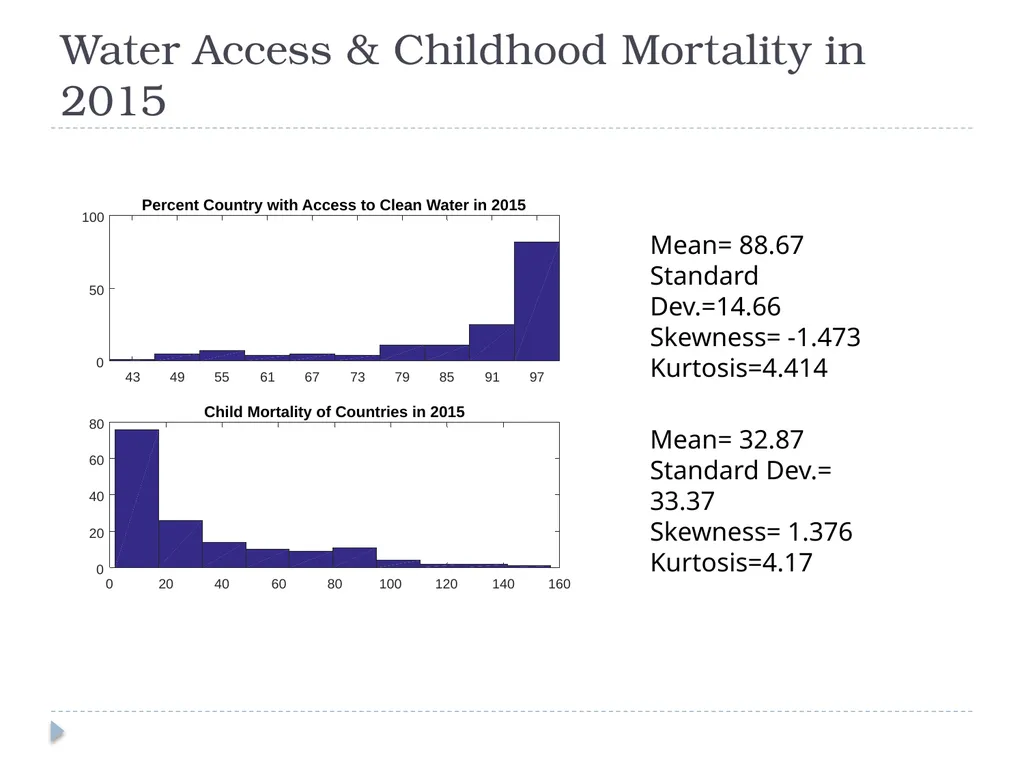
slide7. Water Access & Childhood Mortality in 2015 Mean= 88.67
Standard Dev.=14.66
Skewness= -1.473
Kurtosis=4.414 Mean= 32.87
Standard Dev.= 33.37
Skewness= 1.376
Kurtosis=4.17<br>
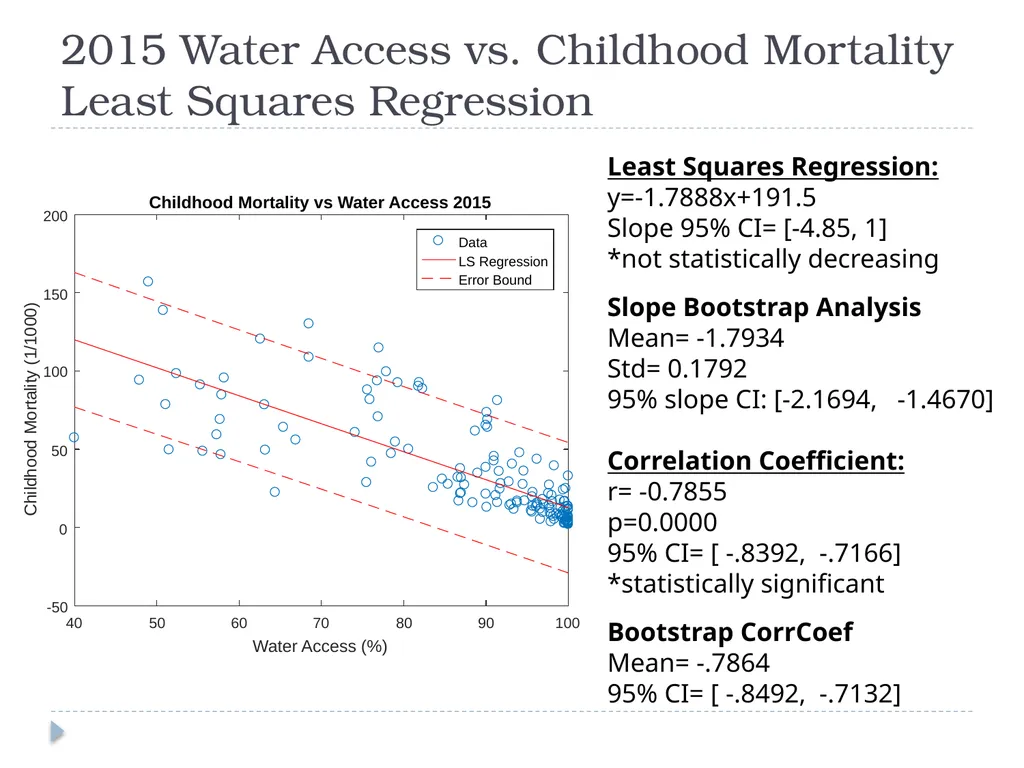
slide8. 2015 Water Access vs. Childhood Mortality Least Squares Regression Least Squares Regression:
y=-1.7888x+191.5
Slope 95% CI= [-4.85, 1]
*not statistically decreasing
Slope Bootstrap Analysis
Mean= -1.7934
Std= 0.1792
95% slope CI: [-2.1694, -1.4670]
Correlation Coefficient:
r= -0.7855
p=0.0000
95% CI= [ -.8392, -.7166]
*statistically significant
Bootstrap CorrCoef
Mean= -.7864
95% CI= [ -.8492, -.7132]<br>
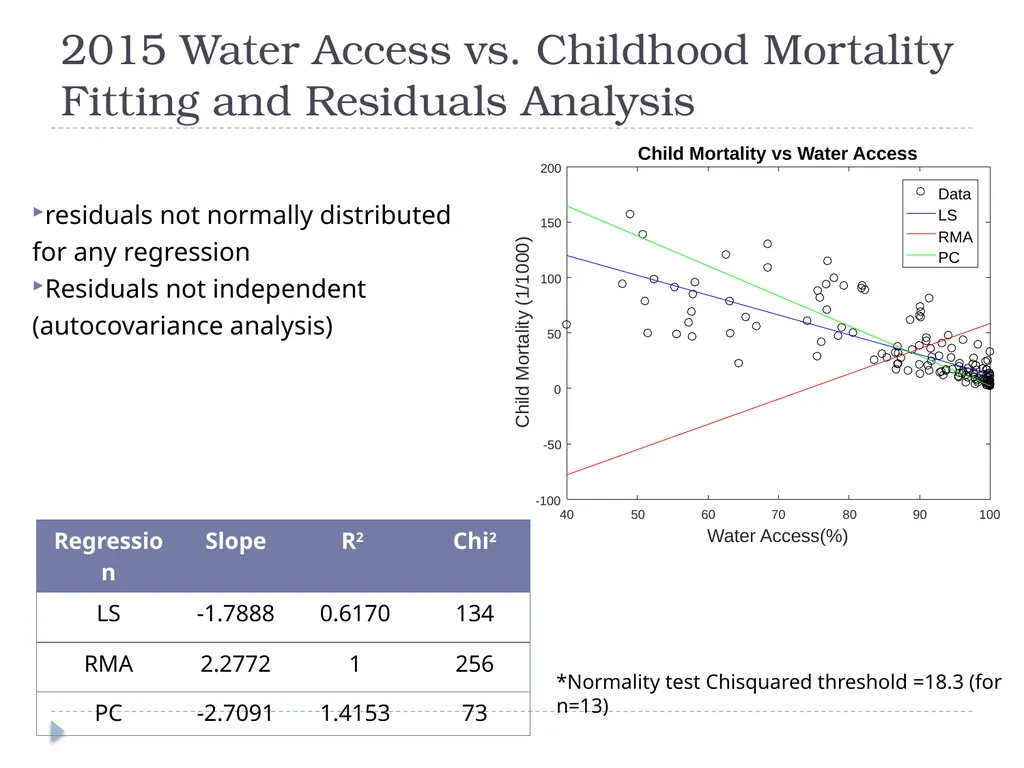
slide9. 2015 Water Access vs. Childhood Mortality Fitting and Residuals Analysis residuals not normally distributed for any regression
Residuals not independent (autocovariance analysis) *Normality test Chisquared threshold =18.3 (for n=13)<br>
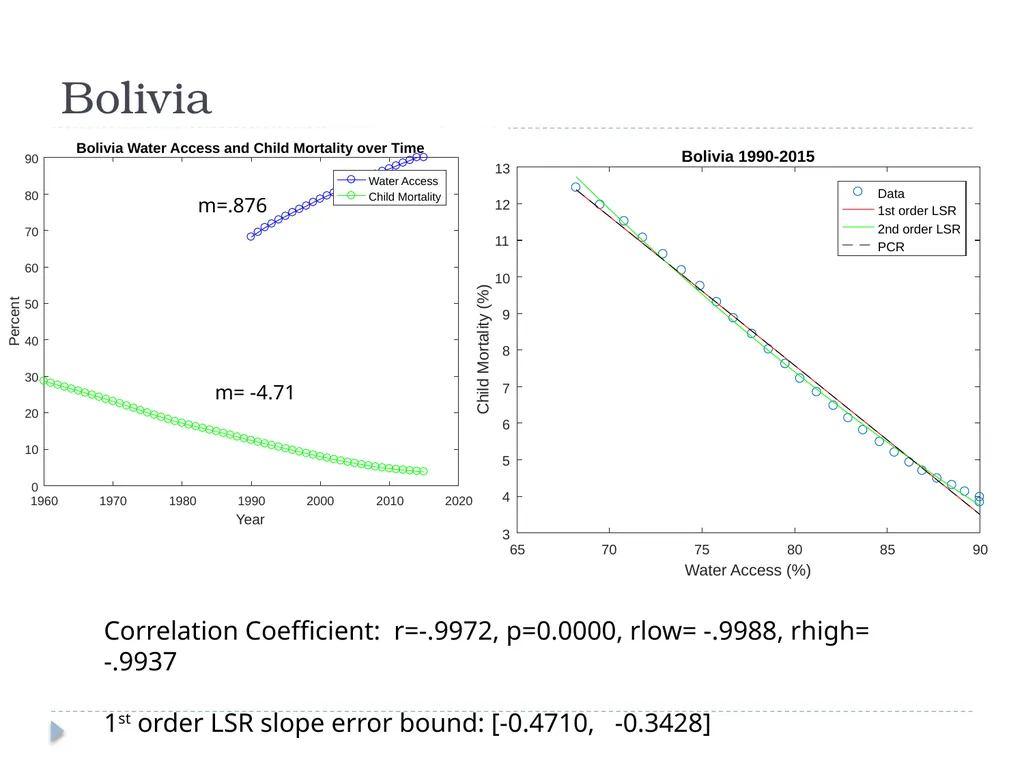
slide10. Bolivia Correlation Coefficient: r=-.9972, p=0.0000, rlow= -.9988, rhigh= -.9937
1st order LSR slope error bound: [-0.4710, -0.3428] m=.876 m= -4.71<br>
slide11. Bolivia<br>
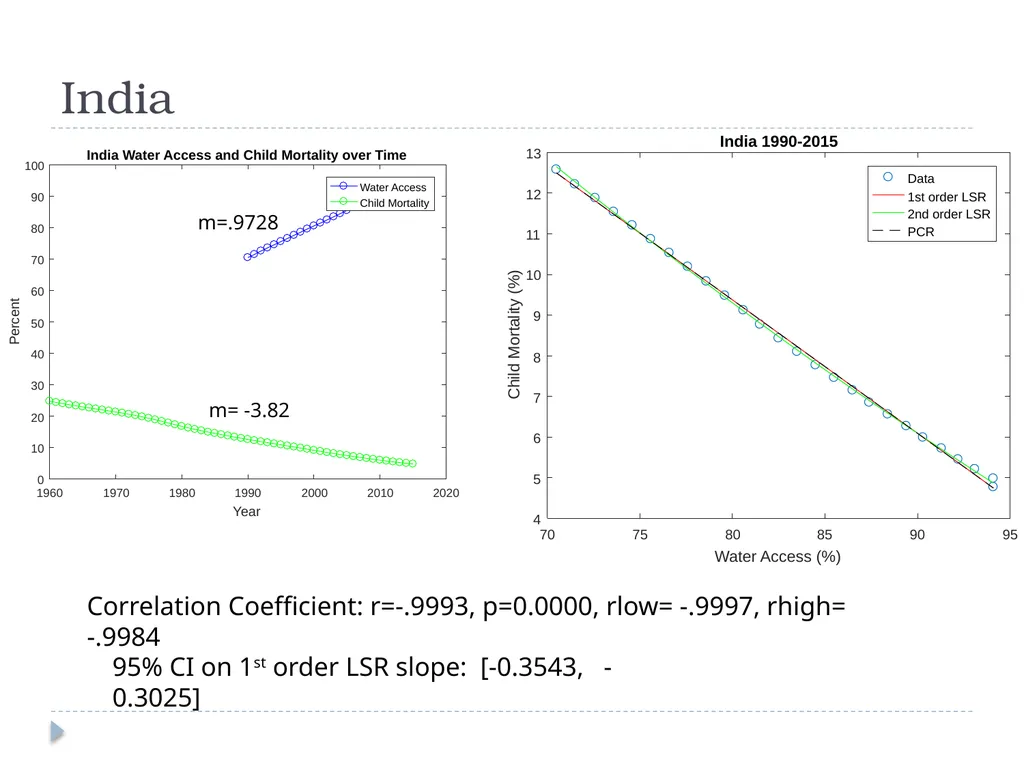
slide12. India Correlation Coefficient: r=-.9993, p=0.0000, rlow= -.9997, rhigh= -.9984 95% CI on 1st order LSR slope: [-0.3543, -0.3025] m=.9728 m= -3.82<br>
slide13. India<br>
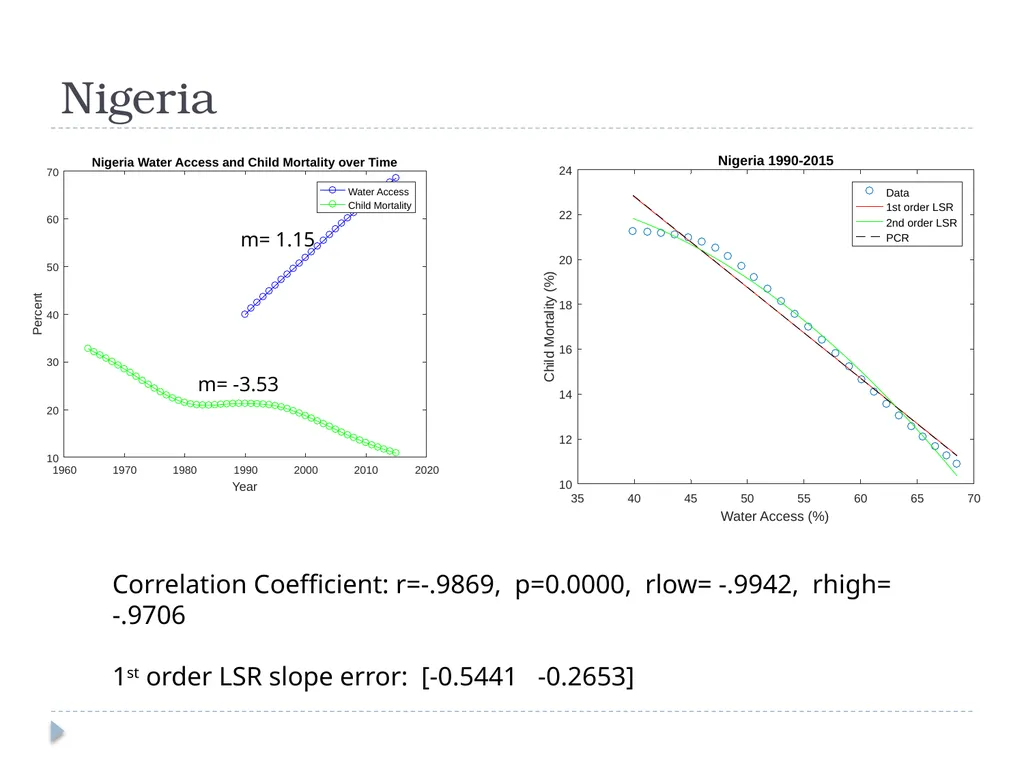
slide14. Nigeria Correlation Coefficient: r=-.9869, p=0.0000, rlow= -.9942, rhigh= -.9706
1st order LSR slope error: [-0.5441 -0.2653] m= 1.15 m= -3.53<br>
slide15. Nigeria<br>
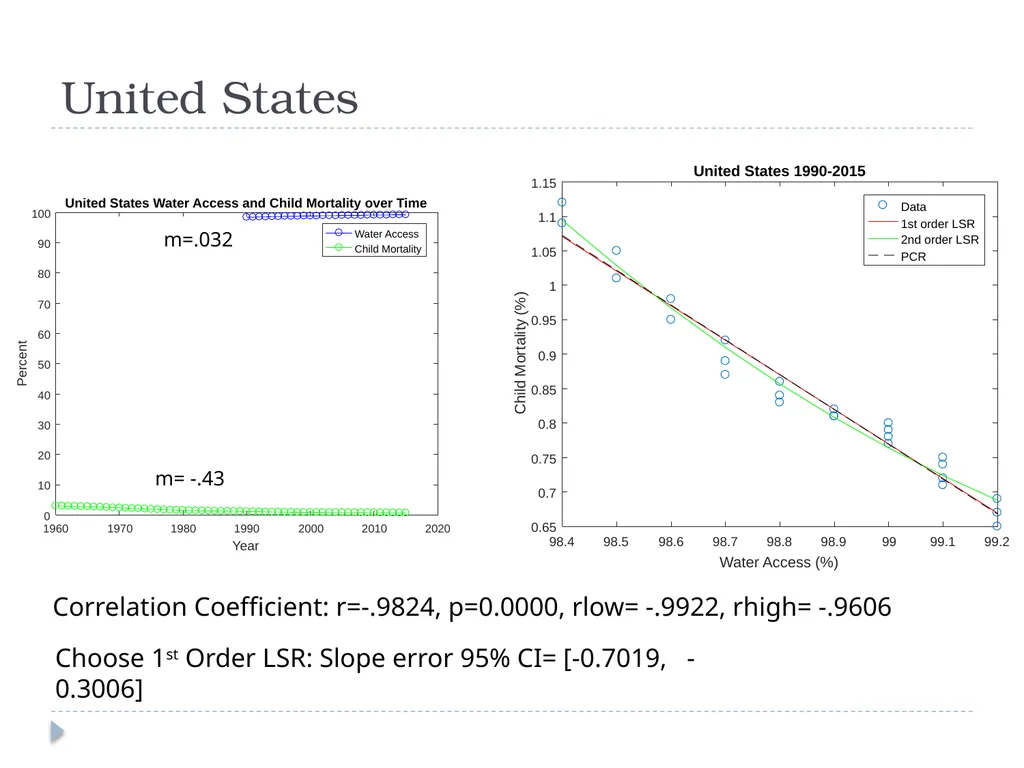
slide16. United States Correlation Coefficient: r=-.9824, p=0.0000, rlow= -.9922, rhigh= -.9606 Choose 1st Order LSR: Slope error 95% CI= [-0.7019, -0.3006] m=.032 m= -.43<br>
slide17. United States *Threshold Chi2 value = 9.488<br>
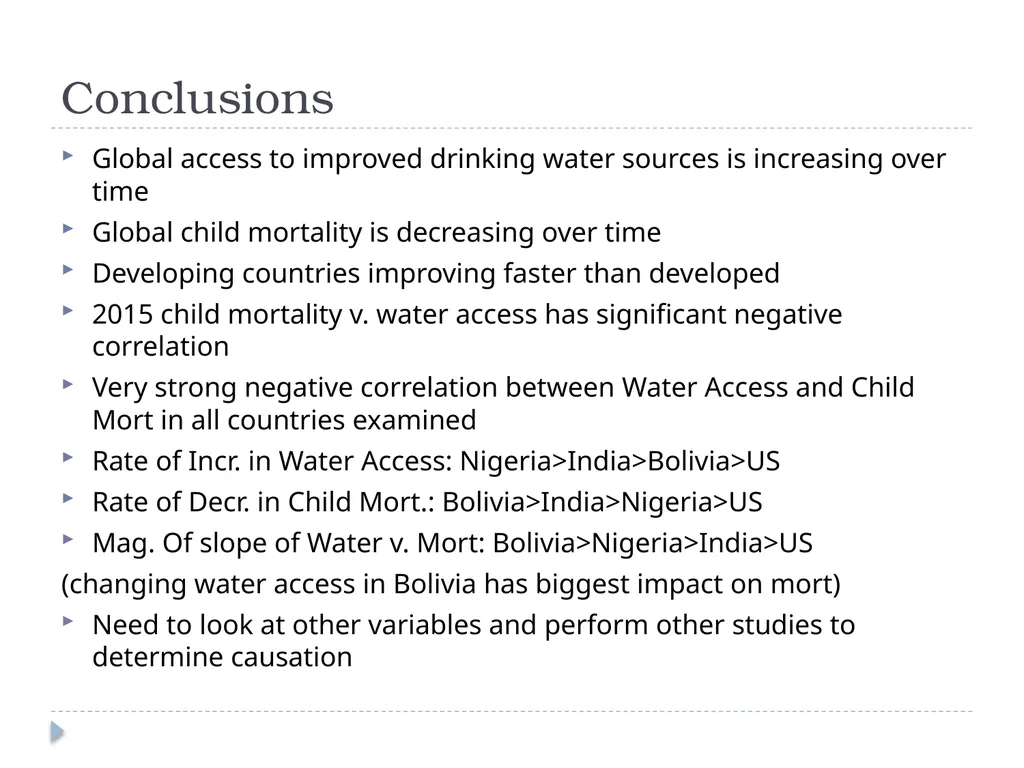
slide18. Conclusions Global access to improved drinking water sources is increasing over time
Global child mortality is decreasing over time
Developing countries improving faster than developed
2015 child mortality v. water access has significant negative correlation
Very strong negative correlation between Water Access and Child Mort in all countries examined
Rate of Incr. in Water Access: Nigeria>India>Bolivia>US
Rate of Decr. in Child Mort.: Bolivia>India>Nigeria>US
Mag. Of slope of Water v. Mort: Bolivia>Nigeria>India>US
(changing water access in Bolivia has biggest impact on mort)
Need to look at other variables and perform other studies to determine causation<br>
slide19. Questions?<br>
slide20. References http://data.worldbank.org/indicator/SH.H2O.SAFE.ZS
http://data.worldbank.org/indicator/SH.DYN.MORT
https://www.wssinfo.org/definitions-methods/
https://www.unicef.org/media/media_68359.html<br>
slide21. EAS-4480 Project Report Rubric (90 points + 10 from presentation)
(10) The student clearly identifies the goal of the project – the question being answered. This is accompanied by some motivation of the underlying physical phenomena.
(5) The student identifies data sources and explains (if necessary) how the data were arranged for use in the statistical analysis.
(20) Appropriate statistical techniques that address the goal of the project are employed to analyze the data. The techniques should be used correctly. Error/uncertainty estimates should be made where necessary.
(10) The student should identify why analysis techniques were chosen. Describing the steps of hypothesis testing would be ideal.
(10) The student demonstrates either their in-depth understanding of a particular analysis technique (sophisticated method) or their breadth in multiple relevant techniques. For instance, the analysis should not be limited to calculating the correlation coefficient between different variables.
(15) The student demonstrates clear understand of errors/uncertainties in the analysis and discusses the underlying physical phenomena in light of the analysis results and error estimates.
(20) The written report should be free of major grammatical errors, have a coherent structure (logical procession of ideas), and include abstract, introduction, analysis, conclusions, and a list of references (bibliography). Any figures should be clearly legible with proper labels, lines, fonts, and captions.
Suggested report length: 8-12 pages (double spaced (not counting figures and references), Times New Roman, 12pt). The report must be your own work and writing. Plagiarism will not be tolerated. Please check out these web instructions if you are unsure how to properly credit published and unpublished sources: http://isites.harvard.edu/icb/icb.do?keyword=k70847&tabgroupid=icb.tabgroup106849.<br>
slide22. Bangladesh r=-.9935, p=0.0000, rlow= -.9971, rhigh= -.9853<br>
slide23. India<br>
EAS 4480 Spring 2017<br>
slide2. Motivation: Childhood Mortality 5.9 million children under the age of 5 died in 2015
Globally, ~2,000 children under the age of five die every day from diarrheal diseases (1,800 deaths are linked to water, sanitation and hygiene) ~1/2 of under-five deaths occur in India, Nigeria, Democratic Republic of the Congo (DRC), Pakistan and China.
783 million people worldwide without improved drinking water:
119 million in China;
97 million in India;
66 million in Nigeria;
36 million in DRC;
15 million in Pakistan<br>
slide3. Motivation: Improved Water Source WHO/UNICEF JMP for Water Supply and Sanitation:
“An ‘improved’ drinking-water source is one that, by the nature of its construction and when properly used, adequately protects the source from outside contamination, particularly faecal matter. ” UN Millennium Development Goal 7, Target 7c, calls on countries to: "Halve, by 2015, the proportion of (1990) population without sustainable access to safe drinking-water and basic sanitation".<br>
slide4. Data Sources World Bank: Percent of Population with Access to an Improved Drinking Water Source by Country (1990-2015)
World Bank: Childhood Mortality (deaths under 5 years of age per 1000 live births) (1960-2015)<br>
slide5. Global Water Access Trends Slope= 0.4367 %/yr
95% regression slope CI = [0.4042, 0.4710] 1990:
Mean=78.75
Skewness=-0.9544
Kurtosis=2.913 2015:
Mean=89.16
Skewness=-1.553
Kurtosis=4.414 *Met Millennium Development goal of ½ reduction, not target of 2/3 reduction<br>
slide6. Global Child Mortality Trends Slope= -2.4 (1/1000)/yr = -0.24 %/yr
95% regression slope CI = [-3.1141, -1.6781] 1990:
Mean=156.1
Skewness= 0.227
Kurtosis=1.99 2015:
Mean= 33.1
Skewness= 1.29
Kurtosis=4.17<br>
slide7. Water Access & Childhood Mortality in 2015 Mean= 88.67
Standard Dev.=14.66
Skewness= -1.473
Kurtosis=4.414 Mean= 32.87
Standard Dev.= 33.37
Skewness= 1.376
Kurtosis=4.17<br>
slide8. 2015 Water Access vs. Childhood Mortality Least Squares Regression Least Squares Regression:
y=-1.7888x+191.5
Slope 95% CI= [-4.85, 1]
*not statistically decreasing
Slope Bootstrap Analysis
Mean= -1.7934
Std= 0.1792
95% slope CI: [-2.1694, -1.4670]
Correlation Coefficient:
r= -0.7855
p=0.0000
95% CI= [ -.8392, -.7166]
*statistically significant
Bootstrap CorrCoef
Mean= -.7864
95% CI= [ -.8492, -.7132]<br>
slide9. 2015 Water Access vs. Childhood Mortality Fitting and Residuals Analysis residuals not normally distributed for any regression
Residuals not independent (autocovariance analysis) *Normality test Chisquared threshold =18.3 (for n=13)<br>
slide10. Bolivia Correlation Coefficient: r=-.9972, p=0.0000, rlow= -.9988, rhigh= -.9937
1st order LSR slope error bound: [-0.4710, -0.3428] m=.876 m= -4.71<br>
slide11. Bolivia<br>
slide12. India Correlation Coefficient: r=-.9993, p=0.0000, rlow= -.9997, rhigh= -.9984 95% CI on 1st order LSR slope: [-0.3543, -0.3025] m=.9728 m= -3.82<br>
slide13. India<br>
slide14. Nigeria Correlation Coefficient: r=-.9869, p=0.0000, rlow= -.9942, rhigh= -.9706
1st order LSR slope error: [-0.5441 -0.2653] m= 1.15 m= -3.53<br>
slide15. Nigeria<br>
slide16. United States Correlation Coefficient: r=-.9824, p=0.0000, rlow= -.9922, rhigh= -.9606 Choose 1st Order LSR: Slope error 95% CI= [-0.7019, -0.3006] m=.032 m= -.43<br>
slide17. United States *Threshold Chi2 value = 9.488<br>
slide18. Conclusions Global access to improved drinking water sources is increasing over time
Global child mortality is decreasing over time
Developing countries improving faster than developed
2015 child mortality v. water access has significant negative correlation
Very strong negative correlation between Water Access and Child Mort in all countries examined
Rate of Incr. in Water Access: Nigeria>India>Bolivia>US
Rate of Decr. in Child Mort.: Bolivia>India>Nigeria>US
Mag. Of slope of Water v. Mort: Bolivia>Nigeria>India>US
(changing water access in Bolivia has biggest impact on mort)
Need to look at other variables and perform other studies to determine causation<br>
slide19. Questions?<br>
slide20. References http://data.worldbank.org/indicator/SH.H2O.SAFE.ZS
http://data.worldbank.org/indicator/SH.DYN.MORT
https://www.wssinfo.org/definitions-methods/
https://www.unicef.org/media/media_68359.html<br>
slide21. EAS-4480 Project Report Rubric (90 points + 10 from presentation)
(10) The student clearly identifies the goal of the project – the question being answered. This is accompanied by some motivation of the underlying physical phenomena.
(5) The student identifies data sources and explains (if necessary) how the data were arranged for use in the statistical analysis.
(20) Appropriate statistical techniques that address the goal of the project are employed to analyze the data. The techniques should be used correctly. Error/uncertainty estimates should be made where necessary.
(10) The student should identify why analysis techniques were chosen. Describing the steps of hypothesis testing would be ideal.
(10) The student demonstrates either their in-depth understanding of a particular analysis technique (sophisticated method) or their breadth in multiple relevant techniques. For instance, the analysis should not be limited to calculating the correlation coefficient between different variables.
(15) The student demonstrates clear understand of errors/uncertainties in the analysis and discusses the underlying physical phenomena in light of the analysis results and error estimates.
(20) The written report should be free of major grammatical errors, have a coherent structure (logical procession of ideas), and include abstract, introduction, analysis, conclusions, and a list of references (bibliography). Any figures should be clearly legible with proper labels, lines, fonts, and captions.
Suggested report length: 8-12 pages (double spaced (not counting figures and references), Times New Roman, 12pt). The report must be your own work and writing. Plagiarism will not be tolerated. Please check out these web instructions if you are unsure how to properly credit published and unpublished sources: http://isites.harvard.edu/icb/icb.do?keyword=k70847&tabgroupid=icb.tabgroup106849.<br>
slide22. Bangladesh r=-.9935, p=0.0000, rlow= -.9971, rhigh= -.9853<br>
slide23. India<br>