
Global Procurement - Supplier Quality Introduction
EM
Published · 134 slides · 0 views

1 / 1





Description
Global Procurement - Supplier Quality Introduction to MSA Lise Robert SQS (Supplier Quality Specialist) Rev. 01 Dec 17th 2018 Introduction to Measurement System Analysis (MSA) Everyday our lives are being impacted by more and more data.
Related Topics
Share
Embed code
Download this presentation From Below
"Global Procurement - Supplier Quality Introduction" is the property of its rightful owner. Permission is granted to download and print the materials on this website for personal, non-commercial use only, and to display it on your personal computer provided you do not modify the materials and that you retain all copyright notices contained in the materials. By downloading content from our website, you accept the terms of this agreement.
Presentation Transcript
01
Global Procurement - Supplier Quality
Introduction to MSA Lise Robert SQS (Supplier Quality Specialist)
Rev. 01 – Dec 17th 2018<br>
Rev. 01 – Dec 17th 2018<br>
02
Introduction to Measurement System Analysis (MSA) Everyday our lives are being impacted by more and more data. We have become a data driven society.
In business and industry, we are using data in more ways than ever before.
Today manufacturing companies gather massive amounts of information through measurement and inspection. When this measurement data is being used to make decisions regarding the process and the business in general it is vital that the data is accurate. If there are errors in our measurement system we will be making decisions based on incorrect data. We could be making incorrect decisions or producing non-conforming parts. A properly planned and executed Measurement System Analysis (MSA) can help build a strong foundation for any data based decision making process. 2<br>
In business and industry, we are using data in more ways than ever before.
Today manufacturing companies gather massive amounts of information through measurement and inspection. When this measurement data is being used to make decisions regarding the process and the business in general it is vital that the data is accurate. If there are errors in our measurement system we will be making decisions based on incorrect data. We could be making incorrect decisions or producing non-conforming parts. A properly planned and executed Measurement System Analysis (MSA) can help build a strong foundation for any data based decision making process. 2<br>
03
What is Measurement System Analysis (MSA) MSA is defined as an experimental and mathematical method of determining the amount of variation that exists within a measurement process. Variation in the measurement process can directly contribute to our overall process variability. MSA is used to certify the measurement system for use by evaluating the system’s accuracy, precision and stability. 3<br>
04
What is a Measurement System? Before we dive further into MSA, we should review the definition of a measurement system and some of the common sources of variation. A measurement system has been described as a system of related measures that enables the quantification of particular characteristics. It can also include a collection of gages, fixtures, software and personnel required to validate a particular unit of measure or make an assessment of the feature or characteristic being measured. 4<br>
05
What is a Measurement System? Variation
Think of Measurement as a
Process 5<br>
Process 5<br>
06
What is a Measurement System? Measurement
The assignment of numbers to material things to represent the relationships among them with respect to particular properties.
C. Eisenhart (1963) 6<br>
The assignment of numbers to material things to represent the relationships among them with respect to particular properties.
C. Eisenhart (1963) 6<br>
07
What is a Measurement System? The sources of variation in a measurement process can include the following:
Process – test method, specification
Personnel – the operators, their skill level, training, etc.
Tools / Equipment – gages, fixtures, test equipment used and their associated calibration systems
Items to be measured – the part or material samples measured, the sampling plan, etc.
Environmental factors – temperature, humidity, etc. 7<br>
Process – test method, specification
Personnel – the operators, their skill level, training, etc.
Tools / Equipment – gages, fixtures, test equipment used and their associated calibration systems
Items to be measured – the part or material samples measured, the sampling plan, etc.
Environmental factors – temperature, humidity, etc. 7<br>
08
What is a Measurement System? All of these possible sources of variation should be considered during Measurement System Analysis. Evaluation of a measurement system should include the use of specific quality tools to identify the most likely source of variation. Most MSA activities examine two primary sources of variation, the parts and the measurement of those parts. The sum of these two values represents the total variation in a measurement system. 8<br>
09
Why Perform Measurement System Analysis (MSA) An effective MSA process can help assure that the data being collected is accurate and the system of collecting the data is appropriate to the process.
Good reliable data can prevent wasted time, labor and scrap in a manufacturing process. 9<br>
Good reliable data can prevent wasted time, labor and scrap in a manufacturing process. 9<br>
10
Why Perform Measurement System Analysis (MSA) A major manufacturing company began receiving calls from several of their customers reporting non-compliant materials received at their facilities sites. The parts were not properly snapping together to form an even surface or would not lock in place.
The process was audited and found that the parts were being produced out of spec. The operator was following the inspection plan and using the assigned gages for the inspection. The problem was that the gage did not have adequate resolution to detect the non-conforming parts.
An ineffective measurement system can allow bad parts to be accepted and good parts to be rejected, resulting in dissatisfied customers and excessive scrap. MSA could have prevented the problem and assured that accurate useful data was being collected.. Example 10<br>
The process was audited and found that the parts were being produced out of spec. The operator was following the inspection plan and using the assigned gages for the inspection. The problem was that the gage did not have adequate resolution to detect the non-conforming parts.
An ineffective measurement system can allow bad parts to be accepted and good parts to be rejected, resulting in dissatisfied customers and excessive scrap. MSA could have prevented the problem and assured that accurate useful data was being collected.. Example 10<br>
11
How to Perform Measurement System Analysis (MSA) MSA is a collection of experiments and analysis performed to evaluate a measurement system’s capability, performance and amount of uncertainty regarding the values measured. We should review the measurement data being collected, the methods and tools used to collect and record the data.
Our goal is to quantify the effectiveness of the measurement system, analyze the variation in the data and determine its likely source. We need to evaluate the quality of the data being collected in regards to location and width variation. Data collected should be evaluated for bias, stability and linearity. 11<br>
Our goal is to quantify the effectiveness of the measurement system, analyze the variation in the data and determine its likely source. We need to evaluate the quality of the data being collected in regards to location and width variation. Data collected should be evaluated for bias, stability and linearity. 11<br>
12
How to Perform Measurement System Analysis (MSA) During an MSA activity, the amount of measurement uncertainty must be evaluated for each type of gage or measurement tool defined within the process Control Plans.
Each tool should have the correct level of discrimination and resolution to obtain useful data. The process, the tools being used (gages, fixtures, instruments, etc.) and the operators are evaluated for proper definition, accuracy, precision, repeatability and reproducibility. 12<br>
Each tool should have the correct level of discrimination and resolution to obtain useful data. The process, the tools being used (gages, fixtures, instruments, etc.) and the operators are evaluated for proper definition, accuracy, precision, repeatability and reproducibility. 12<br>
13
How to Perform Measurement System Analysis (MSA) Data Classifications
Prior to analyzing the data and or the gages, tools or fixtures, we must determine the type of data being collected. The data could be attribute data or variable data.
Attribute data is classified into specific values where variable or continuous data can have an infinite number of values. 13<br>
Prior to analyzing the data and or the gages, tools or fixtures, we must determine the type of data being collected. The data could be attribute data or variable data.
Attribute data is classified into specific values where variable or continuous data can have an infinite number of values. 13<br>
14
How to Perform Measurement System Analysis (MSA) The Master Sample
To perform a study, you should first obtain a sample and establish the reference value compared to a traceable standard. Some processes will already have “master samples” established for the high and low end of the expected measurement specification. 14<br>
To perform a study, you should first obtain a sample and establish the reference value compared to a traceable standard. Some processes will already have “master samples” established for the high and low end of the expected measurement specification. 14<br>
15
How to Perform Measurement System Analysis (MSA) The Gage R&R Study
For gages or instruments used to collect variable continuous data, Gage Repeatability and Reproducibility (Gage R & R) can be performed to evaluate the level of uncertainty within a measurement system. 15<br>
For gages or instruments used to collect variable continuous data, Gage Repeatability and Reproducibility (Gage R & R) can be performed to evaluate the level of uncertainty within a measurement system. 15<br>
16
How to Perform Measurement System Analysis (MSA) To perform a Gage R & R, first select the gage to be evaluated.
Then perform the following steps:
Obtain at least 10 random samples of parts manufactured during a regular production run
Choose three operators that regularly perform the particular inspection
Have each of the operators measure the sample parts and record the data
Repeat the measurement process three times with each operator using the same parts
Calculate the average (mean) readings and the range of the trial averages for each of the operators
Calculate the difference of each operator’s averages, average range and the range of measurements for each sample part used in the study
Calculate repeatability to determine the amount of equipment variation
Calculate reproducibility to determine the amount of variation introduced by the operators
Calculate the variation in the parts and total variation percentages 16<br>
Then perform the following steps:
Obtain at least 10 random samples of parts manufactured during a regular production run
Choose three operators that regularly perform the particular inspection
Have each of the operators measure the sample parts and record the data
Repeat the measurement process three times with each operator using the same parts
Calculate the average (mean) readings and the range of the trial averages for each of the operators
Calculate the difference of each operator’s averages, average range and the range of measurements for each sample part used in the study
Calculate repeatability to determine the amount of equipment variation
Calculate reproducibility to determine the amount of variation introduced by the operators
Calculate the variation in the parts and total variation percentages 16<br>
17
How to Perform Measurement System Analysis (MSA) The resulting Gage R & R percentage is used as a basis for accepting the gage. Guidelines for making the determination are found below:
The measurement system is acceptable if the Gage R & R score falls below 10%
The measurement system may be determined acceptable depending upon the relative importance of the application or other factors if the Gage R & R falls between 10% to 20%
Any measurement system with Gage R & R greater than 30% requires action to improve
Any actions identified to improve the measurement system should be evaluated for effectiveness 17<br>
The measurement system is acceptable if the Gage R & R score falls below 10%
The measurement system may be determined acceptable depending upon the relative importance of the application or other factors if the Gage R & R falls between 10% to 20%
Any measurement system with Gage R & R greater than 30% requires action to improve
Any actions identified to improve the measurement system should be evaluated for effectiveness 17<br>
18
How to Perform Measurement System Analysis (MSA) When interpreting the results of a Gage R & R, perform a comparison study of the repeatability and reproducibility values.
If the repeatability value is large in comparison to the reproducibility value, it would indicate a possible issue with the gage used for the study.
The gage may need to be replaced or re-calibrated.
Adversely, if the reproducibility value is large in comparison with the repeatability value, it would indicate the variation is operator related.
The operator may need additional training on the proper use of the gage or a fixture may be required to assist the operator in using the gage. 18<br>
If the repeatability value is large in comparison to the reproducibility value, it would indicate a possible issue with the gage used for the study.
The gage may need to be replaced or re-calibrated.
Adversely, if the reproducibility value is large in comparison with the repeatability value, it would indicate the variation is operator related.
The operator may need additional training on the proper use of the gage or a fixture may be required to assist the operator in using the gage. 18<br>
19
How to Perform Measurement System Analysis (MSA) Gage R & R studies shall be conducted under any of the following circumstances:
Whenever a new or different measurement system is introduced
Following any improvement activities
When a different type of measurement system is introduced
Following any improvement activities performed on the current measurement system due to the results of a previous Gage R & R study
Annually in alignment with set calibration schedule of the gage 19<br>
Whenever a new or different measurement system is introduced
Following any improvement activities
When a different type of measurement system is introduced
Following any improvement activities performed on the current measurement system due to the results of a previous Gage R & R study
Annually in alignment with set calibration schedule of the gage 19<br>
20
How to Perform Measurement System Analysis (MSA) Attribute Gage R & R
Attribute measurement systems can be analyzed using a similar method. Measurement uncertainty of attribute gages shall be calculated using shorter method as below:
Determine the gage to be studied
Obtain 10 random samples from a regular production run
Select 2 different operators who perform the particular inspection activity regularly
Have the operators perform the inspection two times for each of the sample parts and record the data
Next, calculate the kappa value.
When the kappa value is greater than 0.6, the gage is deemed acceptable
If not, the gage may need to be replaced or calibrated 20<br>
Attribute measurement systems can be analyzed using a similar method. Measurement uncertainty of attribute gages shall be calculated using shorter method as below:
Determine the gage to be studied
Obtain 10 random samples from a regular production run
Select 2 different operators who perform the particular inspection activity regularly
Have the operators perform the inspection two times for each of the sample parts and record the data
Next, calculate the kappa value.
When the kappa value is greater than 0.6, the gage is deemed acceptable
If not, the gage may need to be replaced or calibrated 20<br>
21
How to Perform Measurement System Analysis (MSA) Attribute Gage R & R
The attribute gage study should be performed based on the same criteria listed previously for the Gage R & R study.
During MSA, the Gage R&R or the attribute gage study should be completed on each of the gages, instruments or fixtures used in the measurement system. The results should be documented and stored in a database for future reference. It may be required for a PPAP submission to the customer.
Furthermore, if any issues should arise, a new study can be performed on the gage and the results compared to the previous data to determine if a change has occurred. A properly performed MSA can have a dramatic influence on the quality of data being collected and product quality. 21<br>
The attribute gage study should be performed based on the same criteria listed previously for the Gage R & R study.
During MSA, the Gage R&R or the attribute gage study should be completed on each of the gages, instruments or fixtures used in the measurement system. The results should be documented and stored in a database for future reference. It may be required for a PPAP submission to the customer.
Furthermore, if any issues should arise, a new study can be performed on the gage and the results compared to the previous data to determine if a change has occurred. A properly performed MSA can have a dramatic influence on the quality of data being collected and product quality. 21<br>
22
Key terms and definitions Attribute data – Data that can be counted for recording and analysis (sometimes referred to as go/ no go data)
Variable data – Data that can be measured; data that has a value that can vary from one sample to the next; continuous variable data can have an infinite number of values
Bias – Difference between the average or mean observed value and the target value
Stability – A change in the measurement bias over a period of time
A stable process would be considered in “statistical control”
Linearity – A change in bias value within the range of normal process operation
Resolution – Smallest unit of measure of a selected tool gage or instrument; the sensitivity of the measurement system to process variation for a particular characteristic being measured 22<br>
Variable data – Data that can be measured; data that has a value that can vary from one sample to the next; continuous variable data can have an infinite number of values
Bias – Difference between the average or mean observed value and the target value
Stability – A change in the measurement bias over a period of time
A stable process would be considered in “statistical control”
Linearity – A change in bias value within the range of normal process operation
Resolution – Smallest unit of measure of a selected tool gage or instrument; the sensitivity of the measurement system to process variation for a particular characteristic being measured 22<br>
23
Key terms and definitions Accuracy – The closeness of the data to the target or exact value or to an accepted reference value
Precision – How close a set of measurements are to each other
Repeatability – A measure of the effectiveness of the tool being used; the variation of measurements obtained by a single operator using the same tool to measure the same characteristic
Reproducibility – A measure of the operator variation; the variation in a set of data collected by different operators using the same tool to measure the same part characteristic 23<br>
Precision – How close a set of measurements are to each other
Repeatability – A measure of the effectiveness of the tool being used; the variation of measurements obtained by a single operator using the same tool to measure the same characteristic
Reproducibility – A measure of the operator variation; the variation in a set of data collected by different operators using the same tool to measure the same part characteristic 23<br>
24
Key terms and definitions Accuracy – The closeness of the data to the target or exact value or to an accepted reference value
Precision – How close a set of measurements are to each other
Repeatability – A measure of the effectiveness of the tool being used; the variation of measurements obtained by a single operator using the same tool to measure the same characteristic
Reproducibility – A measure of the operator variation; the variation in a set of data collected by different operators using the same tool to measure the same part characteristic 24<br>
Precision – How close a set of measurements are to each other
Repeatability – A measure of the effectiveness of the tool being used; the variation of measurements obtained by a single operator using the same tool to measure the same characteristic
Reproducibility – A measure of the operator variation; the variation in a set of data collected by different operators using the same tool to measure the same part characteristic 24<br>
25
Measurement Systems
Analysis 25<br>
26
Measurement Systems Analysis Basic Concepts of Measurement Systems
A Process
Statistics and the Analysis of Measurement Systems
Conducting a Measurement Systems Analysis
ISO - TC 69 is the Statistics Group
Ensures high ‘Data Quality’ (Think of Bias) 26<br>
A Process
Statistics and the Analysis of Measurement Systems
Conducting a Measurement Systems Analysis
ISO - TC 69 is the Statistics Group
Ensures high ‘Data Quality’ (Think of Bias) 26<br>
27
Course Focus & Flow Measurement as a Process
Mechanical Aspects (vs Destructive)
Piece part
Continuous (fabric)
Features of a Measurement System
Methods of Analysis
Gauge R&R Studies
Special Gauging Situations
Go/No-Go
Destructive Tests 27<br>
Mechanical Aspects (vs Destructive)
Piece part
Continuous (fabric)
Features of a Measurement System
Methods of Analysis
Gauge R&R Studies
Special Gauging Situations
Go/No-Go
Destructive Tests 27<br>
28
Place Timeline Here 28<br>
29
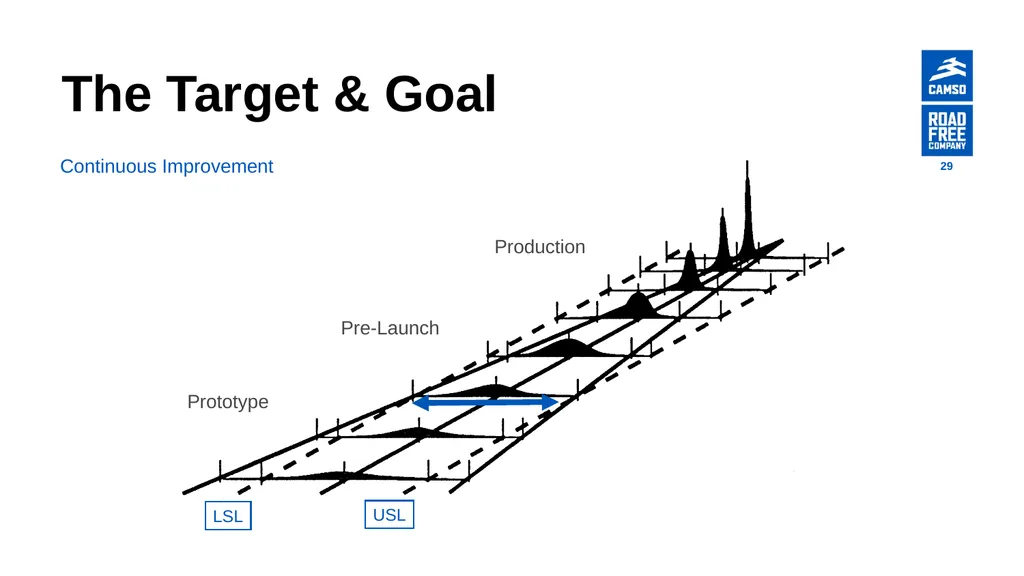
The Target & Goal Prototype Pre-Launch Production USL LSL Continuous Improvement 29<br>
30
Key Words Discrimination
Ability to tell things apart
Bias [per AIAG] (Accuracy)
Repeatability [per AIAG] (Precision)
Reproducibility
Linearity
Stability 30<br>
Ability to tell things apart
Bias [per AIAG] (Accuracy)
Repeatability [per AIAG] (Precision)
Reproducibility
Linearity
Stability 30<br>
31
Terminology Error ≠ Mistake
Error ≠ Uncertainty
Percentage Error ≠ Percentage Uncertainty
Accuracy ≠ Precision 31<br>
Error ≠ Uncertainty
Percentage Error ≠ Percentage Uncertainty
Accuracy ≠ Precision 31<br>
32
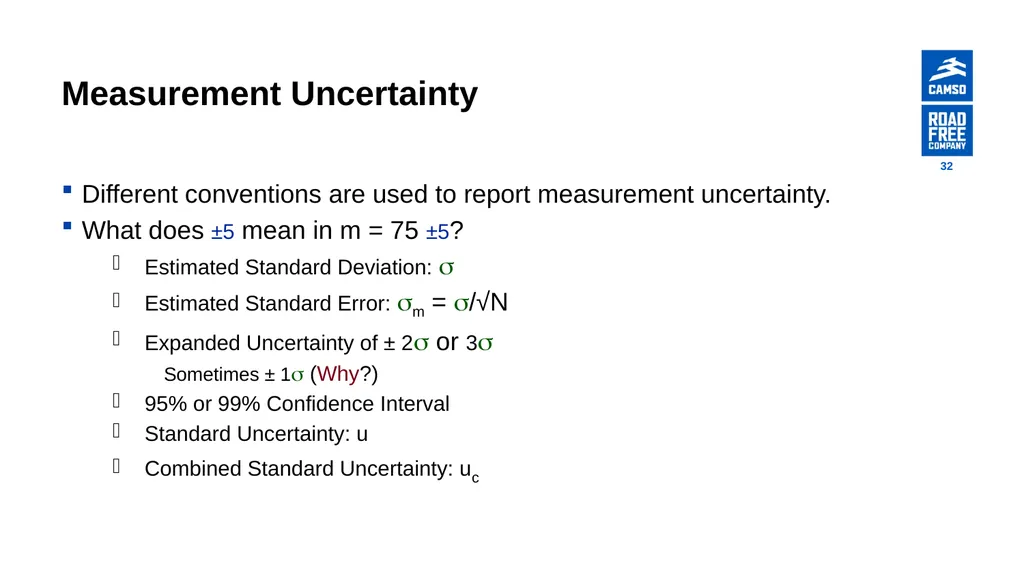
Measurement Uncertainty Different conventions are used to report measurement uncertainty.
What does ±5 mean in m = 75 ±5?
Estimated Standard Deviation:
Estimated Standard Error: m = /√N
Expanded Uncertainty of ± 2 or 3
Sometimes ± 1 (Why?)
95% or 99% Confidence Interval
Standard Uncertainty: u
Combined Standard Uncertainty: uc 32<br>
What does ±5 mean in m = 75 ±5?
Estimated Standard Deviation:
Estimated Standard Error: m = /√N
Expanded Uncertainty of ± 2 or 3
Sometimes ± 1 (Why?)
95% or 99% Confidence Interval
Standard Uncertainty: u
Combined Standard Uncertainty: uc 32<br>
33
Measurement Uncertainty Typical Reports
Physici 33<br>
Physici 33<br>
34
Measurement as a Process Basic Concepts
Components of the Measurement System
Requirements of a Measurement System
Factors Affecting a Measurement System
Characteristics of a Measurement System
Features (Qualities) of a Measurement Number
Units (Scale)
Accuracy
Precision (Consistency or Repeatability)
Resolution (Reproducibility) 34<br>
Components of the Measurement System
Requirements of a Measurement System
Factors Affecting a Measurement System
Characteristics of a Measurement System
Features (Qualities) of a Measurement Number
Units (Scale)
Accuracy
Precision (Consistency or Repeatability)
Resolution (Reproducibility) 34<br>
35
Measurement Related Systems Typical Experiences with
Measurement Systems 35<br>
Measurement Systems 35<br>
36
Basic Concepts Every Process Produces a “Product”
Every Product Possesses Qualities (Features)
Every Quality Feature Can Be Measured
Total Variation
= Product Variation + Measurement Variation
Some Variation Inherent in System Design
Some Variation is Due to a Faulty Performance of the System(s) 36<br>
Every Product Possesses Qualities (Features)
Every Quality Feature Can Be Measured
Total Variation
= Product Variation + Measurement Variation
Some Variation Inherent in System Design
Some Variation is Due to a Faulty Performance of the System(s) 36<br>
37
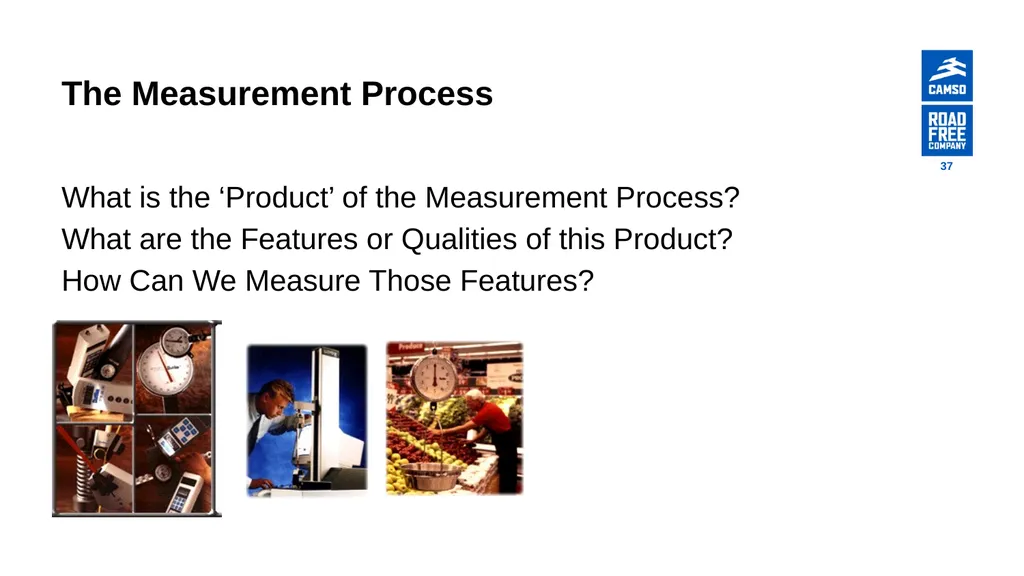
The Measurement Process What is the ‘Product’ of the Measurement Process?
What are the Features or Qualities of this Product?
How Can We Measure Those Features? 37<br>
What are the Features or Qualities of this Product?
How Can We Measure Those Features? 37<br>
38
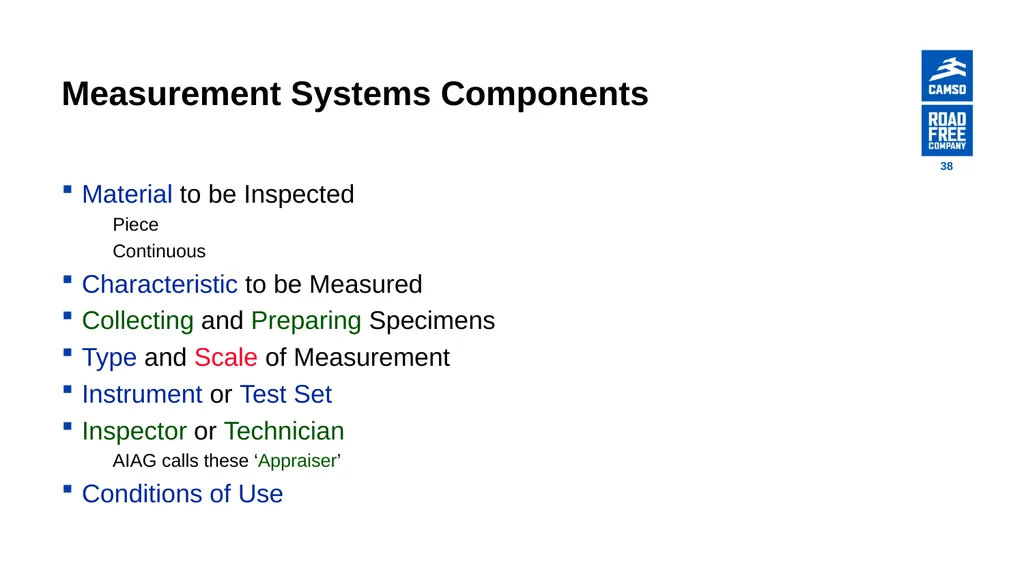
Measurement Systems Components Material to be Inspected
Piece
Continuous
Characteristic to be Measured
Collecting and Preparing Specimens
Type and Scale of Measurement
Instrument or Test Set
Inspector or Technician
AIAG calls these ‘Appraiser’
Conditions of Use 38<br>
Piece
Continuous
Characteristic to be Measured
Collecting and Preparing Specimens
Type and Scale of Measurement
Instrument or Test Set
Inspector or Technician
AIAG calls these ‘Appraiser’
Conditions of Use 38<br>
39
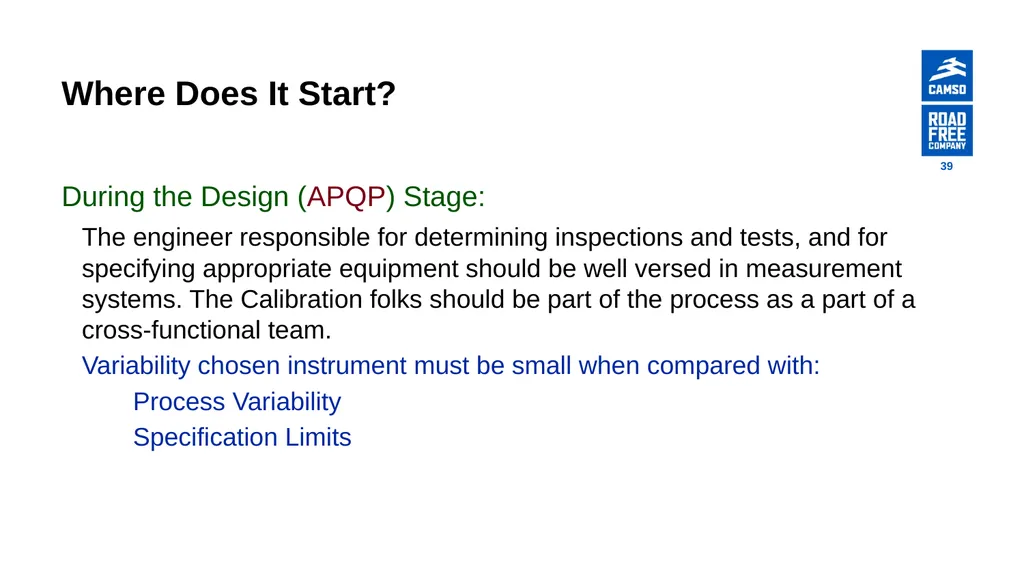
Where Does It Start? During the Design (APQP) Stage:
The engineer responsible for determining inspections and tests, and for specifying appropriate equipment should be well versed in measurement systems. The Calibration folks should be part of the process as a part of a cross-functional team.
Variability chosen instrument must be small when compared with:
Process Variability
Specification Limits 39<br>
The engineer responsible for determining inspections and tests, and for specifying appropriate equipment should be well versed in measurement systems. The Calibration folks should be part of the process as a part of a cross-functional team.
Variability chosen instrument must be small when compared with:
Process Variability
Specification Limits 39<br>
40
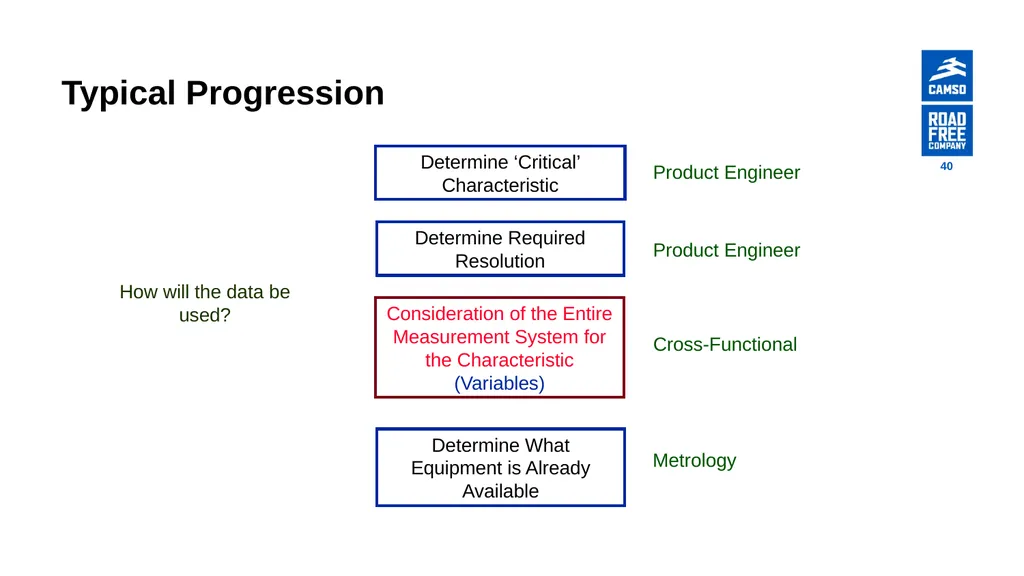
Typical Progression Determine ‘Critical’ Characteristic Determine What Equipment is Already Available Determine Required Resolution Consideration of the Entire Measurement System for the Characteristic
(Variables) Cross-Functional Product Engineer Product Engineer Metrology How will the data be used? 40<br>
(Variables) Cross-Functional Product Engineer Product Engineer Metrology How will the data be used? 40<br>
41
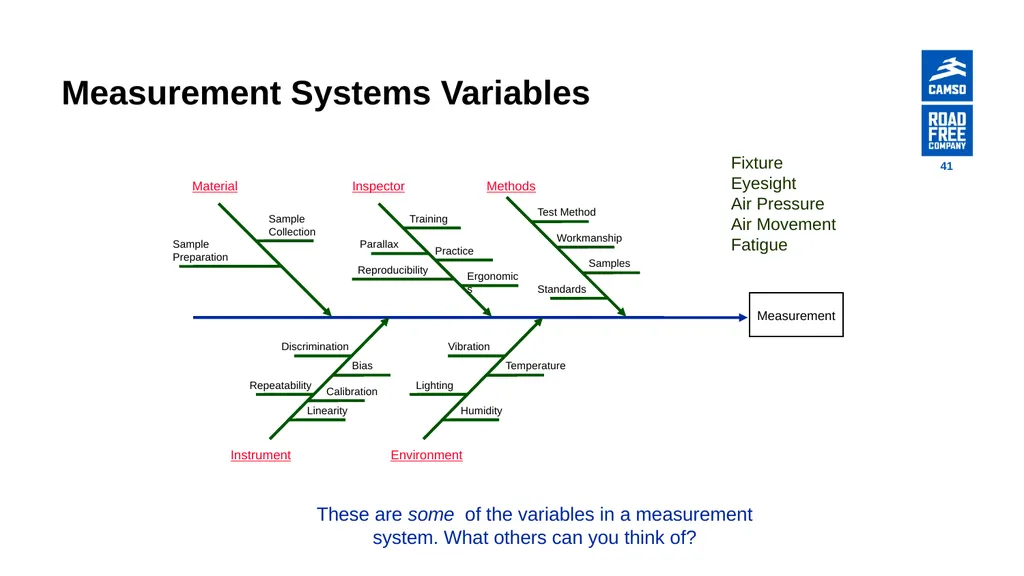
Measurement Systems Variables These are some of the variables in a measurement system. What others can you think of? Fixture
Eyesight
Air Pressure
Air Movement
Fatigue 41<br>
Eyesight
Air Pressure
Air Movement
Fatigue 41<br>
42
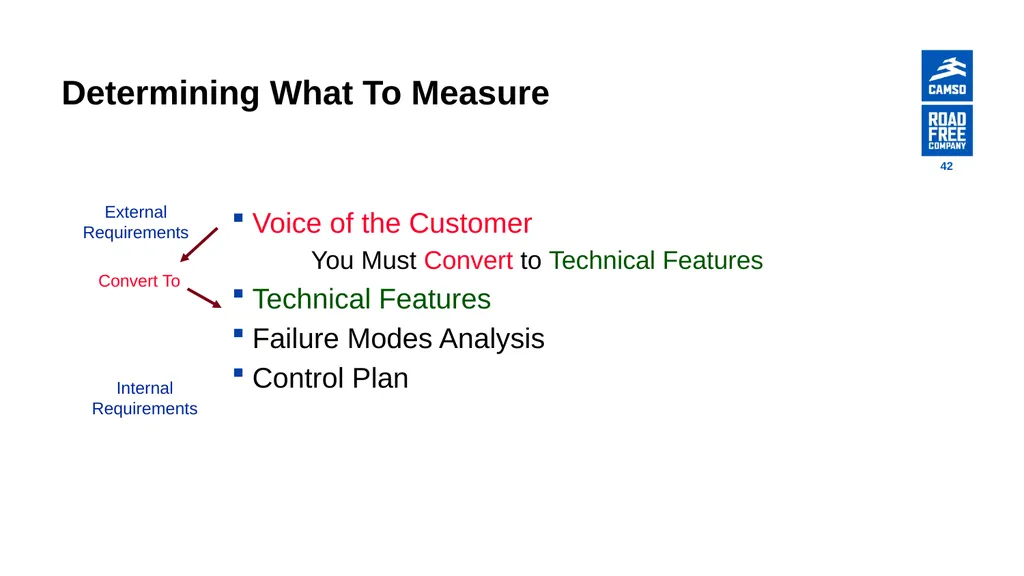
Determining What To Measure Voice of the Customer
You Must Convert to Technical Features
Technical Features
Failure Modes Analysis
Control Plan Convert To External Requirements Internal Requirements 42<br>
You Must Convert to Technical Features
Technical Features
Failure Modes Analysis
Control Plan Convert To External Requirements Internal Requirements 42<br>
43
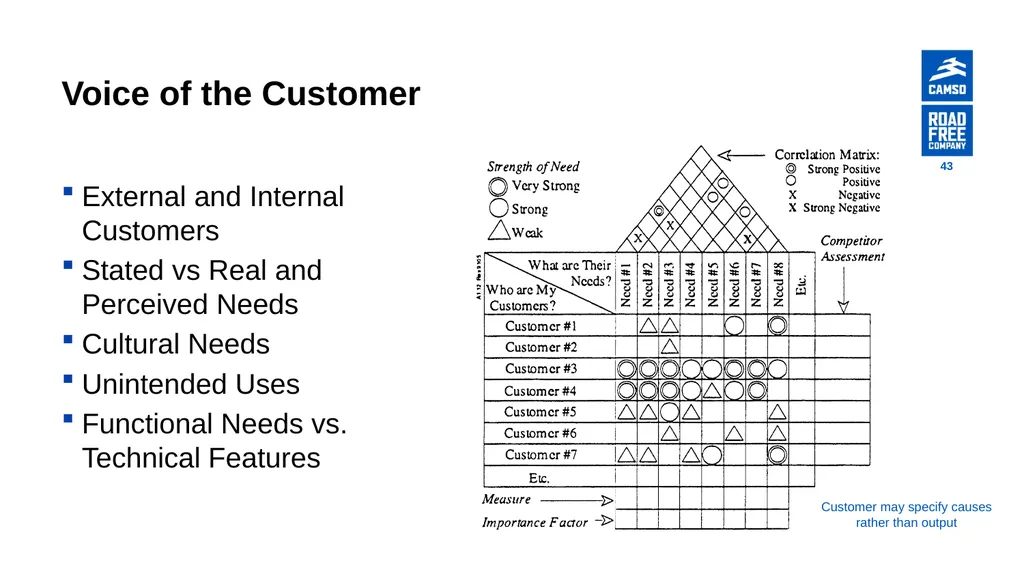
Voice of the Customer External and Internal Customers
Stated vs Real and Perceived Needs
Cultural Needs
Unintended Uses
Functional Needs vs. Technical Features Customer may specify causes rather than output 43<br>
Stated vs Real and Perceived Needs
Cultural Needs
Unintended Uses
Functional Needs vs. Technical Features Customer may specify causes rather than output 43<br>
44
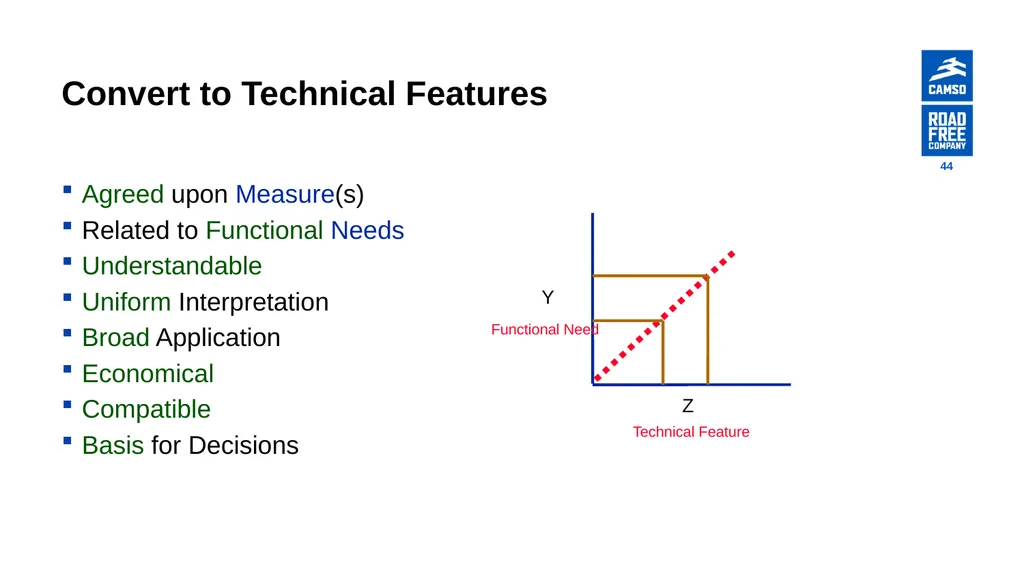
Convert to Technical Features Agreed upon Measure(s)
Related to Functional Needs
Understandable
Uniform Interpretation
Broad Application
Economical
Compatible
Basis for Decisions Y Z Technical Feature Functional Need 44<br>
Related to Functional Needs
Understandable
Uniform Interpretation
Broad Application
Economical
Compatible
Basis for Decisions Y Z Technical Feature Functional Need 44<br>
45
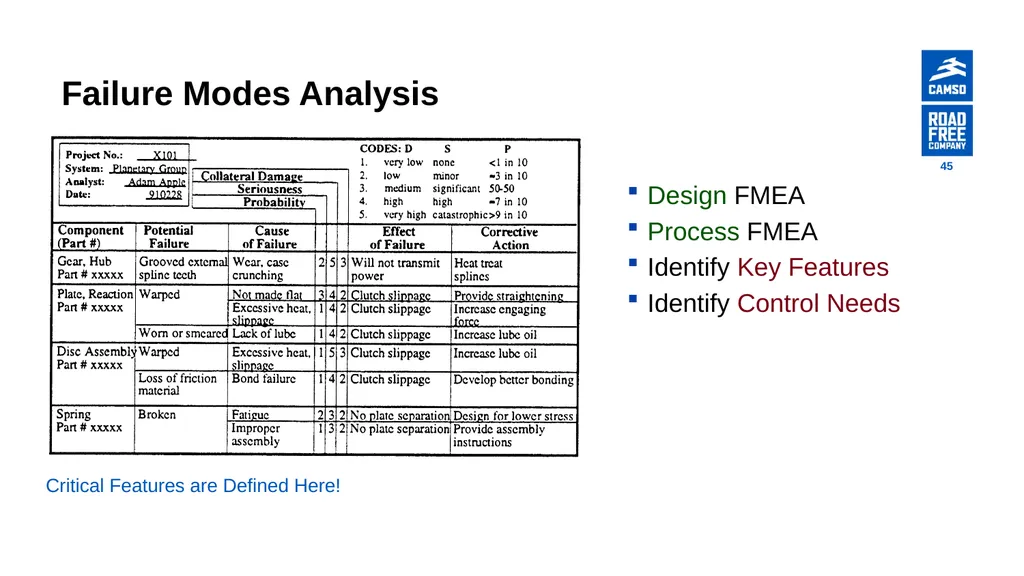
Failure Modes Analysis Design FMEA
Process FMEA
Identify Key Features
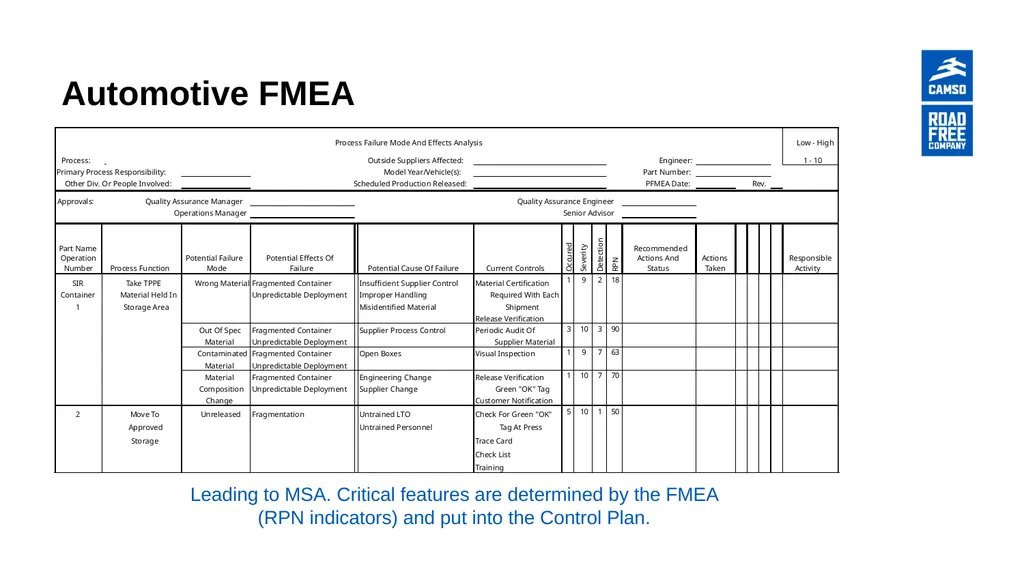
Identify Control Needs Critical Features are Defined Here! 45<br>
Process FMEA
Identify Key Features
Identify Control Needs Critical Features are Defined Here! 45<br>
46
Automotive FMEA Leading to MSA. Critical features are determined by the FMEA (RPN indicators) and put into the Control Plan.<br>
47
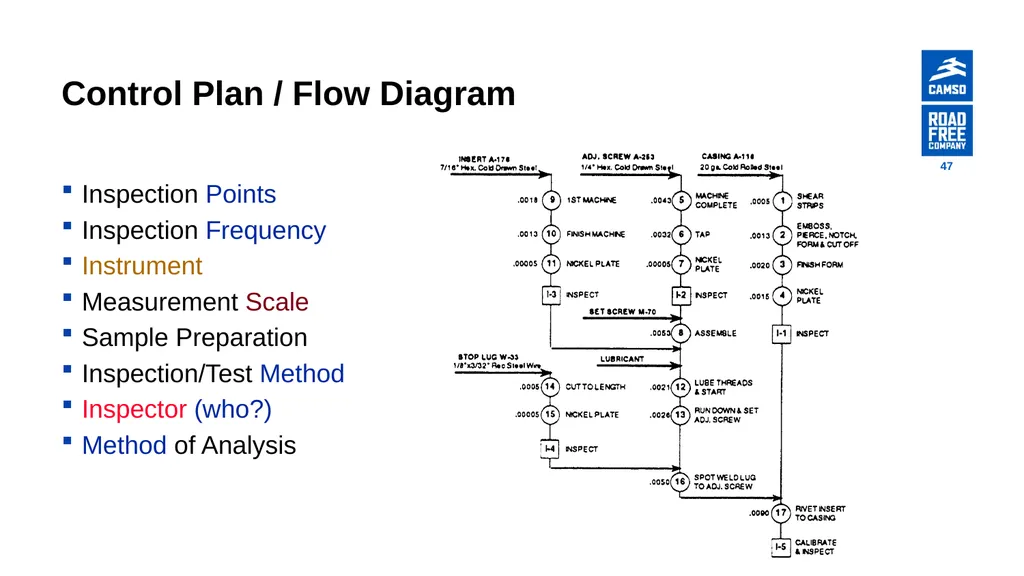
Control Plan / Flow Diagram Inspection Points
Inspection Frequency
Instrument
Measurement Scale
Sample Preparation
Inspection/Test Method
Inspector (who?)
Method of Analysis 47<br>
Inspection Frequency
Instrument
Measurement Scale
Sample Preparation
Inspection/Test Method
Inspector (who?)
Method of Analysis 47<br>
48
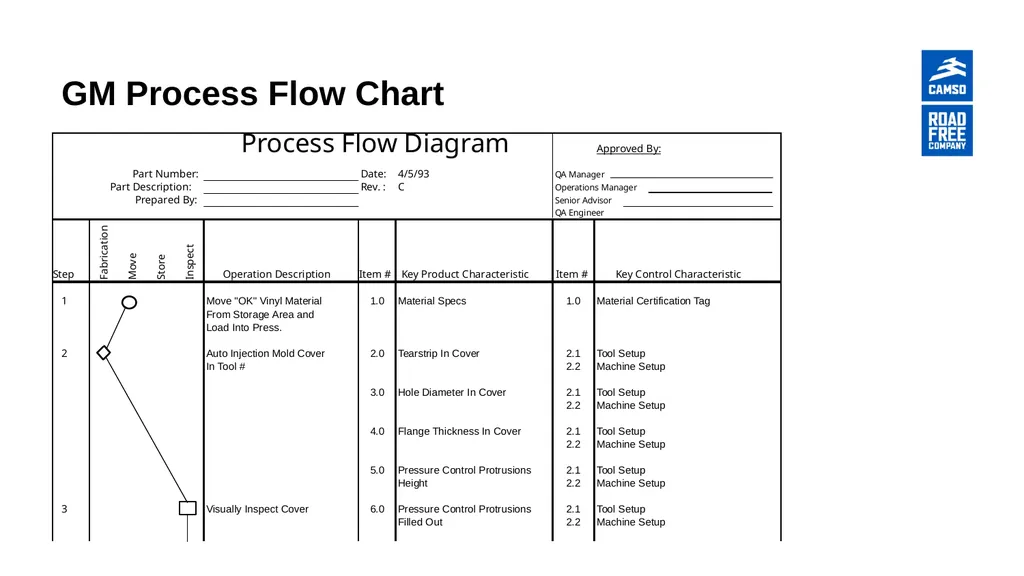
GM Process Flow Chart<br>
49
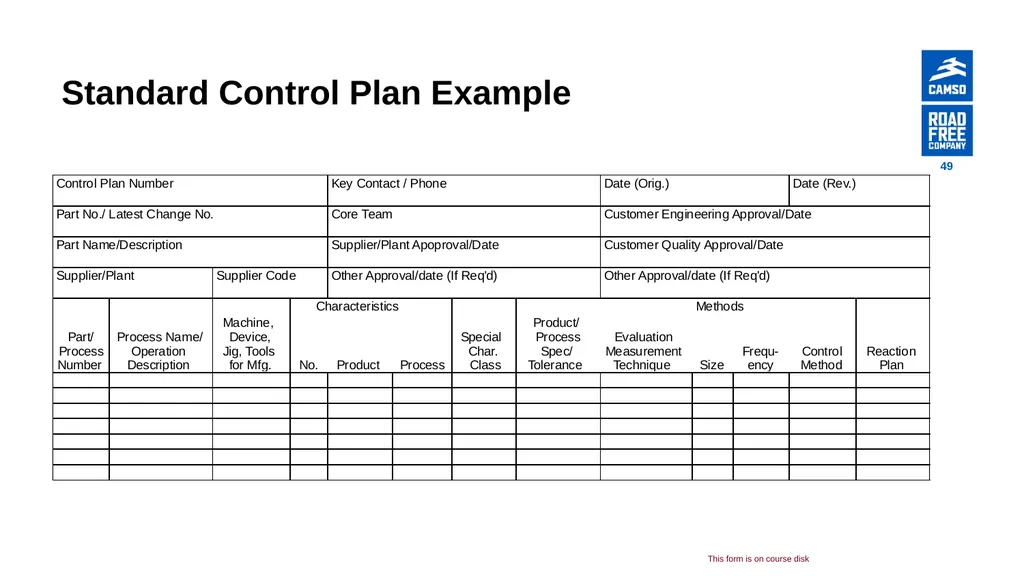
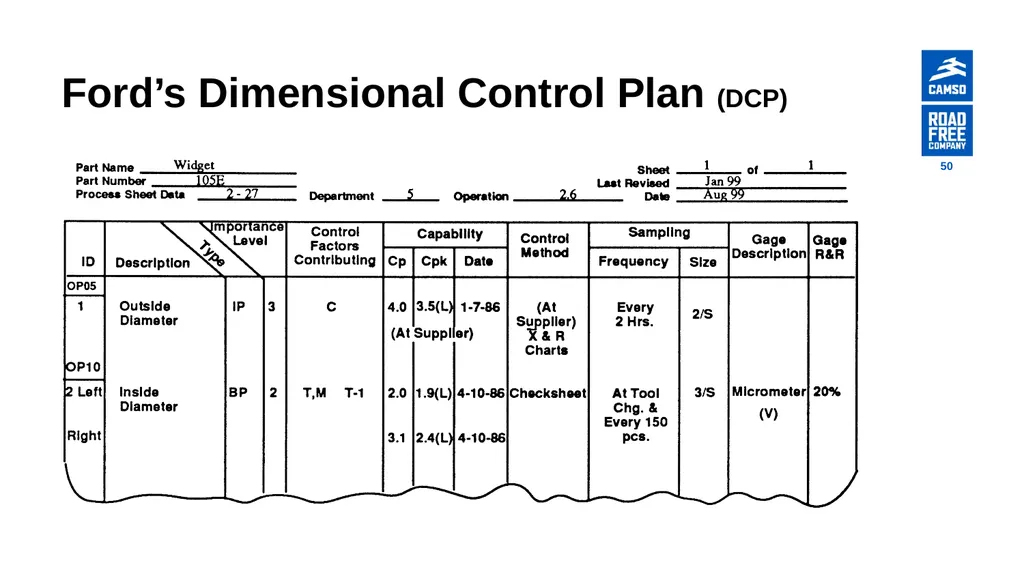
Standard Control Plan Example This form is on course disk 49<br>
50
Ford’s Dimensional Control Plan (DCP) 50<br>
51
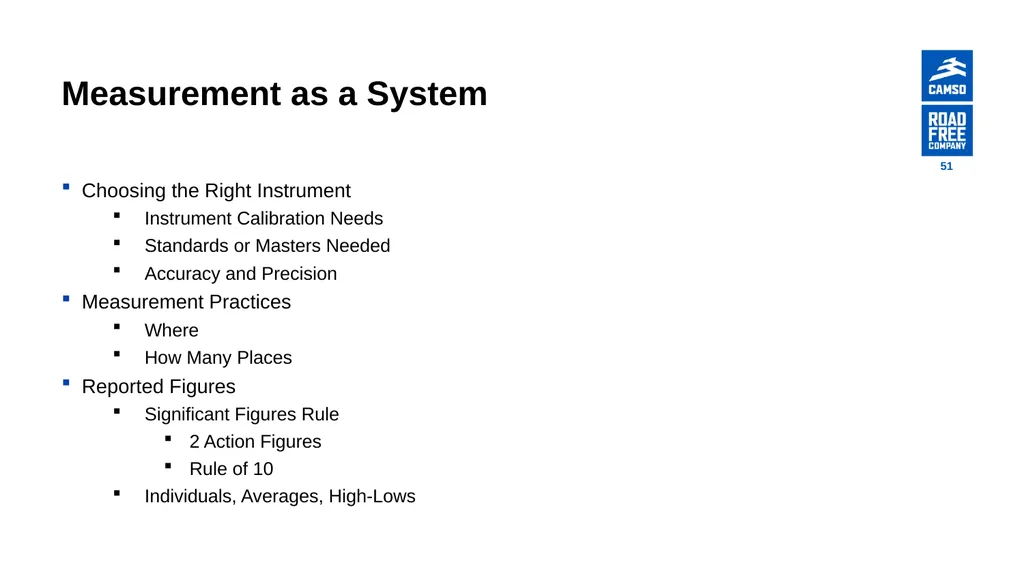
Measurement as a System Choosing the Right Instrument
Instrument Calibration Needs
Standards or Masters Needed
Accuracy and Precision
Measurement Practices
Where
How Many Places
Reported Figures
Significant Figures Rule
2 Action Figures
Rule of 10
Individuals, Averages, High-Lows 51<br>
Instrument Calibration Needs
Standards or Masters Needed
Accuracy and Precision
Measurement Practices
Where
How Many Places
Reported Figures
Significant Figures Rule
2 Action Figures
Rule of 10
Individuals, Averages, High-Lows 51<br>
52
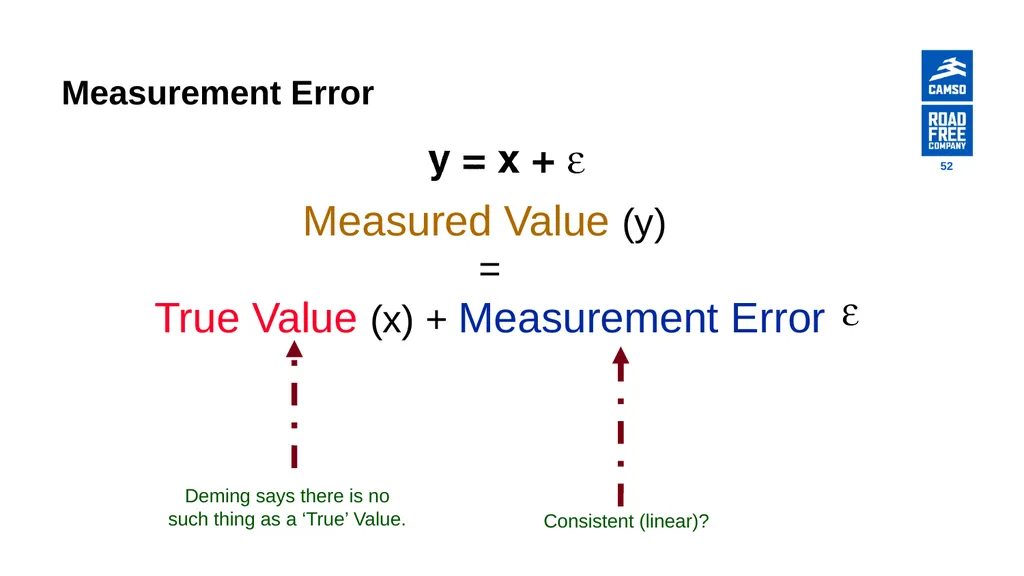
Measurement Error Measured Value (y)
=
True Value (x) + Measurement Error Deming says there is no such thing as a ‘True’ Value. Consistent (linear)? 52<br>
=
True Value (x) + Measurement Error Deming says there is no such thing as a ‘True’ Value. Consistent (linear)? 52<br>
53
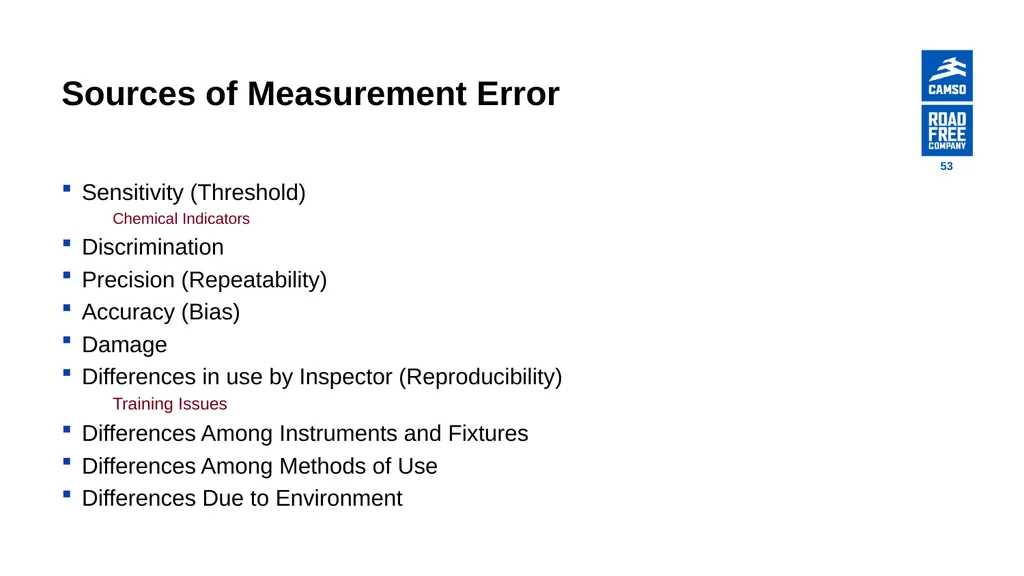
Sources of Measurement Error Sensitivity (Threshold)
Chemical Indicators
Discrimination
Precision (Repeatability)
Accuracy (Bias)
Damage
Differences in use by Inspector (Reproducibility)
Training Issues
Differences Among Instruments and Fixtures
Differences Among Methods of Use
Differences Due to Environment 53<br>
Chemical Indicators
Discrimination
Precision (Repeatability)
Accuracy (Bias)
Damage
Differences in use by Inspector (Reproducibility)
Training Issues
Differences Among Instruments and Fixtures
Differences Among Methods of Use
Differences Due to Environment 53<br>
54
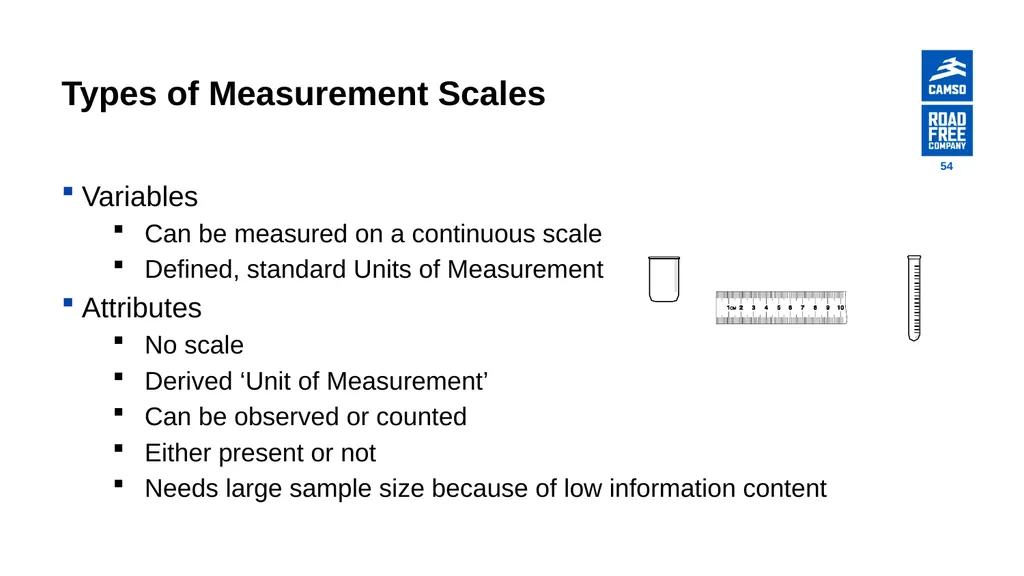
Types of Measurement Scales Variables
Can be measured on a continuous scale
Defined, standard Units of Measurement
Attributes
No scale
Derived ‘Unit of Measurement’
Can be observed or counted
Either present or not
Needs large sample size because of low information content 54<br>
Can be measured on a continuous scale
Defined, standard Units of Measurement
Attributes
No scale
Derived ‘Unit of Measurement’
Can be observed or counted
Either present or not
Needs large sample size because of low information content 54<br>
55
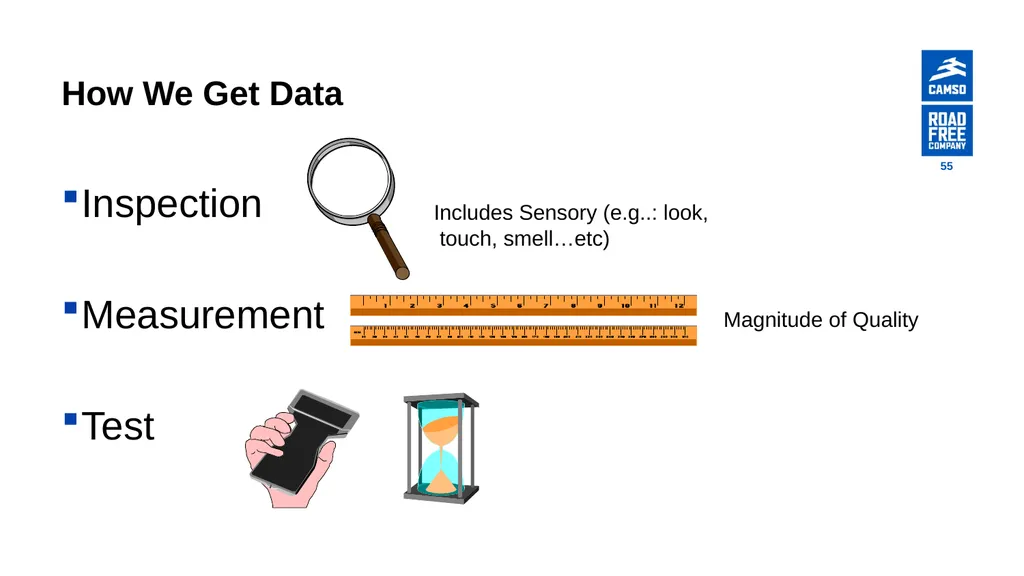
How We Get Data Inspection
Measurement
Test Includes Sensory (e.g..: look,
touch, smell…etc) Magnitude of Quality 55<br>
Measurement
Test Includes Sensory (e.g..: look,
touch, smell…etc) Magnitude of Quality 55<br>
56
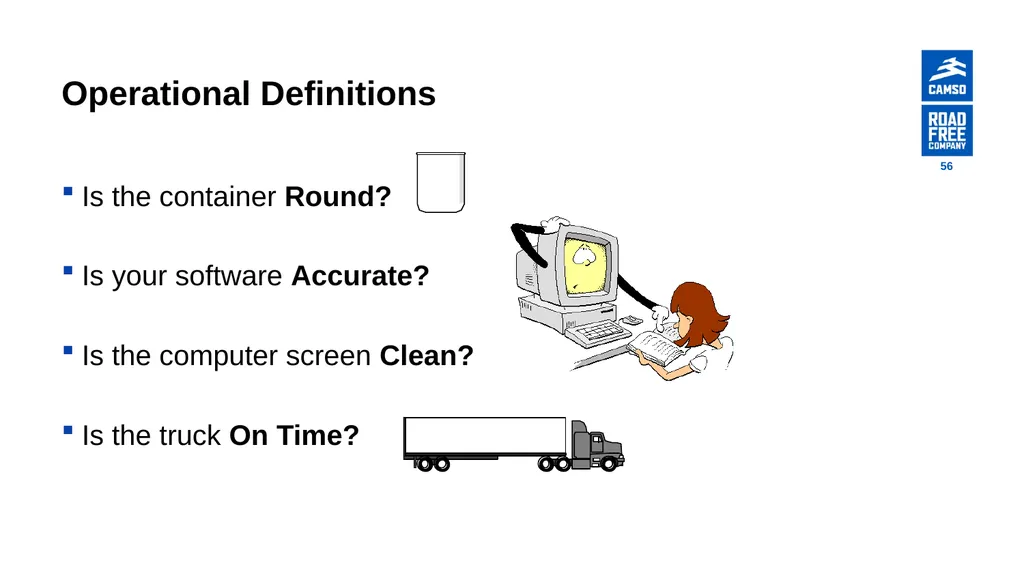
Operational Definitions Is the container Round?
Is your software Accurate?
Is the computer screen Clean?
Is the truck On Time? 56<br>
Is your software Accurate?
Is the computer screen Clean?
Is the truck On Time? 56<br>
57
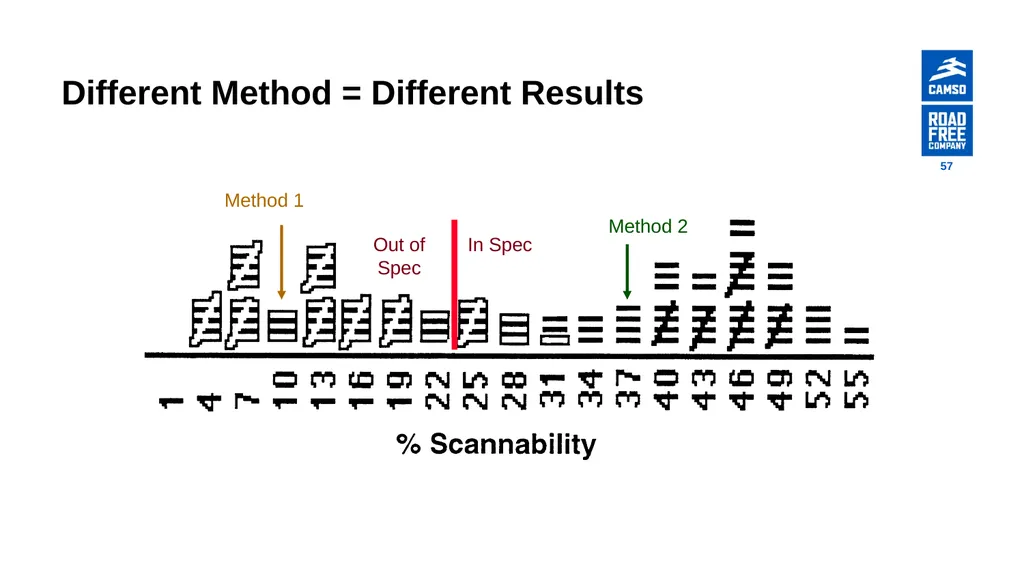
Different Method = Different Results In Spec Out of Spec Method 1 Method 2 57<br>
58
Measurement System Variability Small with respect to Process Variation
Small with respect to Specified Requirements
Must be in Statistical Control
Measurement IS a Process!
Free of Assignable Causes of variation 58<br>
Small with respect to Specified Requirements
Must be in Statistical Control
Measurement IS a Process!
Free of Assignable Causes of variation 58<br>
59
Studying the Measurement System Environmental Factors
Human Factors
System Features
Measurement Studies 59<br>
Human Factors
System Features
Measurement Studies 59<br>
60
Environmental Factors Temperature
Humidity
Vibration
Lighting
Corrosion
Wear
Contaminants
Oil & Grease
Aerosols Where is the study performed?
1. Lab?
2. Where used?
3. Both? 60<br>
Humidity
Vibration
Lighting
Corrosion
Wear
Contaminants
Oil & Grease
Aerosols Where is the study performed?
1. Lab?
2. Where used?
3. Both? 60<br>
61
Human Factors Training
Skills
Fatigue
Boredom
Eyesight
Comfort
Complexity of Part
Speed of Inspection (parts per hour)
Misunderstood Instructions 61<br>
Skills
Fatigue
Boredom
Eyesight
Comfort
Complexity of Part
Speed of Inspection (parts per hour)
Misunderstood Instructions 61<br>
62
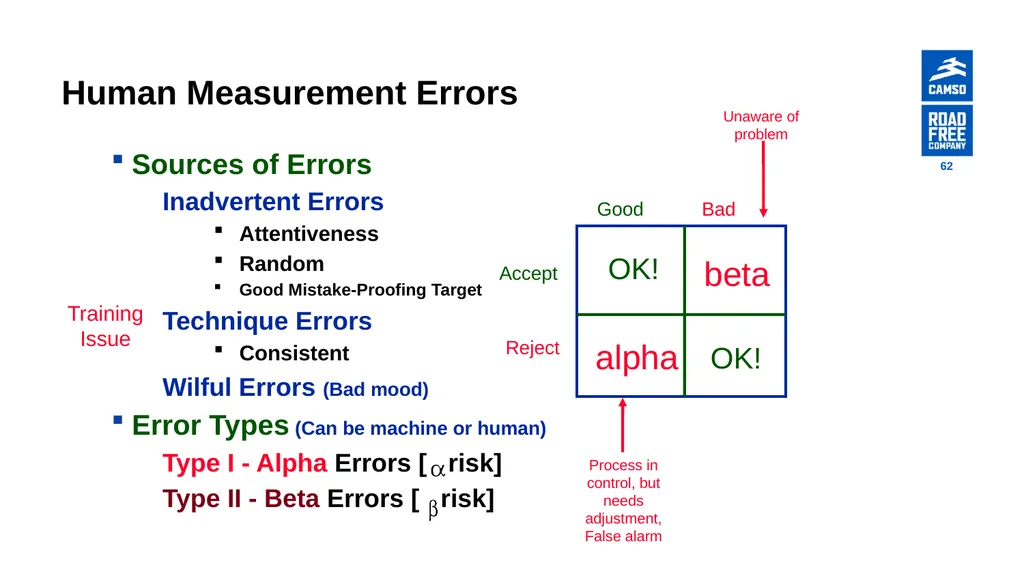
Human Measurement Errors Sources of Errors
Inadvertent Errors
Attentiveness
Random
Good Mistake-Proofing Target
Technique Errors
Consistent
Wilful Errors (Bad mood)
Error Types (Can be machine or human)
Type I - Alpha Errors [ risk]
Type II - Beta Errors [ risk] Accept Reject Good Bad OK! OK! alpha beta Training Issue Process in control, but needs adjustment, False alarm Unaware of problem 62<br>
Inadvertent Errors
Attentiveness
Random
Good Mistake-Proofing Target
Technique Errors
Consistent
Wilful Errors (Bad mood)
Error Types (Can be machine or human)
Type I - Alpha Errors [ risk]
Type II - Beta Errors [ risk] Accept Reject Good Bad OK! OK! alpha beta Training Issue Process in control, but needs adjustment, False alarm Unaware of problem 62<br>
63
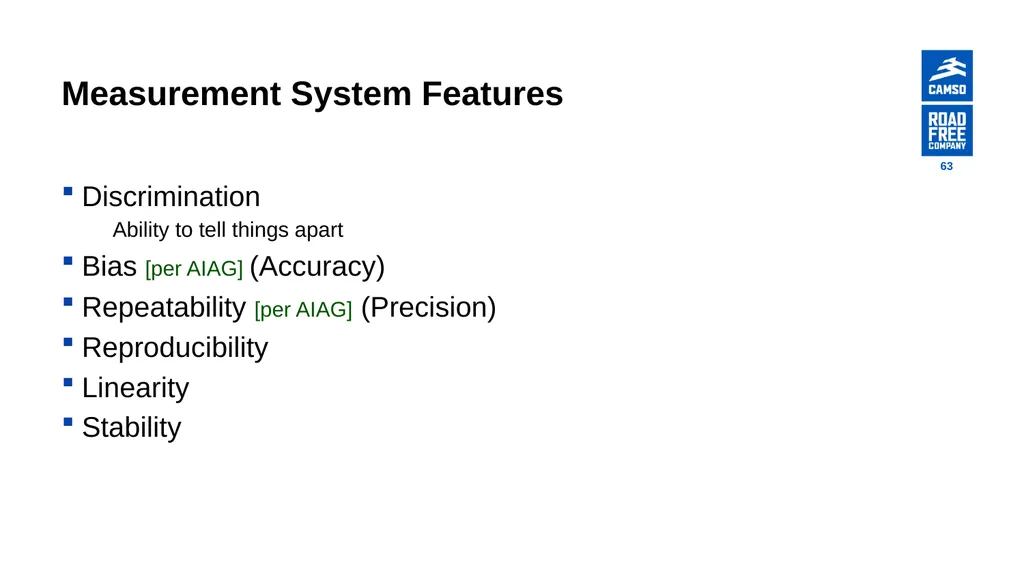
Measurement System Features Discrimination
Ability to tell things apart
Bias [per AIAG] (Accuracy)
Repeatability [per AIAG] (Precision)
Reproducibility
Linearity
Stability 63<br>
Ability to tell things apart
Bias [per AIAG] (Accuracy)
Repeatability [per AIAG] (Precision)
Reproducibility
Linearity
Stability 63<br>
64
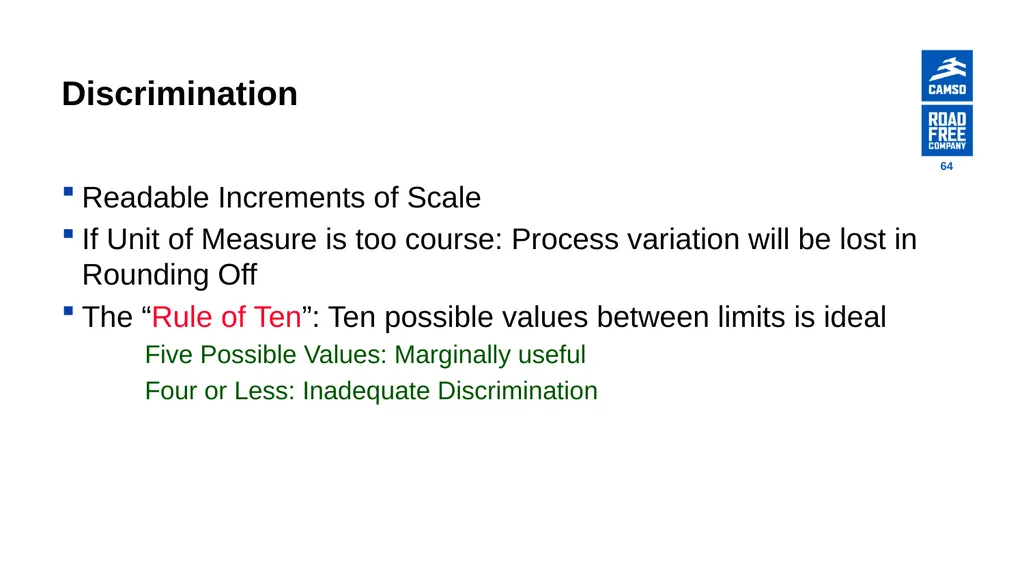
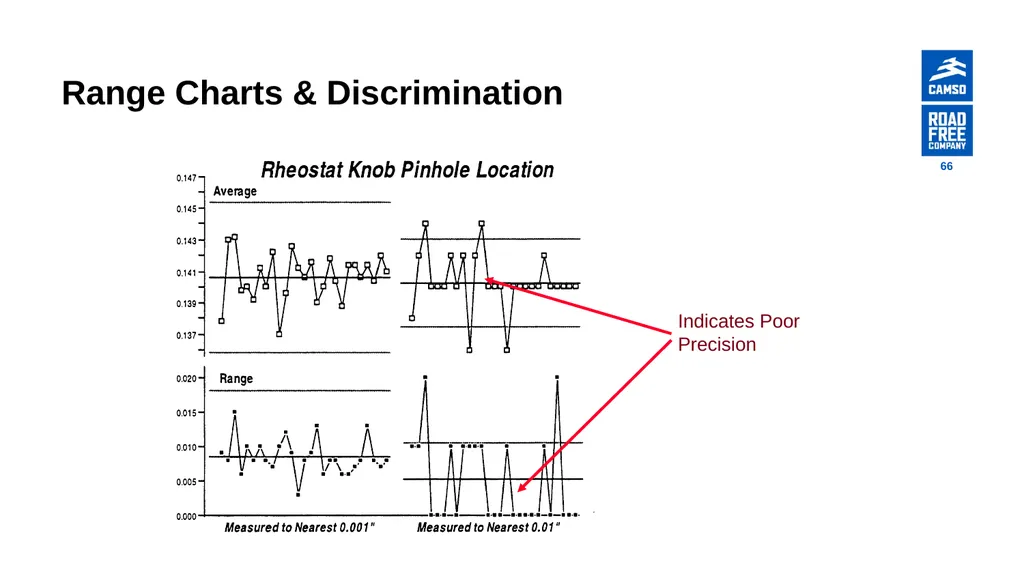
Discrimination Readable Increments of Scale
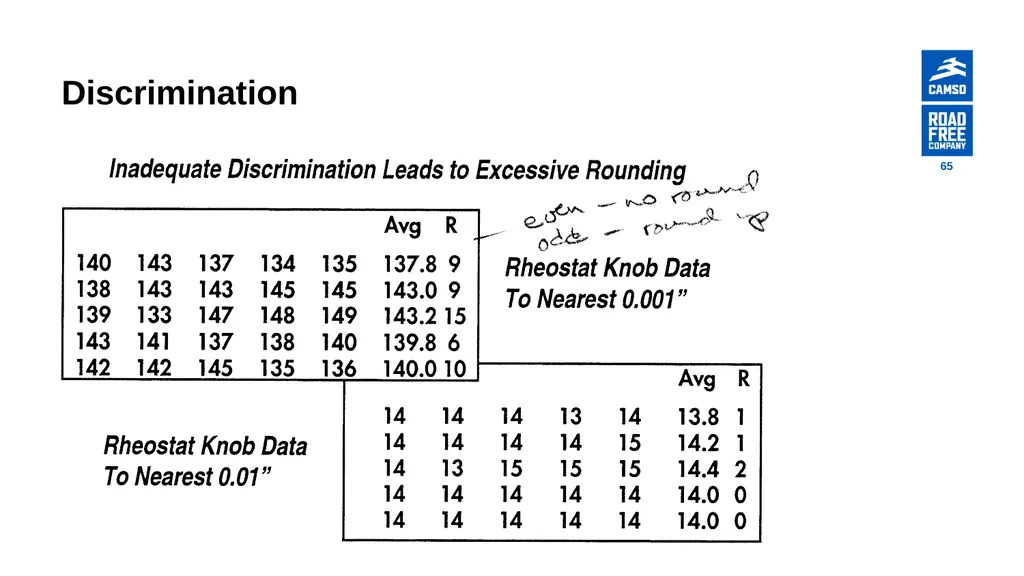
If Unit of Measure is too course: Process variation will be lost in Rounding Off
The “Rule of Ten”: Ten possible values between limits is ideal
Five Possible Values: Marginally useful
Four or Less: Inadequate Discrimination 64<br>
If Unit of Measure is too course: Process variation will be lost in Rounding Off
The “Rule of Ten”: Ten possible values between limits is ideal
Five Possible Values: Marginally useful
Four or Less: Inadequate Discrimination 64<br>
65
Discrimination 65<br>
66
Range Charts & Discrimination 66<br>
67
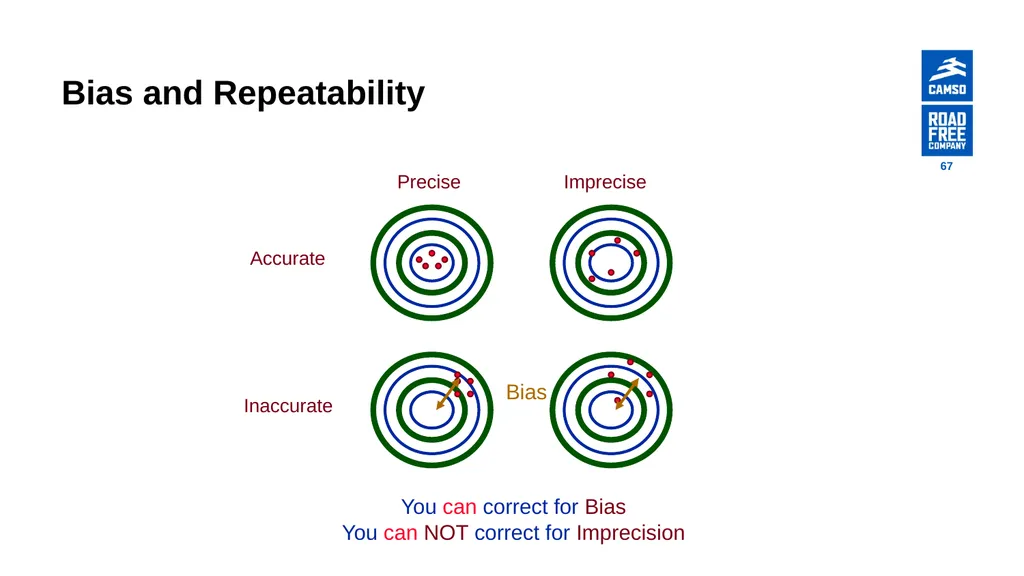
Bias and Repeatability Precise Imprecise Accurate Inaccurate Bias You can correct for Bias
You can NOT correct for Imprecision 67<br>
You can NOT correct for Imprecision 67<br>
68
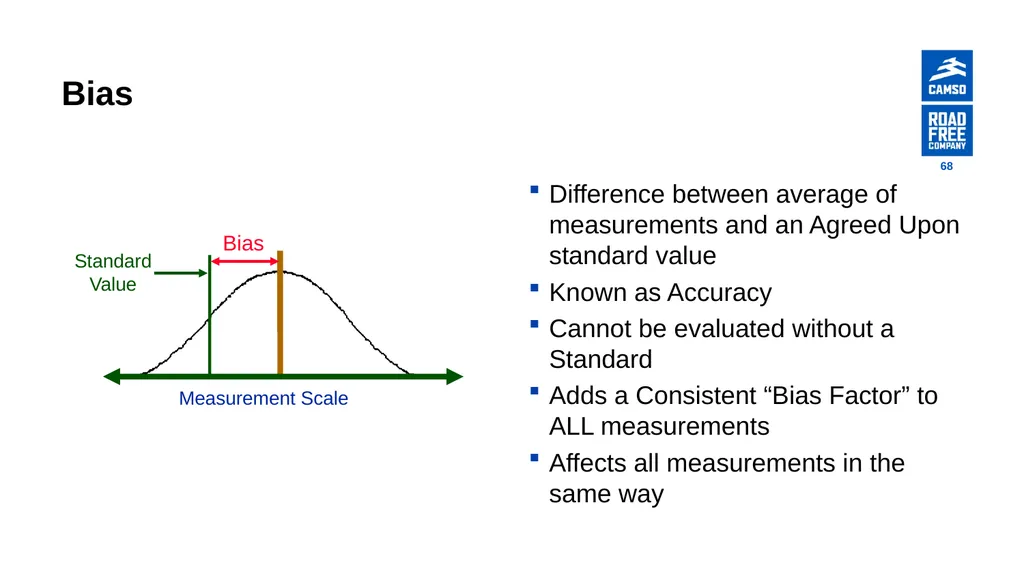
Bias Difference between average of measurements and an Agreed Upon standard value
Known as Accuracy
Cannot be evaluated without a Standard
Adds a Consistent “Bias Factor” to ALL measurements
Affects all measurements in the same way Standard
Value Measurement Scale Bias 68<br>
Known as Accuracy
Cannot be evaluated without a Standard
Adds a Consistent “Bias Factor” to ALL measurements
Affects all measurements in the same way Standard
Value Measurement Scale Bias 68<br>
69
Causes of Bias Error in Master
Worn components
Instrument improperly calibrated
Instrument damaged
Instrument improperly used
Instrument read incorrectly
Part set incorrectly (wrong datum) 69<br>
Worn components
Instrument improperly calibrated
Instrument damaged
Instrument improperly used
Instrument read incorrectly
Part set incorrectly (wrong datum) 69<br>
70
Bias Bias - The difference between the observed Average of measurements and the master Average of the same parts using precision instruments. (MSA Manual Glossary)
The auditor may want evidence that the concept of bias is understood. Remember that bias is basically an offset from ‘zero’. Bias is linked to Stability in the sense that an instrument may be ‘zeroed’ during calibration verification. Knowing this we deduce that the bias changes with instrument use. This is in part the concept of Drift. 70<br>
The auditor may want evidence that the concept of bias is understood. Remember that bias is basically an offset from ‘zero’. Bias is linked to Stability in the sense that an instrument may be ‘zeroed’ during calibration verification. Knowing this we deduce that the bias changes with instrument use. This is in part the concept of Drift. 70<br>
71
Bias I choose a caliper (resolution 0.01) for the measurement. I measure a set of parts and derive the average.
I take the same parts and measure them with a micrometer (resolution 0.001). I then derive the average.
I compare the two averages. The difference is the Bias. 71<br>
I take the same parts and measure them with a micrometer (resolution 0.001). I then derive the average.
I compare the two averages. The difference is the Bias. 71<br>
72
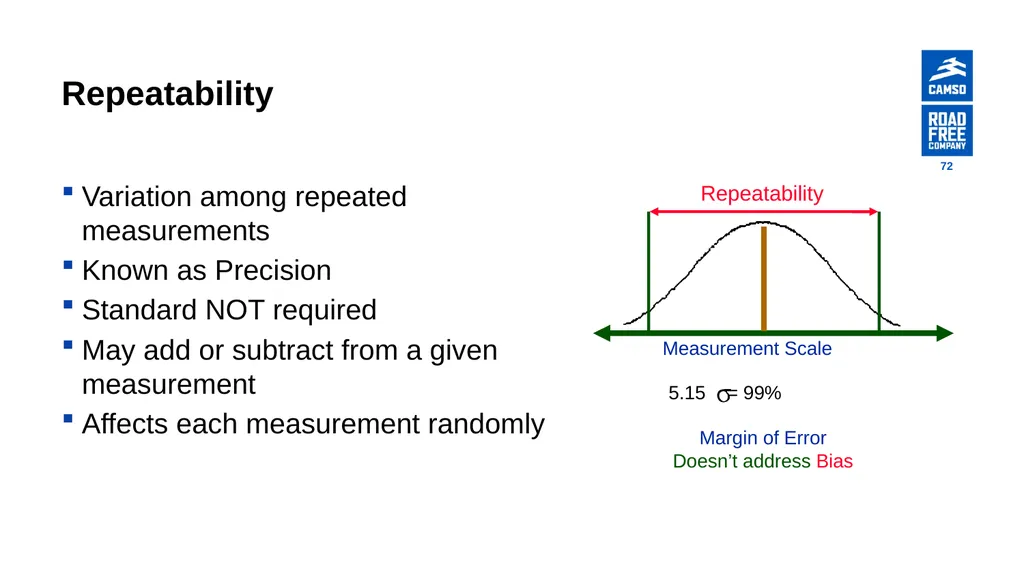
Repeatability Variation among repeated measurements
Known as Precision
Standard NOT required
May add or subtract from a given measurement
Affects each measurement randomly Measurement Scale Repeatability Margin of Error
Doesn’t address Bias 5.15 = 99% 72<br>
Known as Precision
Standard NOT required
May add or subtract from a given measurement
Affects each measurement randomly Measurement Scale Repeatability Margin of Error
Doesn’t address Bias 5.15 = 99% 72<br>
73
Repeatability Issues Measurement Steps
Sample preparation
Setting up the instrument
Locating on the part
How much of the measurement process should we repeat? 73<br>
Sample preparation
Setting up the instrument
Locating on the part
How much of the measurement process should we repeat? 73<br>
74
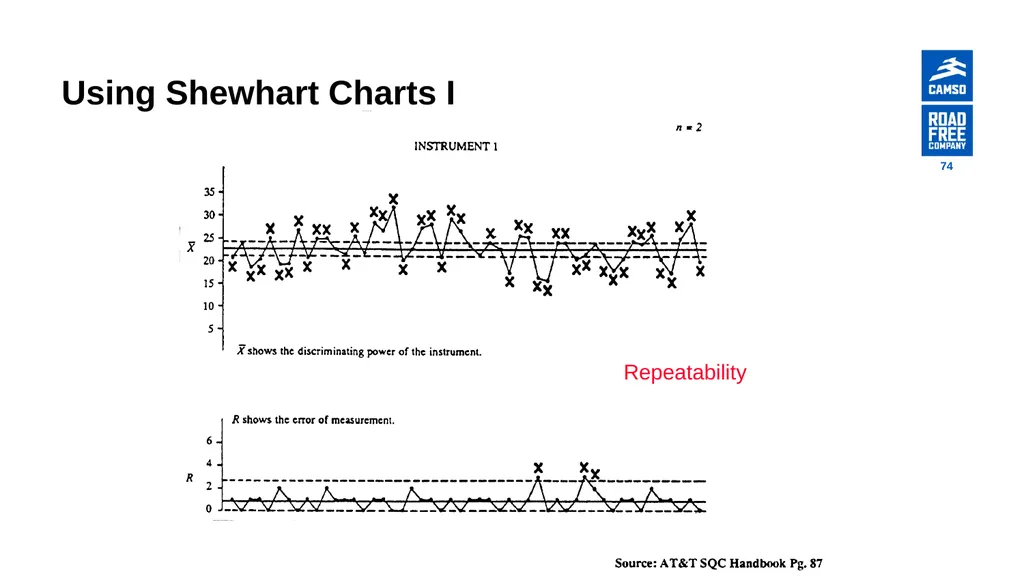
Using Shewhart Charts I Repeatability 74<br>
75
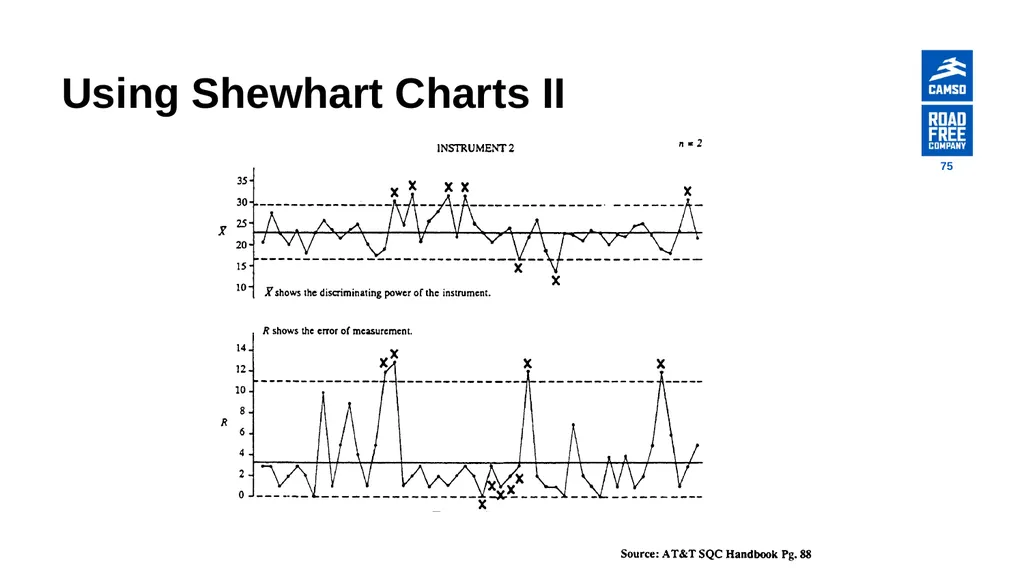
Using Shewhart Charts II 75<br>
76
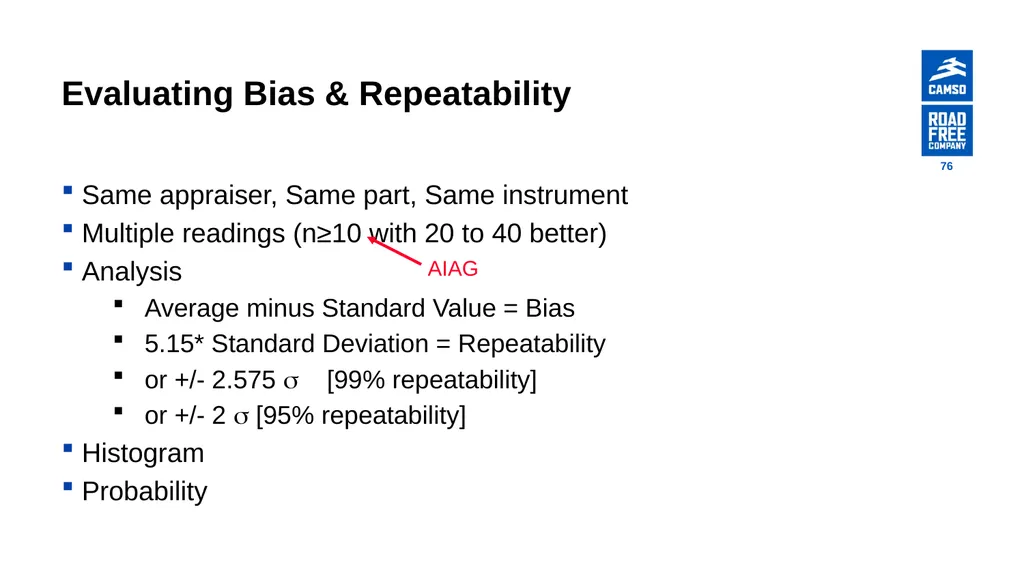
Evaluating Bias & Repeatability Same appraiser, Same part, Same instrument
Multiple readings (n≥10 with 20 to 40 better)
Analysis
Average minus Standard Value = Bias
5.15* Standard Deviation = Repeatability
or +/- 2.575 [99% repeatability]
or +/- 2 [95% repeatability]
Histogram
Probability AIAG 76<br>
Multiple readings (n≥10 with 20 to 40 better)
Analysis
Average minus Standard Value = Bias
5.15* Standard Deviation = Repeatability
or +/- 2.575 [99% repeatability]
or +/- 2 [95% repeatability]
Histogram
Probability AIAG 76<br>
77
Repeatability Issues Making a measurement may involve numerous steps
Sample preparation
Setting up the instrument
Locating the part, etc.
How much of the measurement process should we repeat? How far do we go? 77<br>
Sample preparation
Setting up the instrument
Locating the part, etc.
How much of the measurement process should we repeat? How far do we go? 77<br>
78
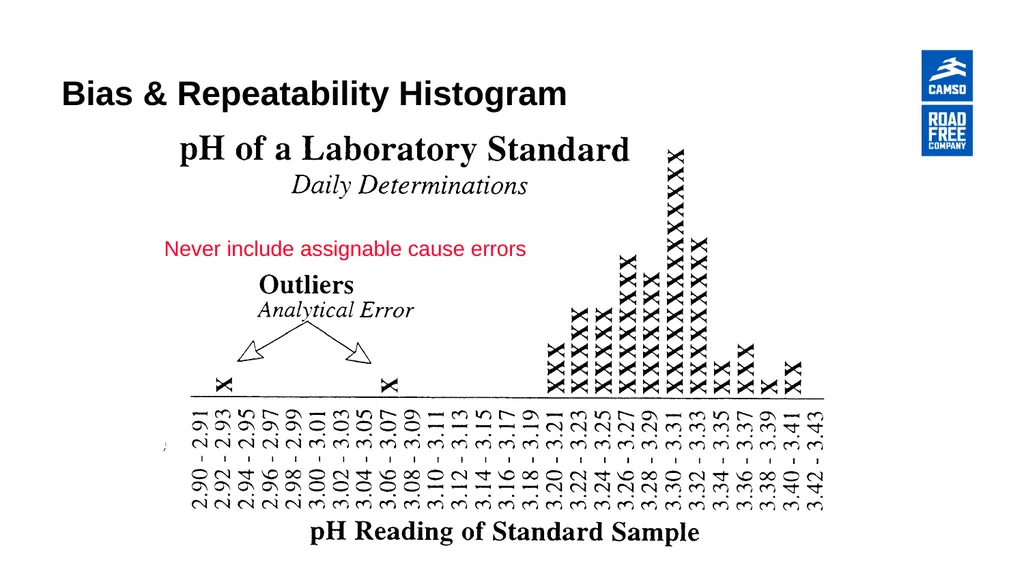
Bias & Repeatability Histogram Never include assignable cause errors<br>
79
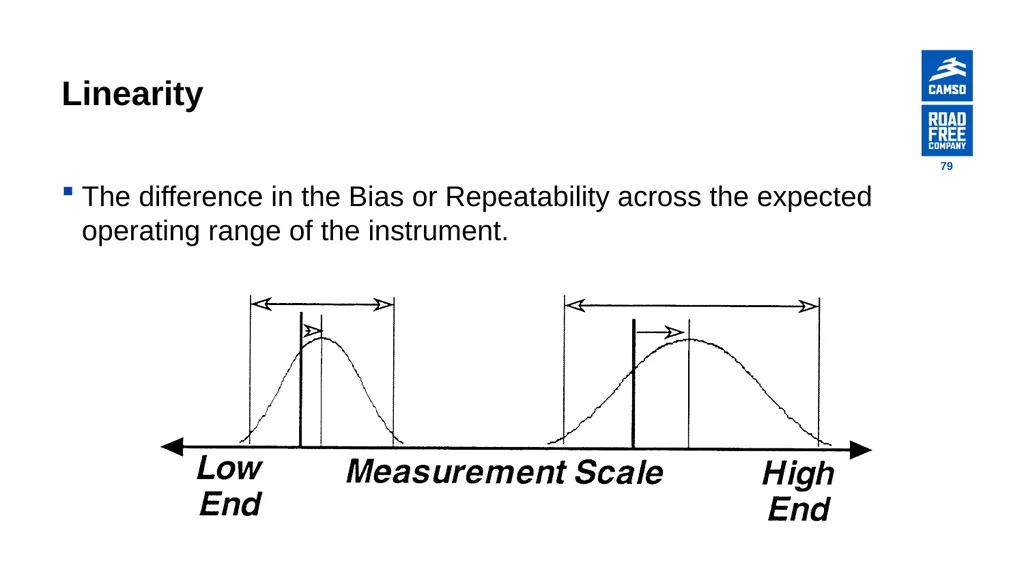
Linearity The difference in the Bias or Repeatability across the expected operating range of the instrument. 79<br>
80
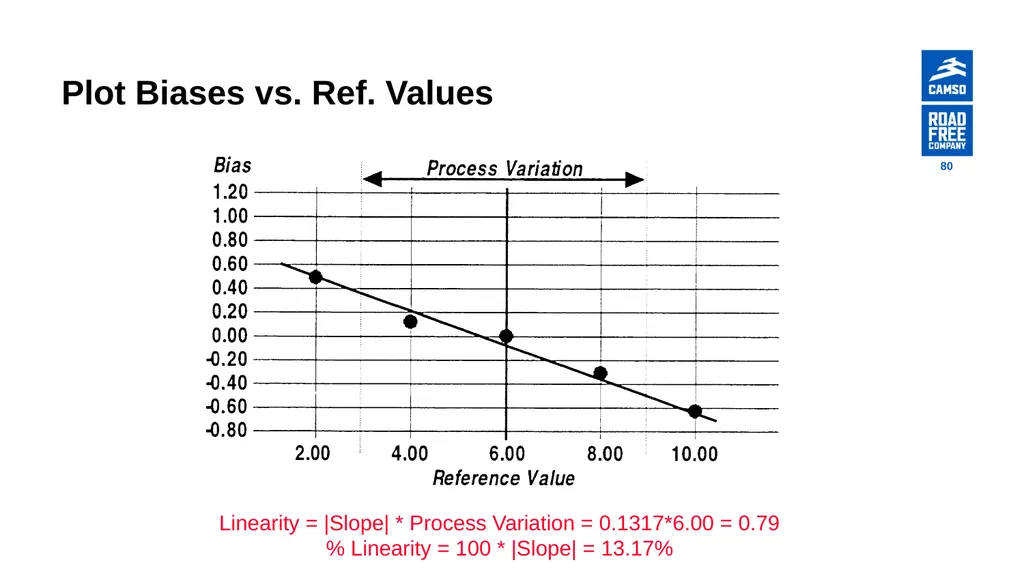
Plot Biases vs. Ref. Values Linearity = |Slope| * Process Variation = 0.1317*6.00 = 0.79
% Linearity = 100 * |Slope| = 13.17% 80<br>
% Linearity = 100 * |Slope| = 13.17% 80<br>
81
Causes of Poor Linearity Instrument not properly calibrated at both Upper and Lower extremes
Error in the minimum or maximum Master
Worn Instrument
Instrument design characteristics 81<br>
Error in the minimum or maximum Master
Worn Instrument
Instrument design characteristics 81<br>
82
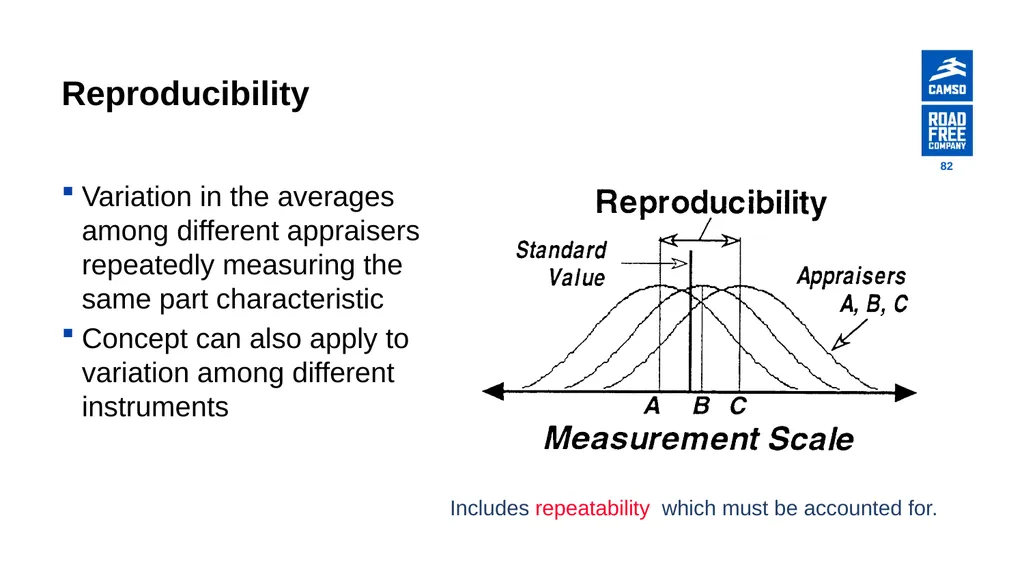
Reproducibility Variation in the averages among different appraisers repeatedly measuring the same part characteristic
Concept can also apply to variation among different instruments Includes repeatability which must be accounted for. 82<br>
Concept can also apply to variation among different instruments Includes repeatability which must be accounted for. 82<br>
83
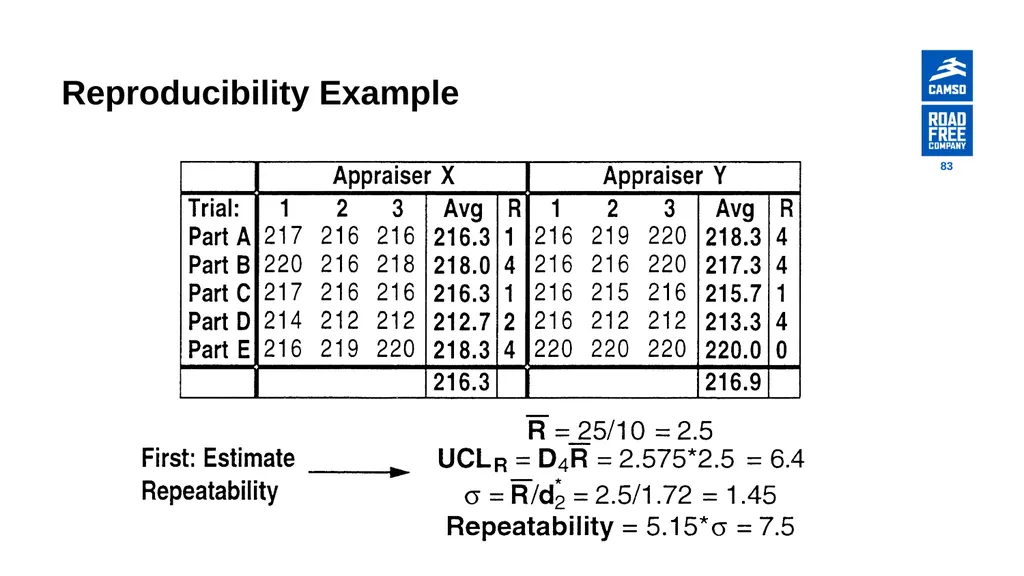
Reproducibility Example 83<br>
84
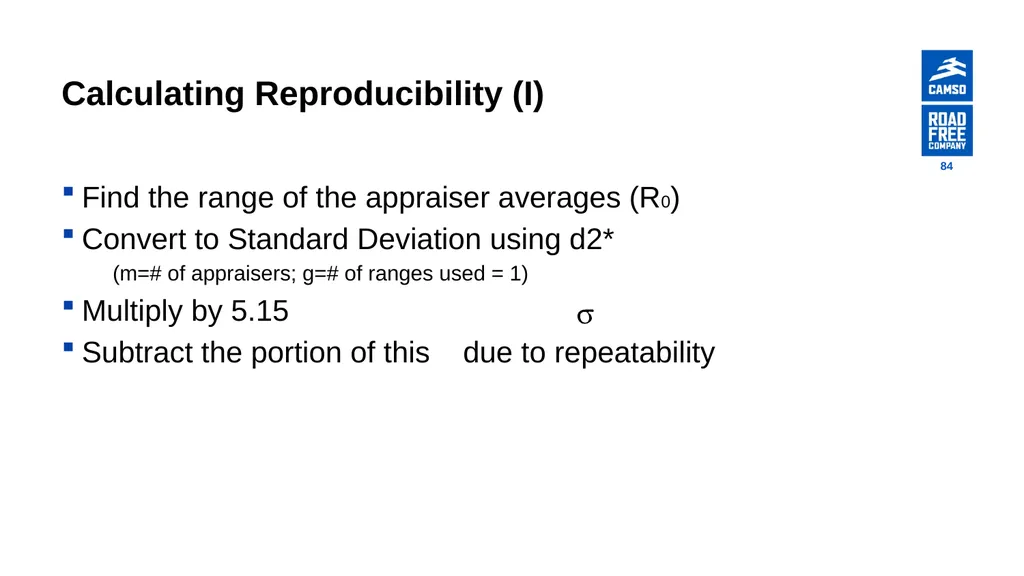
Calculating Reproducibility (I) Find the range of the appraiser averages (R0)
Convert to Standard Deviation using d2*
(m=# of appraisers; g=# of ranges used = 1)
Multiply by 5.15
Subtract the portion of this due to repeatability 84<br>
Convert to Standard Deviation using d2*
(m=# of appraisers; g=# of ranges used = 1)
Multiply by 5.15
Subtract the portion of this due to repeatability 84<br>
85
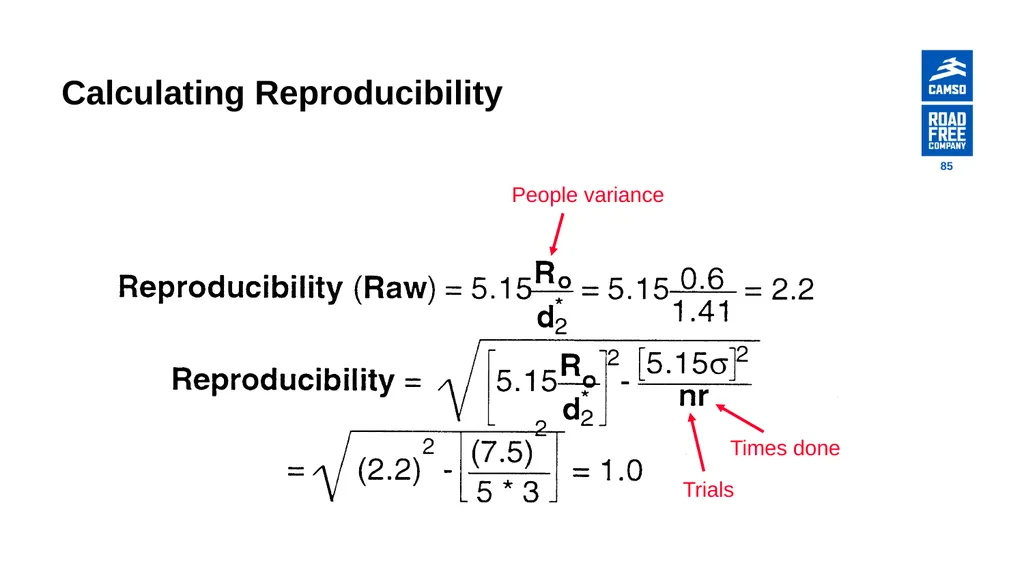
Calculating Reproducibility People variance Trials Times done 85<br>
86
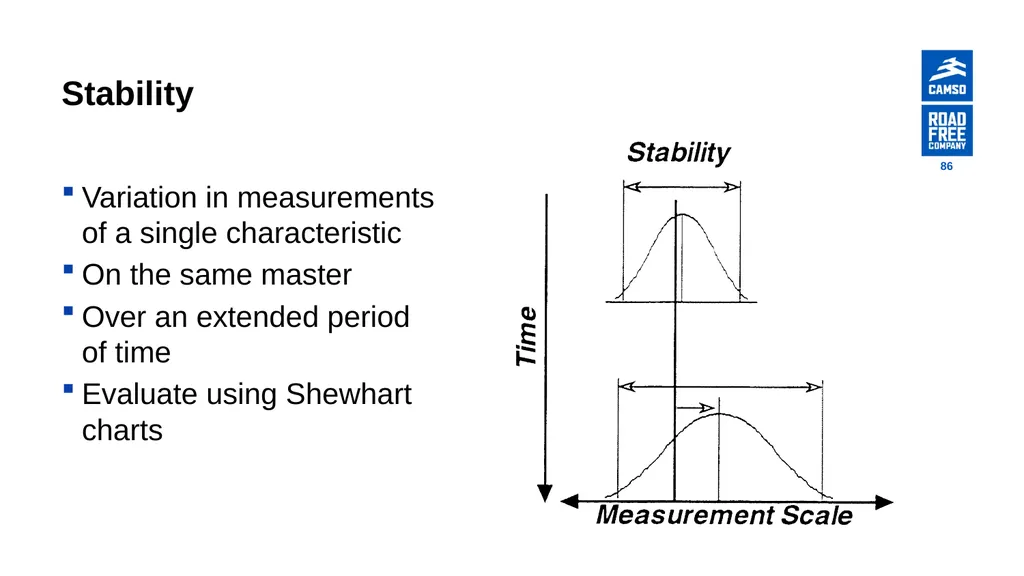
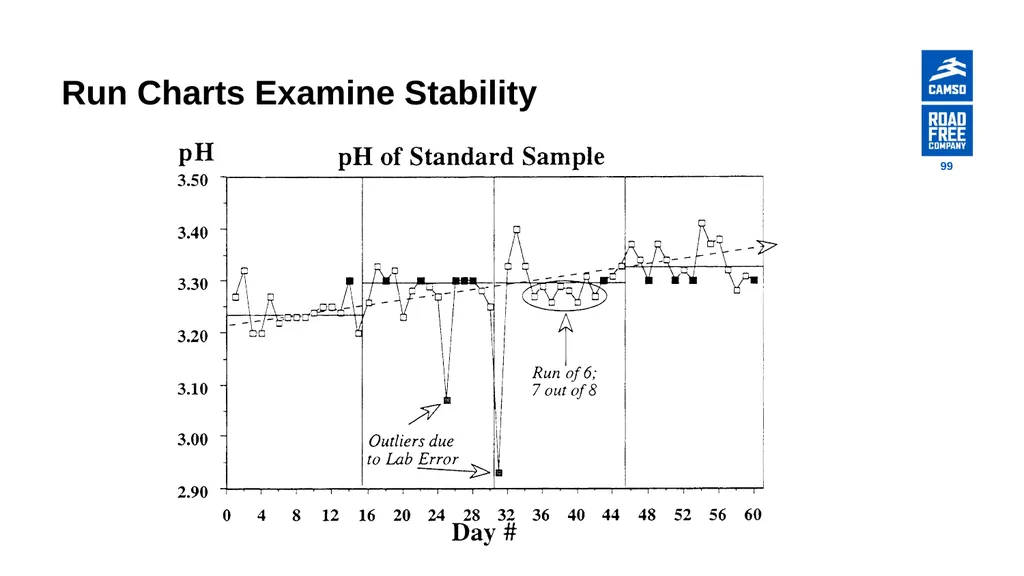
Stability Variation in measurements
of a single characteristic
On the same master
Over an extended period of time
Evaluate using Shewhart charts 86<br>
On the same master
Over an extended period of time
Evaluate using Shewhart charts 86<br>
87
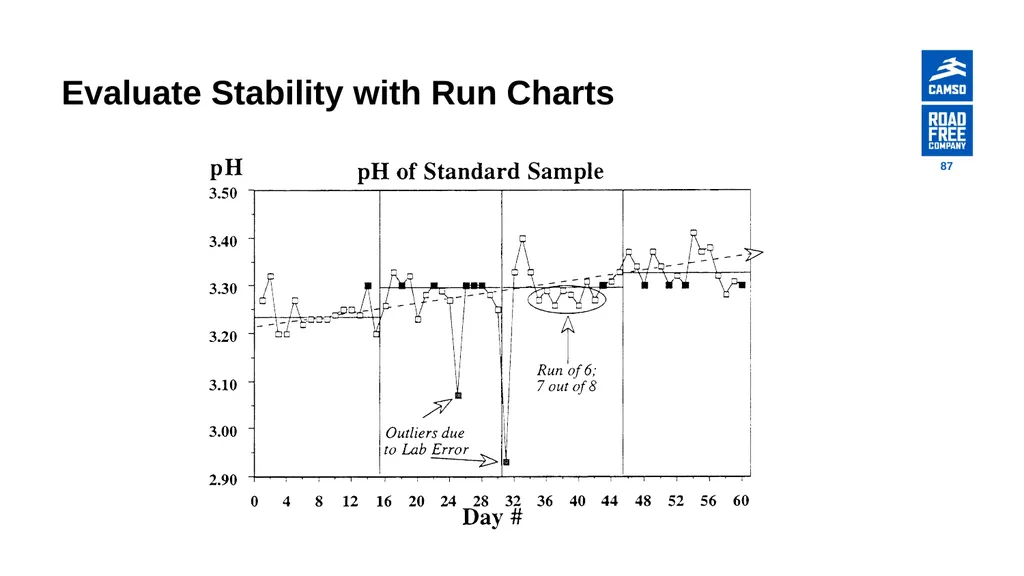
Evaluate Stability with Run Charts 87<br>
88
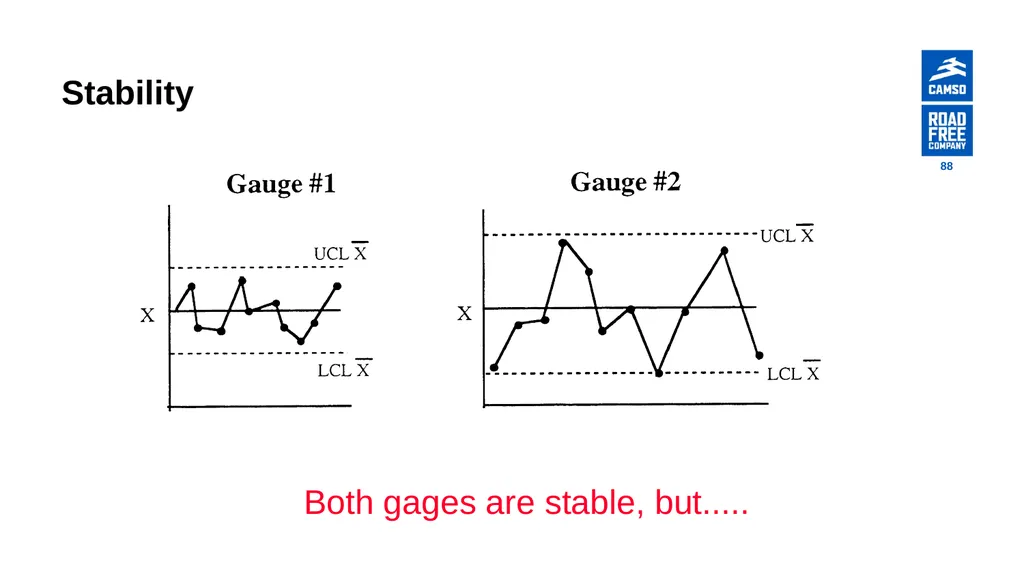
Stability Both gages are stable, but..... 88<br>
89
Importance of Stability Statistical stability, combined with subject-matter knowledge, allows predictions of process performance
Action based on analysis of Unstable systems may increase Variation due to ‘Tampering’
A statistically unstable measurement system cannot provide reliable data on the process 89<br>
Action based on analysis of Unstable systems may increase Variation due to ‘Tampering’
A statistically unstable measurement system cannot provide reliable data on the process 89<br>
90
Methods of Analysis 90<br>
91
Analysis Tools Calculations of Average and Standard Deviation
Correlation Charts
Multi-Vari Charts
Box-and-Whisker Plots
Run charts
Shewhart charts 91<br>
Correlation Charts
Multi-Vari Charts
Box-and-Whisker Plots
Run charts
Shewhart charts 91<br>
92
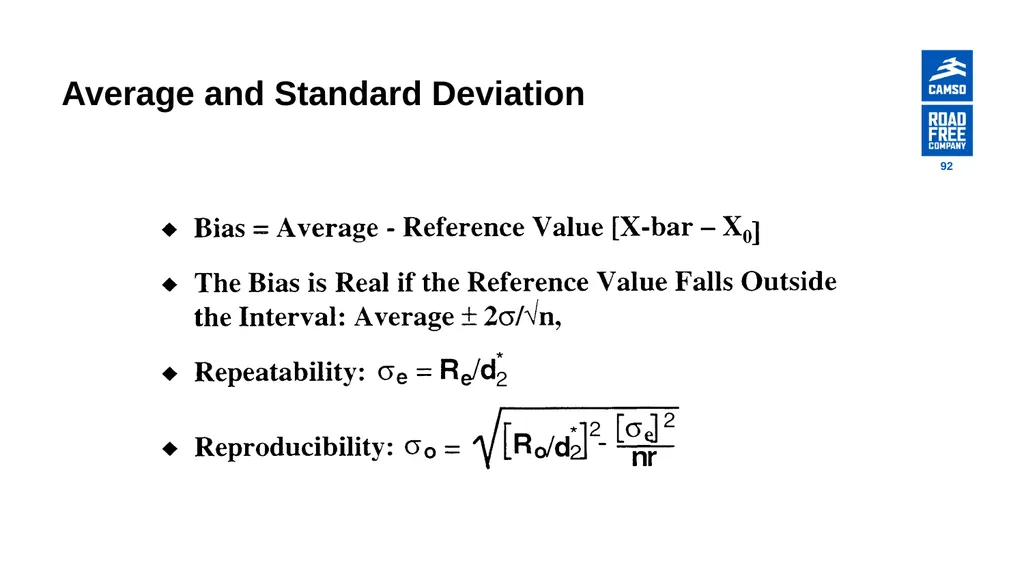
Average and Standard Deviation 92<br>
93
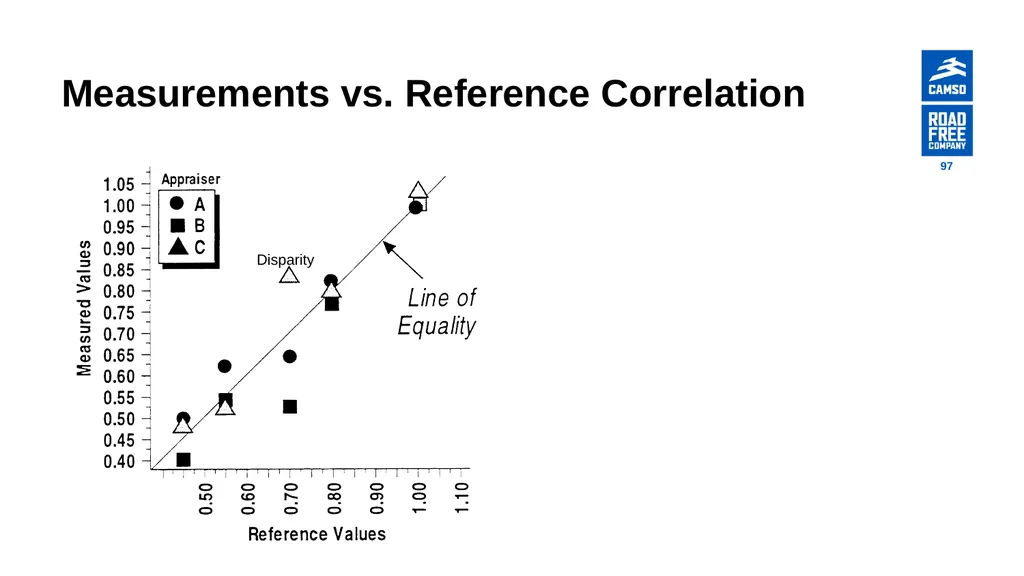
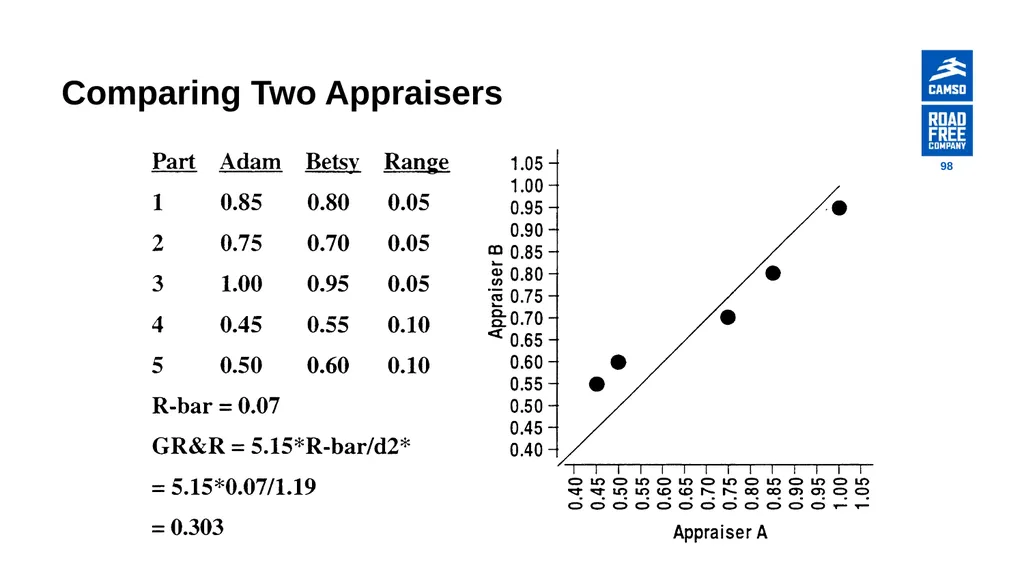
Correlation Charts Describe Relationships
Substitute measurement for desired measurement
Actual measurement to reference value
Inexpensive gaging method versus Expensive gaging method
Appraiser A with appraiser B 93<br>
Substitute measurement for desired measurement
Actual measurement to reference value
Inexpensive gaging method versus Expensive gaging method
Appraiser A with appraiser B 93<br>
94
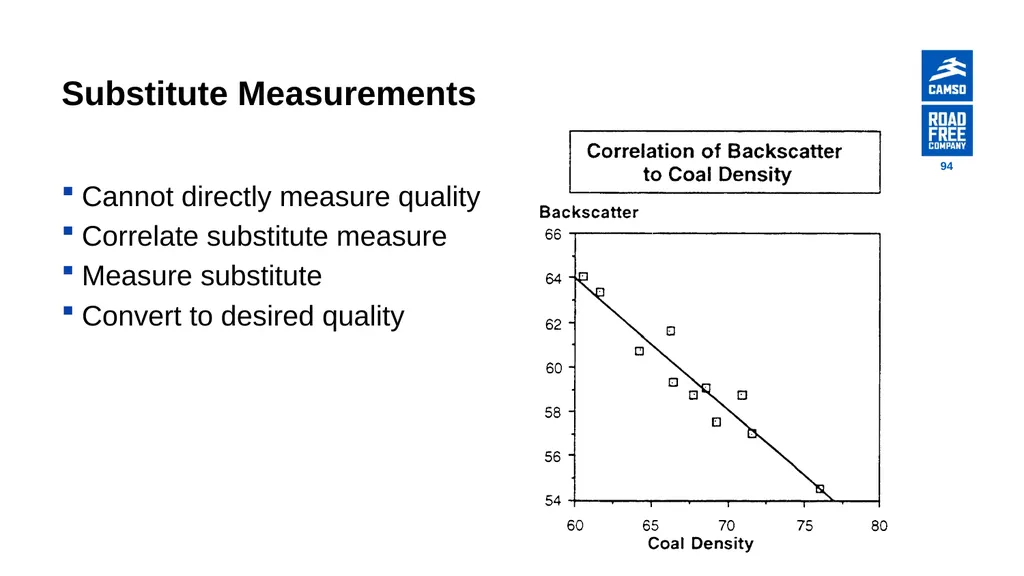
Substitute Measurements Cannot directly measure quality
Correlate substitute measure
Measure substitute
Convert to desired quality 94<br>
Correlate substitute measure
Measure substitute
Convert to desired quality 94<br>
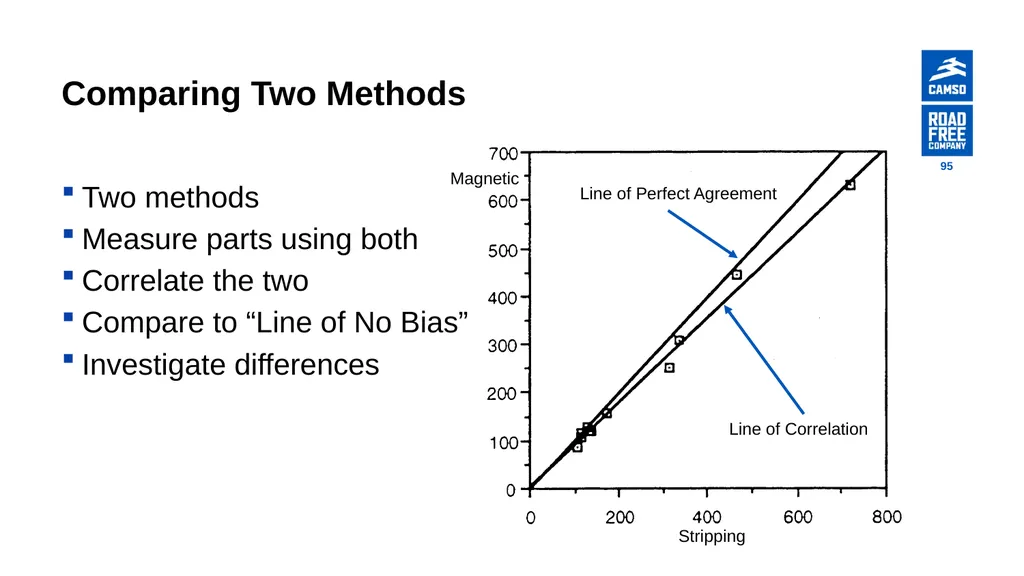
95
Comparing Two Methods Two methods
Measure parts using both
Correlate the two
Compare to “Line of No Bias”
Investigate differences 95<br>
Measure parts using both
Correlate the two
Compare to “Line of No Bias”
Investigate differences 95<br>
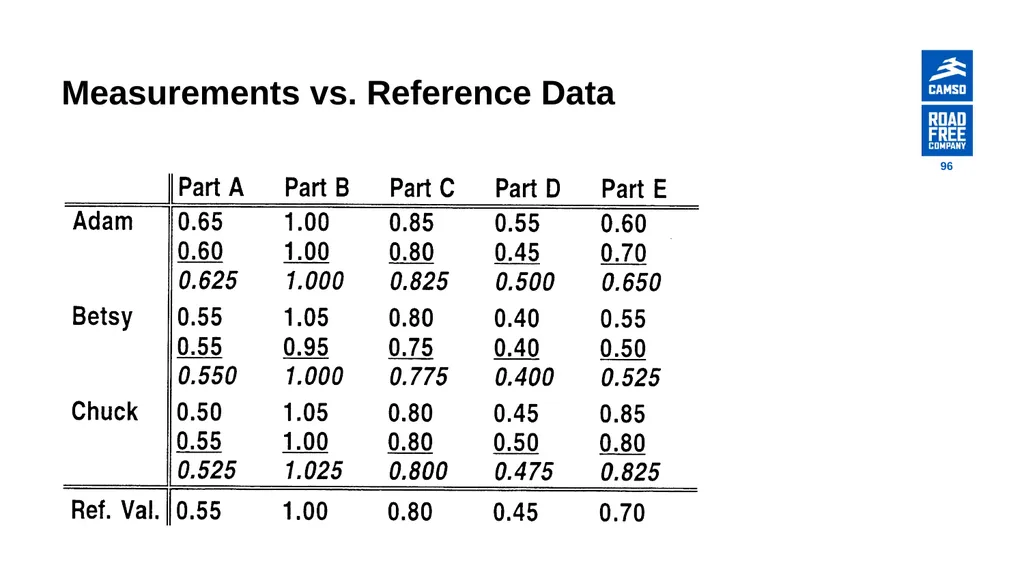
96
Measurements vs. Reference Data 96<br>
97
Measurements vs. Reference Correlation 97<br>
98
Comparing Two Appraisers 98<br>
99
Run Charts Examine Stability 99<br>
100
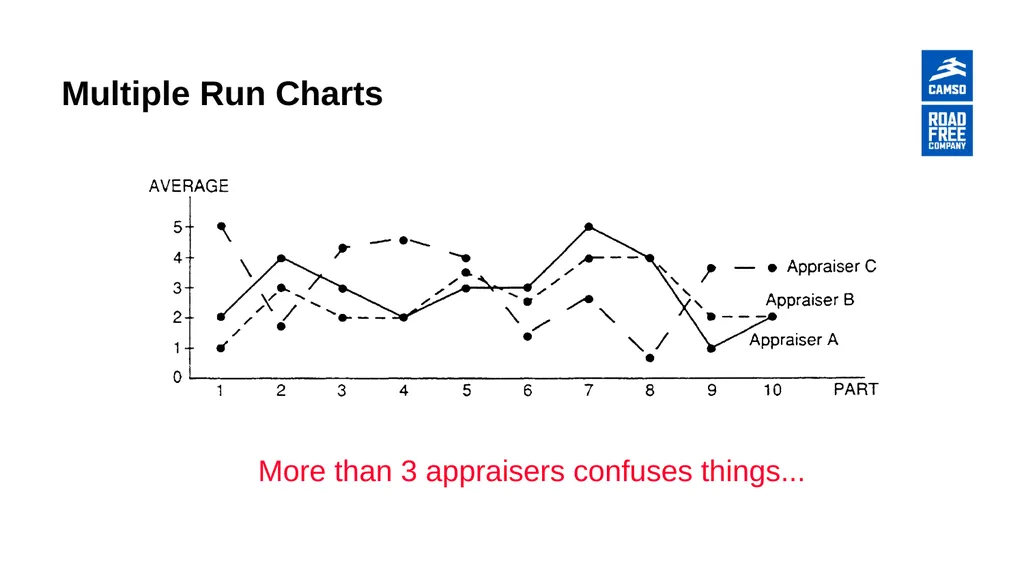
Multiple Run Charts More than 3 appraisers confuses things...<br>
101
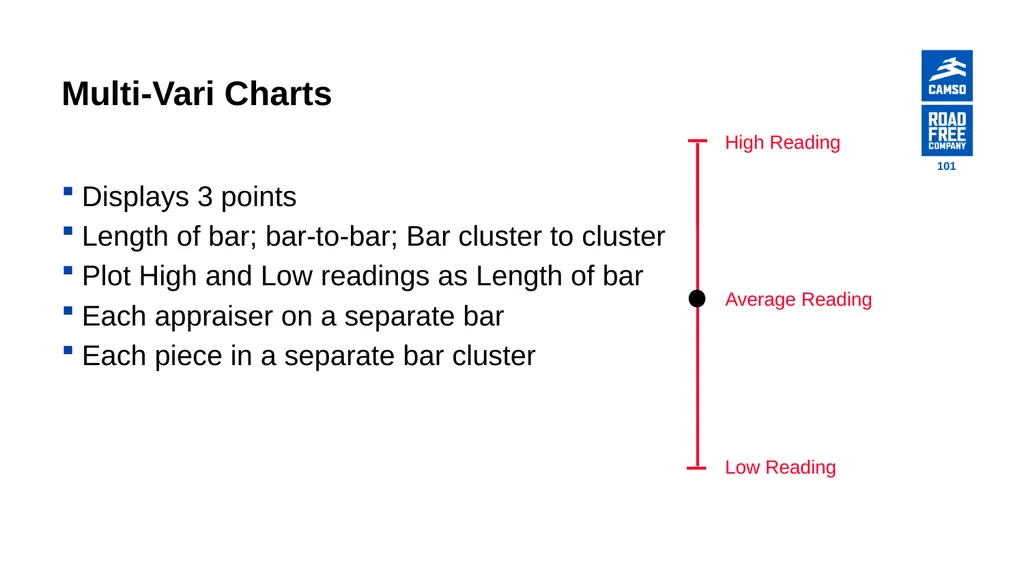
Multi-Vari Charts Displays 3 points
Length of bar; bar-to-bar; Bar cluster to cluster
Plot High and Low readings as Length of bar
Each appraiser on a separate bar
Each piece in a separate bar cluster High Reading Low Reading Average Reading 101<br>
Length of bar; bar-to-bar; Bar cluster to cluster
Plot High and Low readings as Length of bar
Each appraiser on a separate bar
Each piece in a separate bar cluster High Reading Low Reading Average Reading 101<br>
102
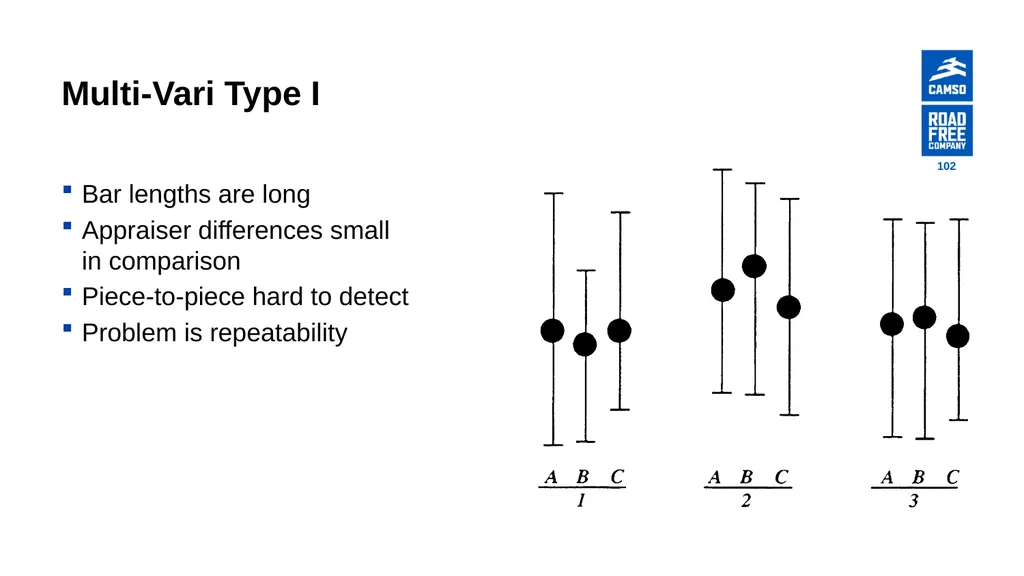
Multi-Vari Type I Bar lengths are long
Appraiser differences small in comparison
Piece-to-piece hard to detect
Problem is repeatability 102<br>
Appraiser differences small in comparison
Piece-to-piece hard to detect
Problem is repeatability 102<br>
103
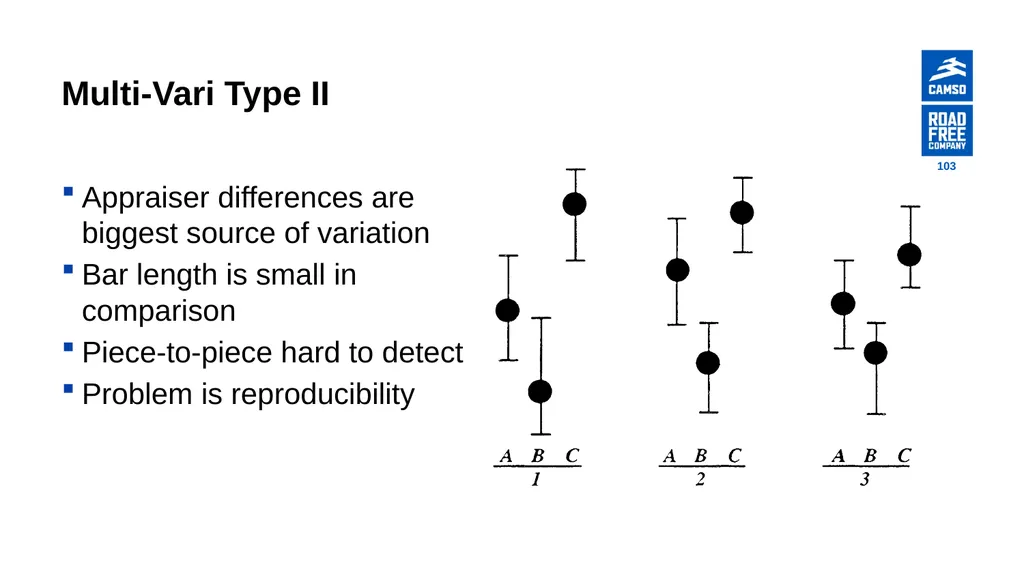
Multi-Vari Type II Appraiser differences are biggest source of variation
Bar length is small in comparison
Piece-to-piece hard to detect
Problem is reproducibility 103<br>
Bar length is small in comparison
Piece-to-piece hard to detect
Problem is reproducibility 103<br>
104
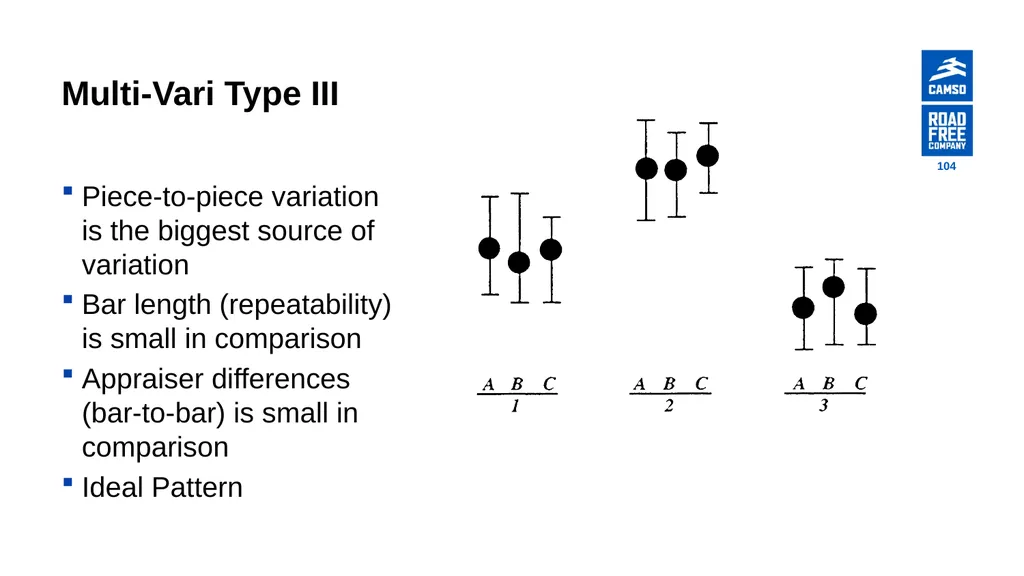
Multi-Vari Type III Piece-to-piece variation is the biggest source of variation
Bar length (repeatability) is small in comparison
Appraiser differences (bar-to-bar) is small in comparison
Ideal Pattern 104<br>
Bar length (repeatability) is small in comparison
Appraiser differences (bar-to-bar) is small in comparison
Ideal Pattern 104<br>
105
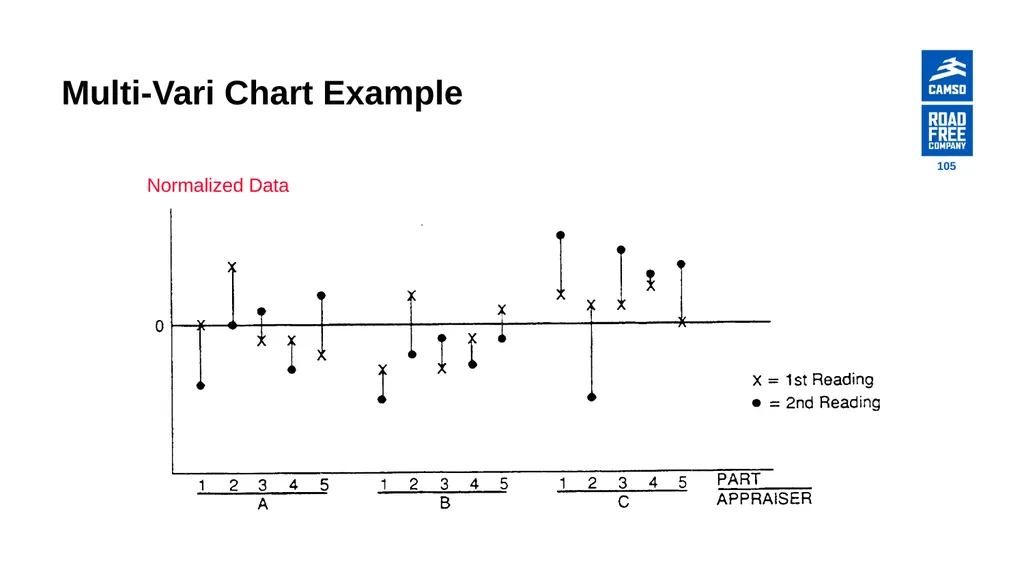
Multi-Vari Chart Example Normalized Data 105<br>
106
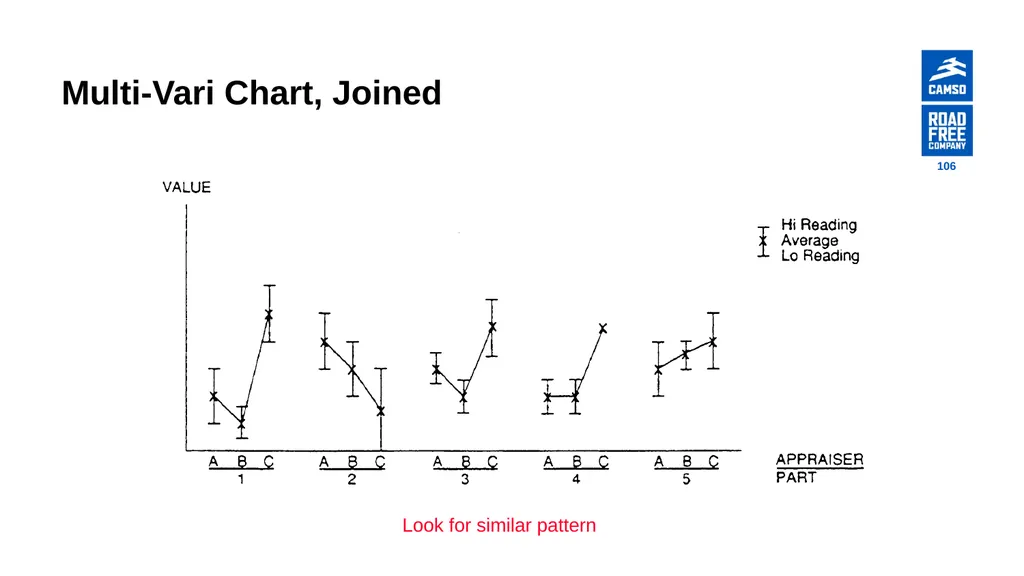
Multi-Vari Chart, Joined Look for similar pattern 106<br>
107
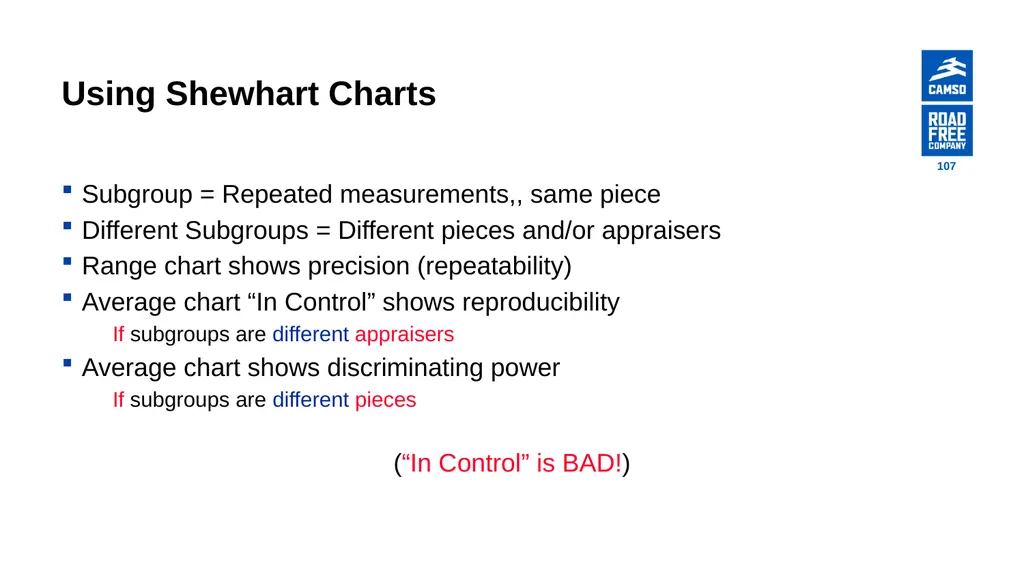
Using Shewhart Charts Subgroup = Repeated measurements,, same piece
Different Subgroups = Different pieces and/or appraisers
Range chart shows precision (repeatability)
Average chart “In Control” shows reproducibility
If subgroups are different appraisers
Average chart shows discriminating power
If subgroups are different pieces
(“In Control” is BAD!) 107<br>
Different Subgroups = Different pieces and/or appraisers
Range chart shows precision (repeatability)
Average chart “In Control” shows reproducibility
If subgroups are different appraisers
Average chart shows discriminating power
If subgroups are different pieces
(“In Control” is BAD!) 107<br>
108
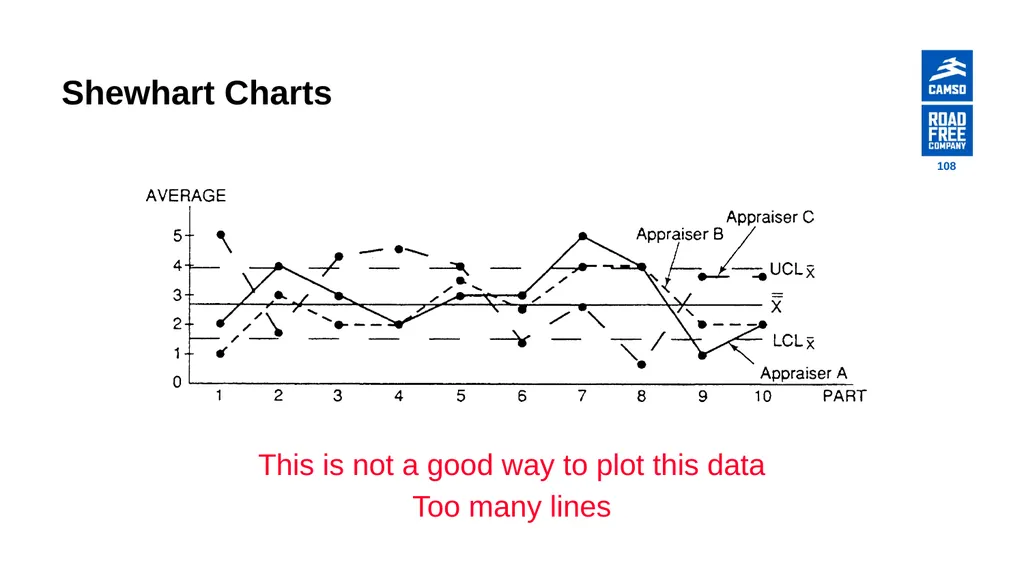
Shewhart Charts This is not a good way to plot this data
Too many lines 108<br>
Too many lines 108<br>
109
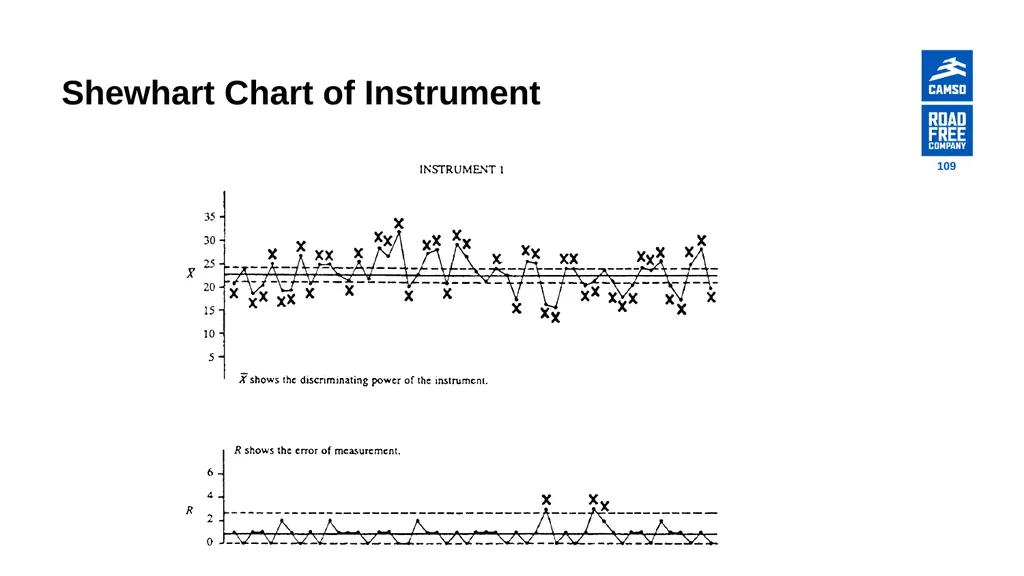
Shewhart Chart of Instrument 109<br>
110
Gage R&R Studies 110<br>
111
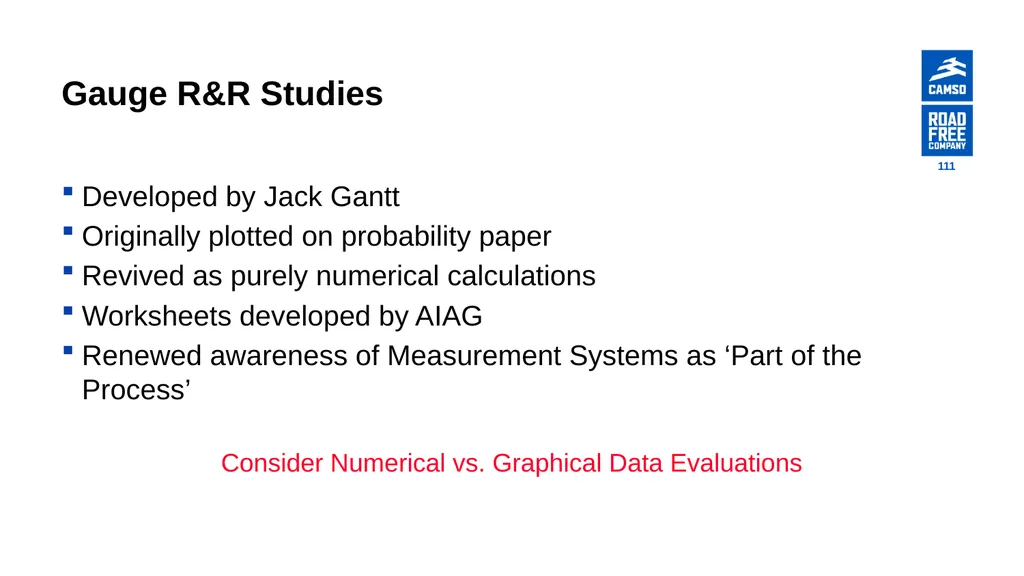
Gauge R&R Studies Developed by Jack Gantt
Originally plotted on probability paper
Revived as purely numerical calculations
Worksheets developed by AIAG
Renewed awareness of Measurement Systems as ‘Part of the Process’
Consider Numerical vs. Graphical Data Evaluations 111<br>
Originally plotted on probability paper
Revived as purely numerical calculations
Worksheets developed by AIAG
Renewed awareness of Measurement Systems as ‘Part of the Process’
Consider Numerical vs. Graphical Data Evaluations 111<br>
112
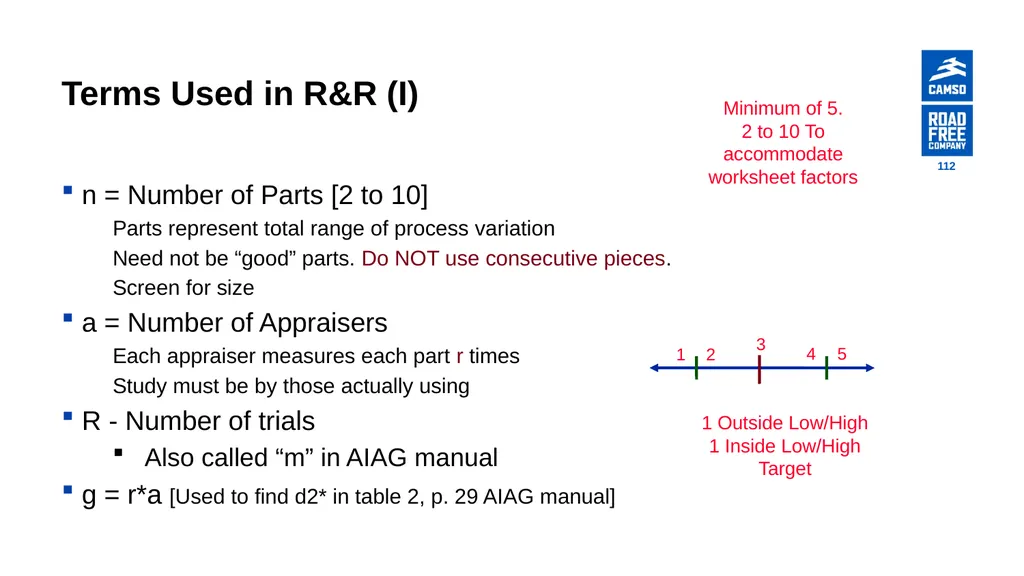
Terms Used in R&R (I) n = Number of Parts [2 to 10]
Parts represent total range of process variation
Need not be “good” parts. Do NOT use consecutive pieces.
Screen for size
a = Number of Appraisers
Each appraiser measures each part r times
Study must be by those actually using
R - Number of trials
Also called “m” in AIAG manual
g = r*a [Used to find d2* in table 2, p. 29 AIAG manual] 1 Outside Low/High
1 Inside Low/High
Target Minimum of 5.
2 to 10 To accommodate worksheet factors 1 2 3 4 5 112<br>
Parts represent total range of process variation
Need not be “good” parts. Do NOT use consecutive pieces.
Screen for size
a = Number of Appraisers
Each appraiser measures each part r times
Study must be by those actually using
R - Number of trials
Also called “m” in AIAG manual
g = r*a [Used to find d2* in table 2, p. 29 AIAG manual] 1 Outside Low/High
1 Inside Low/High
Target Minimum of 5.
2 to 10 To accommodate worksheet factors 1 2 3 4 5 112<br>
113
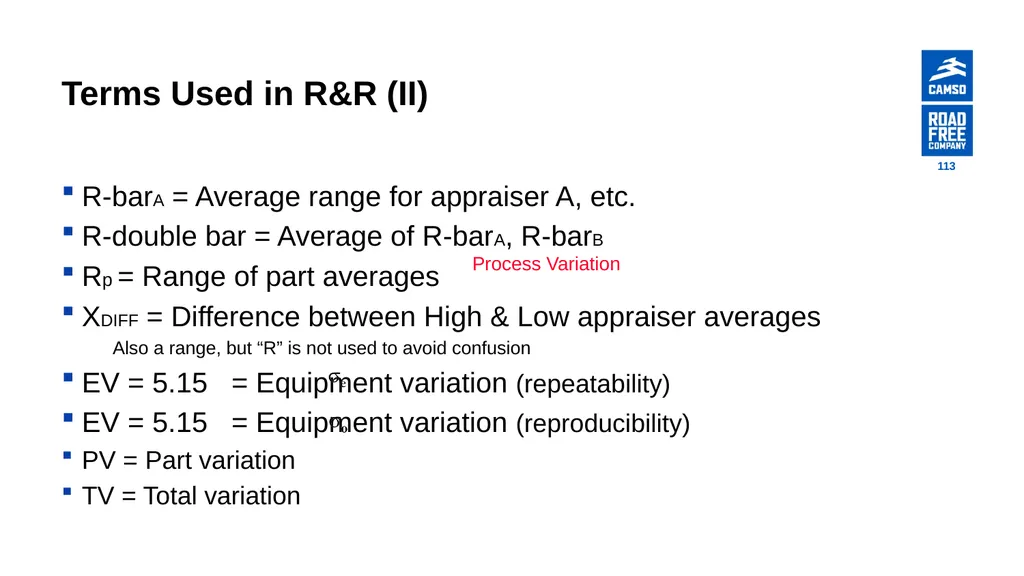
Terms Used in R&R (II) R-barA = Average range for appraiser A, etc.
R-double bar = Average of R-barA, R-barB
Rp = Range of part averages
XDIFF = Difference between High & Low appraiser averages
Also a range, but “R” is not used to avoid confusion
EV = 5.15 = Equipment variation (repeatability)
EV = 5.15 = Equipment variation (reproducibility)
PV = Part variation
TV = Total variation Process Variation 113<br>
R-double bar = Average of R-barA, R-barB
Rp = Range of part averages
XDIFF = Difference between High & Low appraiser averages
Also a range, but “R” is not used to avoid confusion
EV = 5.15 = Equipment variation (repeatability)
EV = 5.15 = Equipment variation (reproducibility)
PV = Part variation
TV = Total variation Process Variation 113<br>
114
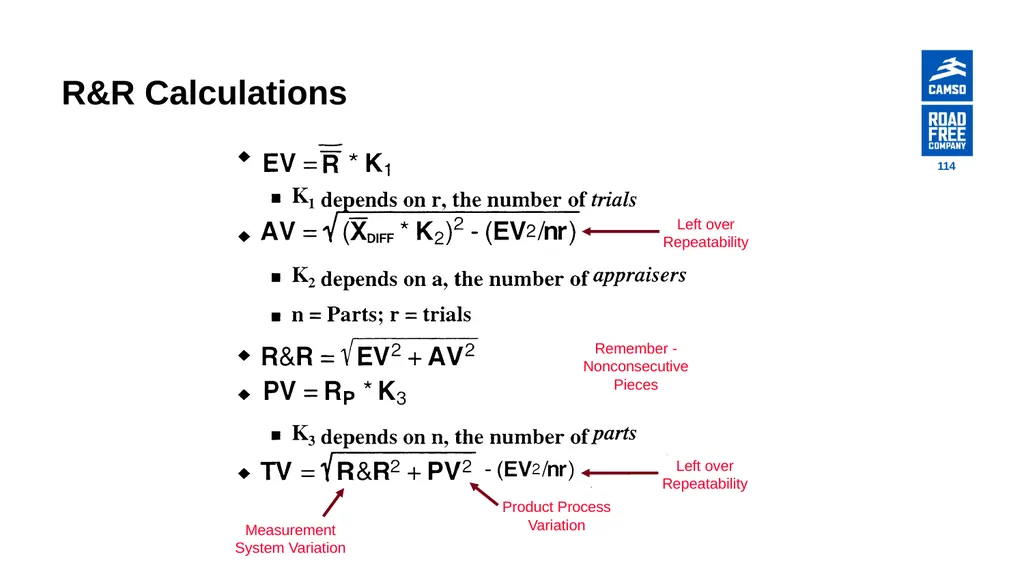
R&R Calculations 114<br>
115
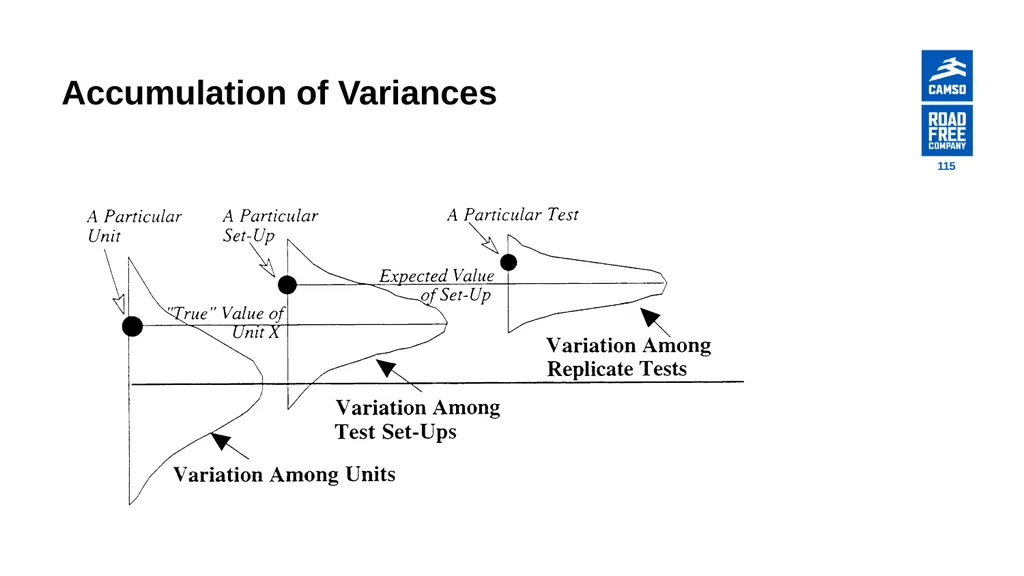
Accumulation of Variances 115<br>
116
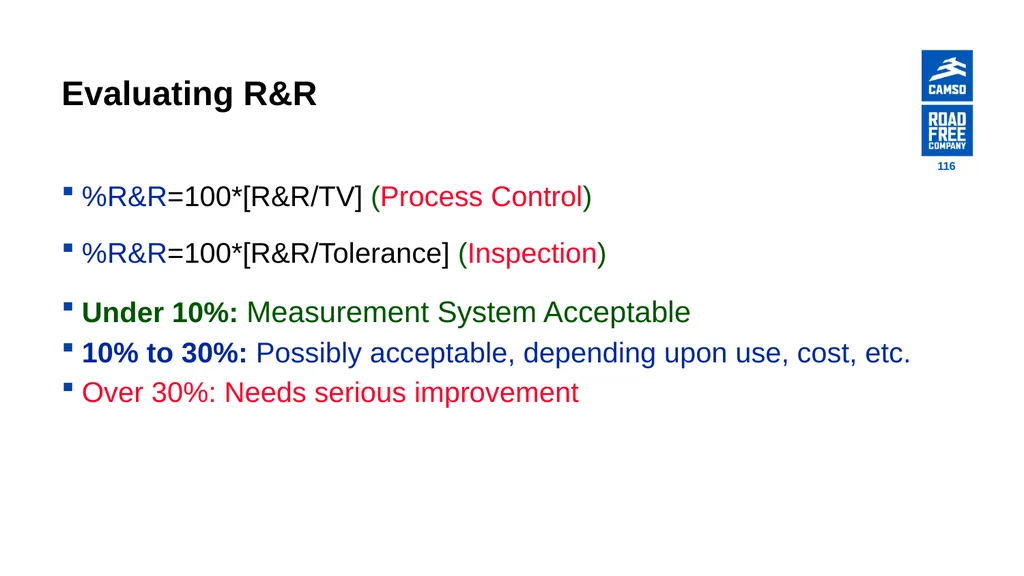
Evaluating R&R %R&R=100*[R&R/TV] (Process Control)
%R&R=100*[R&R/Tolerance] (Inspection)
Under 10%: Measurement System Acceptable
10% to 30%: Possibly acceptable, depending upon use, cost, etc.
Over 30%: Needs serious improvement 116<br>
%R&R=100*[R&R/Tolerance] (Inspection)
Under 10%: Measurement System Acceptable
10% to 30%: Possibly acceptable, depending upon use, cost, etc.
Over 30%: Needs serious improvement 116<br>
117
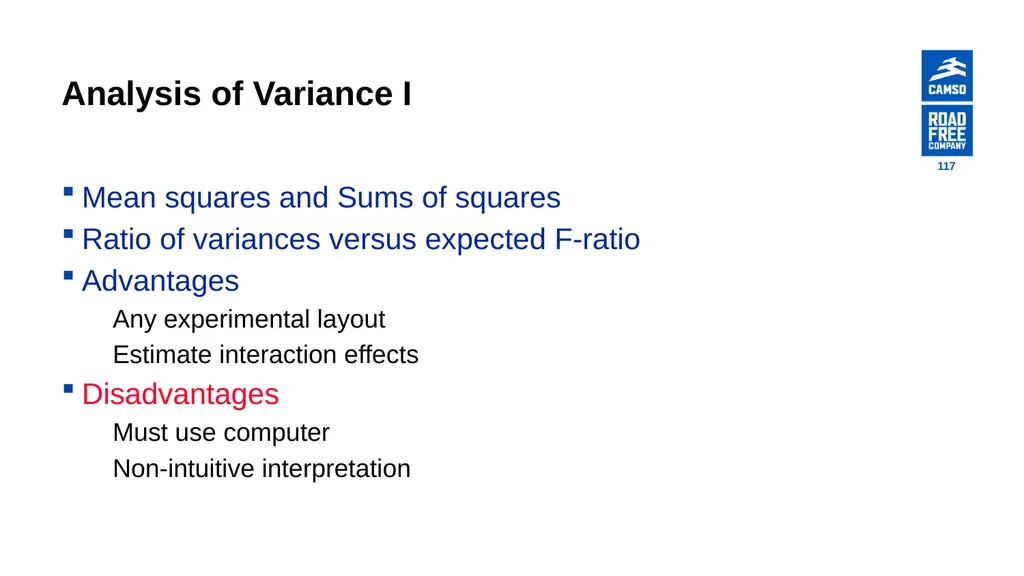
Analysis of Variance I Mean squares and Sums of squares
Ratio of variances versus expected F-ratio
Advantages
Any experimental layout
Estimate interaction effects
Disadvantages
Must use computer
Non-intuitive interpretation 117<br>
Ratio of variances versus expected F-ratio
Advantages
Any experimental layout
Estimate interaction effects
Disadvantages
Must use computer
Non-intuitive interpretation 117<br>
118
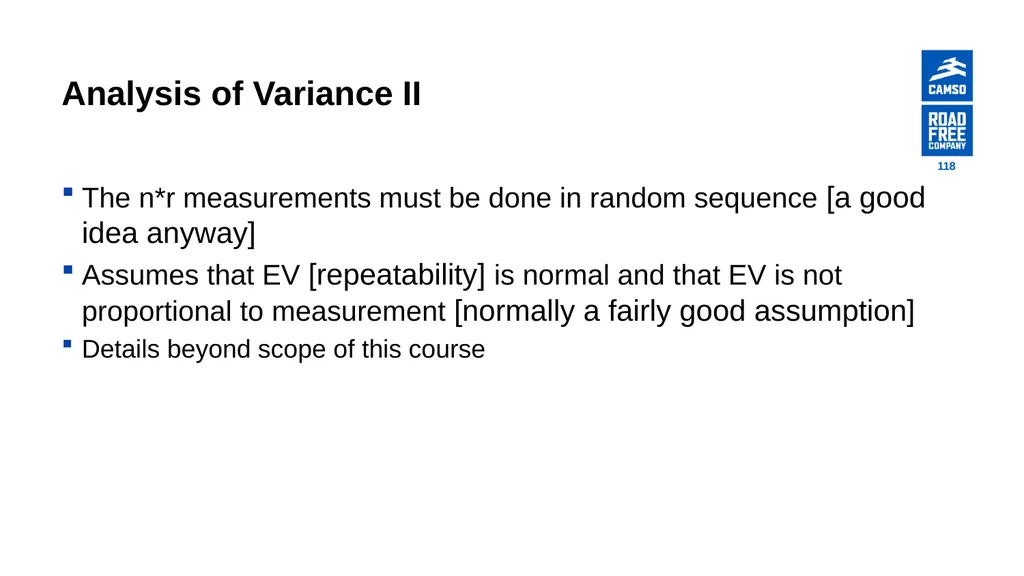
Analysis of Variance II The n*r measurements must be done in random sequence [a good idea anyway]
Assumes that EV [repeatability] is normal and that EV is not proportional to measurement [normally a fairly good assumption]
Details beyond scope of this course 118<br>
Assumes that EV [repeatability] is normal and that EV is not proportional to measurement [normally a fairly good assumption]
Details beyond scope of this course 118<br>
119
Special Gauging Situations Go/No-Go
Destructive Testing 119<br>
Destructive Testing 119<br>
120
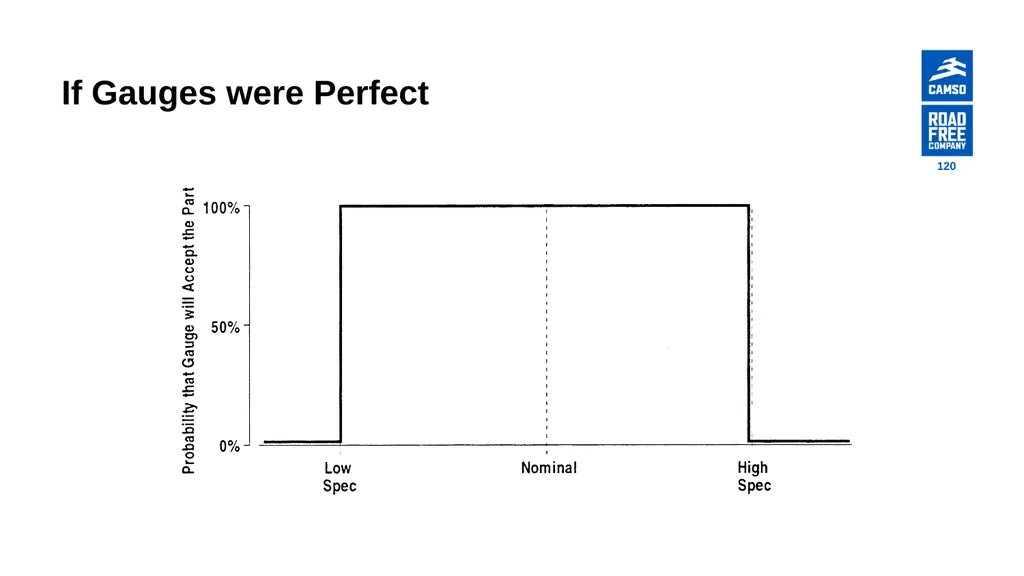
If Gauges were Perfect 120<br>
121
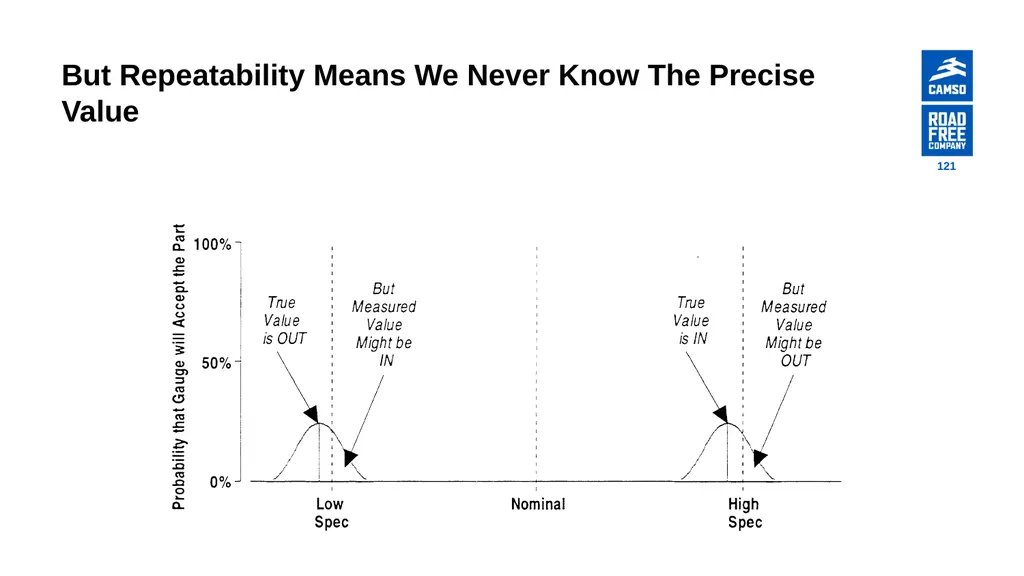
But Repeatability Means We Never Know The Precise Value 121<br>
122
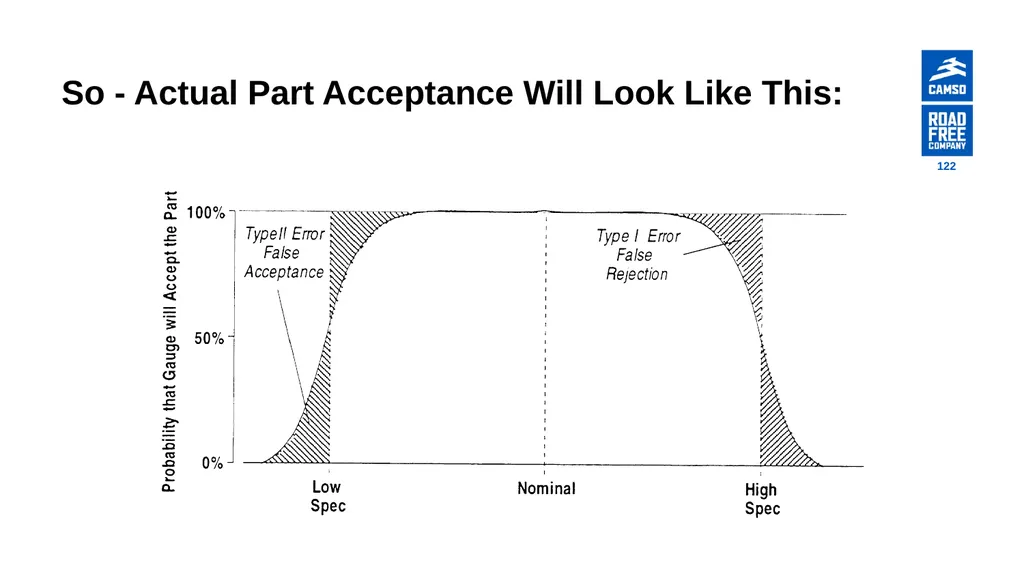
So - Actual Part Acceptance Will Look Like This: 122<br>
123
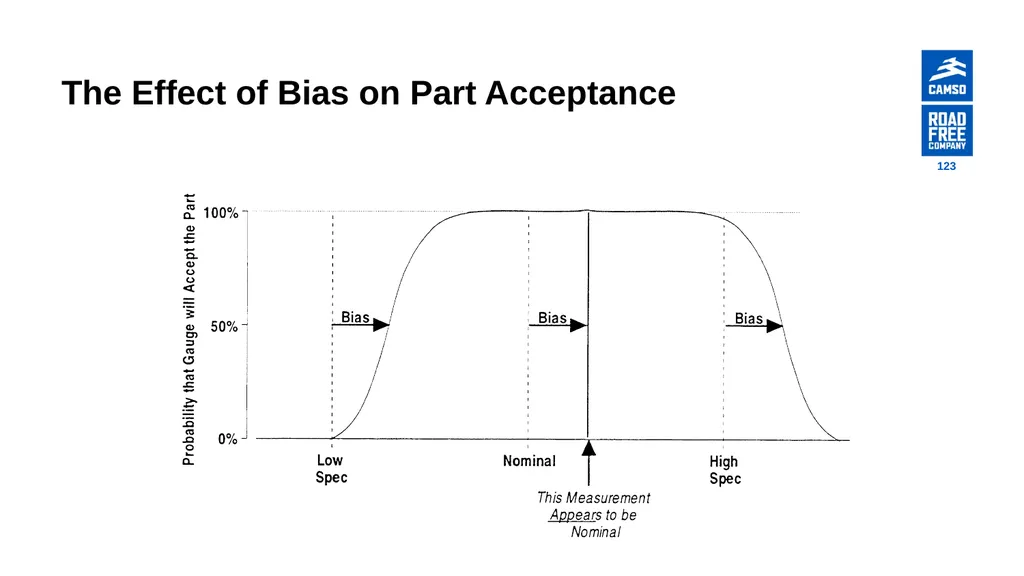
The Effect of Bias on Part Acceptance 123<br>
124
Go/No-Go gauges Treat variables like attributes
Provide less information on the process, but...
Are fast and inexpensive
Cannot use for Process Control
Can be used for Sorting purposes 124<br>
Provide less information on the process, but...
Are fast and inexpensive
Cannot use for Process Control
Can be used for Sorting purposes 124<br>
125
“Short” Go/No-Go Study Collect 20 parts covering the entire process range
Use two inspectors
Gage each part twice
Accept gauge if there is agreement on each of the 20 parts
* May reject a good measuring system 125<br>
Use two inspectors
Gage each part twice
Accept gauge if there is agreement on each of the 20 parts
* May reject a good measuring system 125<br>
126
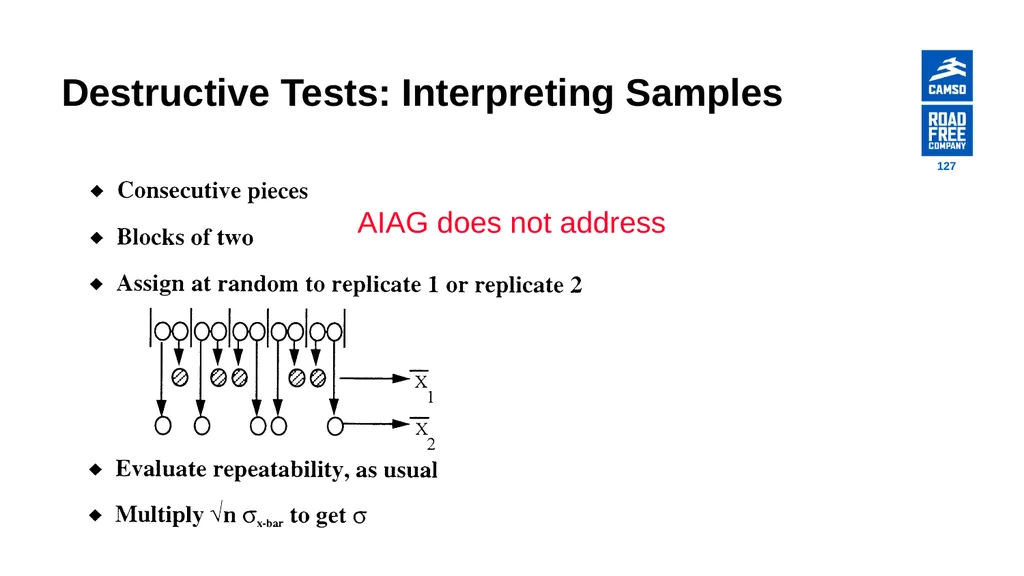
Destructive Tests Cannot make true duplicate tests
Use interpenetrating samples
Compare 3 averages
Adjust using √n 126<br>
Use interpenetrating samples
Compare 3 averages
Adjust using √n 126<br>
127
Destructive Tests: Interpreting Samples AIAG does not address 127<br>
128
Summary 128<br>
129
Measurement Variation Observed variation is a combination of the production process PLUS the measurement process
The contribution of the measurement system is often overlooked 129<br>
The contribution of the measurement system is often overlooked 129<br>
130
Types of Measurement Variation Bias (Inaccuracy)
Repeatability (Imprecision)
Discrimination
Linearity
Stability 130<br>
Repeatability (Imprecision)
Discrimination
Linearity
Stability 130<br>
131
Measurement Systems Material
Characteristic
Sampling and Preparation
Operational Definition of Measurement
Instrument
Appraiser
Environment and Ergonomics 131<br>
Characteristic
Sampling and Preparation
Operational Definition of Measurement
Instrument
Appraiser
Environment and Ergonomics 131<br>
132
Measurement Systems Evaluation Tools Histograms
Probability paper
Run Charts
Scatter diagrams
Multi-Vari Charts
Gantt “R&R” analysis
Analysis of Variance (ANOVA)
Shewhart “Control” Charts 132<br>
Probability paper
Run Charts
Scatter diagrams
Multi-Vari Charts
Gantt “R&R” analysis
Analysis of Variance (ANOVA)
Shewhart “Control” Charts 132<br>
133
Shewhart Charts Range chart shows repeatability
X-bar limits show discriminating power
X-double bar shows bias
(if a known standard exists)
Average chart shows stability
(sub-groups overtime)
Average chart shows reproducibility
(sub-groups over technicians/instruments) 133<br>
X-bar limits show discriminating power
X-double bar shows bias
(if a known standard exists)
Average chart shows stability
(sub-groups overtime)
Average chart shows reproducibility
(sub-groups over technicians/instruments) 133<br>
134
Conclusion Rule of Ten
Operating Characteristic Curve
Special Problems
Go/No-Go Gages
Attribute Inspection
Destructive Testing 134<br>
Operating Characteristic Curve
Special Problems
Go/No-Go Gages
Attribute Inspection
Destructive Testing 134<br>