Hurdle rates V: Betas – the regression approach A
Author : briana-ranney | Published Date : 2025-06-27
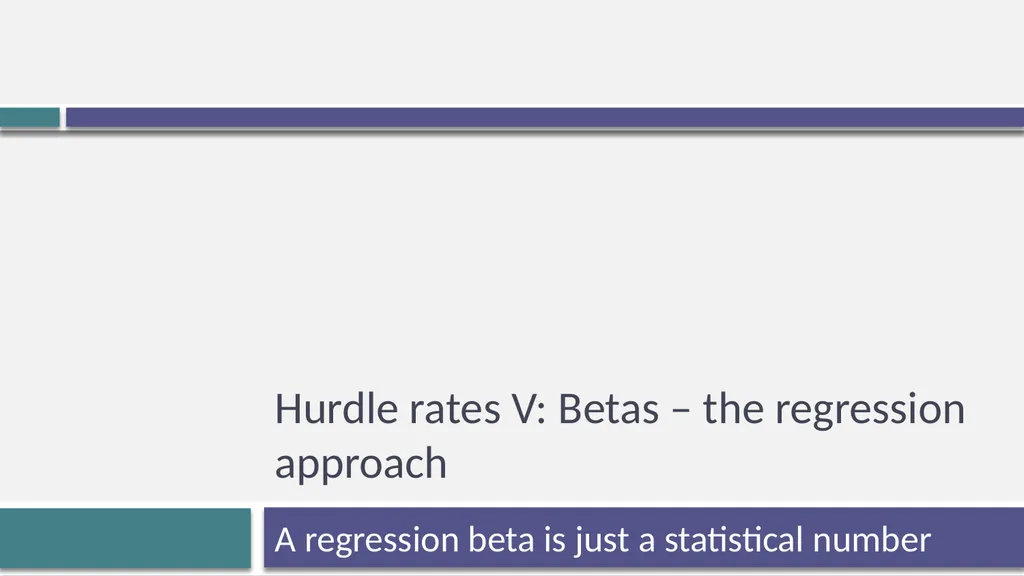
Description: Hurdle rates V Betas the regression approach A regression beta is just a statistical number Estimating Beta The standard procedure for estimating betas is to regress stock returns Rj against market returns Rm Rj a b Rm where a
Presentation Embed Code
Download Presentation
Download
Presentation The PPT/PDF document
"Hurdle rates V: Betas – the regression approach A" is the property of its rightful owner.
Permission is granted to download and print the materials on this website for personal, non-commercial use only,
and to display it on your personal computer provided you do not modify the materials and that you retain all
copyright notices contained in the materials. By downloading content from our website, you accept the terms of
this agreement.
Transcript:Hurdle rates V: Betas – the regression approach A:
Hurdle rates V: Betas – the regression approach A regression beta is just a statistical number Estimating Beta The standard procedure for estimating betas is to regress stock returns (Rj) against market returns (Rm) - Rj = a + b Rm where a is the intercept and b is the slope of the regression. The slope of the regression corresponds to the beta of the stock, and measures the riskiness of the stock. The R squared (R2) of the regression provides an estimate of the proportion of the risk (variance) of a firm that can be attributed to market risk. The balance (1 - R2) can be attributed to firm specific risk. Estimating Performance The intercept of the regression provides a simple measure of performance during the period of the regression, relative to the capital asset pricing model. Rj = Rf + b (Rm - Rf) = Rf (1-b) + b Rm ...........Capital Asset Pricing Model Rj = a + b Rm ...........Regression Equation If a > Rf (1-b) .... Stock did better than expected during regression period a = Rf (1-b) .... Stock did as well as expected during regression period a < Rf (1-b) .... Stock did worse than expected during regression period The difference between the intercept and Rf (1-b) is Jensen's alpha. If it is positive, your stock did perform better than expected during the period of the regression. Setting up for the Estimation Decide on an estimation period Services use periods ranging from 2 to 5 years for the regression Longer estimation period provides more data, but firms change. Shorter periods can be affected more easily by significant firm-specific event that occurred during the period. Decide on a return interval - daily, weekly, monthly Shorter intervals yield more observations, but suffer from more noise. Noise is created by stocks not trading and biases all betas towards one. Estimate returns (including dividends) on stock Return = (PriceEnd - PriceBeginning + DividendsPeriod)/ PriceBeginning Included dividends only in ex-dividend month Choose a market index, and estimate returns (inclusive of dividends) on the index for each interval for the period. Choosing the Parameters: Disney Period used: 5 years Return Interval = Monthly Market Index: S&P 500 Index. For instance, to calculate returns on Disney in December 2009, Price for Disney at end of November 2009 = $ 30.22 Price for Disney at end of December 2009 = $ 32.25