
I/B/E/S @WRDS 101 Introduction and Research Guide





Description: IBES WRDS 101 Introduction and Research Guide Rui Dai Ph.D. CFA Rui Dai, Ph.D. CFA 2 Part I: Introduction Institutional Brokers Estimate System (IBES) IBES is recognized as the conventional analyst forecast data in academia
Related Topics
Download Presentation
"I/B/E/S @WRDS 101 Introduction and Research Guide" is the property of its rightful owner. Permission is granted to download and print the materials on this website for personal, non-commercial use only, and to display it on your personal computer provided you do not modify the materials and that you retain all copyright notices contained in the materials. By downloading content from our website, you accept the terms of this agreement.
Presentation Transcript
slide1. I/B/E/S @WRDS 101 Introduction and Research Guide Rui Dai Ph.D. CFA<br>
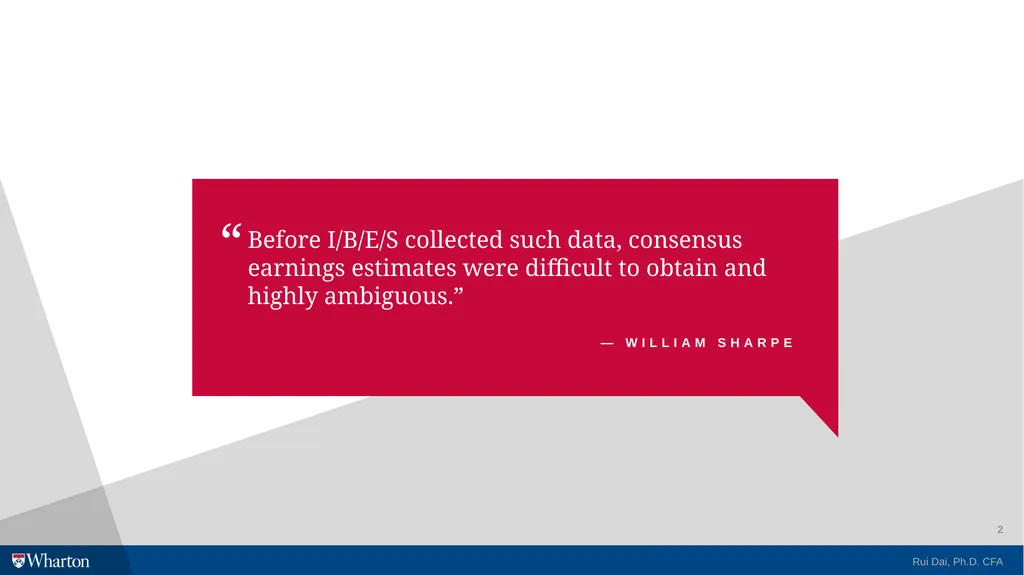
slide2. Rui Dai, Ph.D. CFA 2<br>
slide3. Part I: Introduction<br>
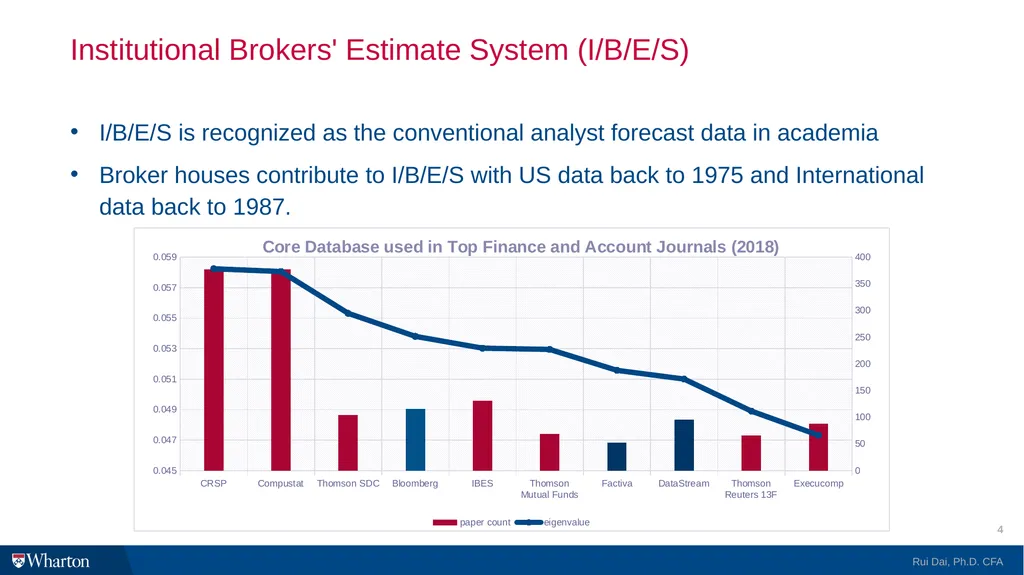
slide4. Institutional Brokers' Estimate System (I/B/E/S) I/B/E/S is recognized as the conventional analyst forecast data in academia
Broker houses contribute to I/B/E/S with US data back to 1975 and International data back to 1987. Rui Dai, Ph.D. CFA 4<br>
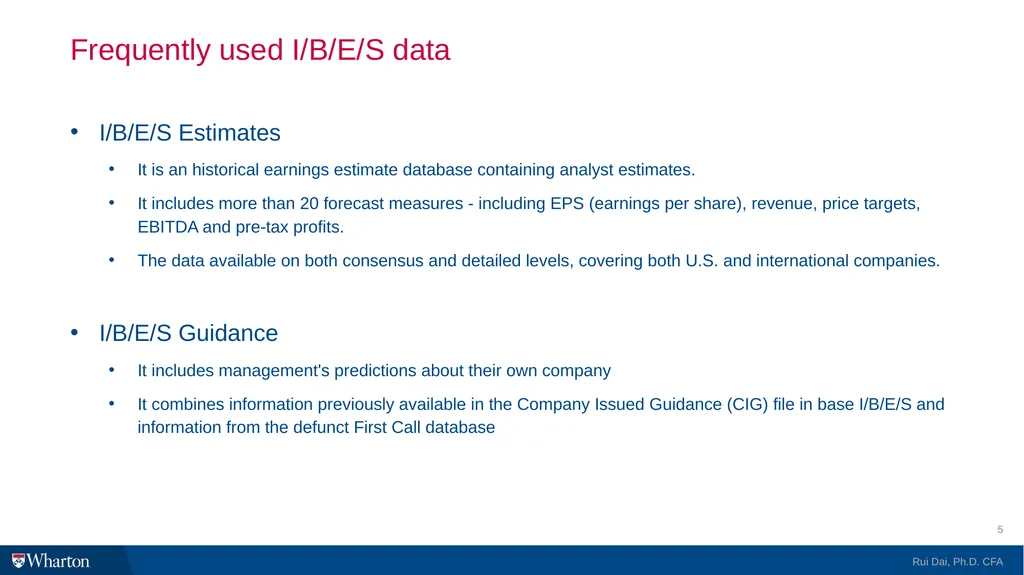
slide5. Frequently used I/B/E/S data I/B/E/S Estimates
It is an historical earnings estimate database containing analyst estimates.
It includes more than 20 forecast measures - including EPS (earnings per share), revenue, price targets, EBITDA and pre-tax profits.
The data available on both consensus and detailed levels, covering both U.S. and international companies.
I/B/E/S Guidance
It includes management's predictions about their own company
It combines information previously available in the Company Issued Guidance (CIG) file in base I/B/E/S and information from the defunct First Call database Rui Dai, Ph.D. CFA 5<br>
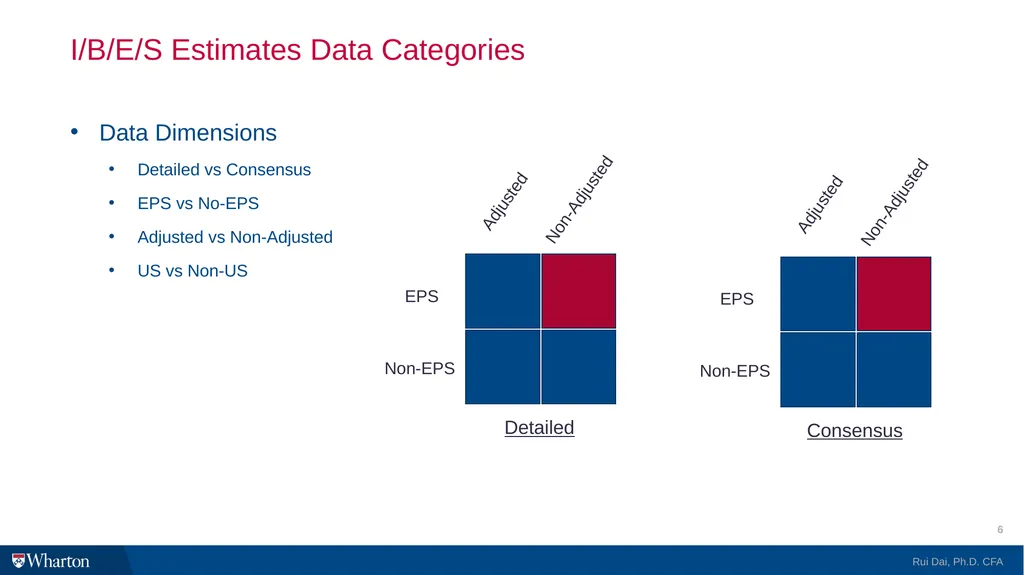
slide6. I/B/E/S Estimates Data Categories Data Dimensions
Detailed vs Consensus
EPS vs No-EPS
Adjusted vs Non-Adjusted
US vs Non-US Rui Dai, Ph.D. CFA 6<br>
slide7. I/B/E/S Estimates Data Collection 3,000+ estimators(brokers) contribute data to I/B/E/S from the largest global houses to regional and local brokers, totaling over 30,000 individual analysts.
Company actuals are collected from multiple newswire feeds, press releases, company websites and public filings.
Detailed estimates are collected each day as they are released by analysts. Summary history consists of chronological snapshots of consensus level data taken on a monthly basis. Rui Dai, Ph.D. CFA 7<br>
slide8. Identifier System Permanent ID:
I/B/E/S ticker, denoted as 'TICKER', is a unique identifier assigned to each security that is consistent throughout I/B/E/S History.
Security ID:
CUSIP/SEDOL data field contain historical CUSIP, or SEDOL when CUSIP is not available.
Link I/B/E/S and Other databases
See the programing guide on linking I/B/E/S with CRSP and Compustat Rui Dai, Ph.D. CFA 8<br>
slide9. I/B/E/S Jargon Parties:
Estimator: Sell-side institution or contributor (mostly broker house)
Analyst: analyst who makes the forecast and work for sell-side institution
Indicators:
Forecast Period Indicator (FPI): a code to identify estimates for forecasting period
e.g. 6: Next Fiscal Quarter and 1: Next Fiscal Year
Primary/Diluted Indicator (PDI): share base selected for a company
Primary/Diluted Flag (PDF): share base selected for an estimate Rui Dai, Ph.D. CFA 9<br>
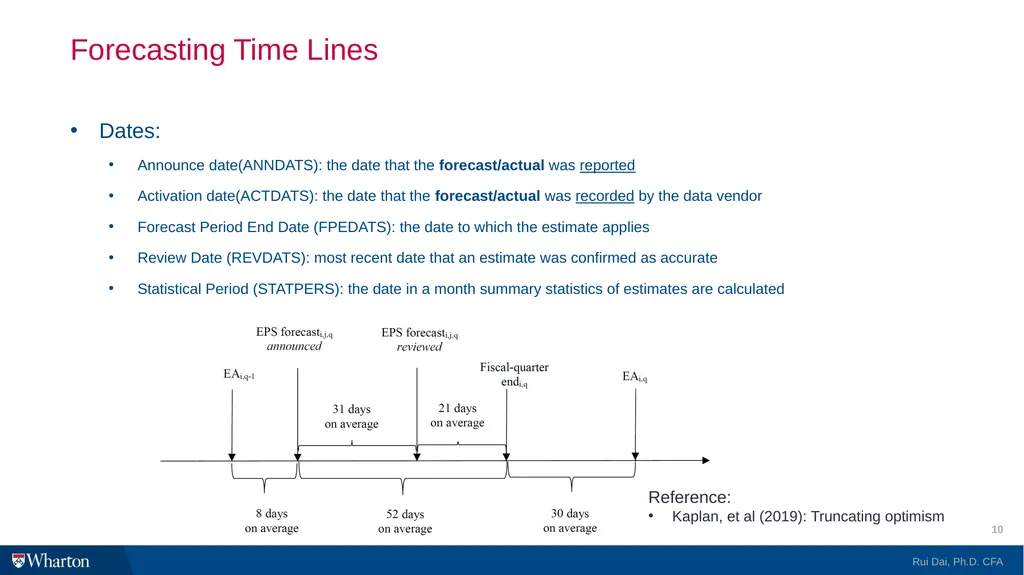
slide10. Forecasting Time Lines Dates:
Announce date(ANNDATS): the date that the forecast/actual was reported
Activation date(ACTDATS): the date that the forecast/actual was recorded by the data vendor
Forecast Period End Date (FPEDATS): the date to which the estimate applies
Review Date (REVDATS): most recent date that an estimate was confirmed as accurate
Statistical Period (STATPERS): the date in a month summary statistics of estimates are calculated Rui Dai, Ph.D. CFA 10 Reference:
Kaplan, et al (2019): Truncating optimism<br>
slide11. Data Example Detailed adjusted EPS estimate table
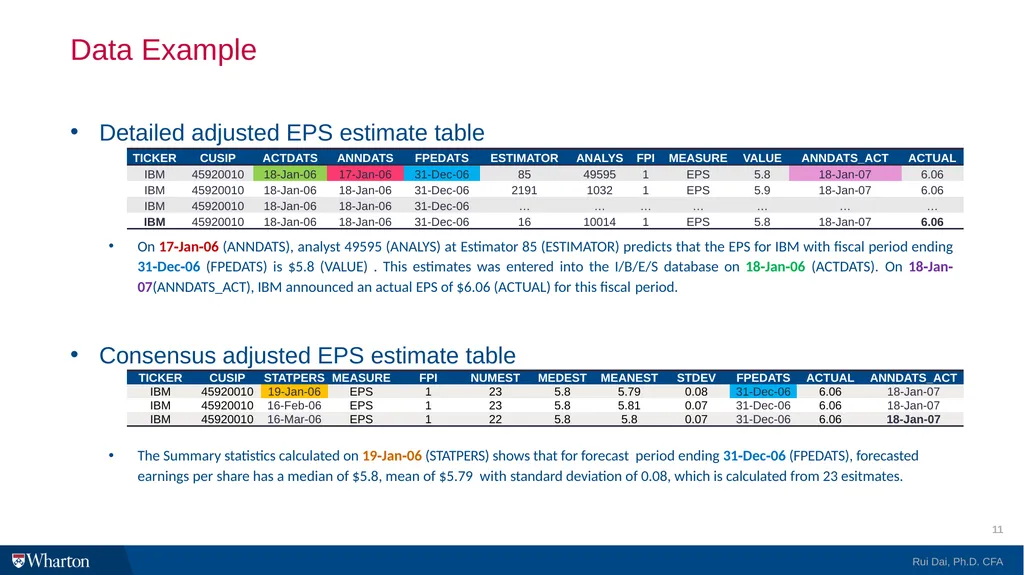
On 17‐Jan‐06 (ANNDATS), analyst 49595 (ANALYS) at Estimator 85 (ESTIMATOR) predicts that the EPS for IBM with fiscal period ending 31‐Dec‐06 (FPEDATS) is $5.8 (VALUE) . This estimates was entered into the I/B/E/S database on 18‐Jan‐06 (ACTDATS). On 18‐Jan‐07(ANNDATS_ACT), IBM announced an actual EPS of $6.06 (ACTUAL) for this fiscal period.
Consensus adjusted EPS estimate table
The Summary statistics calculated on 19‐Jan‐06 (STATPERS) shows that for forecast period ending 31‐Dec‐06 (FPEDATS), forecasted earnings per share has a median of $5.8, mean of $5.79 with standard deviation of 0.08, which is calculated from 23 esitmates. Rui Dai, Ph.D. CFA 11<br>
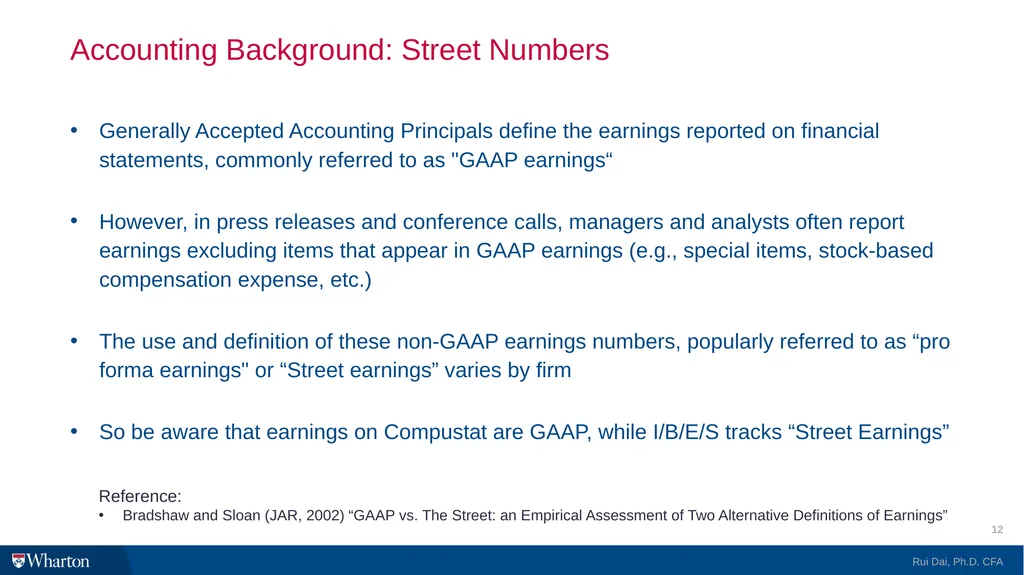
slide12. Accounting Background: Street Numbers Generally Accepted Accounting Principals define the earnings reported on financial statements, commonly referred to as "GAAP earnings“
However, in press releases and conference calls, managers and analysts often report earnings excluding items that appear in GAAP earnings (e.g., special items, stock-based compensation expense, etc.)
The use and definition of these non-GAAP earnings numbers, popularly referred to as “pro forma earnings" or “Street earnings” varies by firm
So be aware that earnings on Compustat are GAAP, while I/B/E/S tracks “Street Earnings” Rui Dai, Ph.D. CFA 12 Reference:
Bradshaw and Sloan (JAR, 2002) “GAAP vs. The Street: an Empirical Assessment of Two Alternative Definitions of Earnings”<br>
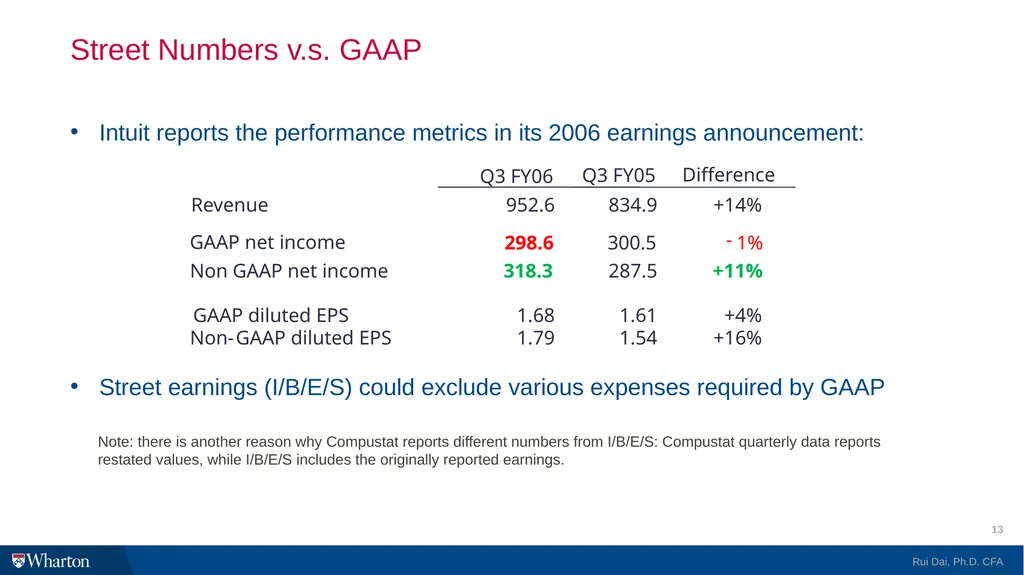
slide13. Street Numbers v.s. GAAP Intuit reports the performance metrics in its 2006 earnings announcement:
Street earnings (I/B/E/S) could exclude various expenses required by GAAP Rui Dai, Ph.D. CFA 13 Note: there is another reason why Compustat reports different numbers from I/B/E/S: Compustat quarterly data reports restated values, while I/B/E/S includes the originally reported earnings.<br>
slide14. Part II: Empirical Research Guide<br>
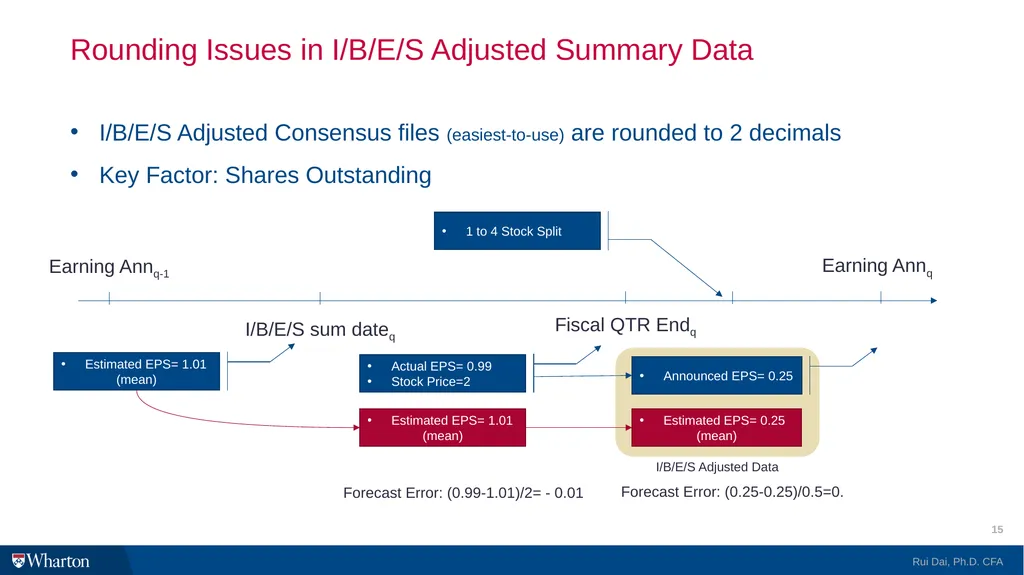
slide15. Rounding Issues in I/B/E/S Adjusted Summary Data Rui Dai, Ph.D. CFA 15 I/B/E/S Adjusted Consensus files (easiest-to-use) are rounded to 2 decimals
Key Factor: Shares Outstanding Earning Annq-1 I/B/E/S sum dateq Fiscal QTR Endq Earning Annq Estimated EPS= 1.01
(mean) Estimated EPS= 0.25
(mean) Forecast Error: (0.99-1.01)/2= - 0.01 Forecast Error: (0.25-0.25)/0.5=0. I/B/E/S Adjusted Data<br>
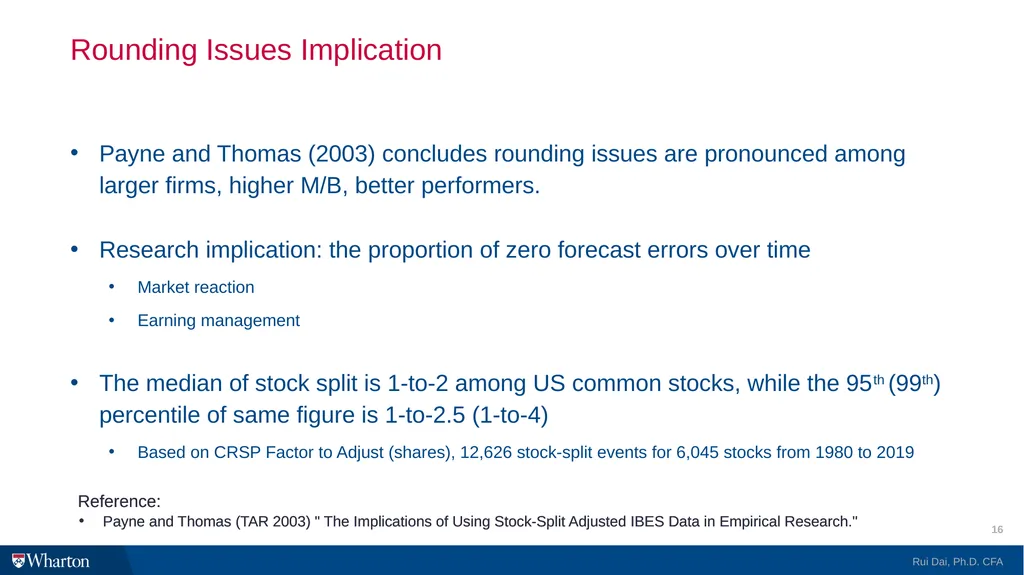
slide16. Rounding Issues Implication Payne and Thomas (2003) concludes rounding issues are pronounced among larger firms, higher M/B, better performers.
Research implication: the proportion of zero forecast errors over time
Market reaction
Earning management
The median of stock split is 1-to-2 among US common stocks, while the 95th (99th) percentile of same figure is 1-to-2.5 (1-to-4)
Based on CRSP Factor to Adjust (shares), 12,626 stock-split events for 6,045 stocks from 1980 to 2019 Rui Dai, Ph.D. CFA 16 Reference:
Payne and Thomas (TAR 2003) " The Implications of Using Stock-Split Adjusted IBES Data in Empirical Research." Reference:
Payne and Thomas (TAR 2003) " The Implications of Using Stock-Split Adjusted IBES Data in Empirical Research."<br>
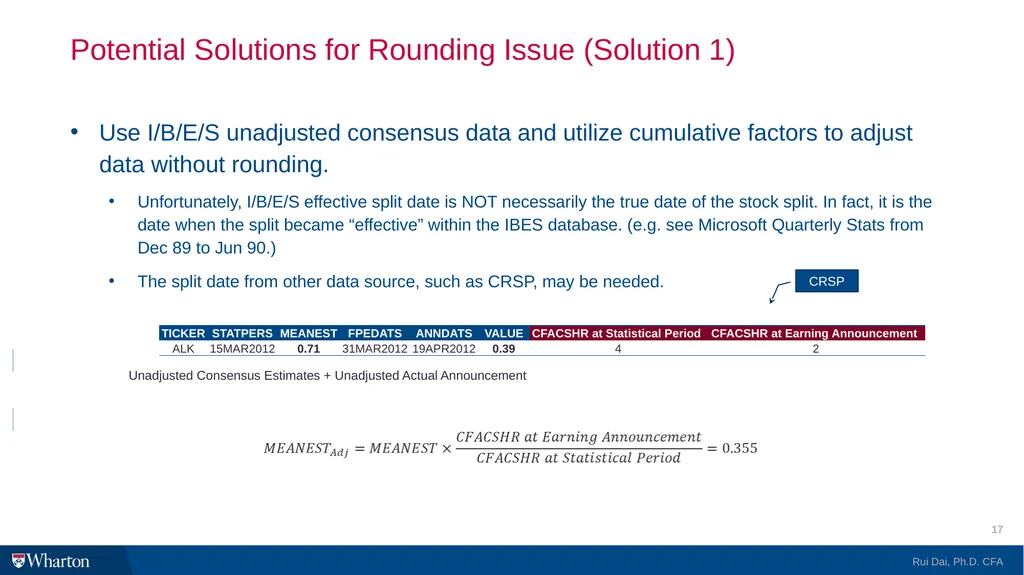
slide17. Potential Solutions for Rounding Issue (Solution 1) Use I/B/E/S unadjusted consensus data and utilize cumulative factors to adjust data without rounding.
Unfortunately, I/B/E/S effective split date is NOT necessarily the true date of the stock split. In fact, it is the date when the split became “effective” within the IBES database. (e.g. see Microsoft Quarterly Stats from Dec 89 to Jun 90.)
The split date from other data source, such as CRSP, may be needed. Rui Dai, Ph.D. CFA 17 CRSP Split 2-for-1 on 2-Jun-98 Split 3-for-1 on 5-Jan-99 Unadjusted Detailed Estimates + Unadjusted Actual Announcement Unadjusted Consensus Estimates + Unadjusted Actual Announcement<br>
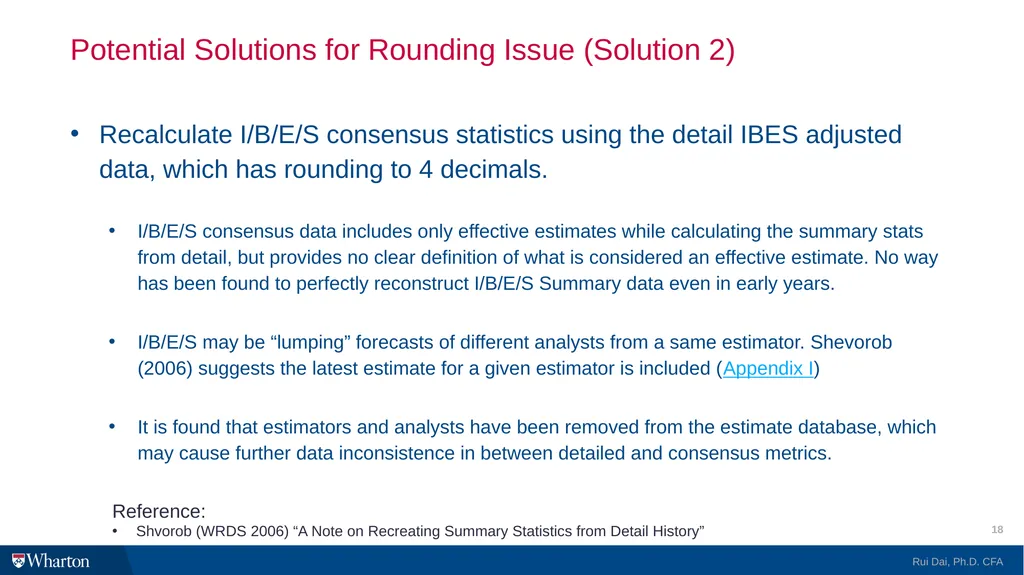
slide18. Potential Solutions for Rounding Issue (Solution 2) Recalculate I/B/E/S consensus statistics using the detail IBES adjusted data, which has rounding to 4 decimals.
I/B/E/S consensus data includes only effective estimates while calculating the summary stats from detail, but provides no clear definition of what is considered an effective estimate. No way has been found to perfectly reconstruct I/B/E/S Summary data even in early years.
I/B/E/S may be “lumping” forecasts of different analysts from a same estimator. Shevorob (2006) suggests the latest estimate for a given estimator is included (Appendix I)
It is found that estimators and analysts have been removed from the estimate database, which may cause further data inconsistence in between detailed and consensus metrics. Rui Dai, Ph.D. CFA 18 Reference:
Shvorob (WRDS 2006) “A Note on Recreating Summary Statistics from Detail History”<br>
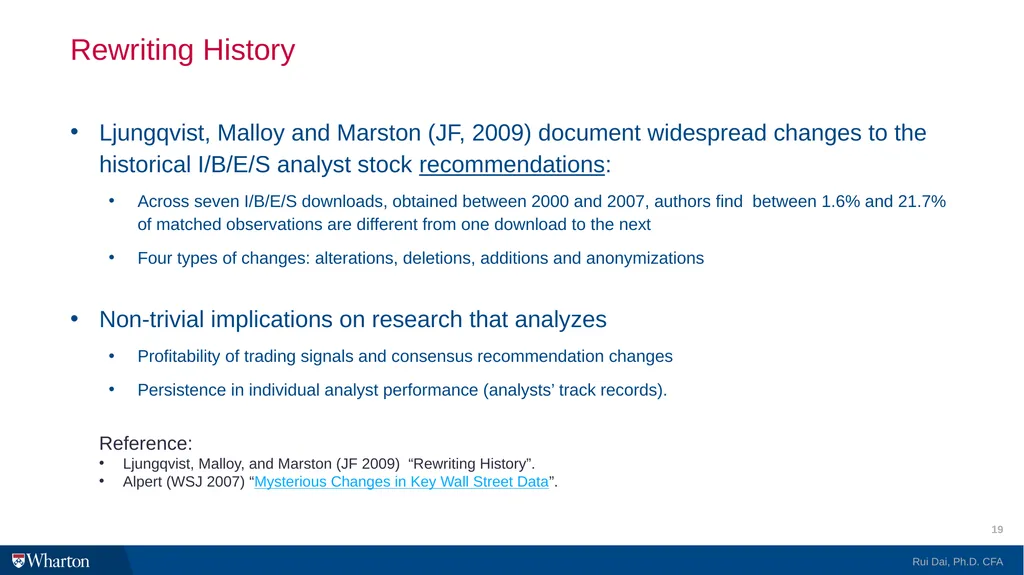
slide19. Rewriting History Ljungqvist, Malloy and Marston (JF, 2009) document widespread changes to the historical I/B/E/S analyst stock recommendations:
Across seven I/B/E/S downloads, obtained between 2000 and 2007, authors find between 1.6% and 21.7% of matched observations are different from one download to the next
Four types of changes: alterations, deletions, additions and anonymizations
Non-trivial implications on research that analyzes
Profitability of trading signals and consensus recommendation changes
Persistence in individual analyst performance (analysts’ track records). Rui Dai, Ph.D. CFA 19 Reference:
Ljungqvist, Malloy, and Marston (JF 2009) “Rewriting History”.
Alpert (WSJ 2007) “Mysterious Changes in Key Wall Street Data”.<br>
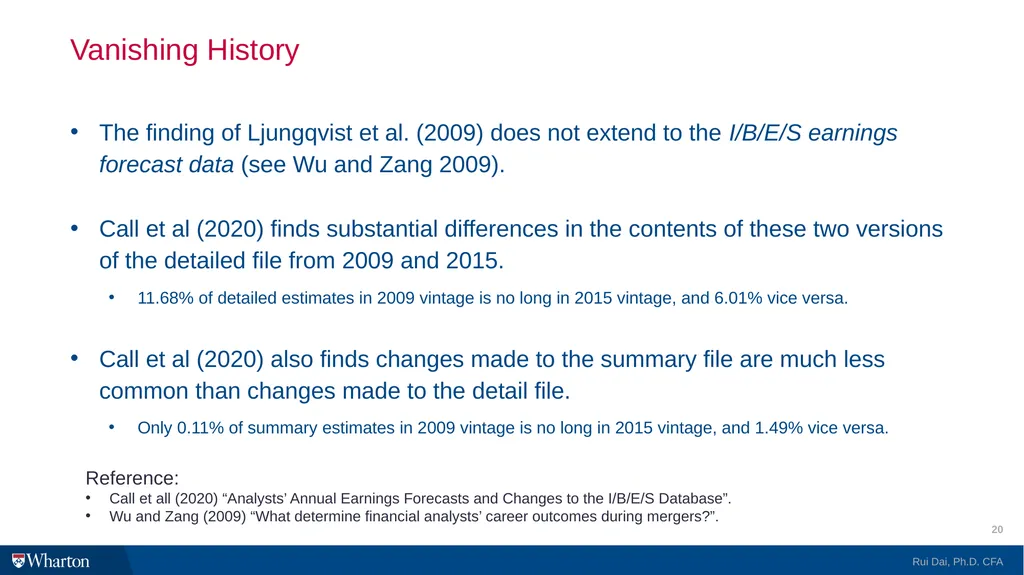
slide20. Vanishing History The finding of Ljungqvist et al. (2009) does not extend to the I/B/E/S earnings forecast data (see Wu and Zang 2009).
Call et al (2020) finds substantial differences in the contents of these two versions of the detailed file from 2009 and 2015.
11.68% of detailed estimates in 2009 vintage is no long in 2015 vintage, and 6.01% vice versa.
Call et al (2020) also finds changes made to the summary file are much less common than changes made to the detail file.
Only 0.11% of summary estimates in 2009 vintage is no long in 2015 vintage, and 1.49% vice versa. Rui Dai, Ph.D. CFA 20 Reference:
Call et all (2020) “Analysts’ Annual Earnings Forecasts and Changes to the I/B/E/S Database”.
Wu and Zang (2009) “What determine financial analysts’ career outcomes during mergers?”.<br>
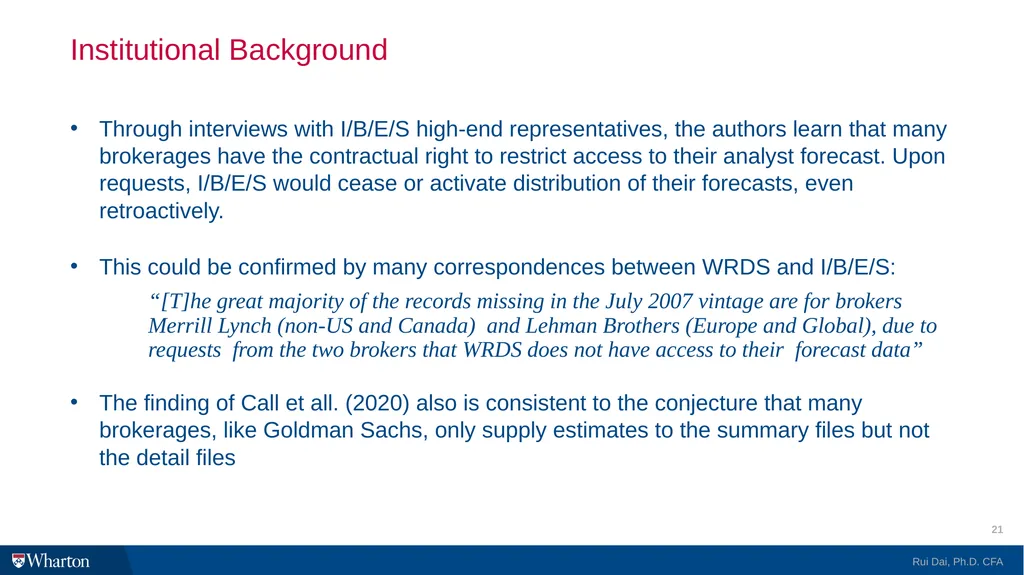
slide21. Institutional Background Through interviews with I/B/E/S high-end representatives, the authors learn that many brokerages have the contractual right to restrict access to their analyst forecast. Upon requests, I/B/E/S would cease or activate distribution of their forecasts, even retroactively.
This could be confirmed by many correspondences between WRDS and I/B/E/S:
“[T]he great majority of the records missing in the July 2007 vintage are for brokers Merrill Lynch (non-US and Canada) and Lehman Brothers (Europe and Global), due to requests from the two brokers that WRDS does not have access to their forecast data”
The finding of Call et all. (2020) also is consistent to the conjecture that many brokerages, like Goldman Sachs, only supply estimates to the summary files but not the detail files Rui Dai, Ph.D. CFA 21<br>
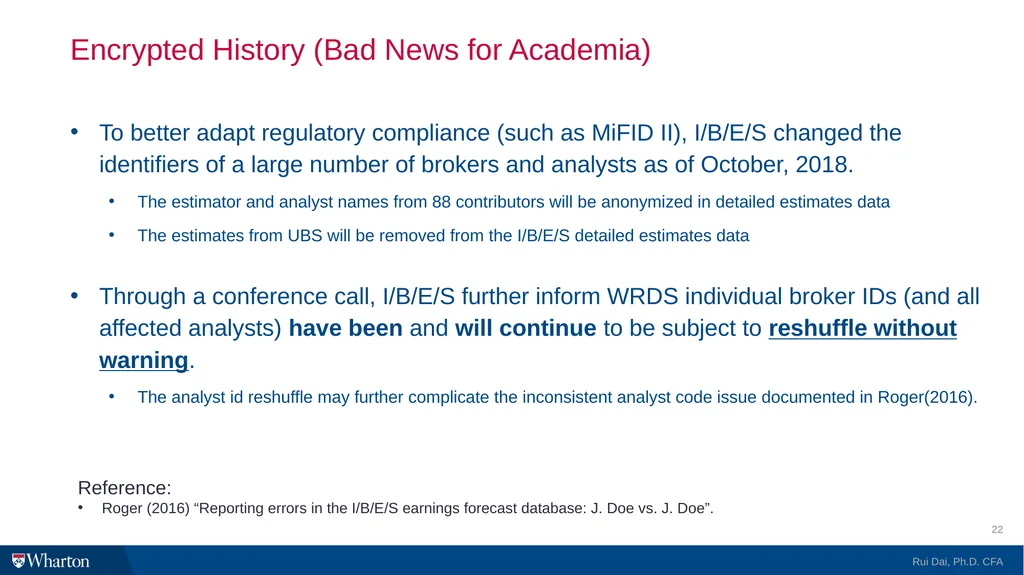
slide22. Encrypted History (Bad News for Academia) To better adapt regulatory compliance (such as MiFID II), I/B/E/S changed the identifiers of a large number of brokers and analysts as of October, 2018.
The estimator and analyst names from 88 contributors will be anonymized in detailed estimates data
The estimates from UBS will be removed from the I/B/E/S detailed estimates data
Through a conference call, I/B/E/S further inform WRDS individual broker IDs (and all affected analysts) have been and will continue to be subject to reshuffle without warning.
The analyst id reshuffle may further complicate the inconsistent analyst code issue documented in Roger(2016). Rui Dai, Ph.D. CFA 22 Reference:
Roger (2016) “Reporting errors in the I/B/E/S earnings forecast database: J. Doe vs. J. Doe”.<br>
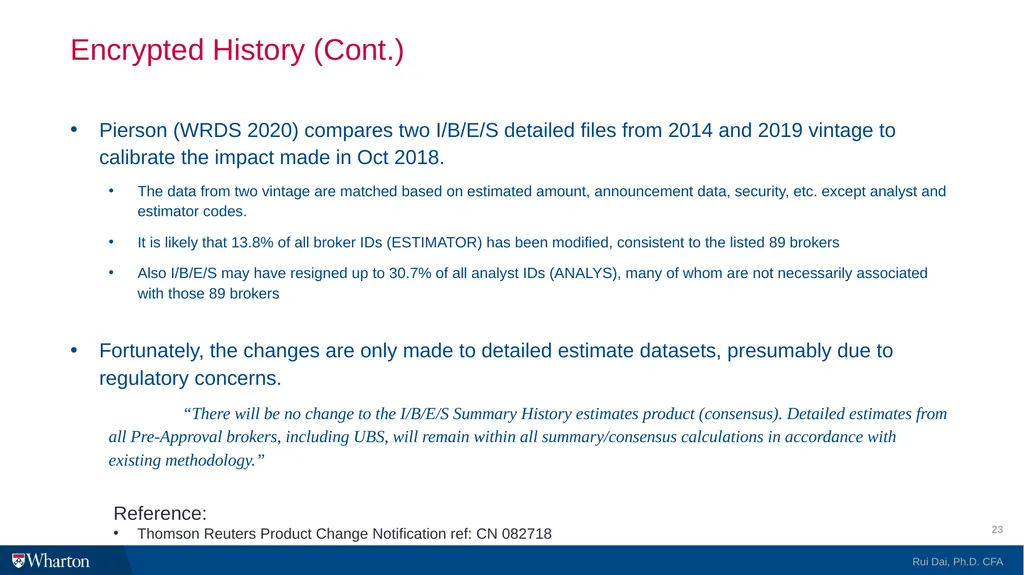
slide23. Encrypted History (Cont.) Pierson (WRDS 2020) compares two I/B/E/S detailed files from 2014 and 2019 vintage to calibrate the impact made in Oct 2018.
The data from two vintage are matched based on estimated amount, announcement data, security, etc. except analyst and estimator codes.
It is likely that 13.8% of all broker IDs (ESTIMATOR) has been modified, consistent to the listed 89 brokers
Also I/B/E/S may have resigned up to 30.7% of all analyst IDs (ANALYS), many of whom are not necessarily associated with those 89 brokers
Fortunately, the changes are only made to detailed estimate datasets, presumably due to regulatory concerns.
“There will be no change to the I/B/E/S Summary History estimates product (consensus). Detailed estimates from all Pre-Approval brokers, including UBS, will remain within all summary/consensus calculations in accordance with existing methodology.” Rui Dai, Ph.D. CFA 23 Reference:
Thomson Reuters Product Change Notification ref: CN 082718<br>
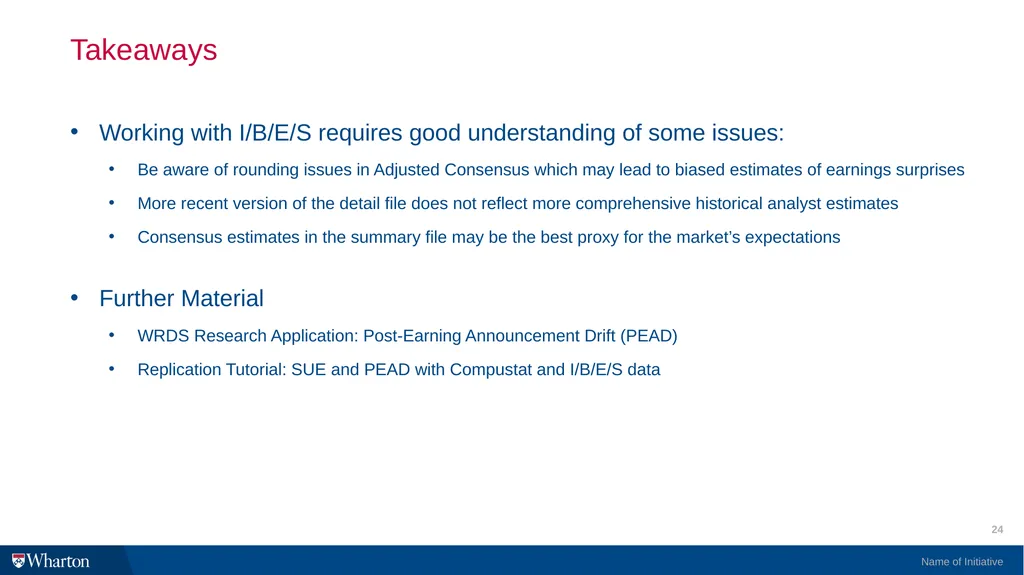
slide24. Takeaways Working with I/B/E/S requires good understanding of some issues:
Be aware of rounding issues in Adjusted Consensus which may lead to biased estimates of earnings surprises
More recent version of the detail file does not reflect more comprehensive historical analyst estimates
Consensus estimates in the summary file may be the best proxy for the market’s expectations
Further Material
WRDS Research Application: Post-Earning Announcement Drift (PEAD)
Replication Tutorial: SUE and PEAD with Compustat and I/B/E/S data Name of Initiative 24<br>
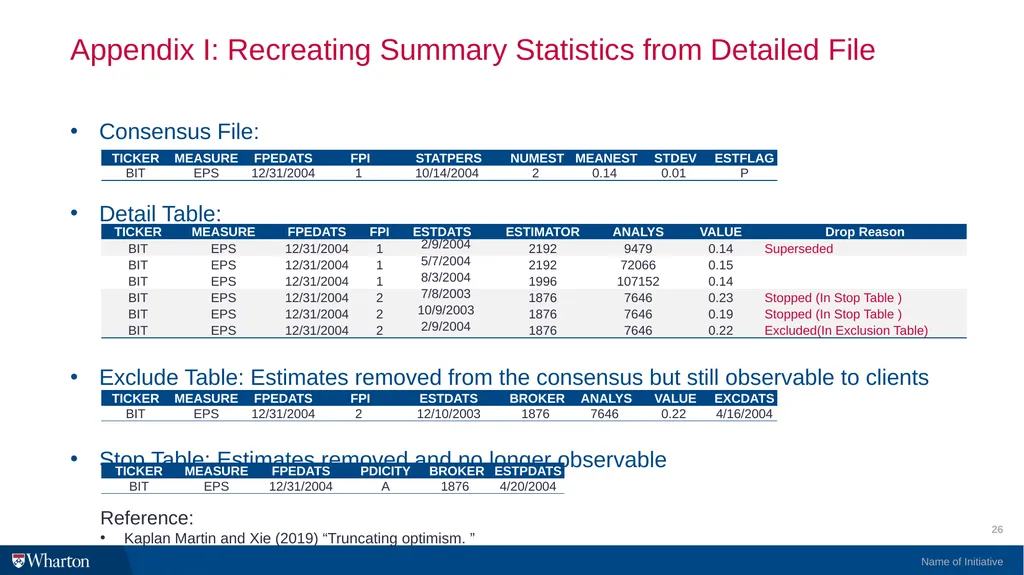
slide26. Appendix I: Recreating Summary Statistics from Detailed File Consensus File:
Detail Table:
Exclude Table: Estimates removed from the consensus but still observable to clients
Stop Table: Estimates removed and no longer observable Name of Initiative 26 Reference:
Kaplan Martin and Xie (2019) “Truncating optimism. ”<br>
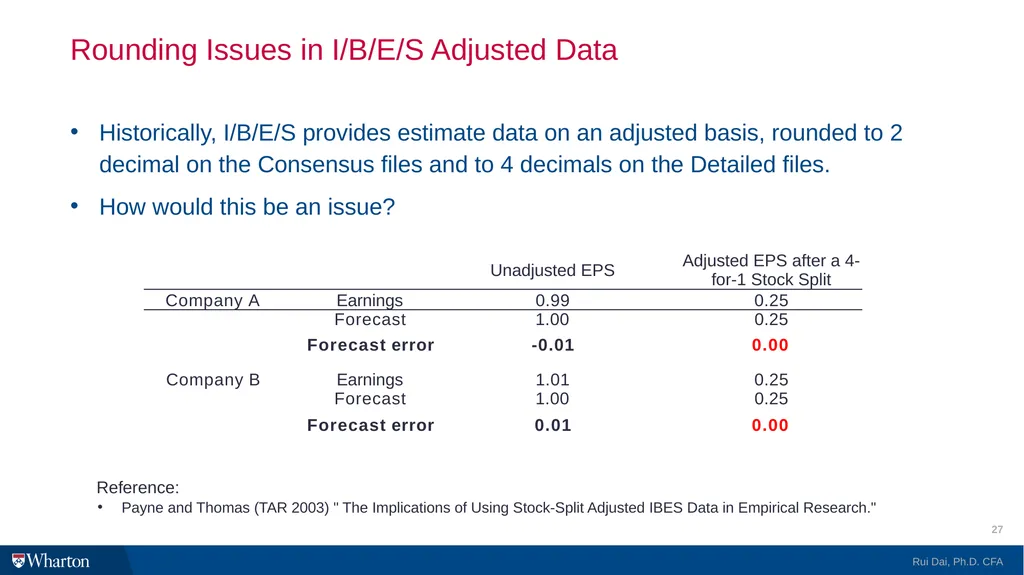
slide27. Rounding Issues in I/B/E/S Adjusted Data Historically, I/B/E/S provides estimate data on an adjusted basis, rounded to 2 decimal on the Consensus files and to 4 decimals on the Detailed files.
How would this be an issue? Rui Dai, Ph.D. CFA 27 Reference:
Payne and Thomas (TAR 2003) " The Implications of Using Stock-Split Adjusted IBES Data in Empirical Research."<br>
slide2. Rui Dai, Ph.D. CFA 2<br>
slide3. Part I: Introduction<br>
slide4. Institutional Brokers' Estimate System (I/B/E/S) I/B/E/S is recognized as the conventional analyst forecast data in academia
Broker houses contribute to I/B/E/S with US data back to 1975 and International data back to 1987. Rui Dai, Ph.D. CFA 4<br>
slide5. Frequently used I/B/E/S data I/B/E/S Estimates
It is an historical earnings estimate database containing analyst estimates.
It includes more than 20 forecast measures - including EPS (earnings per share), revenue, price targets, EBITDA and pre-tax profits.
The data available on both consensus and detailed levels, covering both U.S. and international companies.
I/B/E/S Guidance
It includes management's predictions about their own company
It combines information previously available in the Company Issued Guidance (CIG) file in base I/B/E/S and information from the defunct First Call database Rui Dai, Ph.D. CFA 5<br>
slide6. I/B/E/S Estimates Data Categories Data Dimensions
Detailed vs Consensus
EPS vs No-EPS
Adjusted vs Non-Adjusted
US vs Non-US Rui Dai, Ph.D. CFA 6<br>
slide7. I/B/E/S Estimates Data Collection 3,000+ estimators(brokers) contribute data to I/B/E/S from the largest global houses to regional and local brokers, totaling over 30,000 individual analysts.
Company actuals are collected from multiple newswire feeds, press releases, company websites and public filings.
Detailed estimates are collected each day as they are released by analysts. Summary history consists of chronological snapshots of consensus level data taken on a monthly basis. Rui Dai, Ph.D. CFA 7<br>
slide8. Identifier System Permanent ID:
I/B/E/S ticker, denoted as 'TICKER', is a unique identifier assigned to each security that is consistent throughout I/B/E/S History.
Security ID:
CUSIP/SEDOL data field contain historical CUSIP, or SEDOL when CUSIP is not available.
Link I/B/E/S and Other databases
See the programing guide on linking I/B/E/S with CRSP and Compustat Rui Dai, Ph.D. CFA 8<br>
slide9. I/B/E/S Jargon Parties:
Estimator: Sell-side institution or contributor (mostly broker house)
Analyst: analyst who makes the forecast and work for sell-side institution
Indicators:
Forecast Period Indicator (FPI): a code to identify estimates for forecasting period
e.g. 6: Next Fiscal Quarter and 1: Next Fiscal Year
Primary/Diluted Indicator (PDI): share base selected for a company
Primary/Diluted Flag (PDF): share base selected for an estimate Rui Dai, Ph.D. CFA 9<br>
slide10. Forecasting Time Lines Dates:
Announce date(ANNDATS): the date that the forecast/actual was reported
Activation date(ACTDATS): the date that the forecast/actual was recorded by the data vendor
Forecast Period End Date (FPEDATS): the date to which the estimate applies
Review Date (REVDATS): most recent date that an estimate was confirmed as accurate
Statistical Period (STATPERS): the date in a month summary statistics of estimates are calculated Rui Dai, Ph.D. CFA 10 Reference:
Kaplan, et al (2019): Truncating optimism<br>
slide11. Data Example Detailed adjusted EPS estimate table
On 17‐Jan‐06 (ANNDATS), analyst 49595 (ANALYS) at Estimator 85 (ESTIMATOR) predicts that the EPS for IBM with fiscal period ending 31‐Dec‐06 (FPEDATS) is $5.8 (VALUE) . This estimates was entered into the I/B/E/S database on 18‐Jan‐06 (ACTDATS). On 18‐Jan‐07(ANNDATS_ACT), IBM announced an actual EPS of $6.06 (ACTUAL) for this fiscal period.
Consensus adjusted EPS estimate table
The Summary statistics calculated on 19‐Jan‐06 (STATPERS) shows that for forecast period ending 31‐Dec‐06 (FPEDATS), forecasted earnings per share has a median of $5.8, mean of $5.79 with standard deviation of 0.08, which is calculated from 23 esitmates. Rui Dai, Ph.D. CFA 11<br>
slide12. Accounting Background: Street Numbers Generally Accepted Accounting Principals define the earnings reported on financial statements, commonly referred to as "GAAP earnings“
However, in press releases and conference calls, managers and analysts often report earnings excluding items that appear in GAAP earnings (e.g., special items, stock-based compensation expense, etc.)
The use and definition of these non-GAAP earnings numbers, popularly referred to as “pro forma earnings" or “Street earnings” varies by firm
So be aware that earnings on Compustat are GAAP, while I/B/E/S tracks “Street Earnings” Rui Dai, Ph.D. CFA 12 Reference:
Bradshaw and Sloan (JAR, 2002) “GAAP vs. The Street: an Empirical Assessment of Two Alternative Definitions of Earnings”<br>
slide13. Street Numbers v.s. GAAP Intuit reports the performance metrics in its 2006 earnings announcement:
Street earnings (I/B/E/S) could exclude various expenses required by GAAP Rui Dai, Ph.D. CFA 13 Note: there is another reason why Compustat reports different numbers from I/B/E/S: Compustat quarterly data reports restated values, while I/B/E/S includes the originally reported earnings.<br>
slide14. Part II: Empirical Research Guide<br>
slide15. Rounding Issues in I/B/E/S Adjusted Summary Data Rui Dai, Ph.D. CFA 15 I/B/E/S Adjusted Consensus files (easiest-to-use) are rounded to 2 decimals
Key Factor: Shares Outstanding Earning Annq-1 I/B/E/S sum dateq Fiscal QTR Endq Earning Annq Estimated EPS= 1.01
(mean) Estimated EPS= 0.25
(mean) Forecast Error: (0.99-1.01)/2= - 0.01 Forecast Error: (0.25-0.25)/0.5=0. I/B/E/S Adjusted Data<br>
slide16. Rounding Issues Implication Payne and Thomas (2003) concludes rounding issues are pronounced among larger firms, higher M/B, better performers.
Research implication: the proportion of zero forecast errors over time
Market reaction
Earning management
The median of stock split is 1-to-2 among US common stocks, while the 95th (99th) percentile of same figure is 1-to-2.5 (1-to-4)
Based on CRSP Factor to Adjust (shares), 12,626 stock-split events for 6,045 stocks from 1980 to 2019 Rui Dai, Ph.D. CFA 16 Reference:
Payne and Thomas (TAR 2003) " The Implications of Using Stock-Split Adjusted IBES Data in Empirical Research." Reference:
Payne and Thomas (TAR 2003) " The Implications of Using Stock-Split Adjusted IBES Data in Empirical Research."<br>
slide17. Potential Solutions for Rounding Issue (Solution 1) Use I/B/E/S unadjusted consensus data and utilize cumulative factors to adjust data without rounding.
Unfortunately, I/B/E/S effective split date is NOT necessarily the true date of the stock split. In fact, it is the date when the split became “effective” within the IBES database. (e.g. see Microsoft Quarterly Stats from Dec 89 to Jun 90.)
The split date from other data source, such as CRSP, may be needed. Rui Dai, Ph.D. CFA 17 CRSP Split 2-for-1 on 2-Jun-98 Split 3-for-1 on 5-Jan-99 Unadjusted Detailed Estimates + Unadjusted Actual Announcement Unadjusted Consensus Estimates + Unadjusted Actual Announcement<br>
slide18. Potential Solutions for Rounding Issue (Solution 2) Recalculate I/B/E/S consensus statistics using the detail IBES adjusted data, which has rounding to 4 decimals.
I/B/E/S consensus data includes only effective estimates while calculating the summary stats from detail, but provides no clear definition of what is considered an effective estimate. No way has been found to perfectly reconstruct I/B/E/S Summary data even in early years.
I/B/E/S may be “lumping” forecasts of different analysts from a same estimator. Shevorob (2006) suggests the latest estimate for a given estimator is included (Appendix I)
It is found that estimators and analysts have been removed from the estimate database, which may cause further data inconsistence in between detailed and consensus metrics. Rui Dai, Ph.D. CFA 18 Reference:
Shvorob (WRDS 2006) “A Note on Recreating Summary Statistics from Detail History”<br>
slide19. Rewriting History Ljungqvist, Malloy and Marston (JF, 2009) document widespread changes to the historical I/B/E/S analyst stock recommendations:
Across seven I/B/E/S downloads, obtained between 2000 and 2007, authors find between 1.6% and 21.7% of matched observations are different from one download to the next
Four types of changes: alterations, deletions, additions and anonymizations
Non-trivial implications on research that analyzes
Profitability of trading signals and consensus recommendation changes
Persistence in individual analyst performance (analysts’ track records). Rui Dai, Ph.D. CFA 19 Reference:
Ljungqvist, Malloy, and Marston (JF 2009) “Rewriting History”.
Alpert (WSJ 2007) “Mysterious Changes in Key Wall Street Data”.<br>
slide20. Vanishing History The finding of Ljungqvist et al. (2009) does not extend to the I/B/E/S earnings forecast data (see Wu and Zang 2009).
Call et al (2020) finds substantial differences in the contents of these two versions of the detailed file from 2009 and 2015.
11.68% of detailed estimates in 2009 vintage is no long in 2015 vintage, and 6.01% vice versa.
Call et al (2020) also finds changes made to the summary file are much less common than changes made to the detail file.
Only 0.11% of summary estimates in 2009 vintage is no long in 2015 vintage, and 1.49% vice versa. Rui Dai, Ph.D. CFA 20 Reference:
Call et all (2020) “Analysts’ Annual Earnings Forecasts and Changes to the I/B/E/S Database”.
Wu and Zang (2009) “What determine financial analysts’ career outcomes during mergers?”.<br>
slide21. Institutional Background Through interviews with I/B/E/S high-end representatives, the authors learn that many brokerages have the contractual right to restrict access to their analyst forecast. Upon requests, I/B/E/S would cease or activate distribution of their forecasts, even retroactively.
This could be confirmed by many correspondences between WRDS and I/B/E/S:
“[T]he great majority of the records missing in the July 2007 vintage are for brokers Merrill Lynch (non-US and Canada) and Lehman Brothers (Europe and Global), due to requests from the two brokers that WRDS does not have access to their forecast data”
The finding of Call et all. (2020) also is consistent to the conjecture that many brokerages, like Goldman Sachs, only supply estimates to the summary files but not the detail files Rui Dai, Ph.D. CFA 21<br>
slide22. Encrypted History (Bad News for Academia) To better adapt regulatory compliance (such as MiFID II), I/B/E/S changed the identifiers of a large number of brokers and analysts as of October, 2018.
The estimator and analyst names from 88 contributors will be anonymized in detailed estimates data
The estimates from UBS will be removed from the I/B/E/S detailed estimates data
Through a conference call, I/B/E/S further inform WRDS individual broker IDs (and all affected analysts) have been and will continue to be subject to reshuffle without warning.
The analyst id reshuffle may further complicate the inconsistent analyst code issue documented in Roger(2016). Rui Dai, Ph.D. CFA 22 Reference:
Roger (2016) “Reporting errors in the I/B/E/S earnings forecast database: J. Doe vs. J. Doe”.<br>
slide23. Encrypted History (Cont.) Pierson (WRDS 2020) compares two I/B/E/S detailed files from 2014 and 2019 vintage to calibrate the impact made in Oct 2018.
The data from two vintage are matched based on estimated amount, announcement data, security, etc. except analyst and estimator codes.
It is likely that 13.8% of all broker IDs (ESTIMATOR) has been modified, consistent to the listed 89 brokers
Also I/B/E/S may have resigned up to 30.7% of all analyst IDs (ANALYS), many of whom are not necessarily associated with those 89 brokers
Fortunately, the changes are only made to detailed estimate datasets, presumably due to regulatory concerns.
“There will be no change to the I/B/E/S Summary History estimates product (consensus). Detailed estimates from all Pre-Approval brokers, including UBS, will remain within all summary/consensus calculations in accordance with existing methodology.” Rui Dai, Ph.D. CFA 23 Reference:
Thomson Reuters Product Change Notification ref: CN 082718<br>
slide24. Takeaways Working with I/B/E/S requires good understanding of some issues:
Be aware of rounding issues in Adjusted Consensus which may lead to biased estimates of earnings surprises
More recent version of the detail file does not reflect more comprehensive historical analyst estimates
Consensus estimates in the summary file may be the best proxy for the market’s expectations
Further Material
WRDS Research Application: Post-Earning Announcement Drift (PEAD)
Replication Tutorial: SUE and PEAD with Compustat and I/B/E/S data Name of Initiative 24<br>
slide26. Appendix I: Recreating Summary Statistics from Detailed File Consensus File:
Detail Table:
Exclude Table: Estimates removed from the consensus but still observable to clients
Stop Table: Estimates removed and no longer observable Name of Initiative 26 Reference:
Kaplan Martin and Xie (2019) “Truncating optimism. ”<br>
slide27. Rounding Issues in I/B/E/S Adjusted Data Historically, I/B/E/S provides estimate data on an adjusted basis, rounded to 2 decimal on the Consensus files and to 4 decimals on the Detailed files.
How would this be an issue? Rui Dai, Ph.D. CFA 27 Reference:
Payne and Thomas (TAR 2003) " The Implications of Using Stock-Split Adjusted IBES Data in Empirical Research."<br>