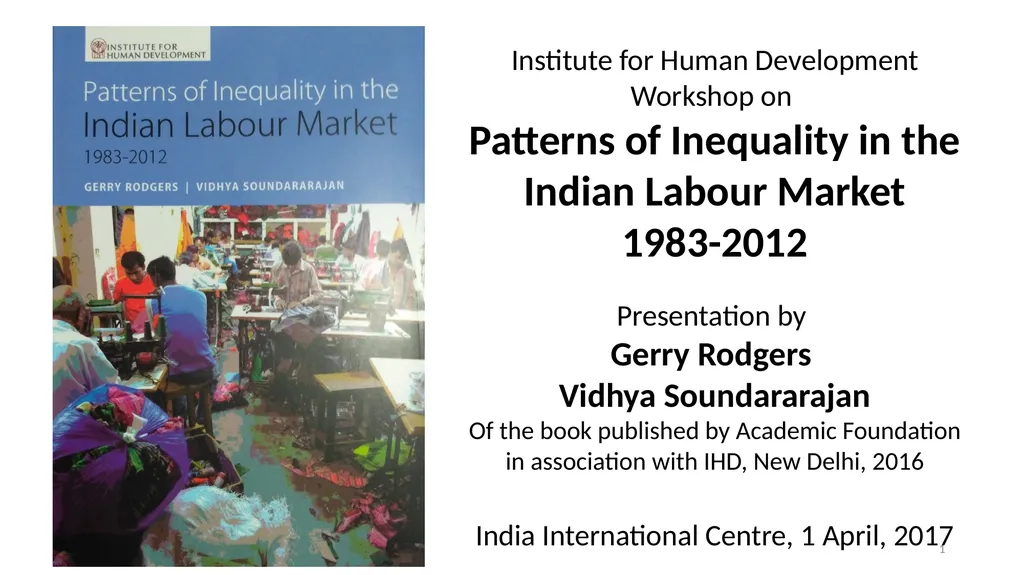
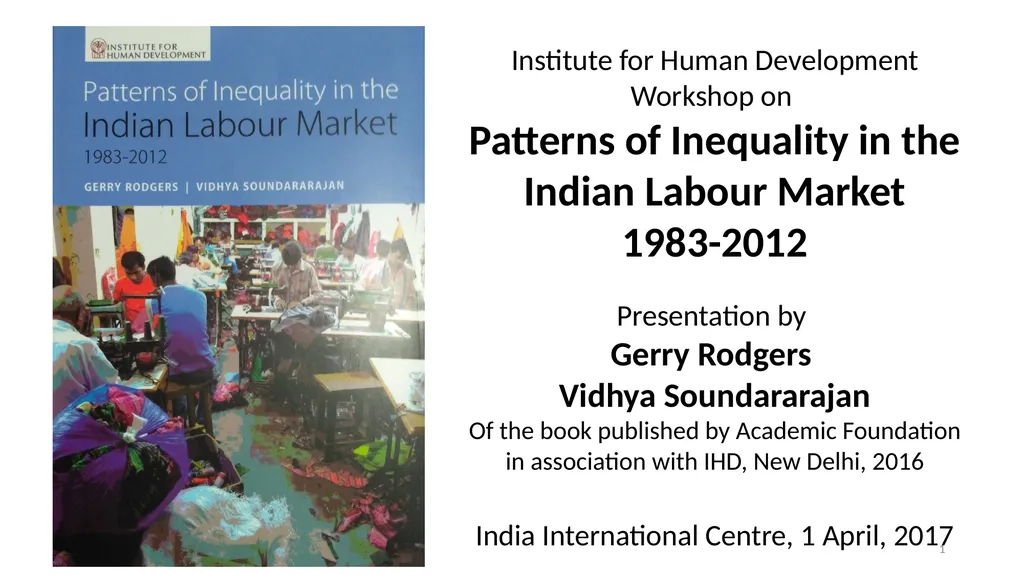
Institute for Human Development Workshop on Patterns of Inequality in the Indian Labour Market 1983-2012 Presentation by Gerry Rodgers Vidhya Soundararajan Of the book published by Academic Foundation in association with IHD, New Delhi,
"Institute for Human Development Workshop on" is the property of its rightful owner. Permission is granted to
download and print the materials on this website for personal, non-commercial use only, and to display it
on your personal computer provided you do not modify the materials and that you retain all copyright
notices contained in the materials. By downloading content from our website, you accept the terms of this
agreement.
Presentation Transcript
01
Institute for Human Development
Workshop on
Patterns of Inequality in the Indian Labour Market
1983-2012
Presentation by
Gerry Rodgers
Vidhya Soundararajan
Of the book published by Academic Foundation in association with IHD, New Delhi, 2016
India International Centre, 1 April, 2017 1<br>
02
Introduction This analysis of labour market inequality forms part of a wider comparative study of Brazil and India
Theoretical framework of the wider study: long term historical analysis of the impact on inequality of growth regimes and institutional change
Goal of this publication is more modest - looks at major dimensions of labour market segmentation and differentiation in India – an input to the wider picture
We look at wage and employment differentials by labour status, gender, caste/community, region and education. Drawing on a large literature (Thorat, Deshpande, many others).
We also looked at some other related aspects of inequality, in particular the distribution of household expenditure, factor shares, and occupational patterns
First some (familiar) basic trends: 2<br>
03
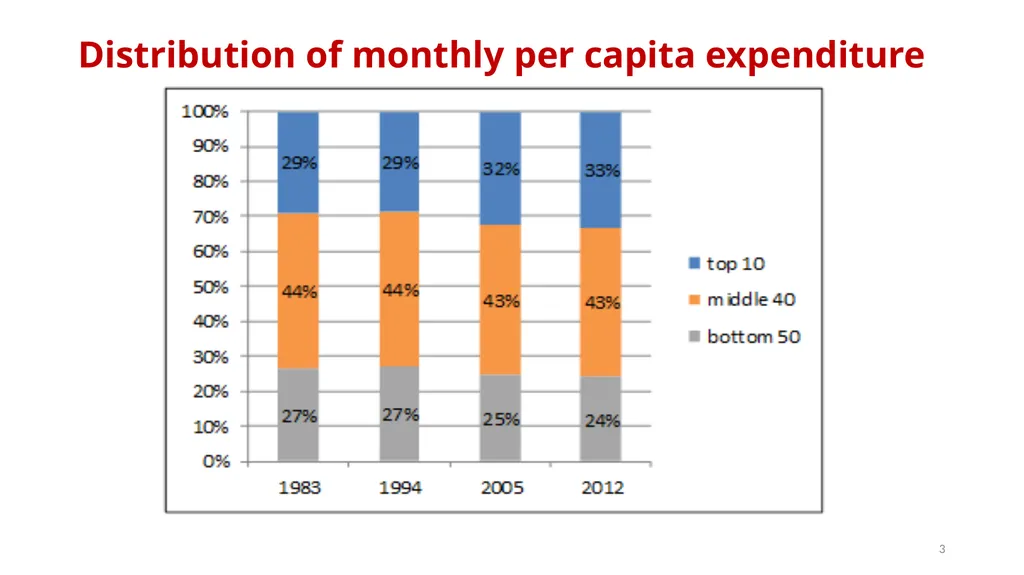
Distribution of monthly per capita expenditure 3<br>
04
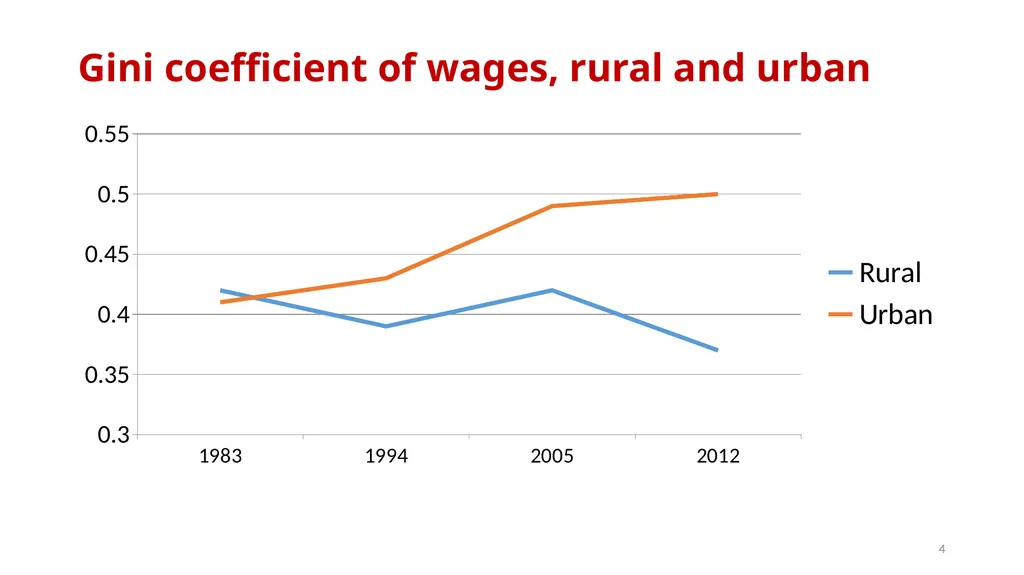
Gini coefficient of wages, rural and urban 4<br>
05
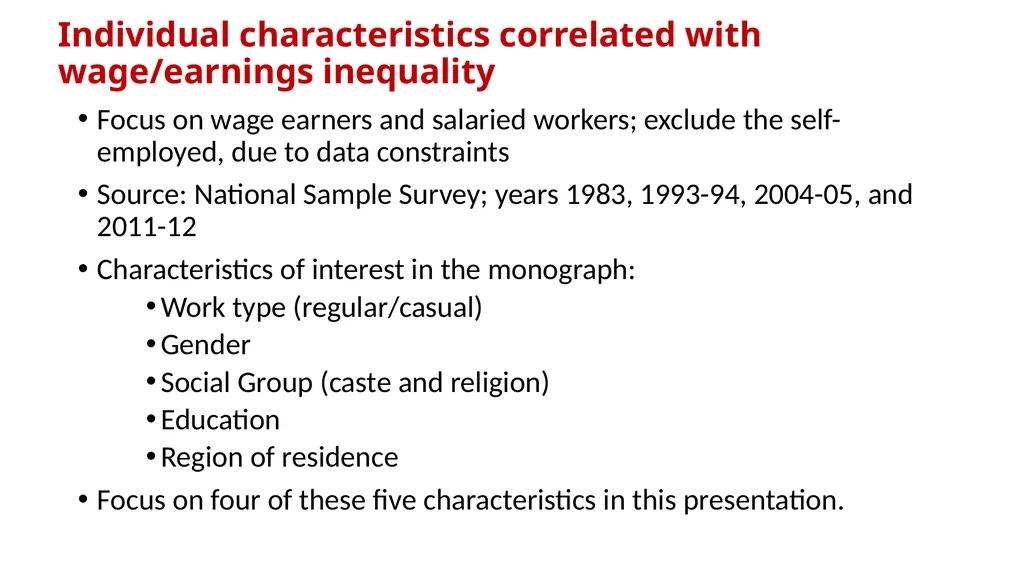
Individual characteristics correlated with wage/earnings inequality Focus on wage earners and salaried workers; exclude the self-employed, due to data constraints
Source: National Sample Survey; years 1983, 1993-94, 2004-05, and 2011-12
Characteristics of interest in the monograph:
Work type (regular/casual)
Gender
Social Group (caste and religion)
Education
Region of residence
Focus on four of these five characteristics in this presentation.<br>
06
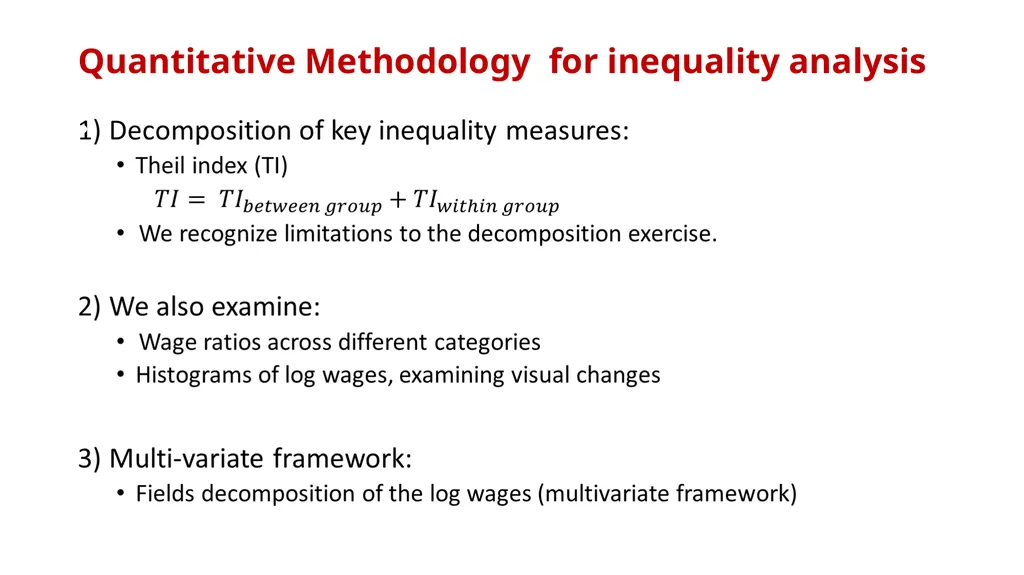
Quantitative Methodology for inequality analysis<br>
07
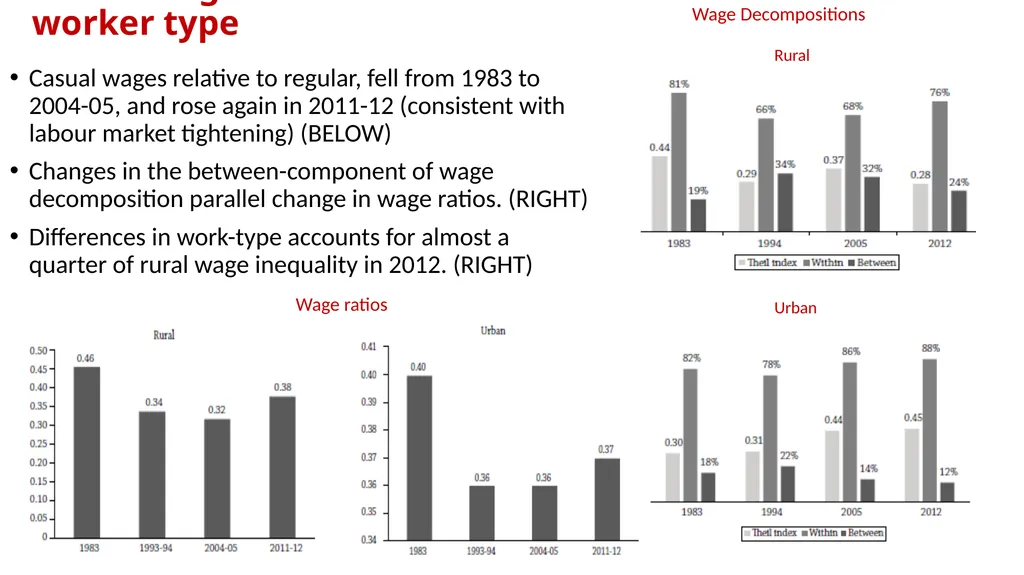
Casual-Regular worker type Casual wages relative to regular, fell from 1983 to 2004-05, and rose again in 2011-12 (consistent with labour market tightening) (BELOW)
Changes in the between-component of wage decomposition parallel change in wage ratios. (RIGHT)
Differences in work-type accounts for almost a quarter of rural wage inequality in 2012. (RIGHT) Wage ratios Rural Urban Wage Decompositions<br>
08
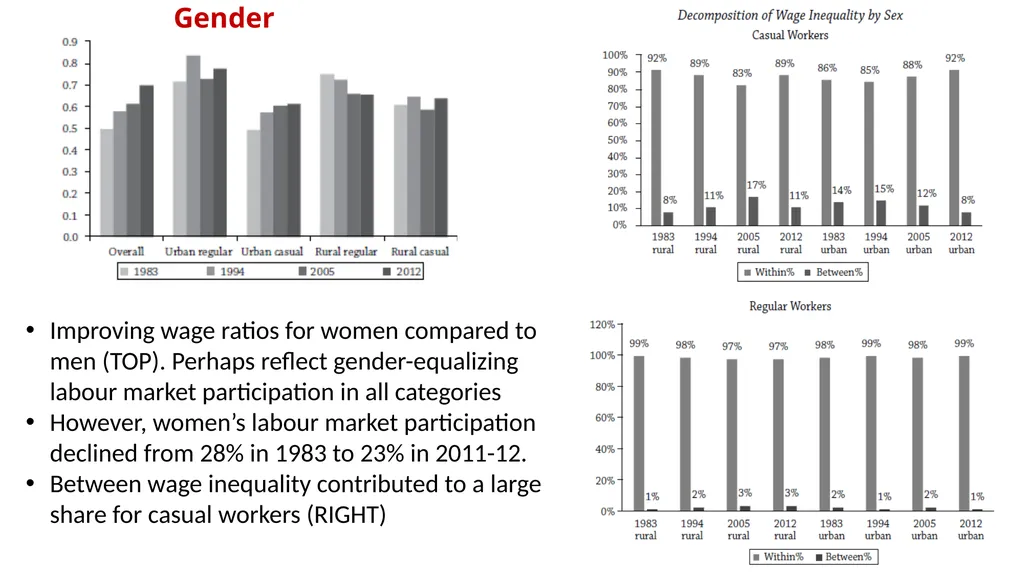
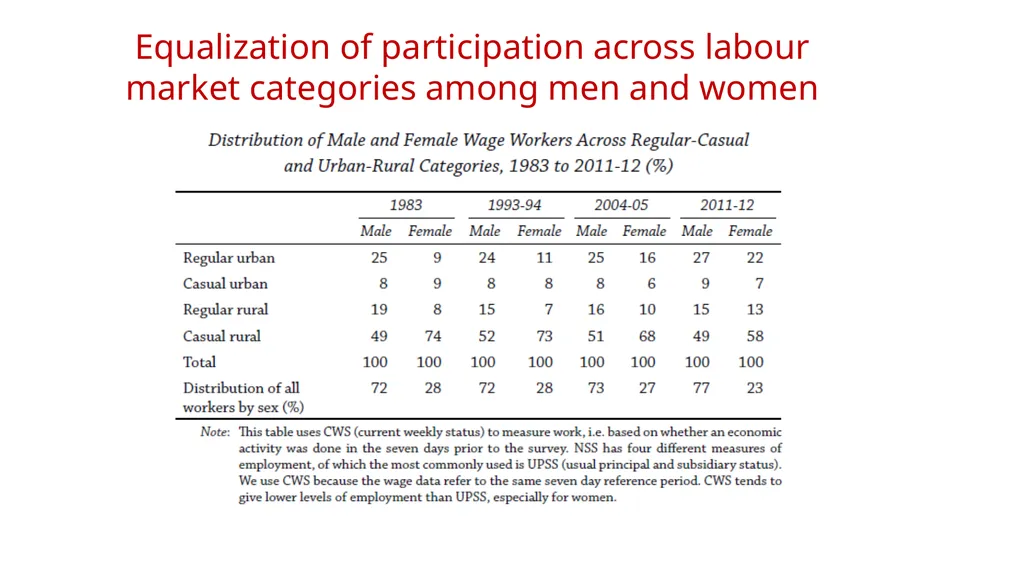
Gender Improving wage ratios for women compared to men (TOP). Perhaps reflect gender-equalizing labour market participation in all categories
However, women’s labour market participation declined from 28% in 1983 to 23% in 2011-12.
Between wage inequality contributed to a large share for casual workers (RIGHT)<br>
09
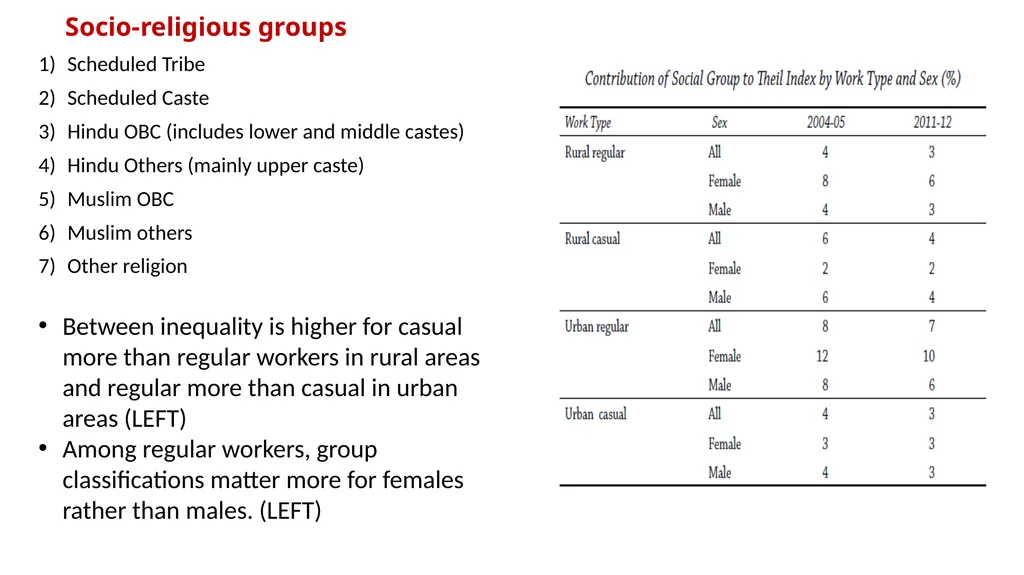
Socio-religious groups Scheduled Tribe
Scheduled Caste
Hindu OBC (includes lower and middle castes)
Hindu Others (mainly upper caste)
Muslim OBC
Muslim others
Other religion Between inequality is higher for casual more than regular workers in rural areas and regular more than casual in urban areas (LEFT)
Among regular workers, group classifications matter more for females rather than males. (LEFT)<br>
10
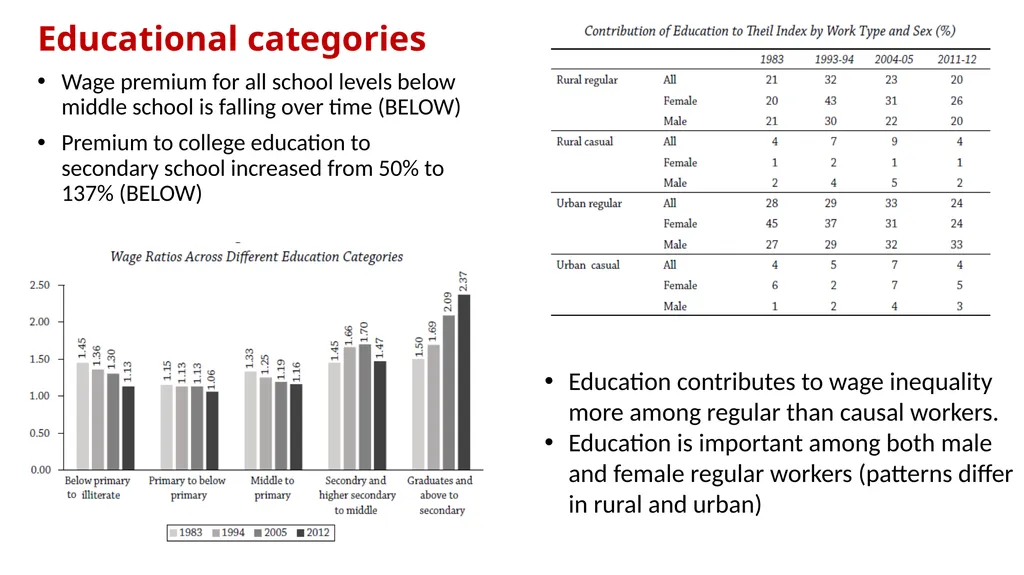
Educational categories Wage premium for all school levels below middle school is falling over time (BELOW)
Premium to college education to secondary school increased from 50% to 137% (BELOW) Education contributes to wage inequality more among regular than causal workers.
Education is important among both male and female regular workers (patterns differ in rural and urban)<br>
11
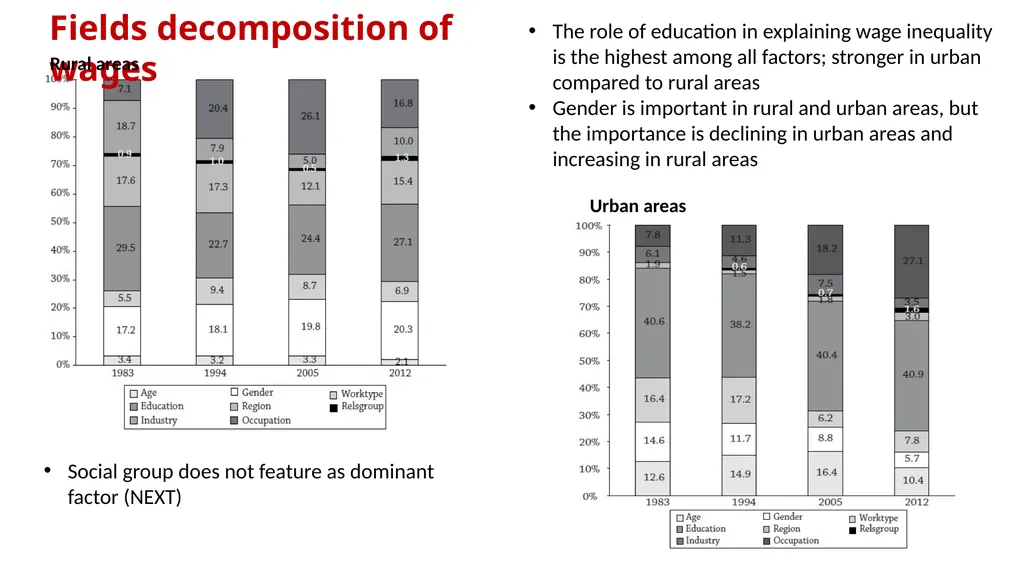
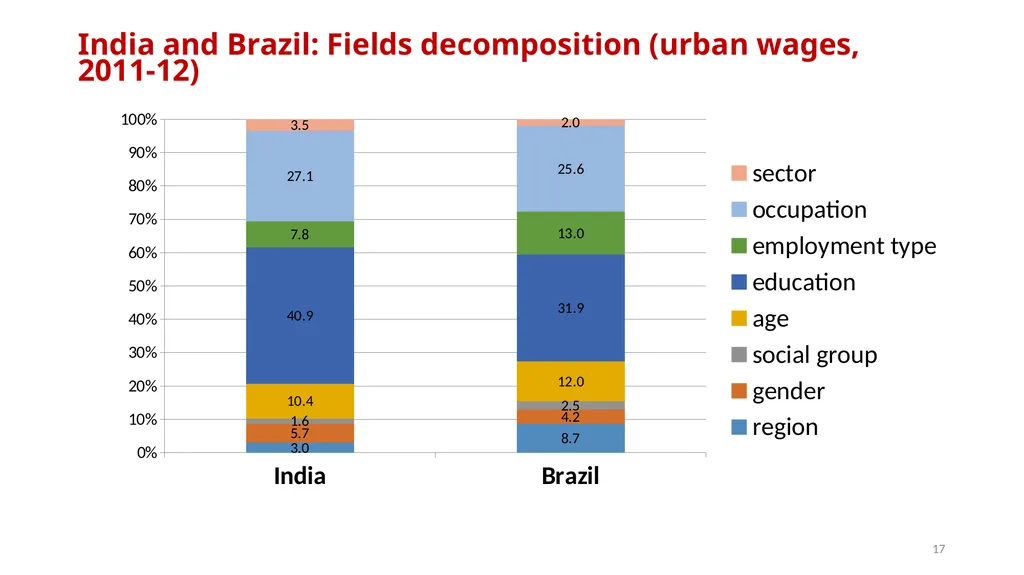
Fields decomposition of wages Urban areas The role of education in explaining wage inequality is the highest among all factors; stronger in urban compared to rural areas
Gender is important in rural and urban areas, but the importance is declining in urban areas and increasing in rural areas Social group does not feature as dominant factor (NEXT) Rural areas<br>
12
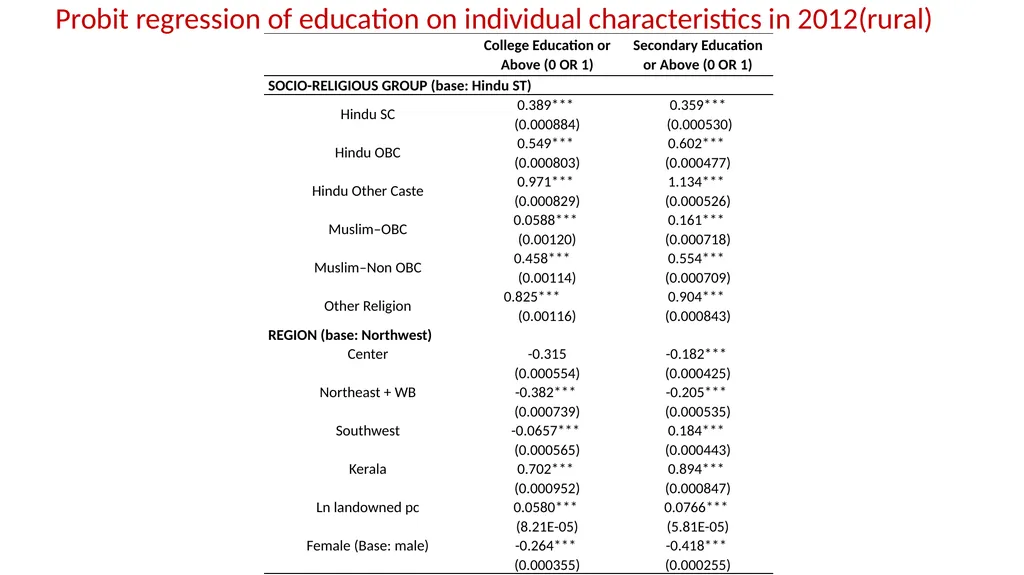
Probit regression of education on individual characteristics in 2012(rural)<br>
13
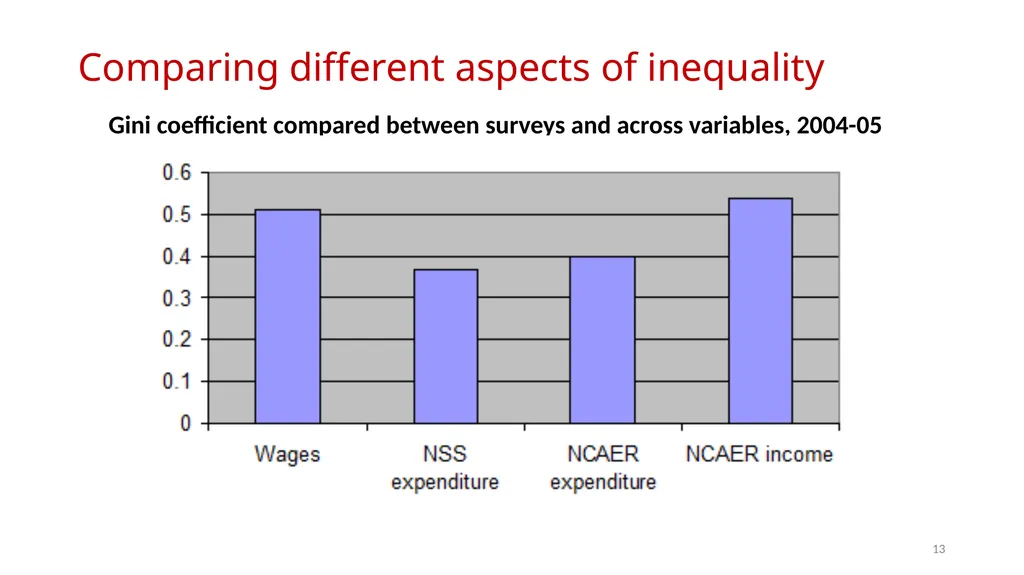
Comparing different aspects of inequality Gini coefficient compared between surveys and across variables, 2004-05 13<br>
14
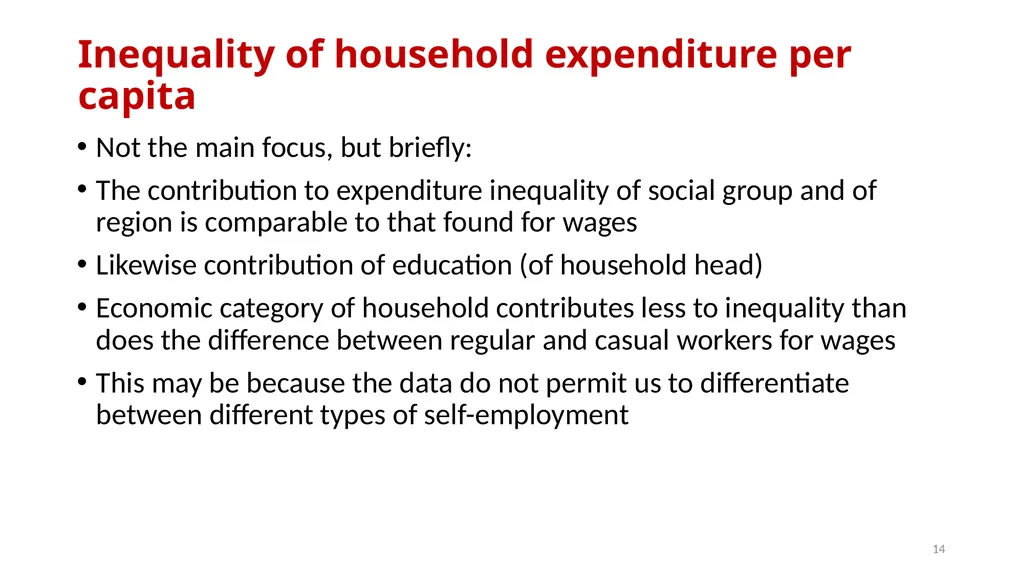
Inequality of household expenditure per capita Not the main focus, but briefly:
The contribution to expenditure inequality of social group and of region is comparable to that found for wages
Likewise contribution of education (of household head)
Economic category of household contributes less to inequality than does the difference between regular and casual workers for wages
This may be because the data do not permit us to differentiate between different types of self-employment 14<br>
15
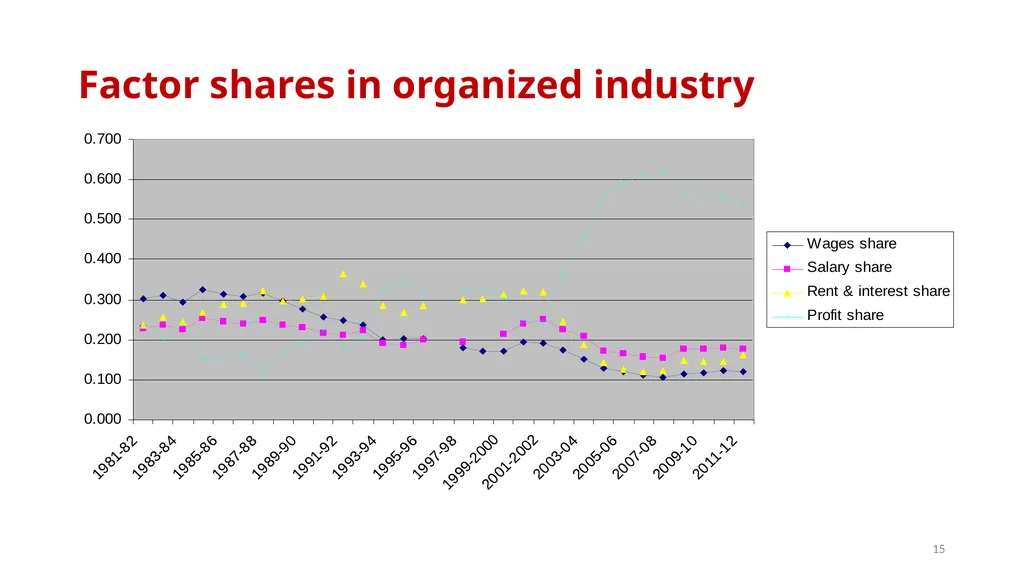
Factor shares in organized industry 15<br>
16
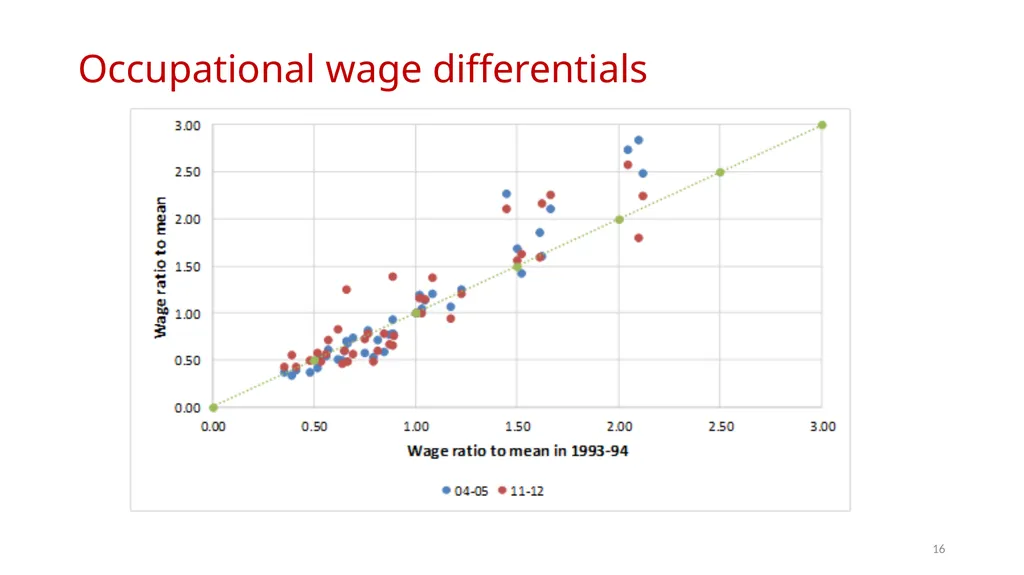
Occupational wage differentials 16<br>
17
India and Brazil: Fields decomposition (urban wages, 2011-12) 17<br>
18
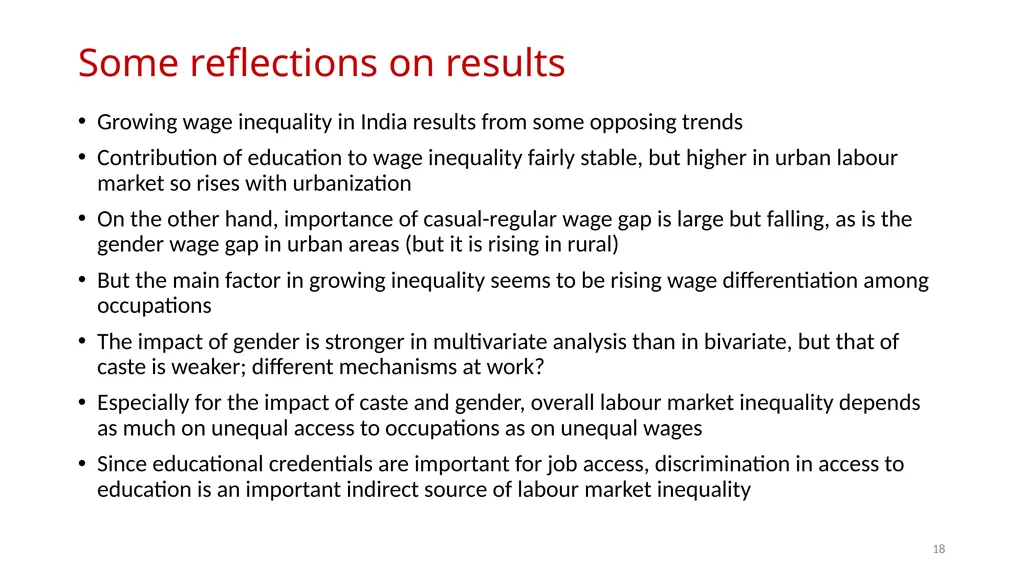
Some reflections on results Growing wage inequality in India results from some opposing trends
Contribution of education to wage inequality fairly stable, but higher in urban labour market so rises with urbanization
On the other hand, importance of casual-regular wage gap is large but falling, as is the gender wage gap in urban areas (but it is rising in rural)
But the main factor in growing inequality seems to be rising wage differentiation among occupations
The impact of gender is stronger in multivariate analysis than in bivariate, but that of caste is weaker; different mechanisms at work?
Especially for the impact of caste and gender, overall labour market inequality depends as much on unequal access to occupations as on unequal wages
Since educational credentials are important for job access, discrimination in access to education is an important indirect source of labour market inequality 18<br>
19
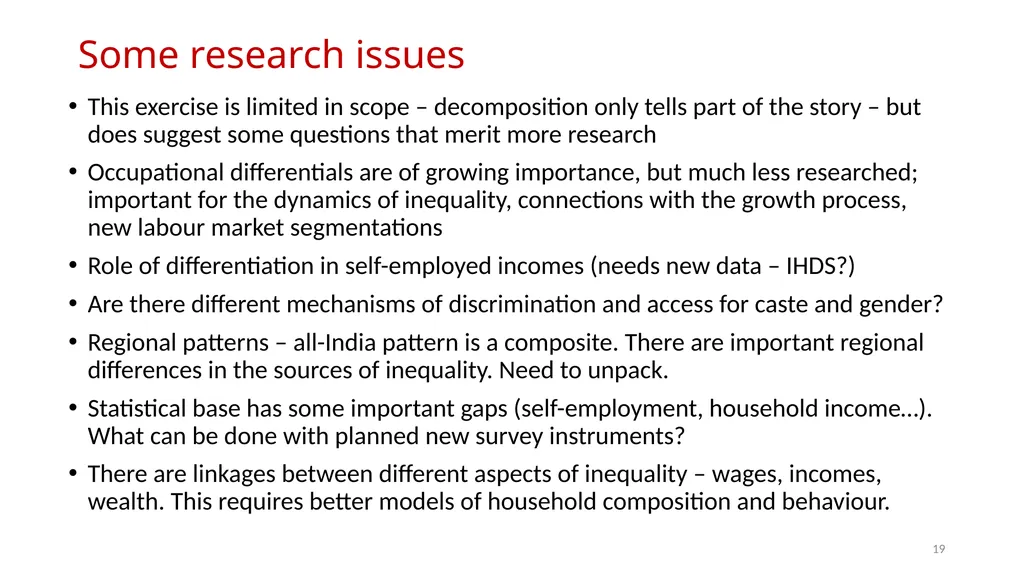
Some research issues This exercise is limited in scope – decomposition only tells part of the story – but does suggest some questions that merit more research
Occupational differentials are of growing importance, but much less researched; important for the dynamics of inequality, connections with the growth process, new labour market segmentations
Role of differentiation in self-employed incomes (needs new data – IHDS?)
Are there different mechanisms of discrimination and access for caste and gender?
Regional patterns – all-India pattern is a composite. There are important regional differences in the sources of inequality. Need to unpack.
Statistical base has some important gaps (self-employment, household income…). What can be done with planned new survey instruments?
There are linkages between different aspects of inequality – wages, incomes, wealth. This requires better models of household composition and behaviour. 19<br>
20
Appendix<br>
21
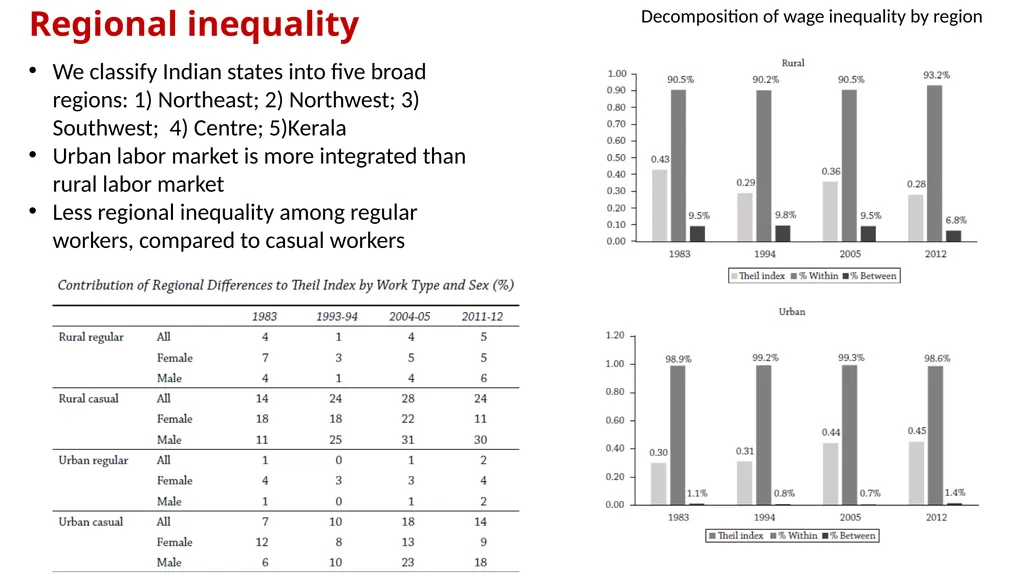
Regional inequality Decomposition of wage inequality by region We classify Indian states into five broad regions: 1) Northeast; 2) Northwest; 3) Southwest; 4) Centre; 5)Kerala
Urban labor market is more integrated than rural labor market
Less regional inequality among regular workers, compared to casual workers<br>
22
Equalization of participation across labour market categories among men and women<br>
23
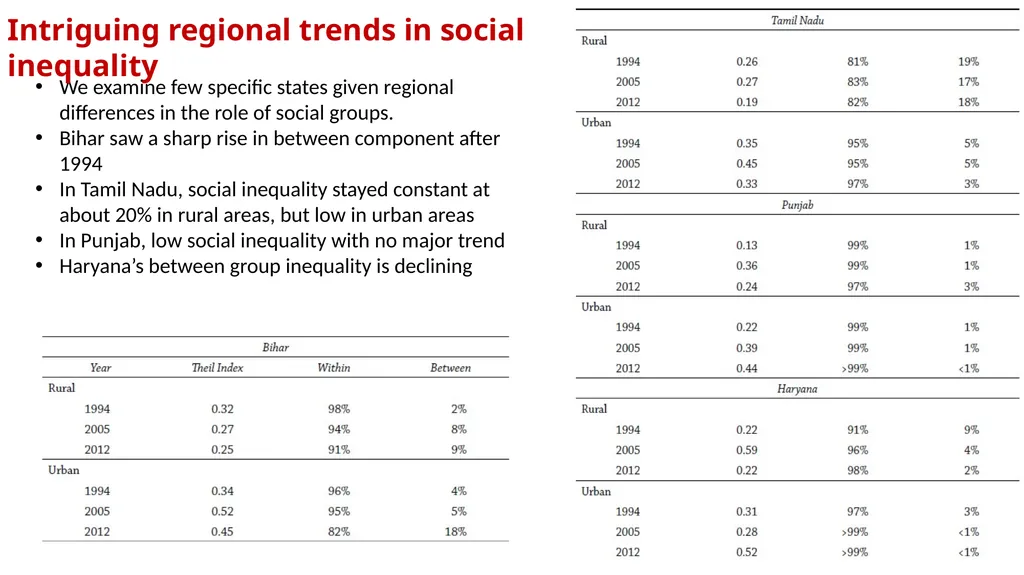
We examine few specific states given regional differences in the role of social groups.
Bihar saw a sharp rise in between component after 1994
In Tamil Nadu, social inequality stayed constant at about 20% in rural areas, but low in urban areas
In Punjab, low social inequality with no major trend
Haryana’s between group inequality is declining Intriguing regional trends in social inequality<br>