Intro Stats for Future Data Scientists Brianna Heggeseth and Dick De Veaux Williams College Motivation USCOTS 2015 What is wrong with Stat 101?....What, How, and When Teaching Future Data Scientists Already learning statistical tools in
"Intro Stats for Future Data Scientists Brianna" is the property of its rightful owner. Permission is granted to
download and print the materials on this website for personal, non-commercial use only, and to display it
on your personal computer provided you do not modify the materials and that you retain all copyright
notices contained in the materials. By downloading content from our website, you accept the terms of this
agreement.
Presentation Transcript
01
Intro Stats for Future Data Scientists Brianna Heggeseth and Dick De Veaux
Williams College<br>
02
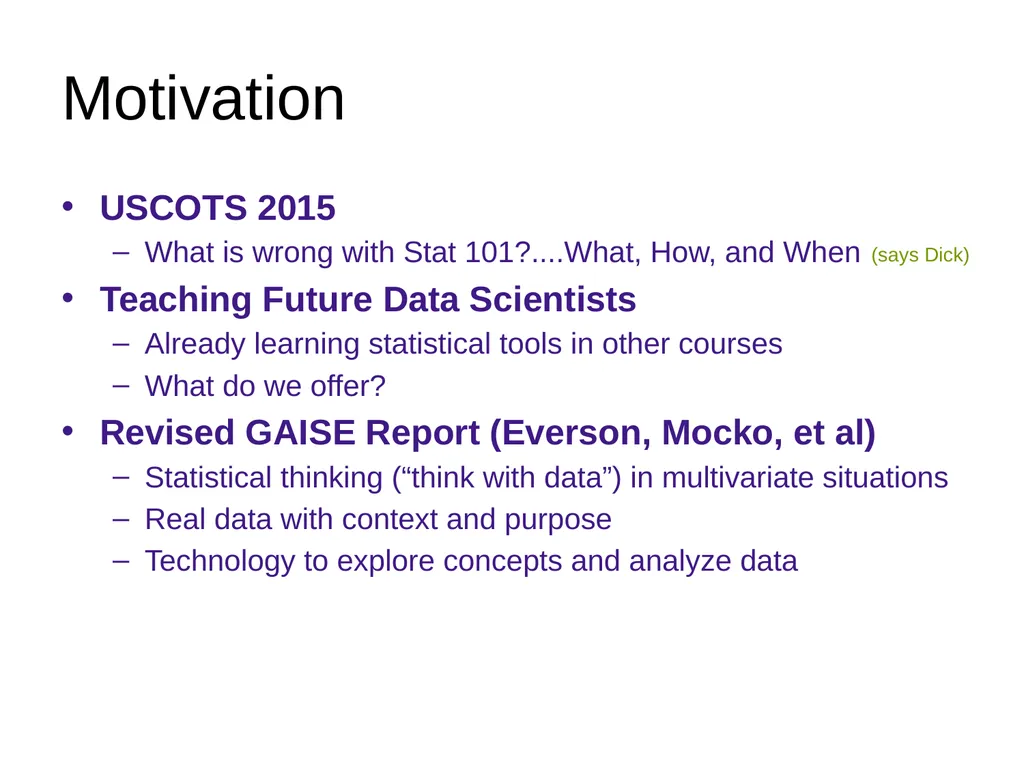
Motivation USCOTS 2015
What is wrong with Stat 101?....What, How, and When
Teaching Future Data Scientists
Already learning statistical tools in other courses
What do we offer?
Revised GAISE Report (Everson, Mocko, et al)
Statistical thinking (“think with data”) in multivariate situations
Real data with context and purpose
Technology to explore concepts and analyze data (says Dick)<br>
03
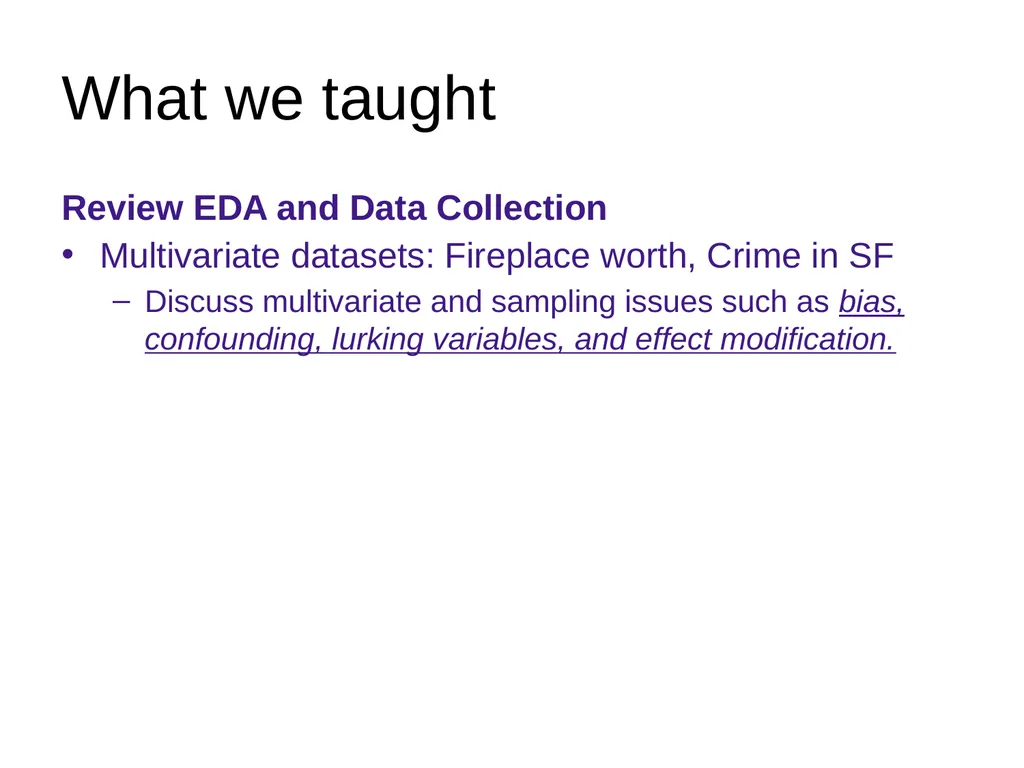
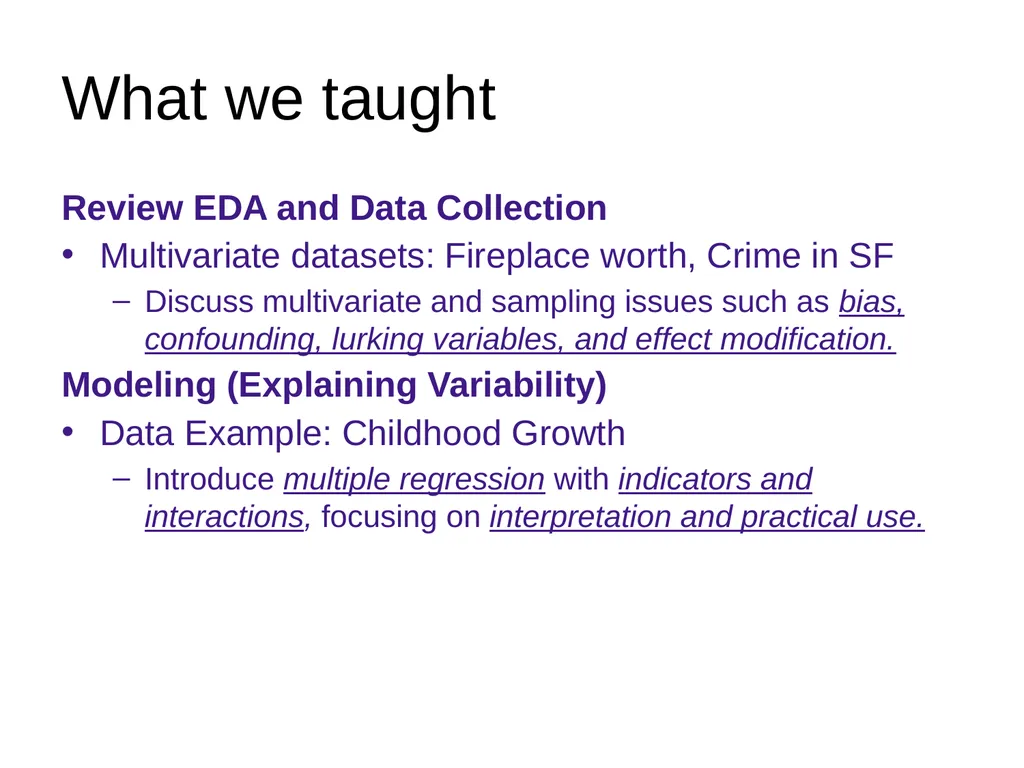
What we taught Review EDA and Data Collection
Multivariate datasets: Fireplace worth, Crime in SF
Discuss multivariate and sampling issues such as bias, confounding, lurking variables, and effect modification.<br>
04
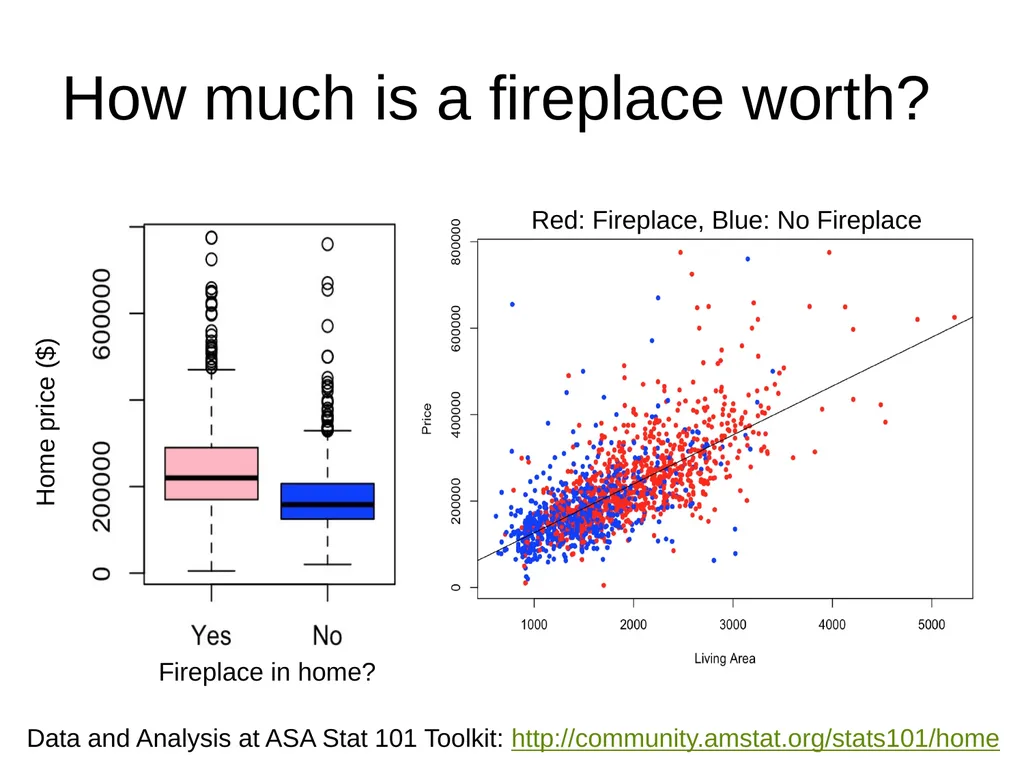
How much is a fireplace worth? Home price ($) Red: Fireplace, Blue: No Fireplace Fireplace in home? Data and Analysis at ASA Stat 101 Toolkit: http://community.amstat.org/stats101/home<br>
05
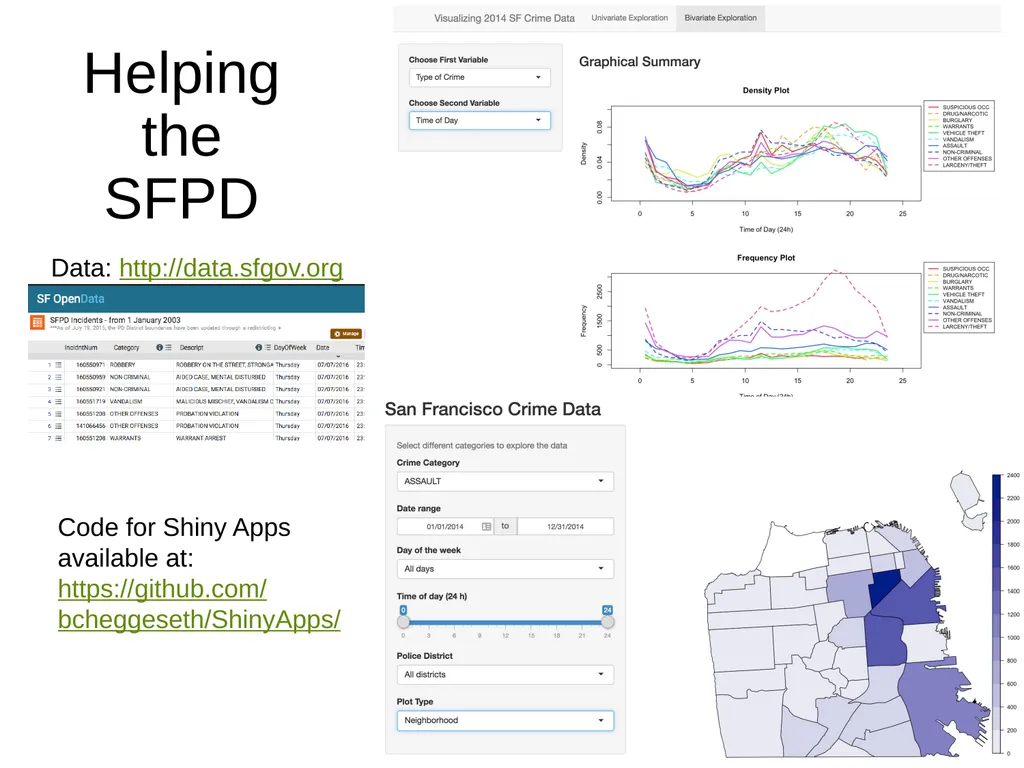
Helping the SFPD Code for Shiny Apps available at:
https://github.com/bcheggeseth/ShinyApps/ Data: http://data.sfgov.org<br>
06
What we taught Review EDA and Data Collection
Multivariate datasets: Fireplace worth, Crime in SF
Discuss multivariate and sampling issues such as bias, confounding, lurking variables, and effect modification.
Modeling (Explaining Variability)
Data Example: Childhood Growth
Introduce multiple regression with indicators and interactions, focusing on interpretation and practical use.<br>
07
Do boys and girls grow the same? Two lines with indicator variables and an interaction term, Male line is Female line is Data: Kids198
from Stat2 textbook<br>
08
What we taught Review EDA and Data Collection
Multivariate datasets: Fireplace worth, Crime in SF
Discuss multivariate and sampling issues such as bias, confounding, lurking variables, and effect modification.
Modeling (Explaining Variability)
Data Example: Childhood Growth
Introduce multiple regression with indicators and interactions, focusing on interpretation and practical use.
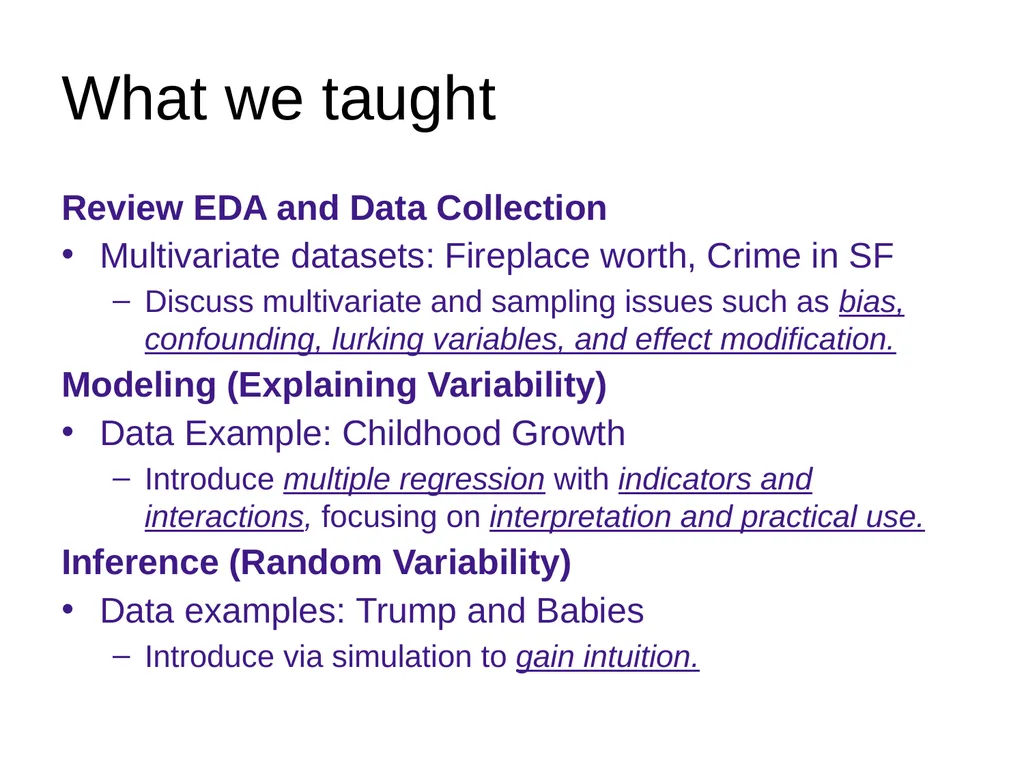
Inference (Random Variability)
Data examples: Trump and Babies
Introduce via simulation to gain intuition.<br>
09
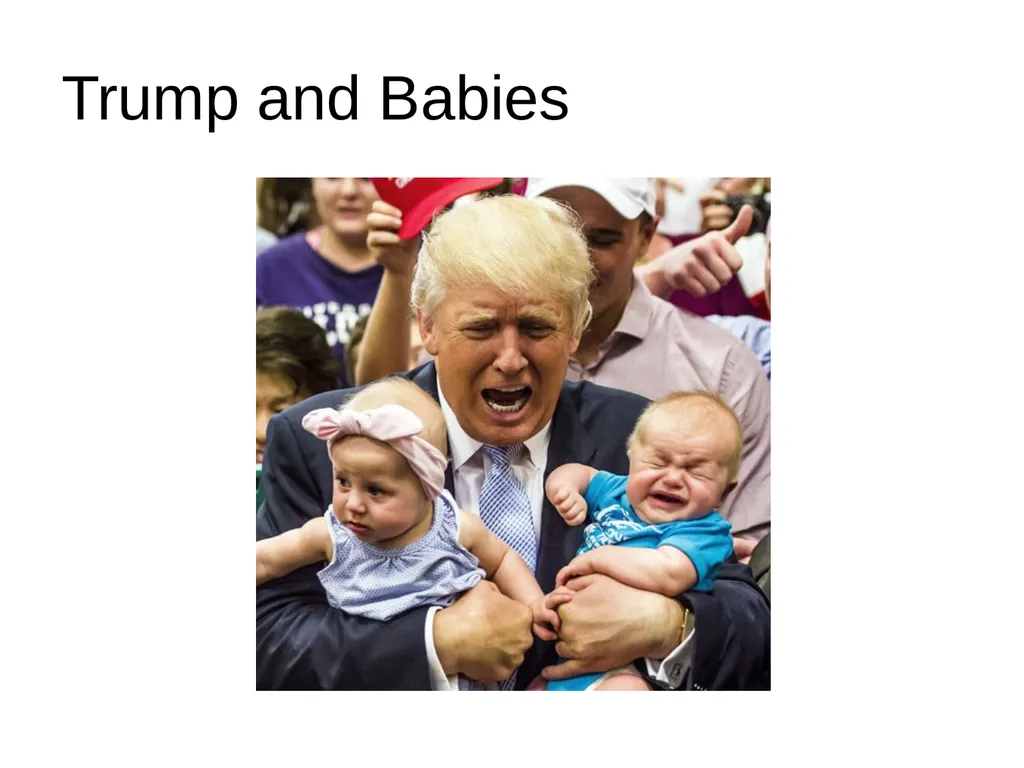
Trump and Babies<br>
10
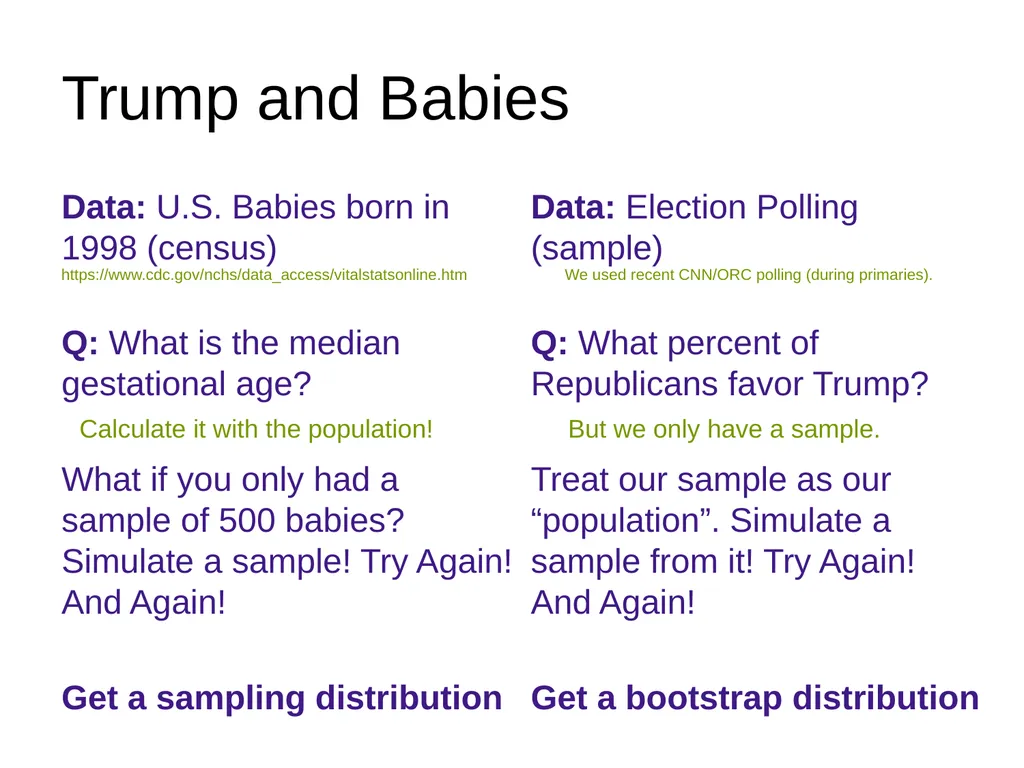
Trump and Babies Data: U.S. Babies born in 1998 (census)
Q: What is the median gestational age?
What if you only had a sample of 500 babies? Simulate a sample! Try Again! And Again!
Get a sampling distribution Data: Election Polling (sample)
Q: What percent of Republicans favor Trump?
Treat our sample as our “population”. Simulate a sample from it! Try Again! And Again!
Get a bootstrap distribution https://www.cdc.gov/nchs/data_access/vitalstatsonline.htm But we only have a sample. Calculate it with the population! We used recent CNN/ORC polling (during primaries).<br>
11
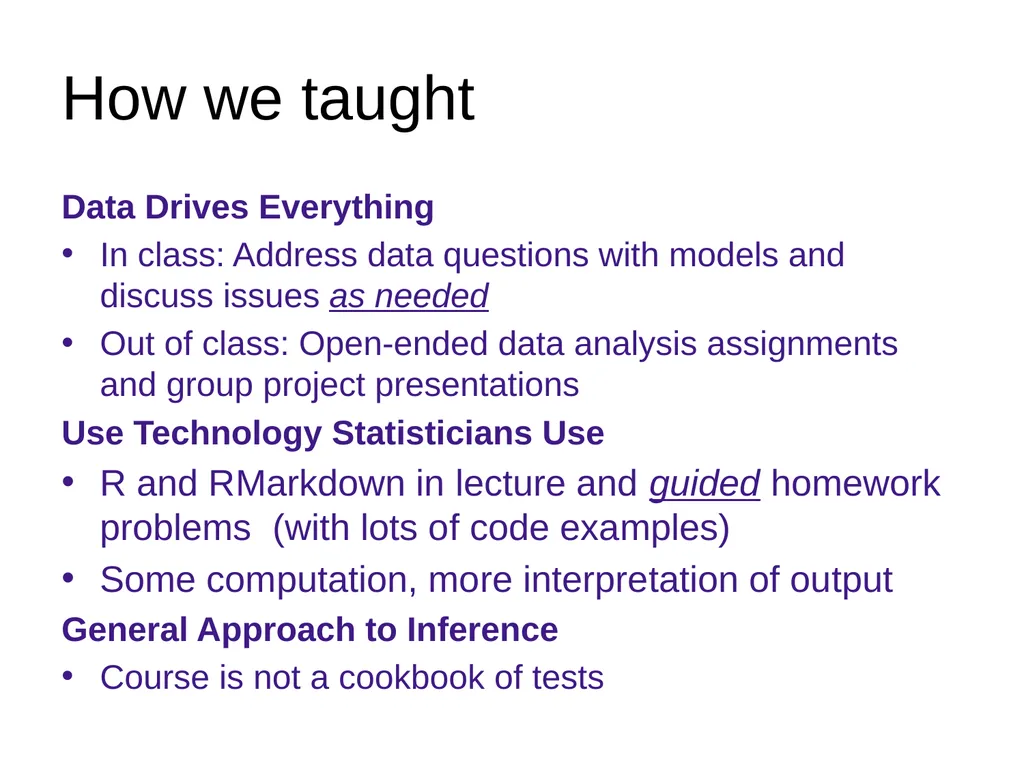
How we taught Data Drives Everything
In class: Address data questions with models and discuss issues as needed
Out of class: Open-ended data analysis assignments and group project presentations
Use Technology Statisticians Use
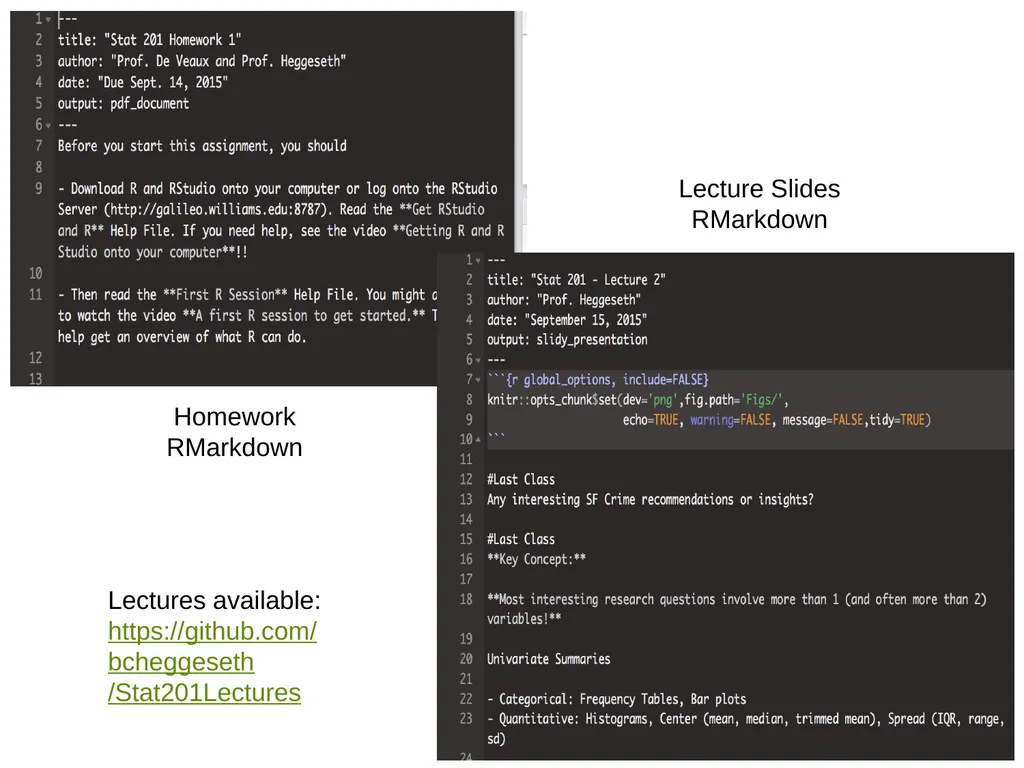
R and RMarkdown in lecture and guided homework problems (with lots of code examples)
Some computation, more interpretation of output
General Approach to Inference
Course is not a cookbook of tests<br>
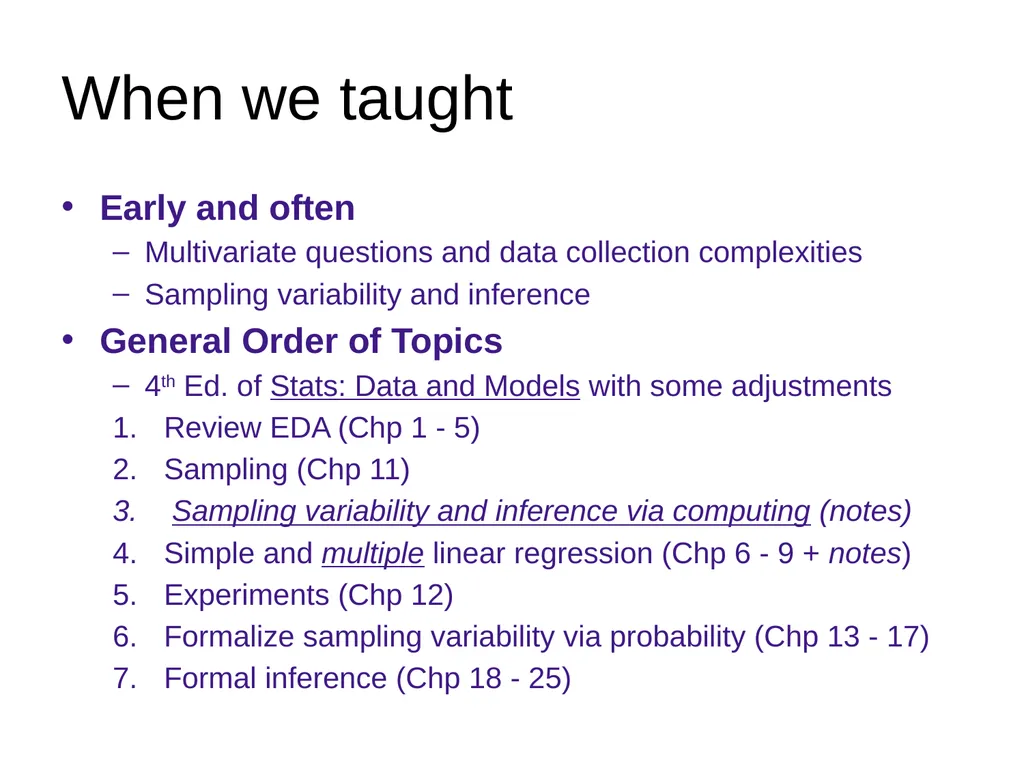
When we taught Early and often
Multivariate questions and data collection complexities
Sampling variability and inference
General Order of Topics
4th Ed. of Stats: Data and Models with some adjustments
Review EDA (Chp 1 - 5)
Sampling (Chp 11)
Sampling variability and inference via computing (notes)
Simple and multiple linear regression (Chp 6 - 9 + notes)
Experiments (Chp 12)
Formalize sampling variability via probability (Chp 13 - 17)
Formal inference (Chp 18 - 25)<br>
14
Thank you! Contact Info
Brianna Heggeseth
Email: bch2@williams.edu