Introduction to Data Analysis in R Presented for the APSA Committee on the Status of Graduate Students Dr. Derek Wakefield Postdoctoral Fellow Political Science, Emory University Installing R and RStudio If you have not already, install R
"Introduction to Data Analysis in R Presented for" is the property of its rightful owner. Permission is granted to
download and print the materials on this website for personal, non-commercial use only, and to display it
on your personal computer provided you do not modify the materials and that you retain all copyright
notices contained in the materials. By downloading content from our website, you accept the terms of this
agreement.
Presentation Transcript
01
Introduction to Data Analysis in R Presented for the APSA Committee on the Status of Graduate Students
Dr. Derek Wakefield
Postdoctoral Fellow
Political Science, Emory University<br>
02
Installing R and RStudio If you have not already, install R and RStudio on your computer
https://posit.co/download/rstudio-desktop/
Choose any mirror, closer ones will be faster
Have this going in the background while I talk!<br>
03
Basic R Concepts There are multiple windows open in the editor—let’s go over each one
Active code
Data objects
Console and terminal
Packages, plot viewer, and ?help<br>
04
Basic R Concepts (continued) Look at top toolbar
Change visual look of editor
Change working directory
Make a new R Notebook file and save it under a new name
Need to begin every “chunk” with ```{r [put title here]} and end with ```
R Notebook is my preferred method of coding because it creates distinct chunks and puts code output beneath each chunk<br>
05
Basic R Concepts (continued) At the start of every coding task, you will do the following:
Identify, install, and load packages
Use bottom-right pane to find packages, or use install.packages()
Library(rmarkdown)
Library(tidyverse)
Set working directory, store and load data
Create new folder, keeps things cleaner (also look into R Projects)
Diagnose and clean issues with data before any analysis<br>
06
Basic Commands in R R can do basic arithmetic with standard computer-math
Addition: 1+1
Subtraction: 2-1
Multiplication: 3*2
Division: 4/2
Exponents: ^
Square root: sqrt(vector)
Mean: mean(vector)
Sum: sum(vector)
R uses PEMDAS in order of operations
What would this be: (4 + 6) / (2 * (4 – 2))^2<br>
07
Basic Commands in R (continued) R uses data objects as the primary form of storing data
Create a new single-object data by using <- (or =)
smol_data <- 7
The object being created or edited is always on the left, and the data that is being stored comes from the right side
Look in the data pane and you will now have a smol_data object there
Type view(smol_data)<br>
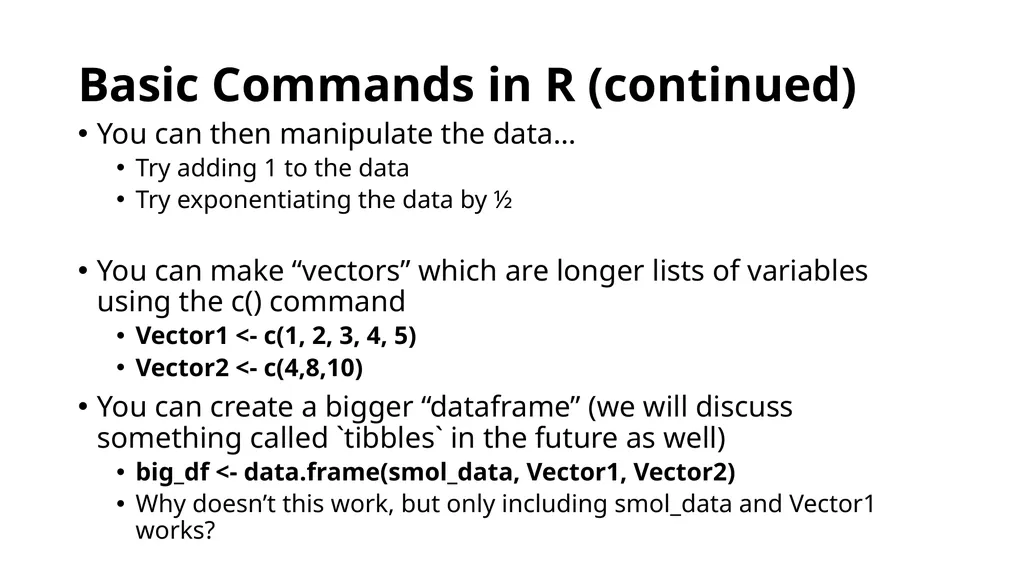
08
Basic Commands in R (continued) You can then manipulate the data…
Try adding 1 to the data
Try exponentiating the data by ½
You can make “vectors” which are longer lists of variables using the c() command
Vector1 <- c(1, 2, 3, 4, 5)
Vector2 <- c(4,8,10)
You can create a bigger “dataframe” (we will discuss something called `tibbles` in the future as well)
big_df <- data.frame(smol_data, Vector1, Vector2)
Why doesn’t this work, but only including smol_data and Vector1 works?<br>
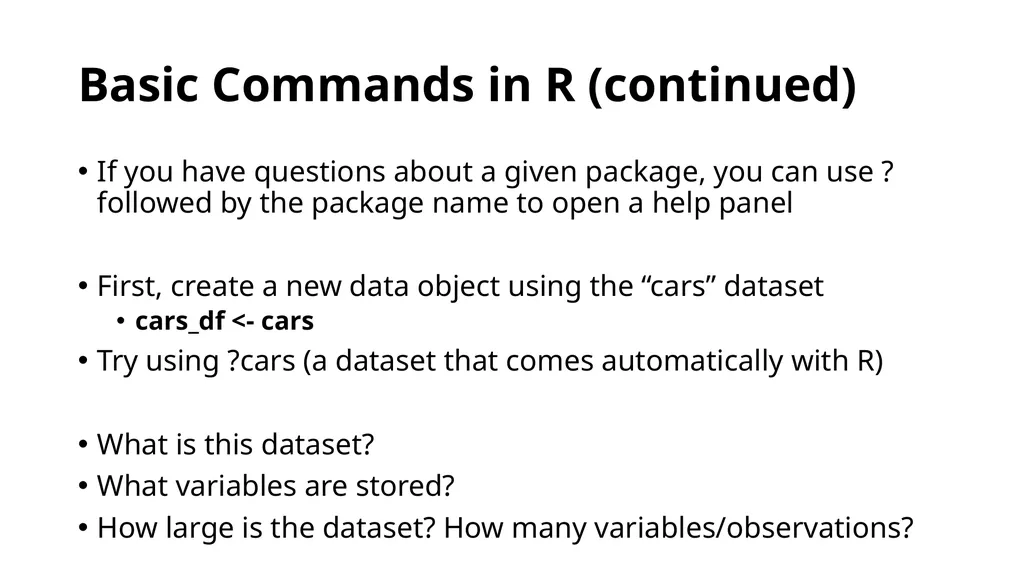
09
Basic Commands in R (continued) If you have questions about a given package, you can use ? followed by the package name to open a help panel
First, create a new data object using the “cars” dataset
cars_df <- cars
Try using ?cars (a dataset that comes automatically with R)
What is this dataset?
What variables are stored?
How large is the dataset? How many variables/observations?<br>
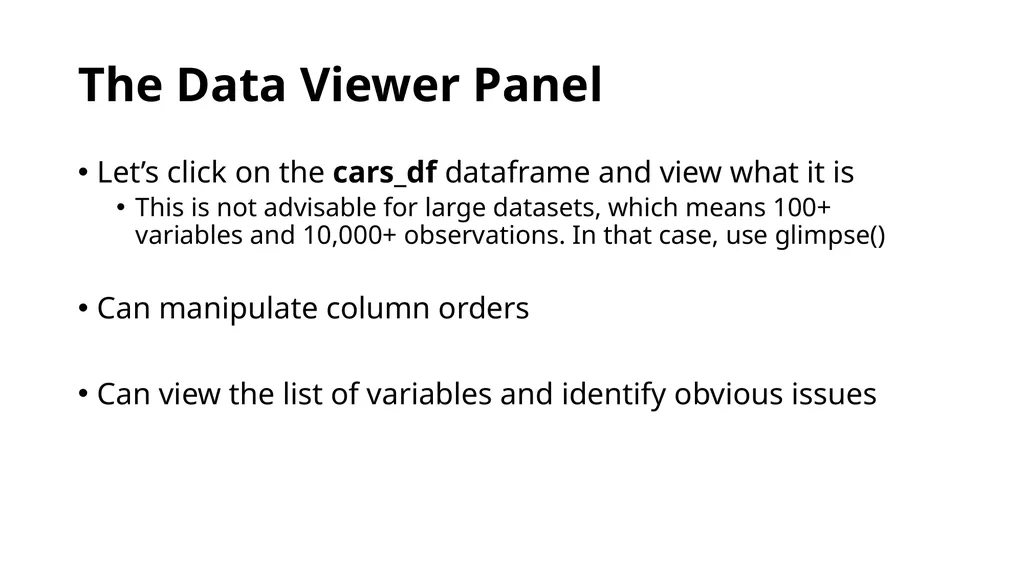
10
The Data Viewer Panel Let’s click on the cars_df dataframe and view what it is
This is not advisable for large datasets, which means 100+ variables and 10,000+ observations. In that case, use glimpse()
Can manipulate column orders
Can view the list of variables and identify obvious issues<br>
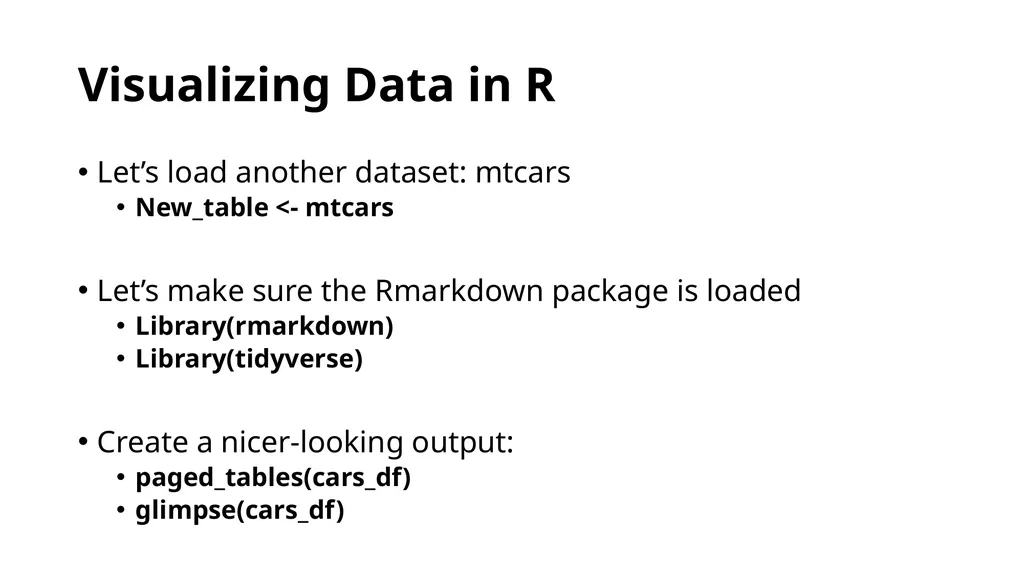
11
Visualizing Data in R Let’s load another dataset: mtcars
New_table <- mtcars
Let’s make sure the Rmarkdown package is loaded
Library(rmarkdown)
Library(tidyverse)
Create a nicer-looking output:
paged_tables(cars_df)
glimpse(cars_df)<br>
12
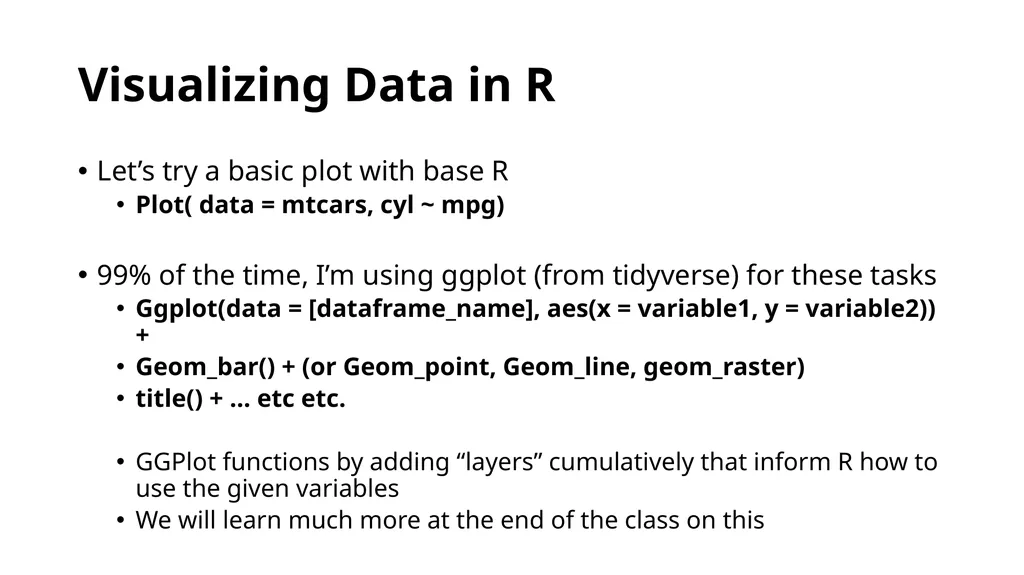
Visualizing Data in R Let’s try a basic plot with base R
Plot( data = mtcars, cyl ~ mpg)
99% of the time, I’m using ggplot (from tidyverse) for these tasks
Ggplot(data = [dataframe_name], aes(x = variable1, y = variable2)) +
Geom_bar() + (or Geom_point, Geom_line, geom_raster)
title() + … etc etc.
GGPlot functions by adding “layers” cumulatively that inform R how to use the given variables
We will learn much more at the end of the class on this<br>
13
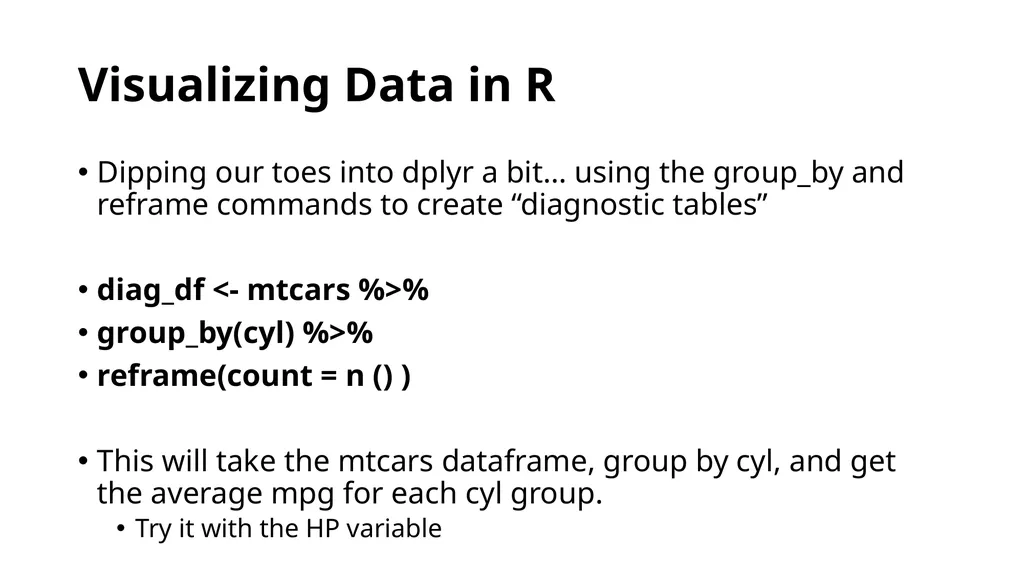
Visualizing Data in R Dipping our toes into dplyr a bit… using the group_by and reframe commands to create “diagnostic tables”
This will take the mtcars dataframe, group by cyl, and get the average mpg for each cyl group.
Try it with the HP variable<br>
14
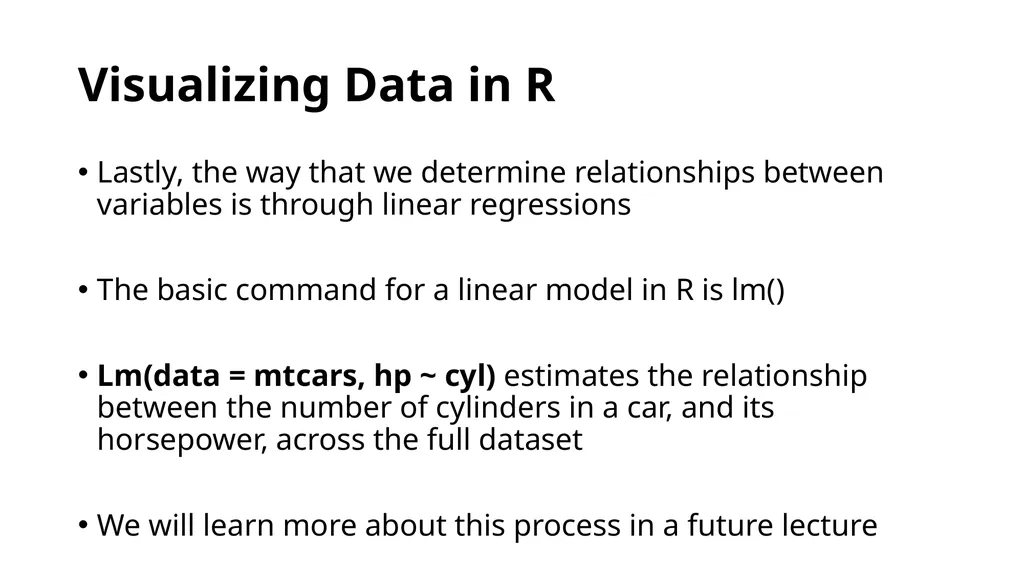
Visualizing Data in R Lastly, the way that we determine relationships between variables is through linear regressions
The basic command for a linear model in R is lm()
Lm(data = mtcars, hp ~ cyl) estimates the relationship between the number of cylinders in a car, and its horsepower, across the full dataset
We will learn more about this process in a future lecture<br>
15
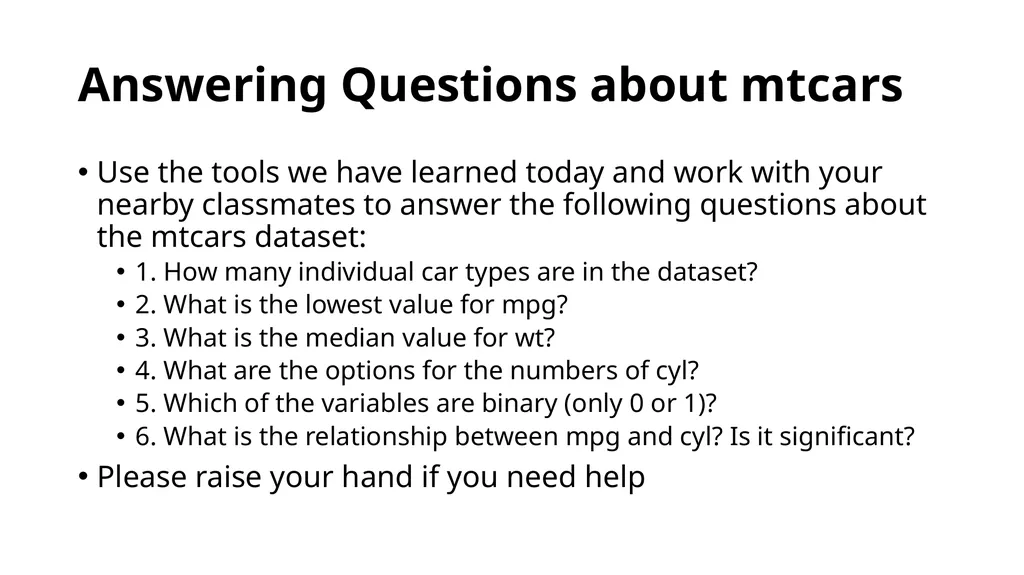
Answering Questions about mtcars Use the tools we have learned today and work with your nearby classmates to answer the following questions about the mtcars dataset:
1. How many individual car types are in the dataset?
2. What is the lowest value for mpg?
3. What is the median value for wt?
4. What are the options for the numbers of cyl?
5. Which of the variables are binary (only 0 or 1)?
6. What is the relationship between mpg and cyl? Is it significant?
Please raise your hand if you need help<br>
16
Some last RMarkdown thoughts RMarkdown can be used as a way to present your final results, although I tend to use R Notebooks and LaTeX
These documents have to “knit” which means the entire document needs to run, which can sometimes be more difficult than having individual chunks that create usable outputs
You can learn more in the RMarkdown documentation (?RMarkdown)<br>
17
Your (Easy) Homework Look at the “dataset of datasets” and begin thinking about which of the final project options you want to take
Under Course Modules, see “Important Links” document
Anybody looking to do a solo-author original project (grad student 3rd year paper, undergraduate honors thesis)
Anybody looking to do a co-authored original project?