
Introduction to Graphs Chapter 15 The chapter

Description: Introduction to Graphs Chapter 15 The chapter focuses on topics like 1.A Bar graph 2.A Pie graph 3.A histogram 4. A line graph 5.Linear graph 6.Locate a point A bar graph is used to show a comparison among categories. It may contain
Related Topics
Download Presentation
"Introduction to Graphs Chapter 15 The chapter" is the property of its rightful owner. Permission is granted to download and print the materials on this website for personal, non-commercial use only, and to display it on your personal computer provided you do not modify the materials and that you retain all copyright notices contained in the materials. By downloading content from our website, you accept the terms of this agreement.
Presentation Transcript
slide1. Introduction to Graphs Chapter 15<br>
slide2. The chapter focuses on topics like
1.A Bar graph
2.A Pie graph
3.A histogram
4. A line graph
5.Linear graph
6.Locate a point<br>
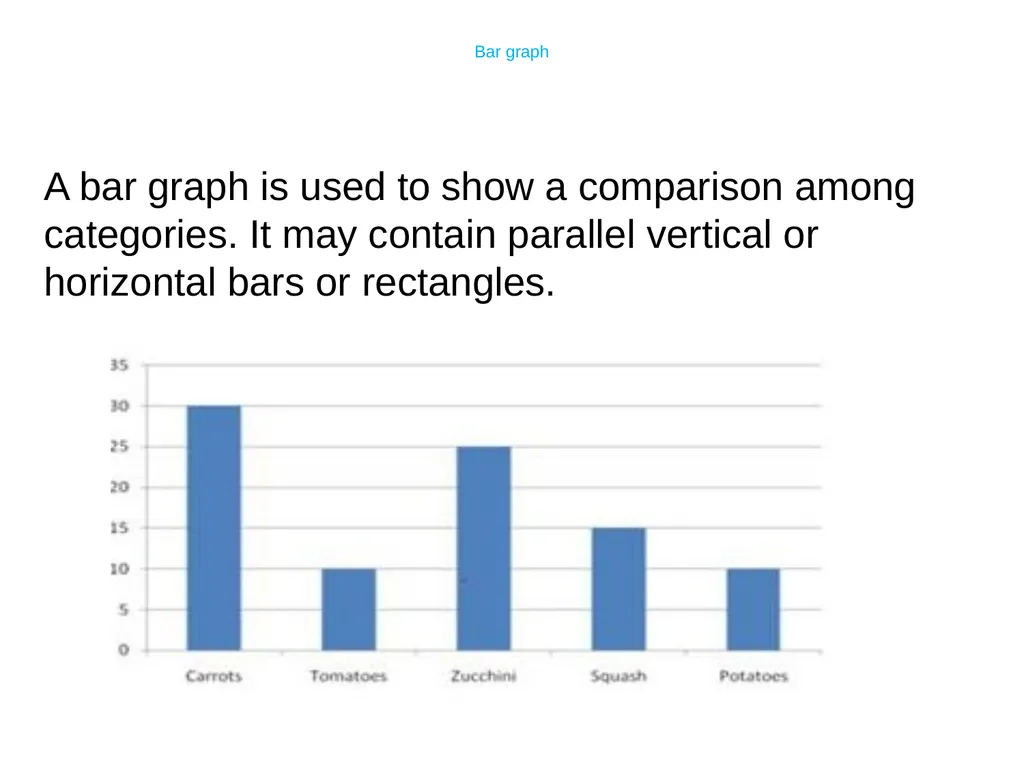
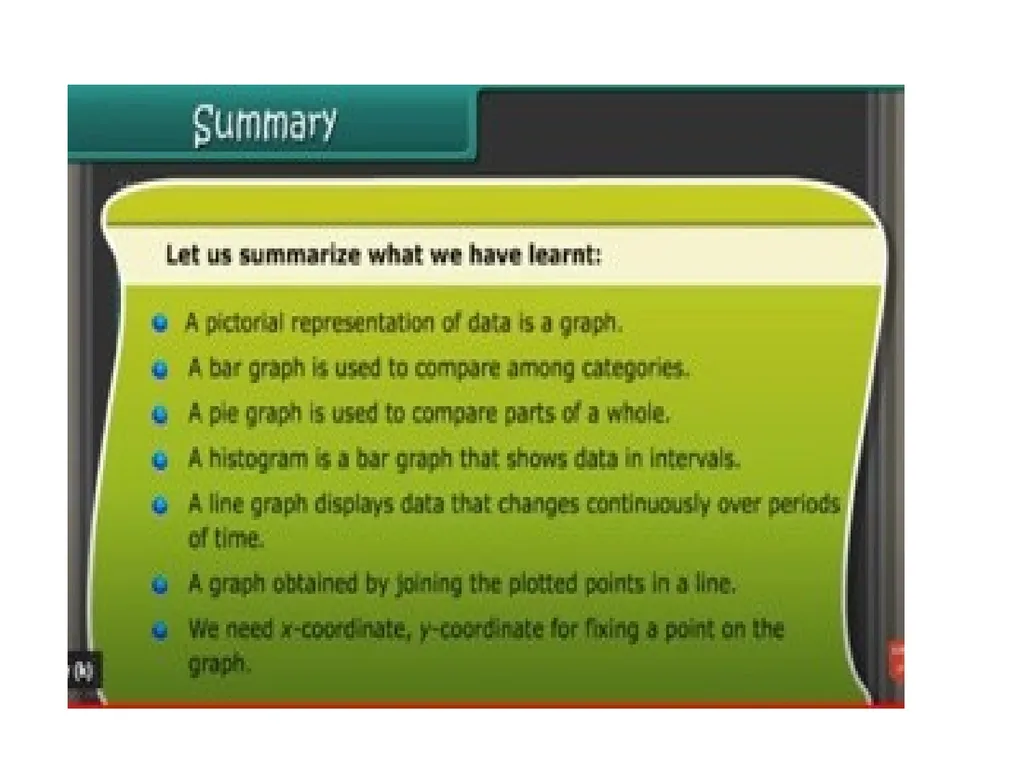
slide4. A bar graph is used to show a comparison among categories. It may contain parallel vertical or horizontal bars or rectangles. Bar graph<br>
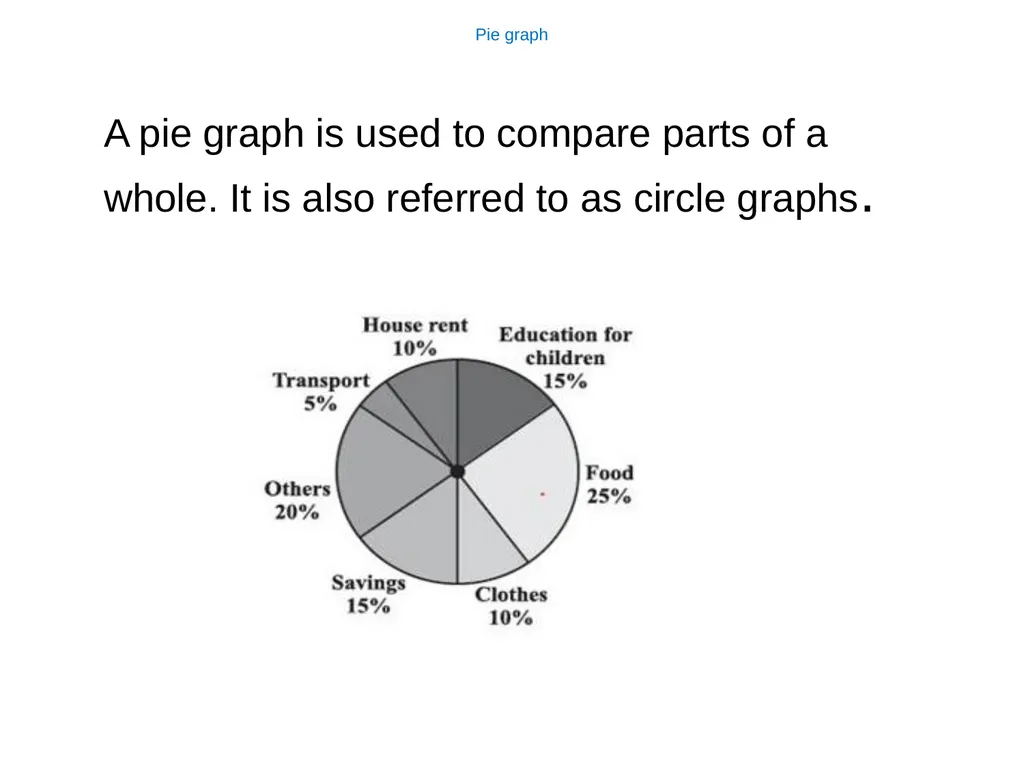
slide5. A pie graph is used to compare parts of a whole. It is also referred to as circle graphs. Pie graph<br>
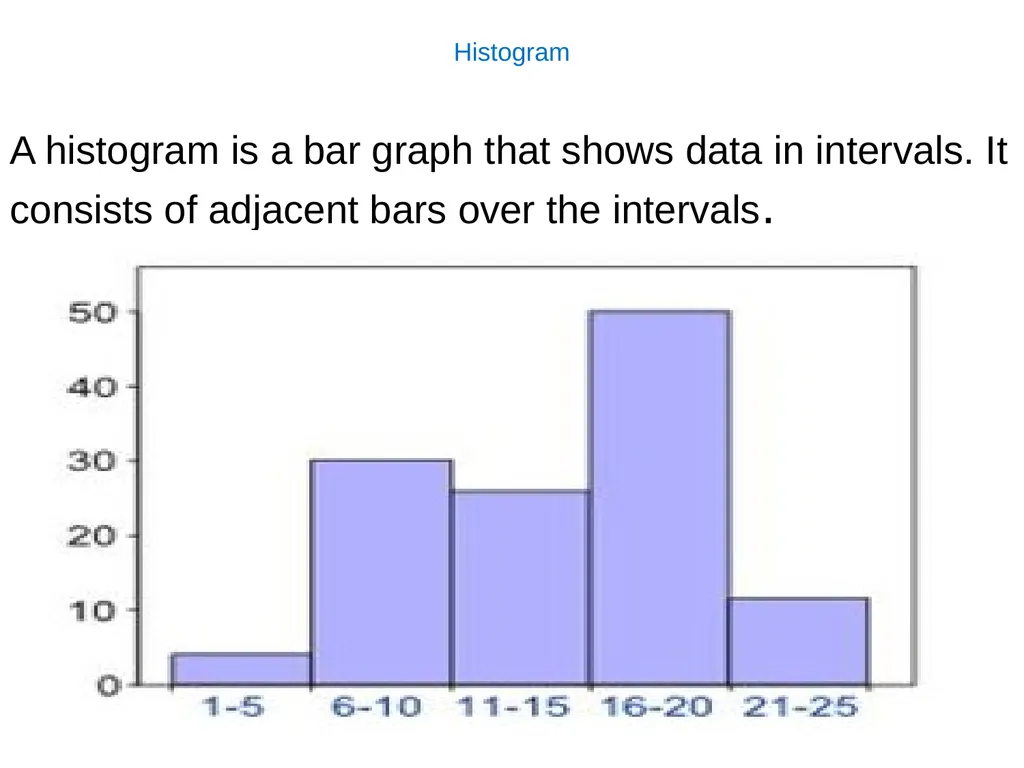
slide6. A histogram is a bar graph that shows data in intervals. It consists of adjacent bars over the intervals. Histogram<br>
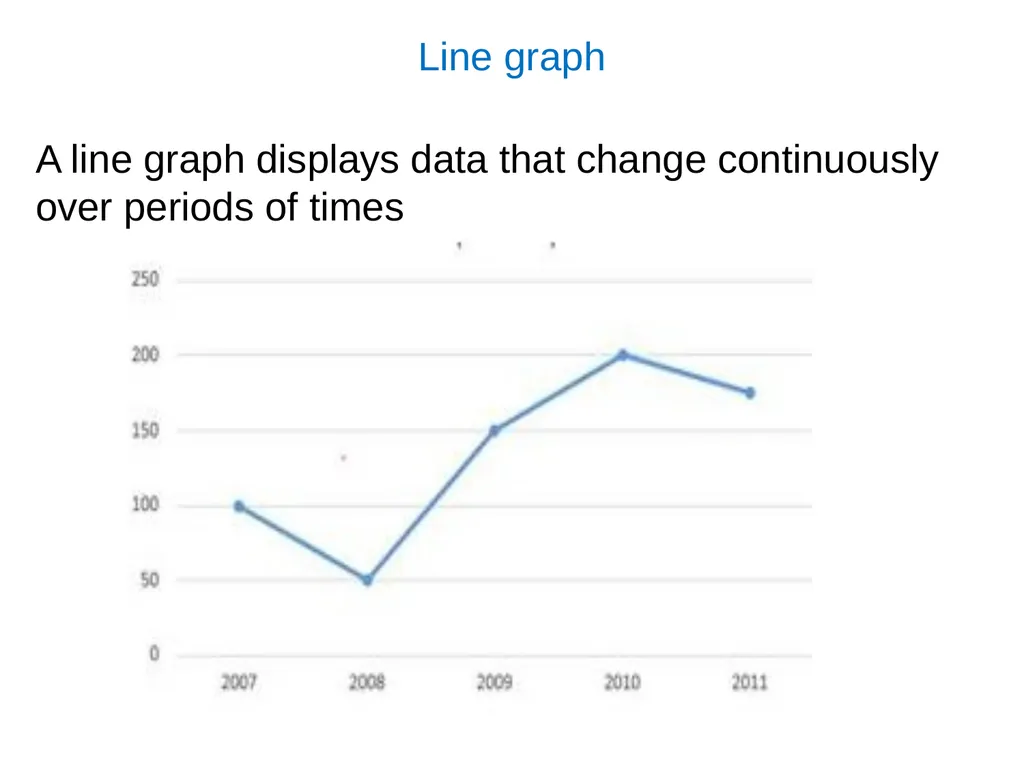
slide7. A line graph displays data that change continuously over periods of times Line graph<br>
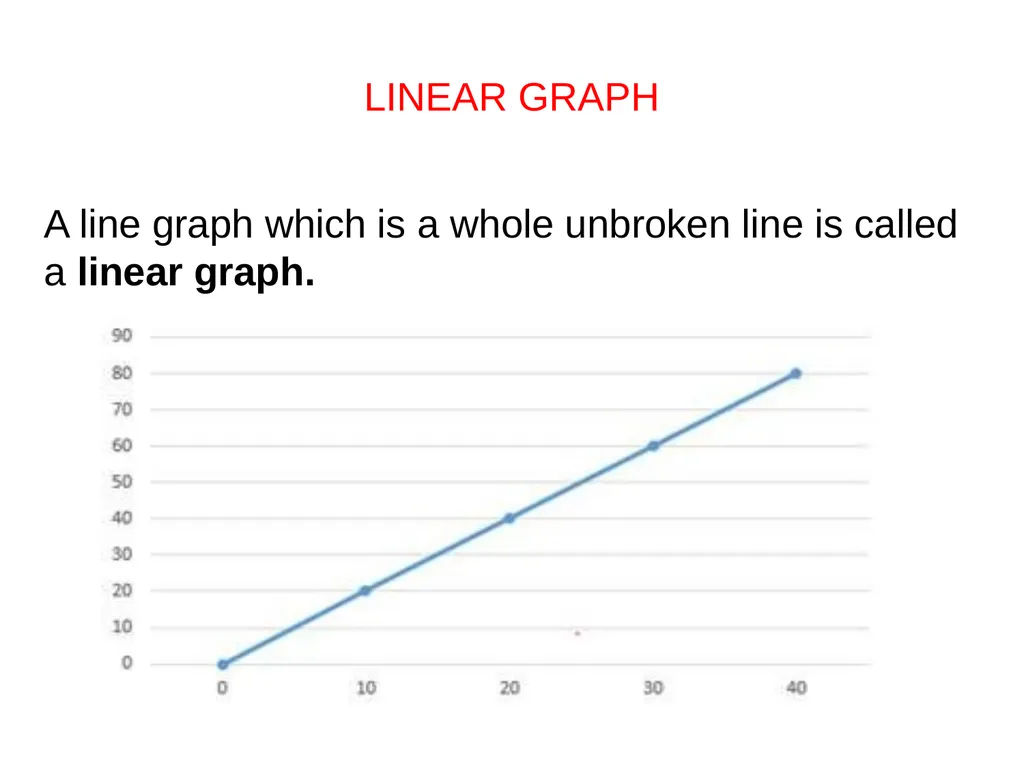
slide8. A line graph which is a whole unbroken line is called a linear graph. LINEAR GRAPH<br>
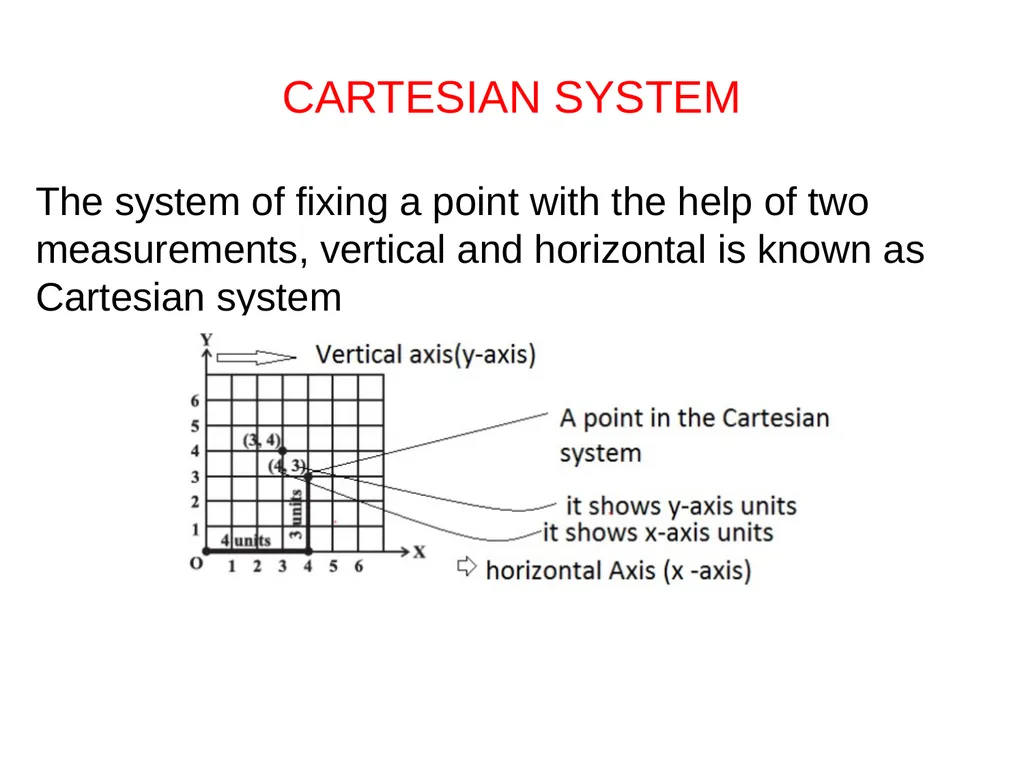
slide12. The system of fixing a point with the help of two measurements, vertical and horizontal is known as Cartesian system CARTESIAN SYSTEM<br>
slide13. Important points
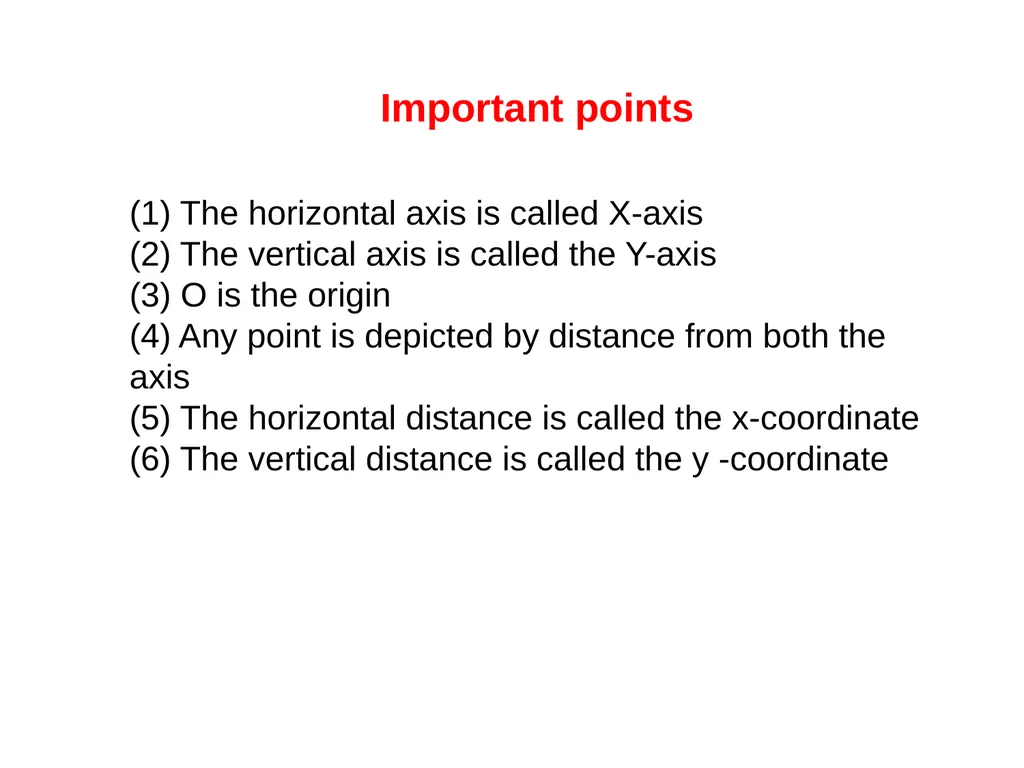
(1) The horizontal axis is called X-axis (2) The vertical axis is called the Y-axis (3) O is the origin (4) Any point is depicted by distance from both the axis (5) The horizontal distance is called the x-coordinate (6) The vertical distance is called the y -coordinate<br>
slide2. The chapter focuses on topics like
1.A Bar graph
2.A Pie graph
3.A histogram
4. A line graph
5.Linear graph
6.Locate a point<br>
slide4. A bar graph is used to show a comparison among categories. It may contain parallel vertical or horizontal bars or rectangles. Bar graph<br>
slide5. A pie graph is used to compare parts of a whole. It is also referred to as circle graphs. Pie graph<br>
slide6. A histogram is a bar graph that shows data in intervals. It consists of adjacent bars over the intervals. Histogram<br>
slide7. A line graph displays data that change continuously over periods of times Line graph<br>
slide8. A line graph which is a whole unbroken line is called a linear graph. LINEAR GRAPH<br>
slide12. The system of fixing a point with the help of two measurements, vertical and horizontal is known as Cartesian system CARTESIAN SYSTEM<br>
slide13. Important points
(1) The horizontal axis is called X-axis (2) The vertical axis is called the Y-axis (3) O is the origin (4) Any point is depicted by distance from both the axis (5) The horizontal distance is called the x-coordinate (6) The vertical distance is called the y -coordinate<br>