
INTRODUCTION TO Statistical SoftwareS What is


Description: INTRODUCTION TO Statistical SoftwareS What is Statistical Software? Statistical software are specialized programs designed to perform complex statistical analysis. They are the tools that assist in the organization, interpretation, and
Related Topics
Download Presentation
"INTRODUCTION TO Statistical SoftwareS What is" is the property of its rightful owner. Permission is granted to download and print the materials on this website for personal, non-commercial use only, and to display it on your personal computer provided you do not modify the materials and that you retain all copyright notices contained in the materials. By downloading content from our website, you accept the terms of this agreement.
Presentation Transcript
slide1. INTRODUCTION TO Statistical SoftwareS What is Statistical Software?
Statistical software are specialized programs designed to perform complex statistical analysis.
They are the tools that assist in the organization, interpretation, and presentation of selected data sets to provide science-based insights into patterns and trends.
Statistical software use statistical analysis theorems and methodologies such as regression analysis, time series analysis to perform data sciences.<br>
slide2. Benefits of Statistical Software Increases efficiency of the work.
More accuracy in data analysis an management.
Less time consuming.
Easy customization.
Grants access to large database.
Reduces sampling error.
Empowers to make data driven decisions.<br>
slide3. Application of Software in Public Health 1. In public health programs: Software are used for:
Communication.
Administrative works.
Recording and reporting.
Maintaining quality of programs.
Increasing the effectiveness and efficiency of programs.<br>
slide4. 2. In public health research Data collection.
Analysis.
Report writing.
Communication.<br>
slide5. 3. In hospitals and health care centers 4. Operation of information systems
(E.g.: Health Management Information System, Logistic Management Information System, GIS etc.)
5. In health economics and health care centers
6. Libraries, academics and many more<br>
slide6. Various Types of Statistical Software Used in Social Sciences 1. SPSS (Statistical Package for Social Sciences)
SPSS is the most widely used powerful software for complex statistical data analysis.
It easily compiles descriptive statistics, parametric and non- parametric analysis as well as delivers graphs and presentation ready reports to easily communicate the results.
More accurate reports are achieved here through estimation and uncovering of missing values in the data sets.
SPSS is used for quantitative data analysis.<br>
slide7. It is a program designed to undertake various statistical operations.
SPSS is a sodtware program that runs on windows operating system, it can be used to perform processes like data entry & analysis, create tables and construct graphs.
SPSS is capable of handling large amounts of data & is commonly used in health care, pharmaceuticals and social sciences.
SPSS can perform statistical analysis like descriptive studies, calculating mean values, prevalence, regression analysis, analysis of variance, etc.<br>
slide8. Advantages of SPSS
Very robust statistical software.
Complex statistical evaluations can be done.
Easy and quick display of data tables.
Limitations of SPSS
Expensive.
Complex operating procedure.
Requires trained personnel.<br>
slide9. Applications of SPSS in pharmacy
Research & Development
SPSS is used in design, development & implementation of analytical data along with the existing data in various statistical procedures.
Quality control & Manufacturing
SPSS helps in designing, quality control and manufacturing statistics and helps in standardizing various steps and procedures.<br>
slide10. Regulatory & Safety testing
SPSS tools provide an efficient mechanism for automating and validating routine analysis report like determining power of a study and sample size calculation.
Clinical trails
SPSS is the most powerful tool and plays an important role in phase-1 and phase-2 clinical studies on small sample sizes.<br>
slide11. Epi Info
These are a series of freely available tools that run on windows operating system.
Epi Info is used by public health professionals to conduct disease outbreak investigations, manage data bases for public health care services.
Epi Info helps the physicians, epidemiologists and public health officers to develop a questionnaire or form, customize data entry process, enter and analyze data.<br>
slide12. Advantages of Epi Info
It is freely available.
Simple operating procedure.
Can perform descriptive statistics and intermediate analysis like comparison of means, regression analysis, etc.
Can be used for data entry and storage.
Disadvantages of Epi Info
Runs on windows only.
Limited options available for analysis.
Can be used only for basic statistics.<br>
slide13. SAS (Statistical Analysis System)
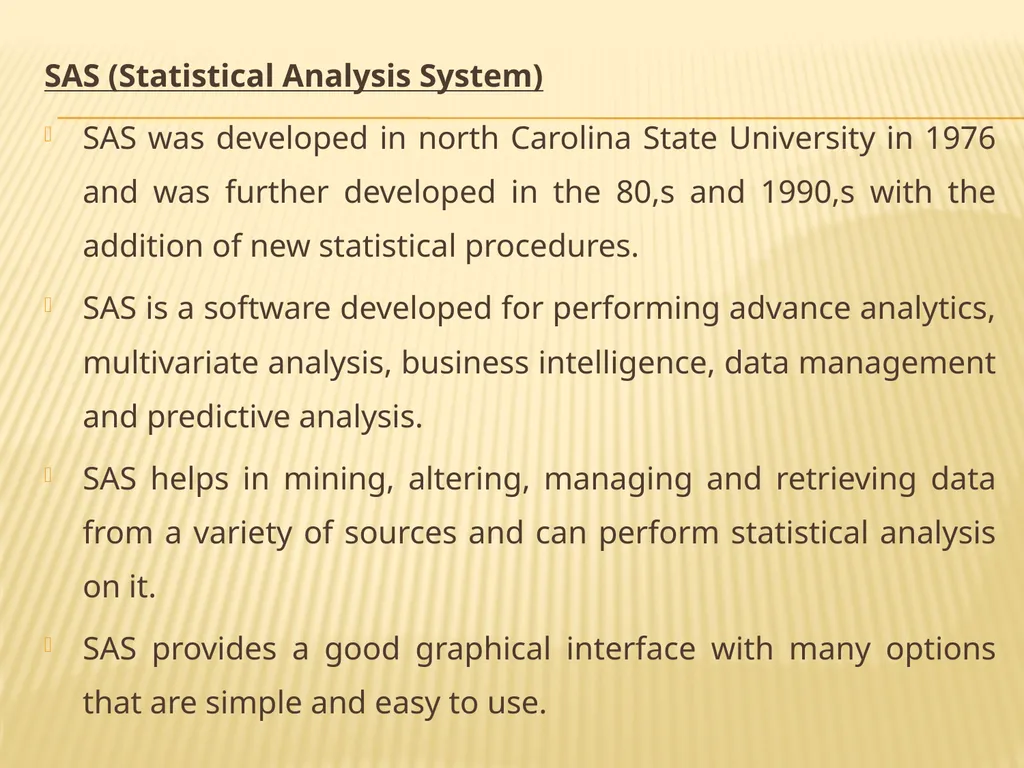
SAS was developed in north Carolina State University in 1976 and was further developed in the 80,s and 1990,s with the addition of new statistical procedures.
SAS is a software developed for performing advance analytics, multivariate analysis, business intelligence, data management and predictive analysis.
SAS helps in mining, altering, managing and retrieving data from a variety of sources and can perform statistical analysis on it.
SAS provides a good graphical interface with many options that are simple and easy to use.<br>
slide14. Advantages of SAS
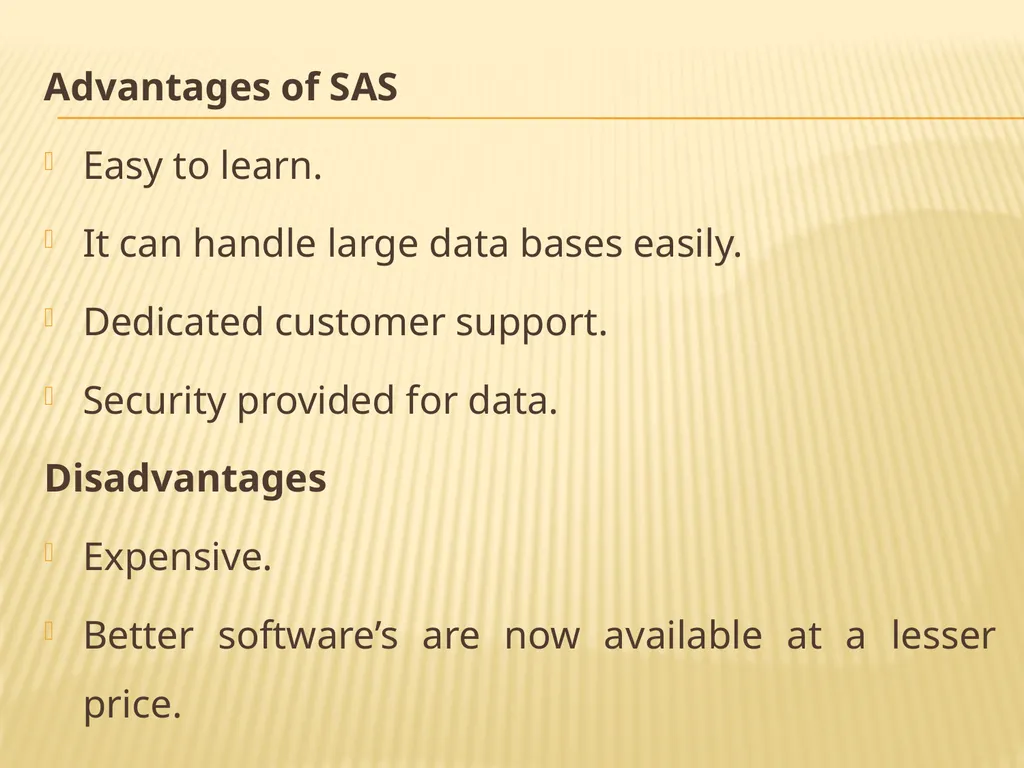
Easy to learn.
It can handle large data bases easily.
Dedicated customer support.
Security provided for data.
Disadvantages
Expensive.
Better software’s are now available at a lesser price.<br>
slide15. Applications of SAS
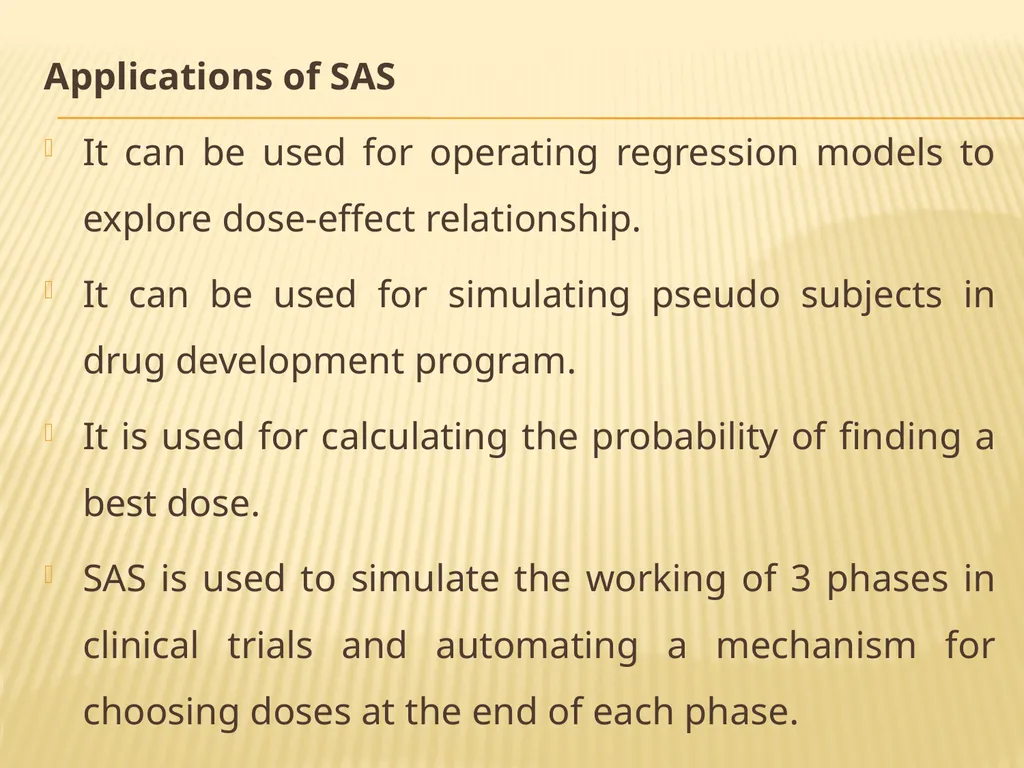
It can be used for operating regression models to explore dose-effect relationship.
It can be used for simulating pseudo subjects in drug development program.
It is used for calculating the probability of finding a best dose.
SAS is used to simulate the working of 3 phases in clinical trials and automating a mechanism for choosing doses at the end of each phase.<br>
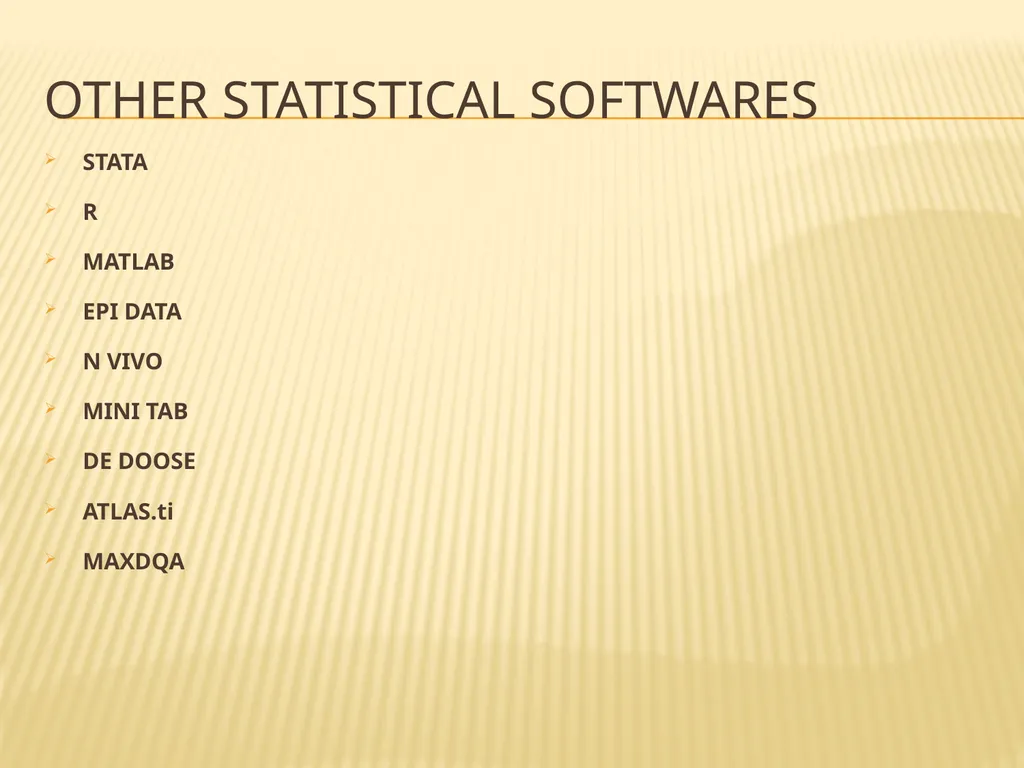
slide16. Other statistical softwares STATA
R
MATLAB
EPI DATA
N VIVO
MINI TAB
DE DOOSE
ATLAS.ti
MAXDQA<br>
slide17. 3. R R’ software is widely used free statistical software that provides statistical and graphical techniques including linear and non-linear modeling.
Toolboxes essentially plugins are available for great range of applications. Knowledge of coding is required here.
It provides interactive reports and applications, leverage large amount of data and is complaint with security practices and standards.
R is used for quantitative data analysis.<br>
slide18. 4. SAS (Statistical Analysis Software) It is a cloud based platform that provides ready to use programs for data manipulation, information storage and retrieval.
Its procedures are multithreadede. performing multiple operations at once.
It is primarily used for statistical modeling, observing trends and patterns in data and aiding in decision-making by business analysts, statisticians, data scientists, researchers and engineers.
Coding can be difficult to those new to this approach.
It is used for quantitative data analysis.<br>
slide19. 5. MATLAB (MATrix LABoratory) MATLAB stands for MATrix LABoratory.
MATLAB is software that provides an analytical platform and programming language
It expresses matrix and array mathematics, plotting of functions and data, implementation of algorithms, creation of user interfaces.
Live Editor is also included which creates a script that combines code, output, and formatted text in a executable notebook.
It is widely used by engineer and scientist.
MATLAB is used for quantitative data analysis.<br>
slide20. 6. Epi-data Epi-data is free widely used data software designed to assist epidemiologist, public health investigators and others to enter, manage and analyze data in the field.
It performs basic statistical analysis, graphs and comprehensive data management.
Here user gets to create own forms and database.
Epi-data is used for quantitative data analysis.<br>
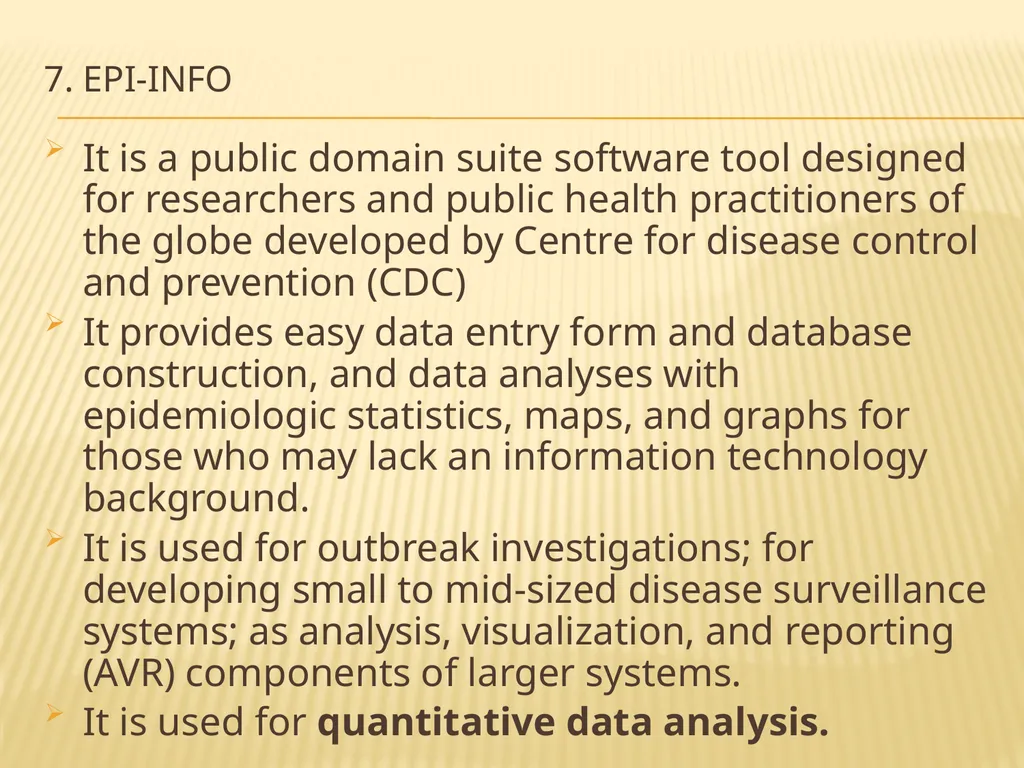
slide21. 7. Epi-info It is a public domain suite software tool designed for researchers and public health practitioners of the globe developed by Centre for disease control and prevention (CDC)
It provides easy data entry form and database construction, and data analyses with epidemiologic statistics, maps, and graphs for those who may lack an information technology background.
It is used for outbreak investigations; for developing small to mid-sized disease surveillance systems; as analysis, visualization, and reporting (AVR) components of larger systems.
It is used for quantitative data analysis.<br>
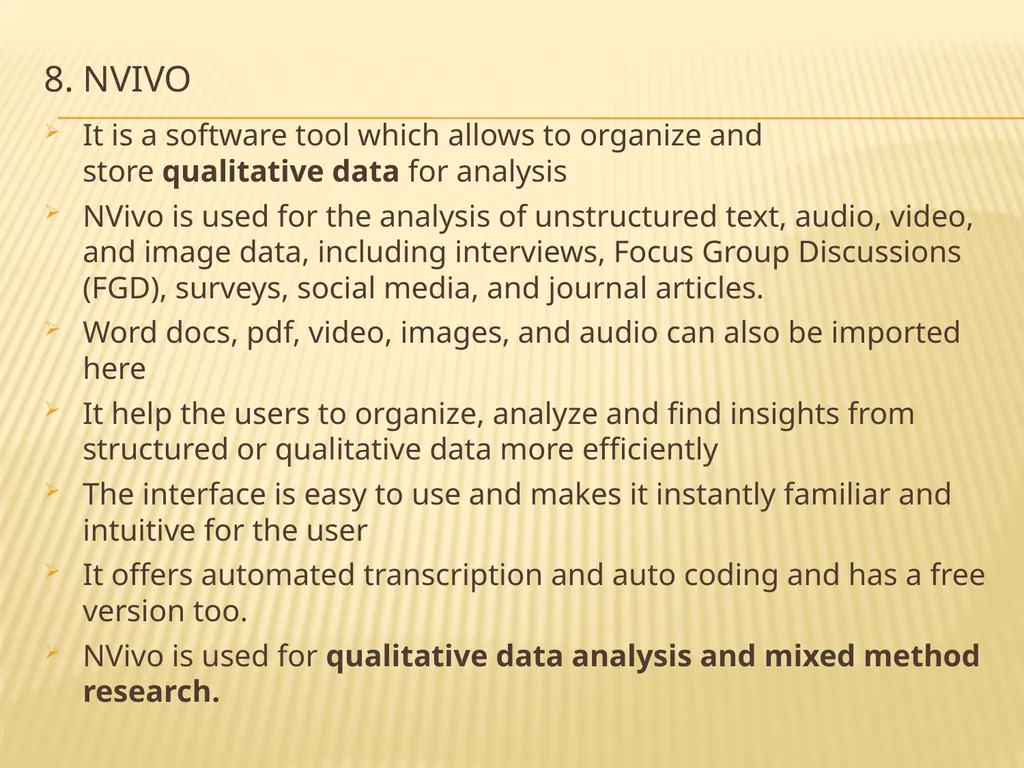
slide22. 8. NVivo It is a software tool which allows to organize and store qualitative data for analysis
NVivo is used for the analysis of unstructured text, audio, video, and image data, including interviews, Focus Group Discussions (FGD), surveys, social media, and journal articles.
Word docs, pdf, video, images, and audio can also be imported here
It help the users to organize, analyze and find insights from structured or qualitative data more efficiently
The interface is easy to use and makes it instantly familiar and intuitive for the user
It offers automated transcription and auto coding and has a free version too.
NVivo is used for qualitative data analysis and mixed method research.<br>
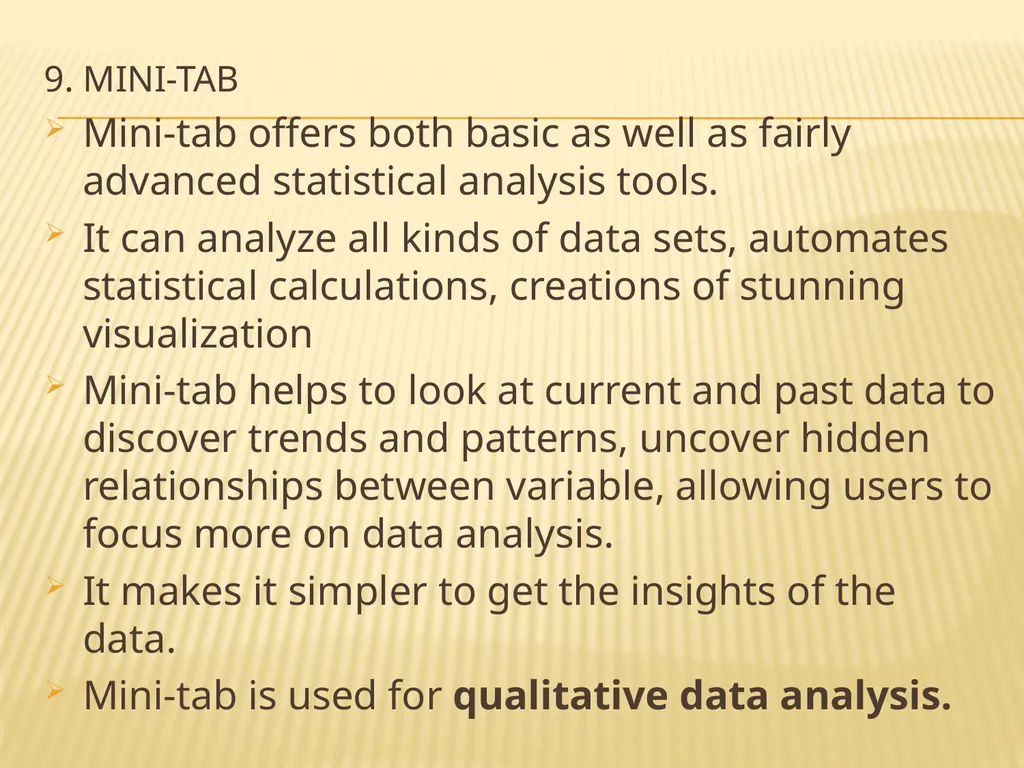
slide23. 9. Mini-tab Mini-tab offers both basic as well as fairly advanced statistical analysis tools.
It can analyze all kinds of data sets, automates statistical calculations, creations of stunning visualization
Mini-tab helps to look at current and past data to discover trends and patterns, uncover hidden relationships between variable, allowing users to focus more on data analysis.
It makes it simpler to get the insights of the data.
Mini-tab is used for qualitative data analysis.<br>
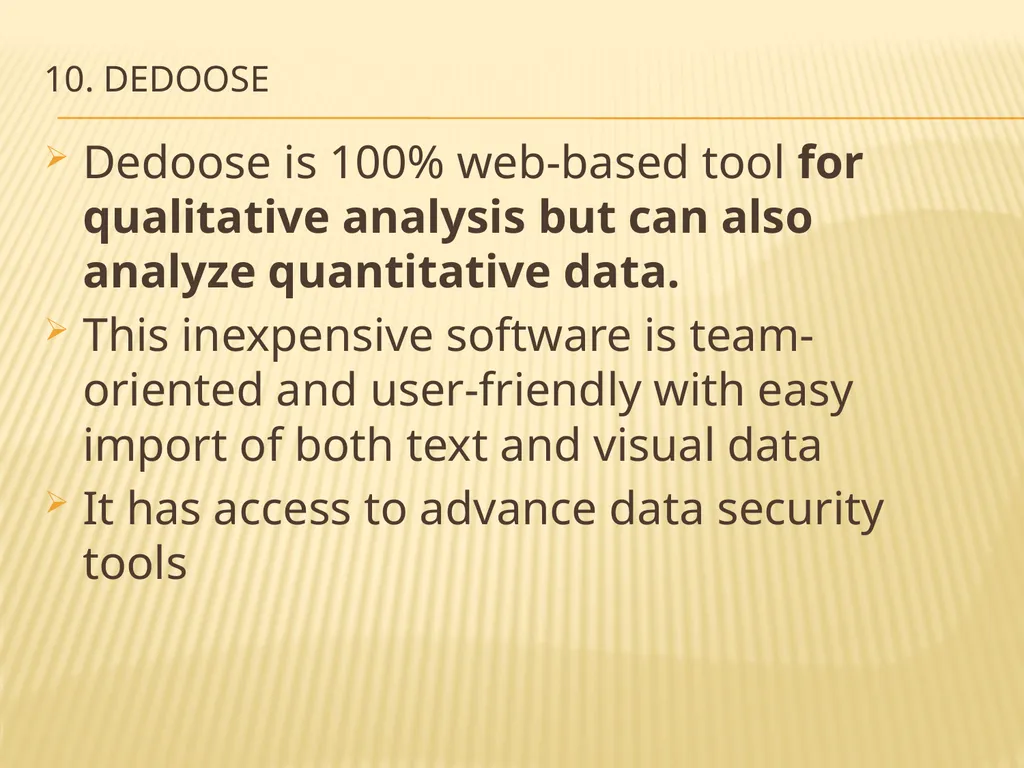
slide24. 10. Dedoose Dedoose is 100% web-based tool for qualitative analysis but can also analyze quantitative data.
This inexpensive software is team-oriented and user-friendly with easy import of both text and visual data
It has access to advance data security tools<br>
slide25. 11. ATLAS.ti
It is a leading software for qualitative analysis and has incorporated AI technology as it has evolved.
This is best for research organization, corporations and academic institutions. As it be expensive for individual research
It is more powerful, boating both sentiment analysis and auto coding
It offers the possibility to work in any language or character set
12. MAXDQA
It is a professional software for quantitative, qualitative and mixed method data analysis
It imports the data and review of the data in one central location with easy categorization of any unstructured data
Creation of literature review is also possible with this software
It is not available for free and can be difficult to work collaboratively in a team<br>
Statistical software are specialized programs designed to perform complex statistical analysis.
They are the tools that assist in the organization, interpretation, and presentation of selected data sets to provide science-based insights into patterns and trends.
Statistical software use statistical analysis theorems and methodologies such as regression analysis, time series analysis to perform data sciences.<br>
slide2. Benefits of Statistical Software Increases efficiency of the work.
More accuracy in data analysis an management.
Less time consuming.
Easy customization.
Grants access to large database.
Reduces sampling error.
Empowers to make data driven decisions.<br>
slide3. Application of Software in Public Health 1. In public health programs: Software are used for:
Communication.
Administrative works.
Recording and reporting.
Maintaining quality of programs.
Increasing the effectiveness and efficiency of programs.<br>
slide4. 2. In public health research Data collection.
Analysis.
Report writing.
Communication.<br>
slide5. 3. In hospitals and health care centers 4. Operation of information systems
(E.g.: Health Management Information System, Logistic Management Information System, GIS etc.)
5. In health economics and health care centers
6. Libraries, academics and many more<br>
slide6. Various Types of Statistical Software Used in Social Sciences 1. SPSS (Statistical Package for Social Sciences)
SPSS is the most widely used powerful software for complex statistical data analysis.
It easily compiles descriptive statistics, parametric and non- parametric analysis as well as delivers graphs and presentation ready reports to easily communicate the results.
More accurate reports are achieved here through estimation and uncovering of missing values in the data sets.
SPSS is used for quantitative data analysis.<br>
slide7. It is a program designed to undertake various statistical operations.
SPSS is a sodtware program that runs on windows operating system, it can be used to perform processes like data entry & analysis, create tables and construct graphs.
SPSS is capable of handling large amounts of data & is commonly used in health care, pharmaceuticals and social sciences.
SPSS can perform statistical analysis like descriptive studies, calculating mean values, prevalence, regression analysis, analysis of variance, etc.<br>
slide8. Advantages of SPSS
Very robust statistical software.
Complex statistical evaluations can be done.
Easy and quick display of data tables.
Limitations of SPSS
Expensive.
Complex operating procedure.
Requires trained personnel.<br>
slide9. Applications of SPSS in pharmacy
Research & Development
SPSS is used in design, development & implementation of analytical data along with the existing data in various statistical procedures.
Quality control & Manufacturing
SPSS helps in designing, quality control and manufacturing statistics and helps in standardizing various steps and procedures.<br>
slide10. Regulatory & Safety testing
SPSS tools provide an efficient mechanism for automating and validating routine analysis report like determining power of a study and sample size calculation.
Clinical trails
SPSS is the most powerful tool and plays an important role in phase-1 and phase-2 clinical studies on small sample sizes.<br>
slide11. Epi Info
These are a series of freely available tools that run on windows operating system.
Epi Info is used by public health professionals to conduct disease outbreak investigations, manage data bases for public health care services.
Epi Info helps the physicians, epidemiologists and public health officers to develop a questionnaire or form, customize data entry process, enter and analyze data.<br>
slide12. Advantages of Epi Info
It is freely available.
Simple operating procedure.
Can perform descriptive statistics and intermediate analysis like comparison of means, regression analysis, etc.
Can be used for data entry and storage.
Disadvantages of Epi Info
Runs on windows only.
Limited options available for analysis.
Can be used only for basic statistics.<br>
slide13. SAS (Statistical Analysis System)
SAS was developed in north Carolina State University in 1976 and was further developed in the 80,s and 1990,s with the addition of new statistical procedures.
SAS is a software developed for performing advance analytics, multivariate analysis, business intelligence, data management and predictive analysis.
SAS helps in mining, altering, managing and retrieving data from a variety of sources and can perform statistical analysis on it.
SAS provides a good graphical interface with many options that are simple and easy to use.<br>
slide14. Advantages of SAS
Easy to learn.
It can handle large data bases easily.
Dedicated customer support.
Security provided for data.
Disadvantages
Expensive.
Better software’s are now available at a lesser price.<br>
slide15. Applications of SAS
It can be used for operating regression models to explore dose-effect relationship.
It can be used for simulating pseudo subjects in drug development program.
It is used for calculating the probability of finding a best dose.
SAS is used to simulate the working of 3 phases in clinical trials and automating a mechanism for choosing doses at the end of each phase.<br>
slide16. Other statistical softwares STATA
R
MATLAB
EPI DATA
N VIVO
MINI TAB
DE DOOSE
ATLAS.ti
MAXDQA<br>
slide17. 3. R R’ software is widely used free statistical software that provides statistical and graphical techniques including linear and non-linear modeling.
Toolboxes essentially plugins are available for great range of applications. Knowledge of coding is required here.
It provides interactive reports and applications, leverage large amount of data and is complaint with security practices and standards.
R is used for quantitative data analysis.<br>
slide18. 4. SAS (Statistical Analysis Software) It is a cloud based platform that provides ready to use programs for data manipulation, information storage and retrieval.
Its procedures are multithreadede. performing multiple operations at once.
It is primarily used for statistical modeling, observing trends and patterns in data and aiding in decision-making by business analysts, statisticians, data scientists, researchers and engineers.
Coding can be difficult to those new to this approach.
It is used for quantitative data analysis.<br>
slide19. 5. MATLAB (MATrix LABoratory) MATLAB stands for MATrix LABoratory.
MATLAB is software that provides an analytical platform and programming language
It expresses matrix and array mathematics, plotting of functions and data, implementation of algorithms, creation of user interfaces.
Live Editor is also included which creates a script that combines code, output, and formatted text in a executable notebook.
It is widely used by engineer and scientist.
MATLAB is used for quantitative data analysis.<br>
slide20. 6. Epi-data Epi-data is free widely used data software designed to assist epidemiologist, public health investigators and others to enter, manage and analyze data in the field.
It performs basic statistical analysis, graphs and comprehensive data management.
Here user gets to create own forms and database.
Epi-data is used for quantitative data analysis.<br>
slide21. 7. Epi-info It is a public domain suite software tool designed for researchers and public health practitioners of the globe developed by Centre for disease control and prevention (CDC)
It provides easy data entry form and database construction, and data analyses with epidemiologic statistics, maps, and graphs for those who may lack an information technology background.
It is used for outbreak investigations; for developing small to mid-sized disease surveillance systems; as analysis, visualization, and reporting (AVR) components of larger systems.
It is used for quantitative data analysis.<br>
slide22. 8. NVivo It is a software tool which allows to organize and store qualitative data for analysis
NVivo is used for the analysis of unstructured text, audio, video, and image data, including interviews, Focus Group Discussions (FGD), surveys, social media, and journal articles.
Word docs, pdf, video, images, and audio can also be imported here
It help the users to organize, analyze and find insights from structured or qualitative data more efficiently
The interface is easy to use and makes it instantly familiar and intuitive for the user
It offers automated transcription and auto coding and has a free version too.
NVivo is used for qualitative data analysis and mixed method research.<br>
slide23. 9. Mini-tab Mini-tab offers both basic as well as fairly advanced statistical analysis tools.
It can analyze all kinds of data sets, automates statistical calculations, creations of stunning visualization
Mini-tab helps to look at current and past data to discover trends and patterns, uncover hidden relationships between variable, allowing users to focus more on data analysis.
It makes it simpler to get the insights of the data.
Mini-tab is used for qualitative data analysis.<br>
slide24. 10. Dedoose Dedoose is 100% web-based tool for qualitative analysis but can also analyze quantitative data.
This inexpensive software is team-oriented and user-friendly with easy import of both text and visual data
It has access to advance data security tools<br>
slide25. 11. ATLAS.ti
It is a leading software for qualitative analysis and has incorporated AI technology as it has evolved.
This is best for research organization, corporations and academic institutions. As it be expensive for individual research
It is more powerful, boating both sentiment analysis and auto coding
It offers the possibility to work in any language or character set
12. MAXDQA
It is a professional software for quantitative, qualitative and mixed method data analysis
It imports the data and review of the data in one central location with easy categorization of any unstructured data
Creation of literature review is also possible with this software
It is not available for free and can be difficult to work collaboratively in a team<br>