Investment Ratio Farhad Al-Kake Farhad.Alkaketiu.edu.iq Investment Ratio or Investors Ratios Investors ratios are of interest to investors in shares and bonds and their advisers, these ratios assist the investors in making a decision
"Investment Ratio Farhad Al-Kake" is the property of its rightful owner. Permission is granted to
download and print the materials on this website for personal, non-commercial use only, and to display it
on your personal computer provided you do not modify the materials and that you retain all copyright
notices contained in the materials. By downloading content from our website, you accept the terms of this
agreement.
Presentation Transcript
01
Investment Ratio
Farhad Al-Kake
Farhad.Alkake@tiu.edu.iq<br>
02
Investment Ratio or Investors’ Ratios Investors’ ratios are of interest to investors in shares and bonds and their advisers, these ratios assist the investors in making a decision whether to invest or divest their interest in a company.
Investment ratios include:
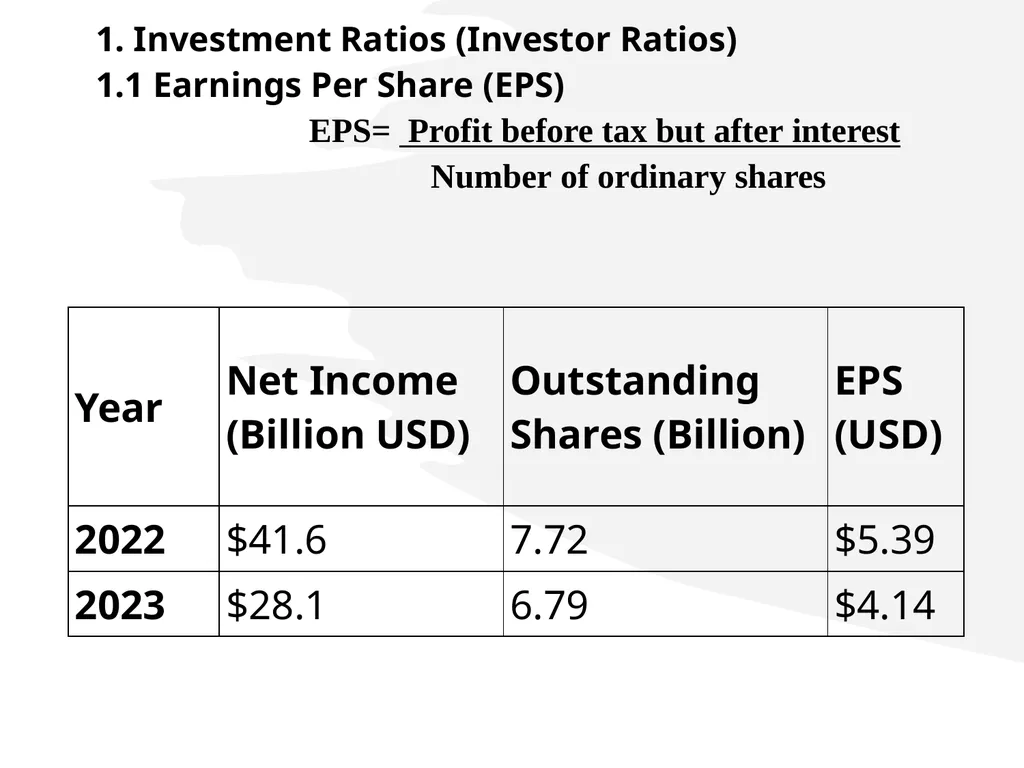
1. Earnings per Share (EPS): EPS is normally viewed as a key measure of an entity’s financial
performance. It measures the profit earned for each equity share of the entity.
Basic EPS is calculated as follows:
EPS= Profit before tax but after interest Number of ordinary shares
It can also be calculated by:
EPS= Net profit (or loss) attributable to ordinary shareholders during a period
Weighted average number of shares in issue during the period<br>
03
Price-earnings ratio (P/E ratio): The price/earnings (P/E) ratio measures how expensive
or cheap a share is in relation to its annual earnings.
A P/E ratio of 10, for example, means that investors are prepared to pay the current price for the share equal to 10 years of earnings (at the level of EPS in the previous year). A high P/E ratio is usually a sign of confidence in an entity, because it suggests that its earnings are expected to grow in future years. A low P/E ratio usually means that an entity’s future prospects for EPS growth are expected to be poor, so that investors do not put a high value on the shares.
Therefore, this shows the confidence which a shareholder can have in the profit growth
of a company.<br>
04
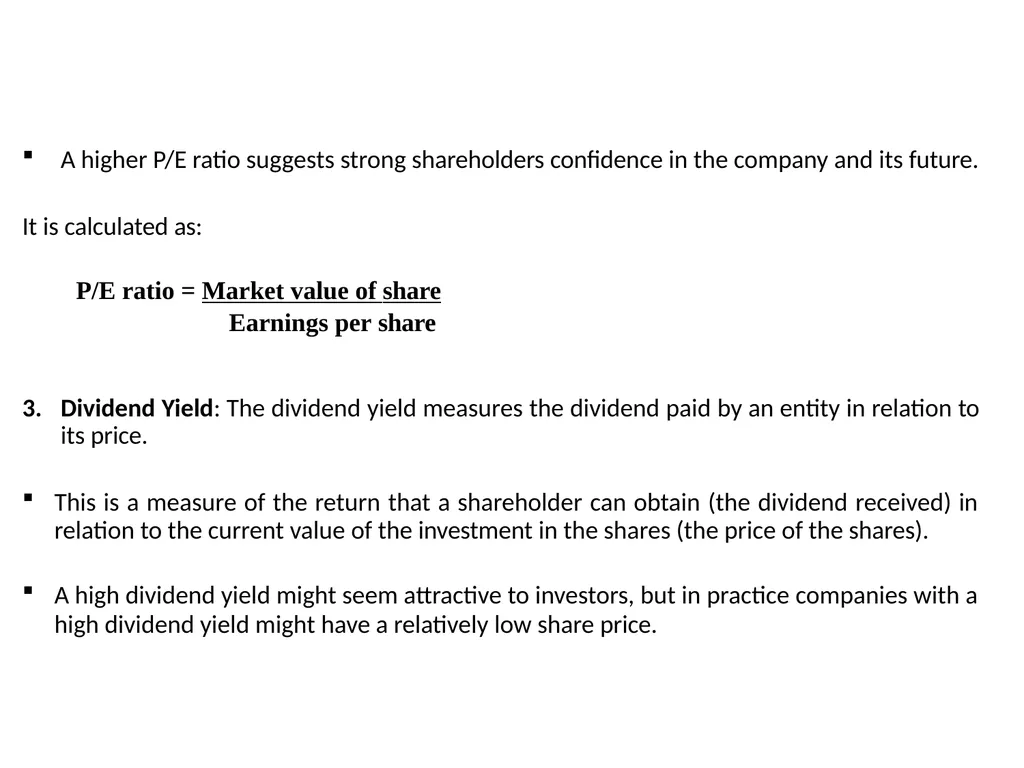
A higher P/E ratio suggests strong shareholders confidence in the company and its future.
It is calculated as:
P/E ratio = Market value of share
Earnings per share
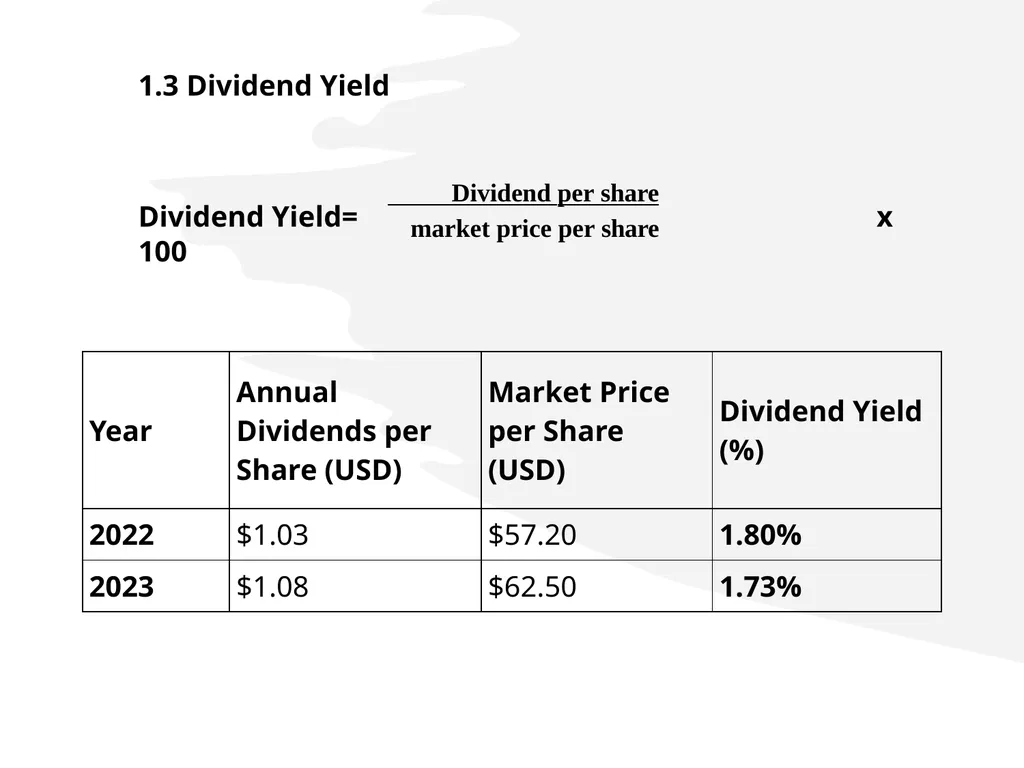
Dividend Yield: The dividend yield measures the dividend paid by an entity in relation to its price.
This is a measure of the return that a shareholder can obtain (the dividend received) in relation to the current value of the investment in the shares (the price of the shares).
A high dividend yield might seem attractive to investors, but in practice companies with a
high dividend yield might have a relatively low share price.<br>
05
There are two things to note:
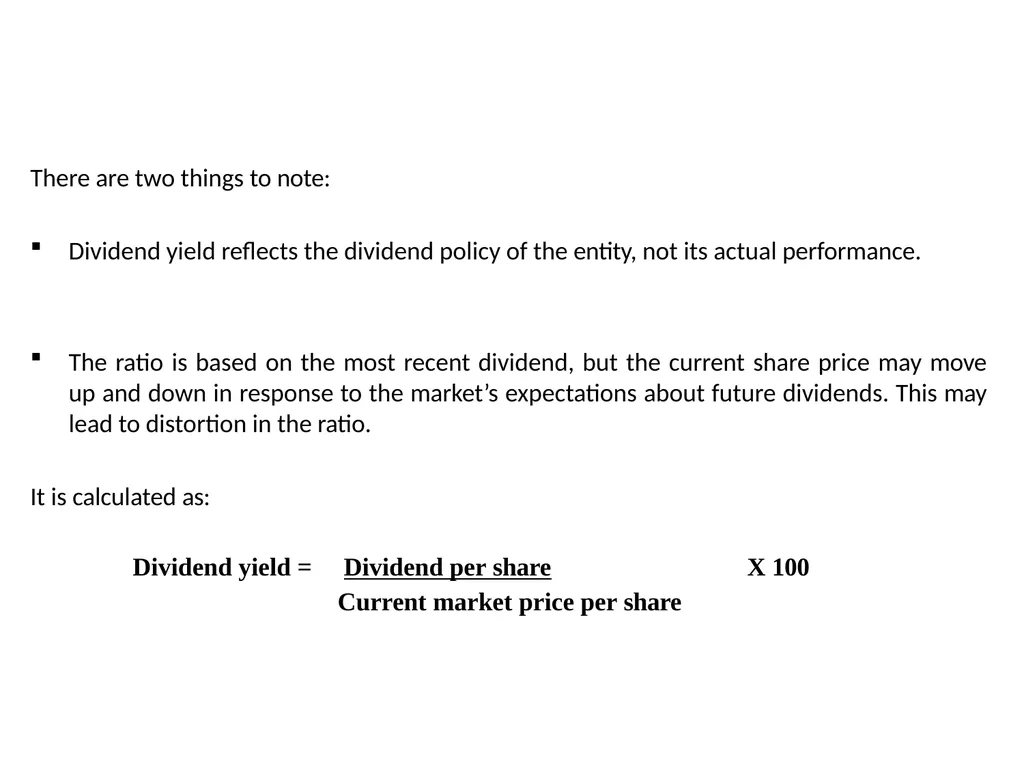
Dividend yield reflects the dividend policy of the entity, not its actual performance. The ratio is based on the most recent dividend, but the current share price may move up and down in response to the market’s expectations about future dividends. This may lead to distortion in the ratio.
It is calculated as: Dividend yield = Dividend per share Current market price per share X 100<br>
06
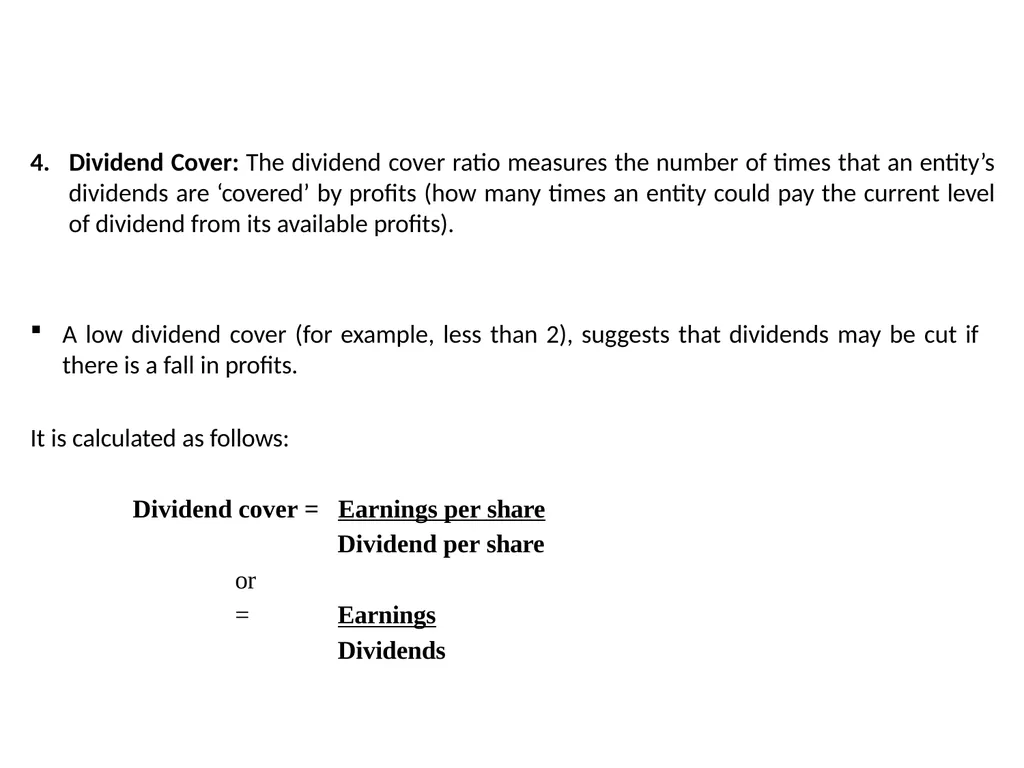
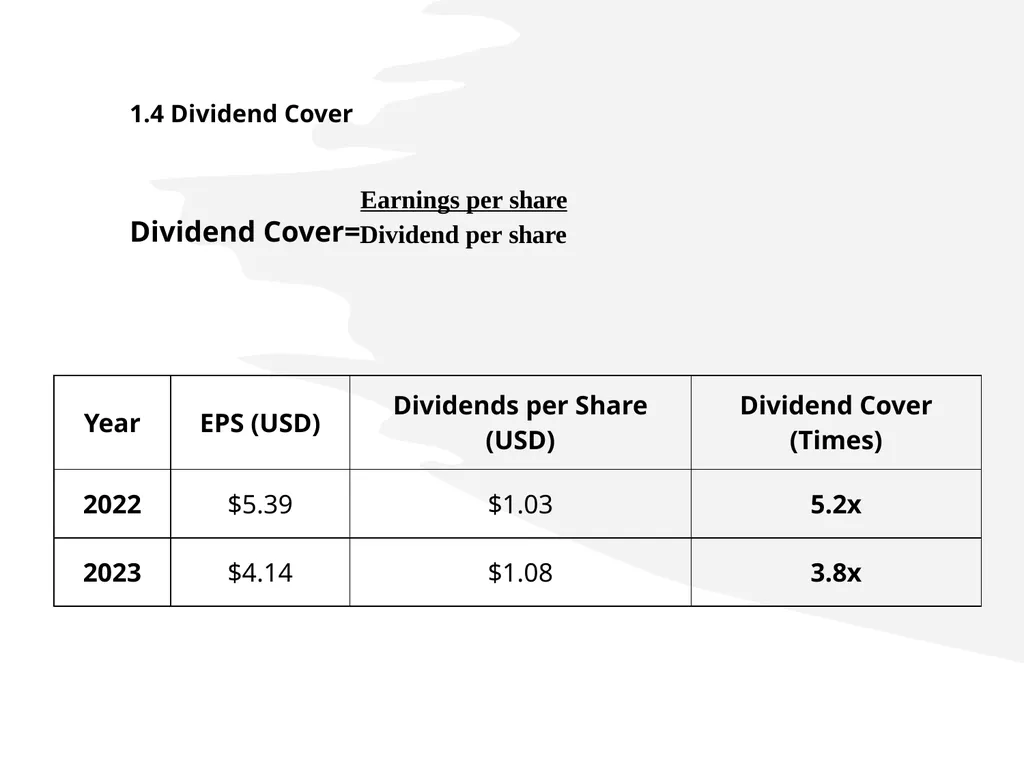
4. Dividend Cover: The dividend cover ratio measures the number of times that an entity’s dividends are ‘covered’ by profits (how many times an entity could pay the current level of dividend from its available profits). A low dividend cover (for example, less than 2), suggests that dividends may be cut if there is a fall in profits.
It is calculated as follows: Dividend cover = Earnings per share Dividend per share or
= Earnings Dividends<br>
07
Liquidity Ratios For the purpose of financial ratio analysis, liquidity is measured on the assumption that t he only sources of cash available are:
Cash in hand or in the bank, plus
Current assets that will soon be converted into cash during the normal operating cycle of
trade.
It is also assumed that the only immediate payment obligations faced by the entity are its current liabilities. Liquidity means having cash or enough assets that can be easily converted into cash without loosing its value, so as to meet obligations to make payments.<br>
08
There are two ratios for measuring liquidity:
Current ratio
Quick ratio, also called the acid test ratio.
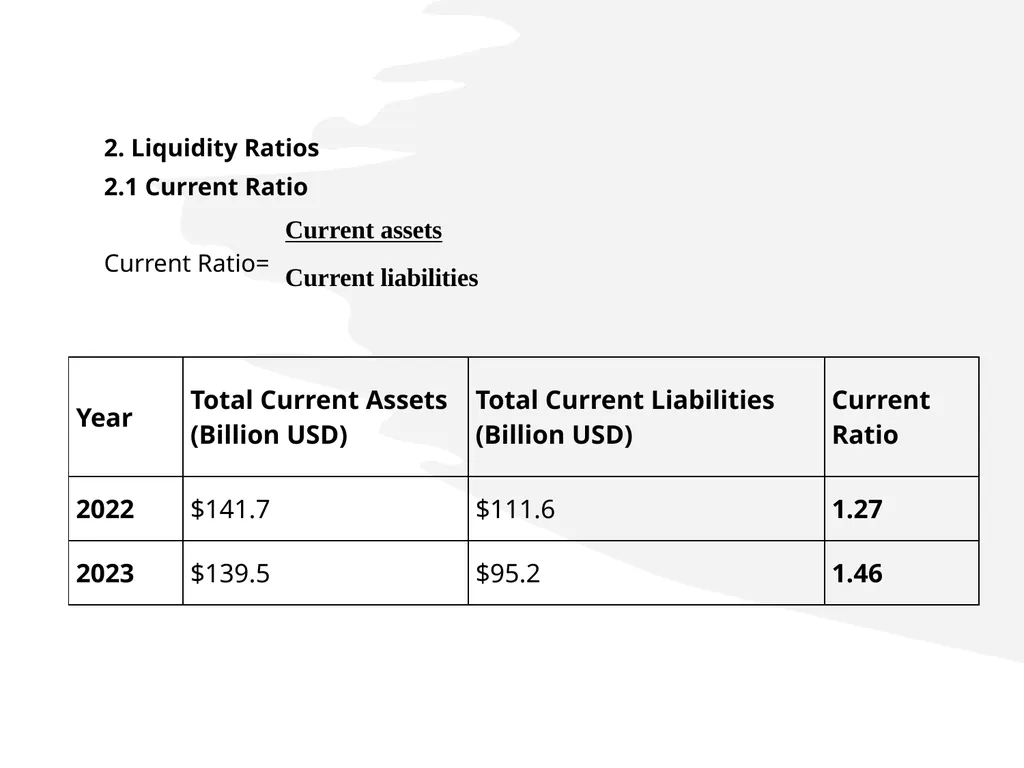
1. Current ratio: : current ratio indicates the firm ability to meet maturing obligations as at when due. The ratio therefore compares all short-term resources with short-term obligations. The current ratio is the ratio of current assets to current liabilities. The amounts of current assets and current liabilities in the statement of financial position at the end of the year are be used. But sometimes average value can be used when the balance in the beginning and the balance in the end are given<br>
09
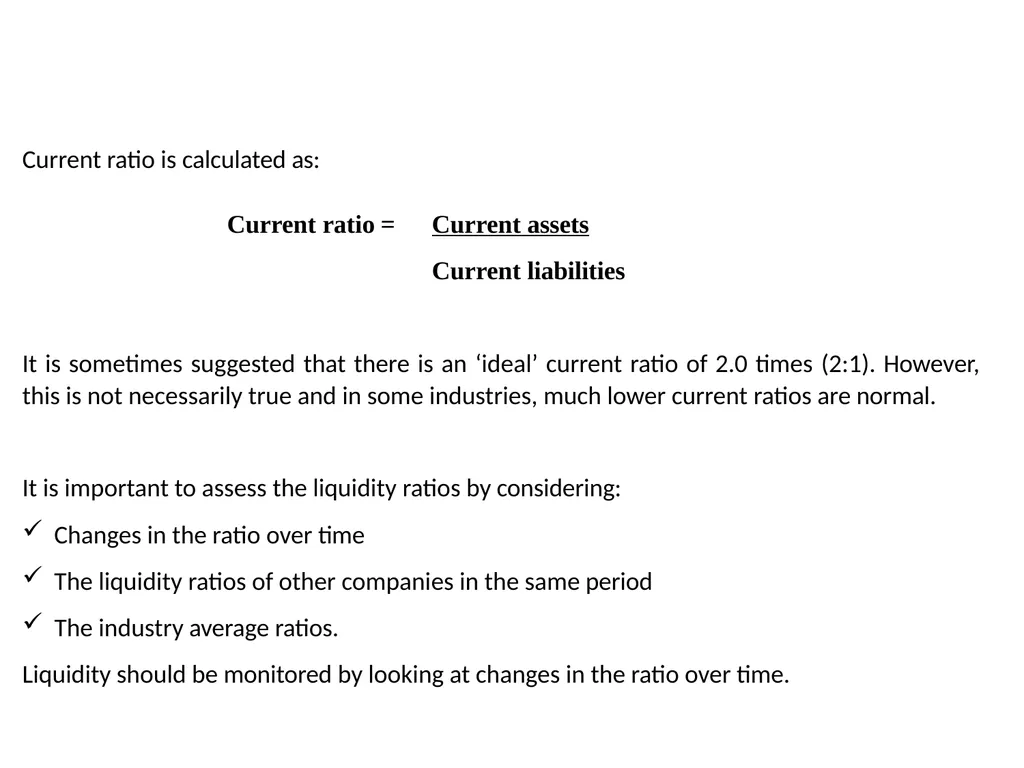
Current ratio is calculated as: Current ratio = Current assets Current liabilities It is sometimes suggested that there is an ‘ideal’ current ratio of 2.0 times (2:1). However, this is not necessarily true and in some industries, much lower current ratios are normal.
It is important to assess the liquidity ratios by considering:
Changes in the ratio over time
The liquidity ratios of other companies in the same period
The industry average ratios.
Liquidity should be monitored by looking at changes in the ratio over time.<br>
10
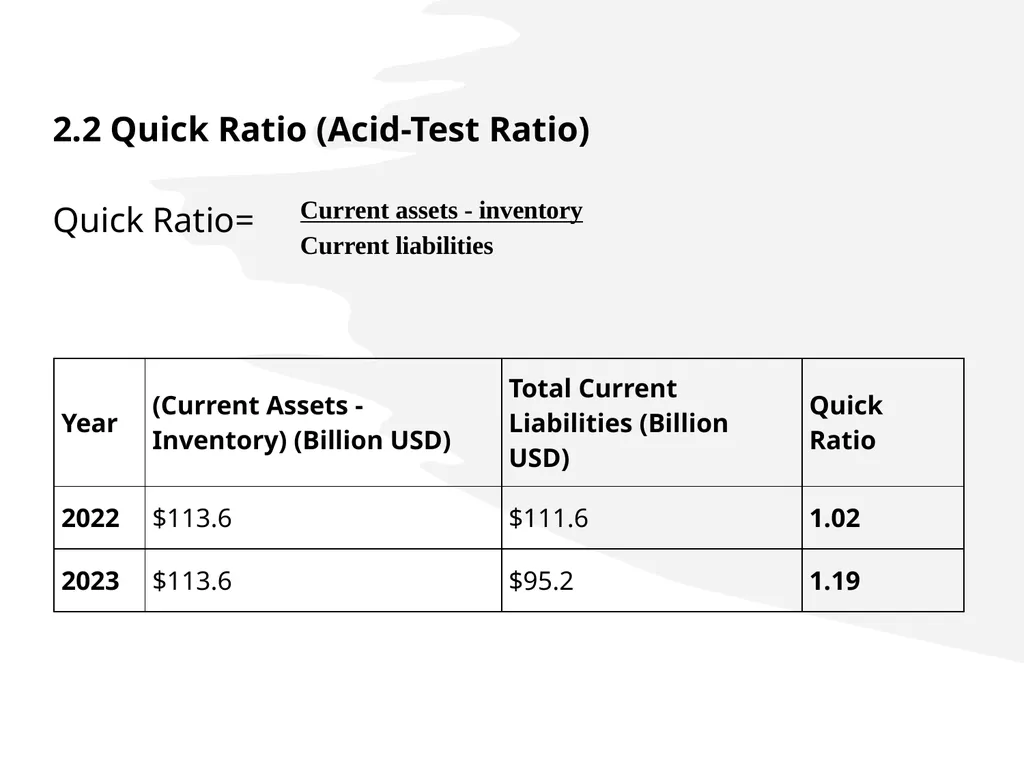
Quick Ratio or Acid Test Ratio: this ratio establishes a relationship between quick, or liquid assets and current liabilities. The quick ratio or acid test ratio is the ratio of current assets excluding inventory to current liabilities.
Inventory is excluded from current assets on the assumption that it is not a very liquid item.
This ratio is a better measurement of liquidity than the current ratio when inventory turnover times are very slow, and inventory is not a liquid asset. The amounts of current assets and current liabilities in the statement of financial position at the end of the year are be used. But sometimes average value can be used when the balance in the beginning and the balance in the end are given.<br>
11
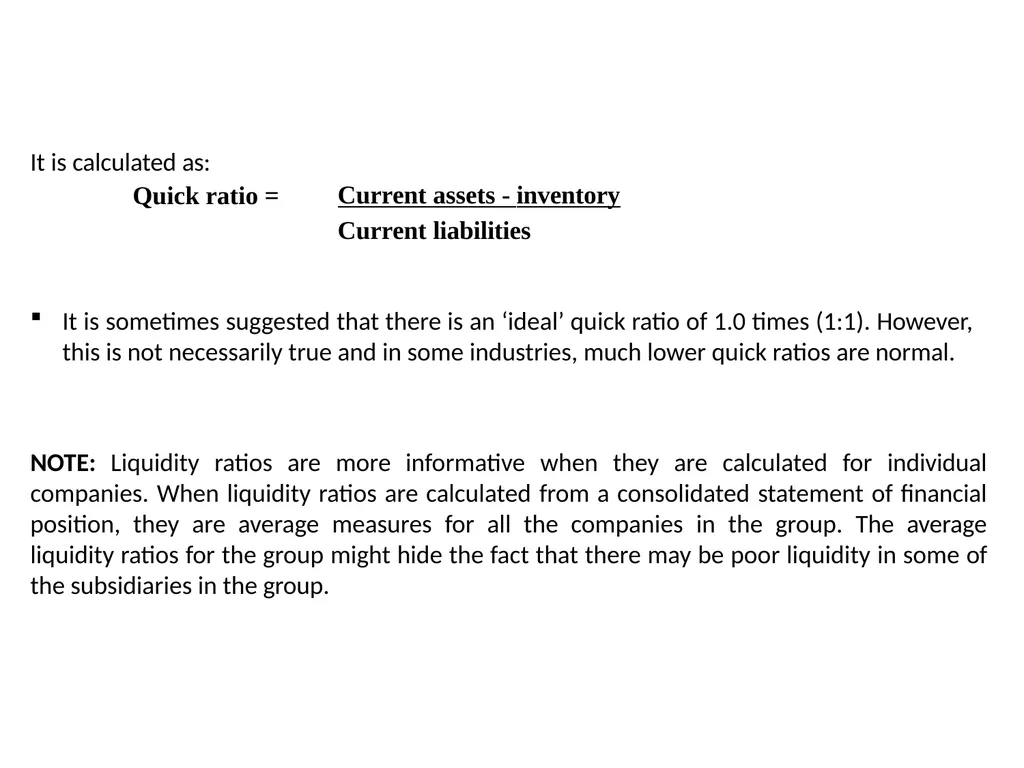
It is calculated as:
Quick ratio = Current assets - inventory Current liabilities It is sometimes suggested that there is an ‘ideal’ quick ratio of 1.0 times (1:1). However,
this is not necessarily true and in some industries, much lower quick ratios are normal. NOTE: Liquidity ratios are more informative when they are calculated for individual companies. When liquidity ratios are calculated from a consolidated statement of financial position, they are average measures for all the companies in the group. The average liquidity ratios for the group might hide the fact that there may be poor liquidity in some of the subsidiaries in the group.<br>
12
1. Investment Ratios (Investor Ratios)
1.1 Earnings Per Share (EPS)
EPS= Profit before tax but after interest
Number of ordinary shares<br>
13
1.2 Price-Earnings Ratio (P/E Ratio)
P/E ratio = Market value of share
Earnings per share
Shell’s Share Price (End of 2023): $62.50
Shell’s Share Price (End of 2022): $57.20<br>
14
1.3 Dividend Yield
Dividend Yield= x 100 Dividend per share market price per share<br>
15
1.4 Dividend Cover
Dividend Cover= Earnings per share Dividend per share<br>
16
2. Liquidity Ratios
2.1 Current Ratio
Current Ratio= Current assets
Current liabilities<br>
17
2.2 Quick Ratio (Acid-Test Ratio)
Quick Ratio= Current assets - inventory Current liabilities<br>
18
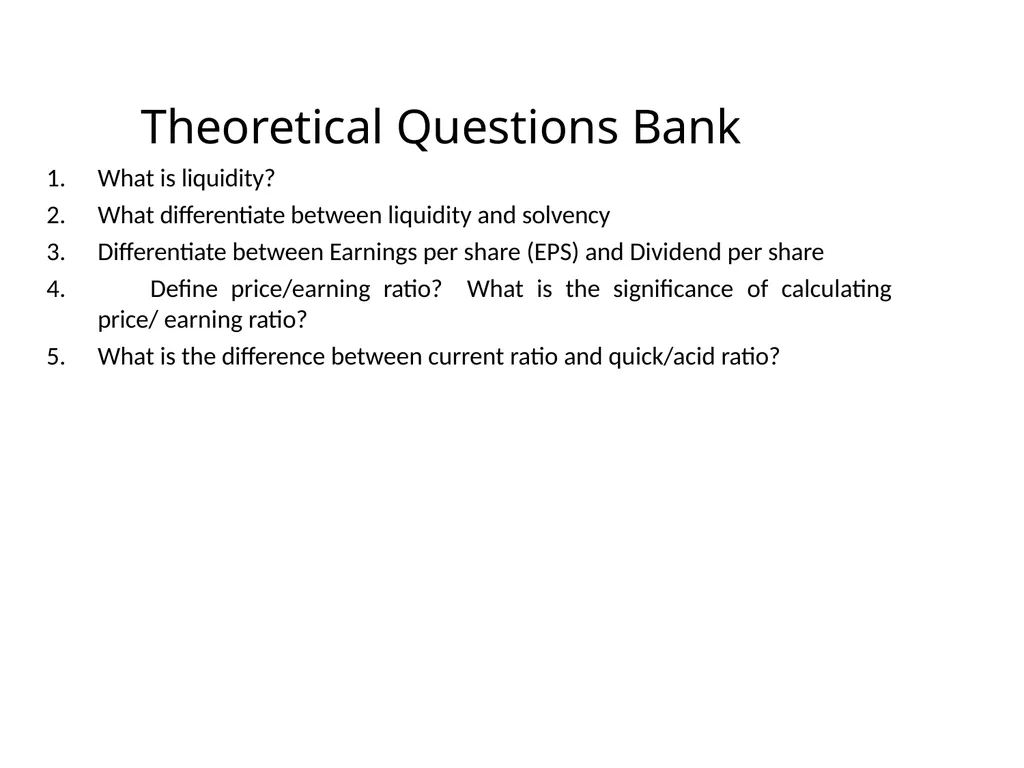
Theoretical Questions Bank What is liquidity?
What differentiate between liquidity and solvency
Differentiate between Earnings per share (EPS) and Dividend per share
Define price/earning ratio? What is the significance of calculating price/ earning ratio?
What is the difference between current ratio and quick/acid ratio?<br>