
IOU LIP Workshop - May 12, 2025 Statewide (PG&E
LD
Published · 39 slides · 0 views
1 / 1
Description
IOU LIP Workshop - May 12, 2025 Statewide (PGE and SCE) BIP PY2024 Load impact Evaluation Agenda PY2024 BIP Program Overview Ex Post Evaluation Methodology PY2024 Ex Post Results Ex Ante Evaluation Methodology Enrollment Forecasts PY2025
Related Topics
Share
Embed code
Download this presentation From Below
"IOU LIP Workshop - May 12, 2025 Statewide (PG&E" is the property of its rightful owner. Permission is granted to download and print the materials on this website for personal, non-commercial use only, and to display it on your personal computer provided you do not modify the materials and that you retain all copyright notices contained in the materials. By downloading content from our website, you accept the terms of this agreement.
Presentation Transcript
01
IOU LIP Workshop - May 12, 2025 Statewide (PG&E and SCE) BIP PY2024 Load impact Evaluation<br>
02
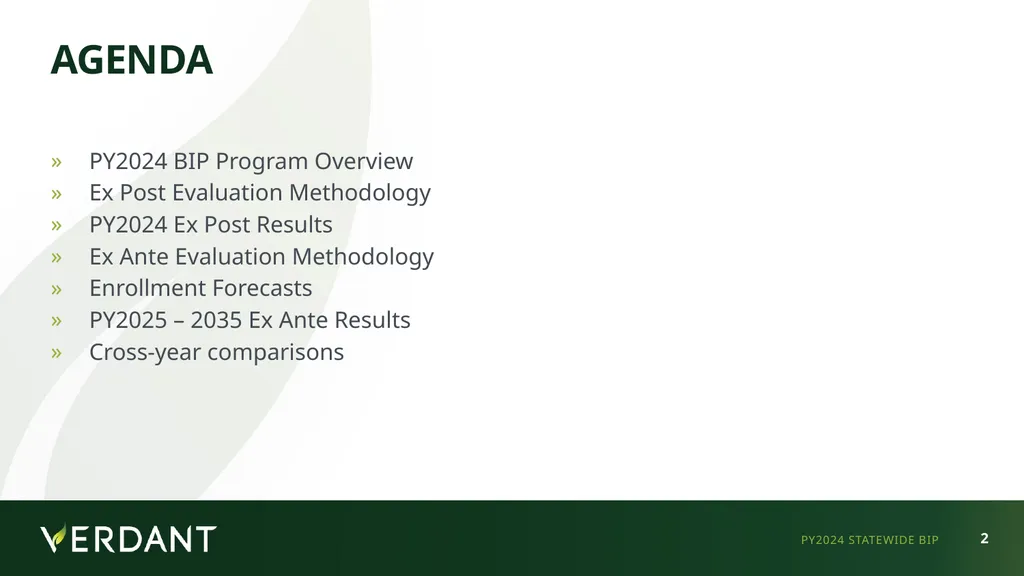
Agenda PY2024 BIP Program Overview
Ex Post Evaluation Methodology
PY2024 Ex Post Results
Ex Ante Evaluation Methodology
Enrollment Forecasts
PY2025 – 2035 Ex Ante Results
Cross-year comparisons PY2024 STATEWIDE BIP<br>
Ex Post Evaluation Methodology
PY2024 Ex Post Results
Ex Ante Evaluation Methodology
Enrollment Forecasts
PY2025 – 2035 Ex Ante Results
Cross-year comparisons PY2024 STATEWIDE BIP<br>
03
py2024 BIP Program Availability
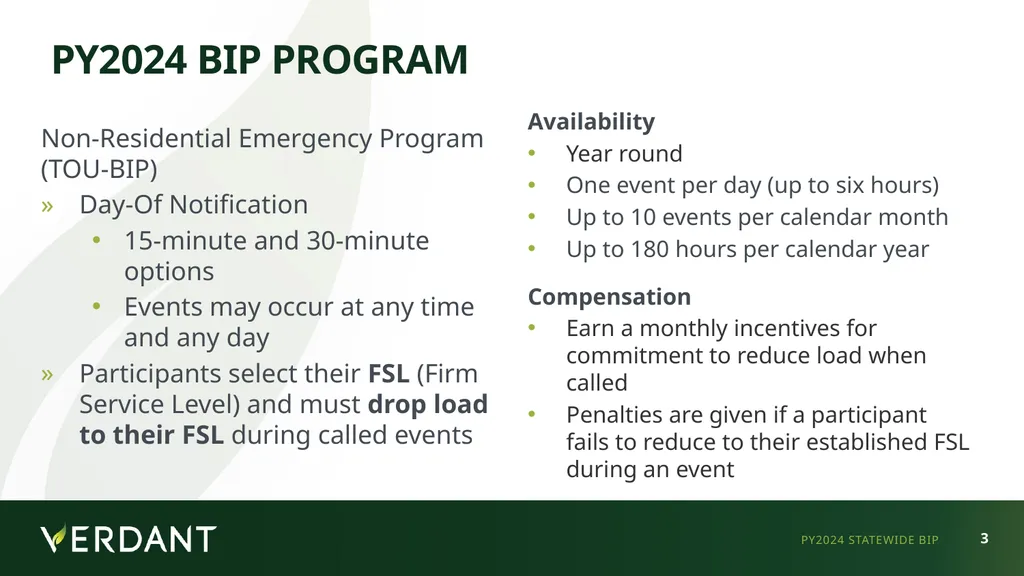
Year round
One event per day (up to six hours)
Up to 10 events per calendar month
Up to 180 hours per calendar year
Compensation
Earn a monthly incentives for commitment to reduce load when called
Penalties are given if a participant fails to reduce to their established FSL during an event PY2024 STATEWIDE BIP Non-Residential Emergency Program (TOU-BIP)
Day-Of Notification
15-minute and 30-minute options
Events may occur at any time and any day
Participants select their FSL (Firm Service Level) and must drop load to their FSL during called events<br>
Year round
One event per day (up to six hours)
Up to 10 events per calendar month
Up to 180 hours per calendar year
Compensation
Earn a monthly incentives for commitment to reduce load when called
Penalties are given if a participant fails to reduce to their established FSL during an event PY2024 STATEWIDE BIP Non-Residential Emergency Program (TOU-BIP)
Day-Of Notification
15-minute and 30-minute options
Events may occur at any time and any day
Participants select their FSL (Firm Service Level) and must drop load to their FSL during called events<br>
04
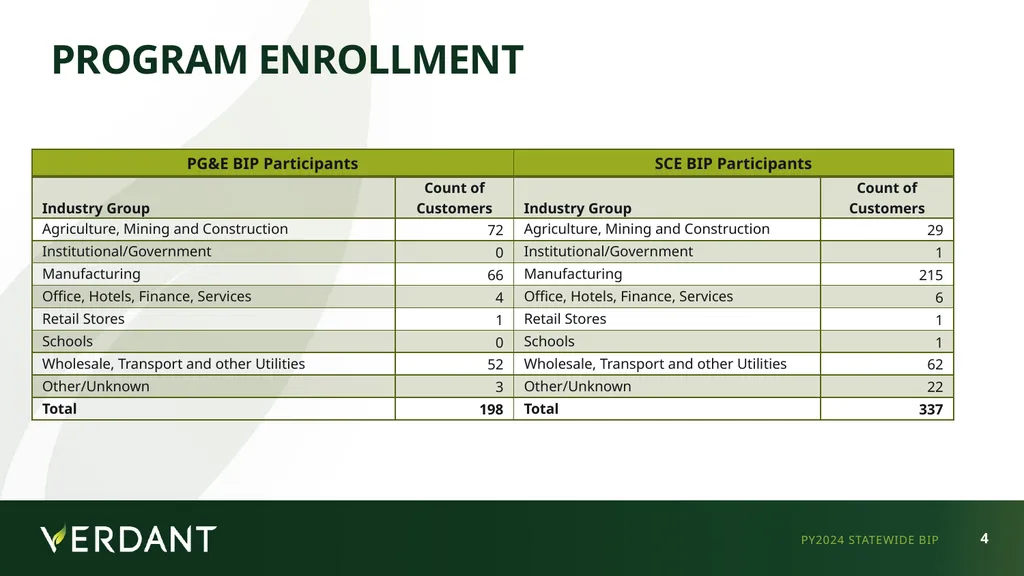
Program Enrollment PY2024 STATEWIDE BIP<br>
05
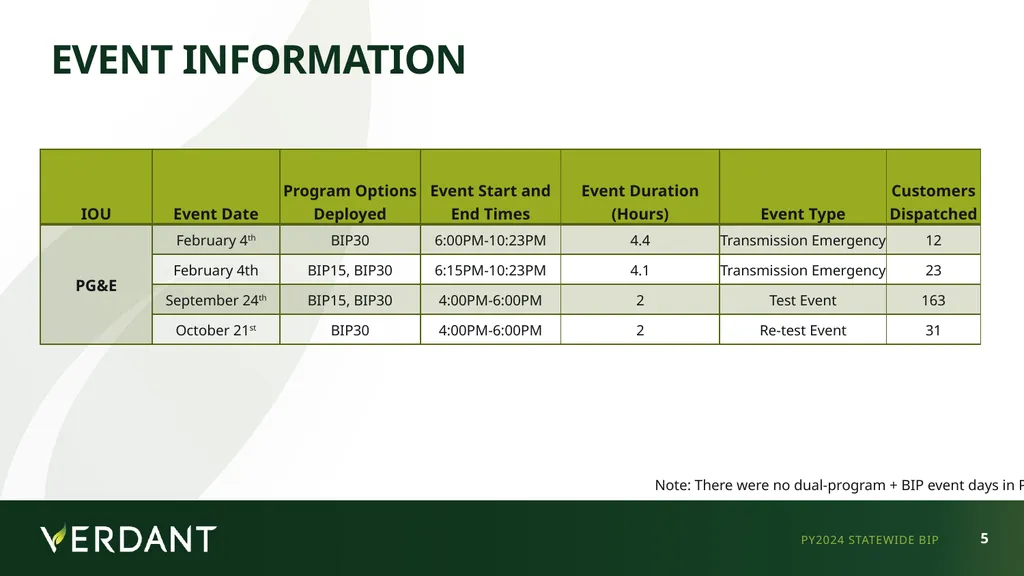
Event Information PY2024 STATEWIDE BIP Note: There were no dual-program + BIP event days in PY2024<br>
06
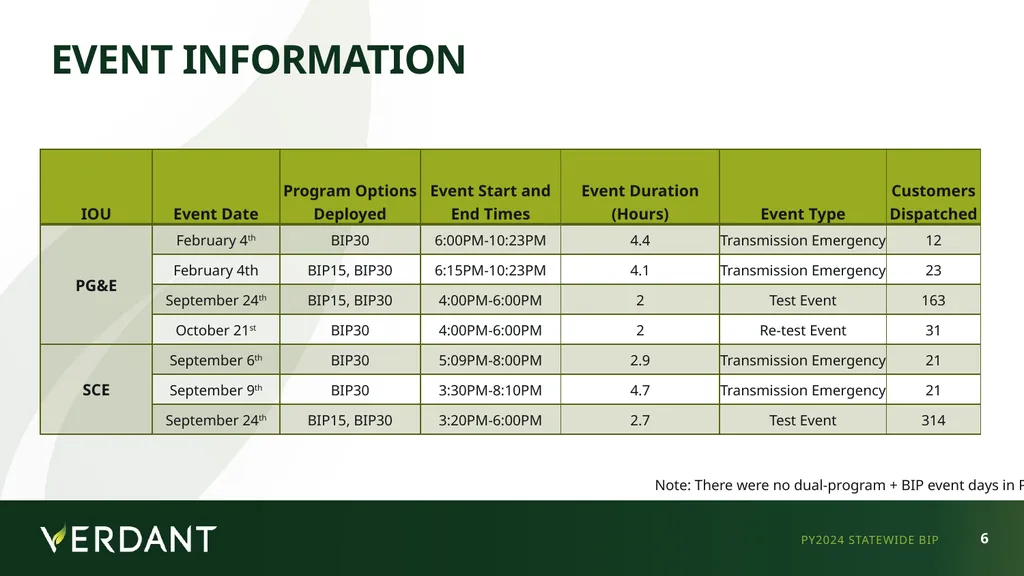
Event Information PY2024 STATEWIDE BIP Note: There were no dual-program + BIP event days in PY2024<br>
07
PY2024 Ex-Post Analysis PY2024 STATEWIDE BIP<br>
08
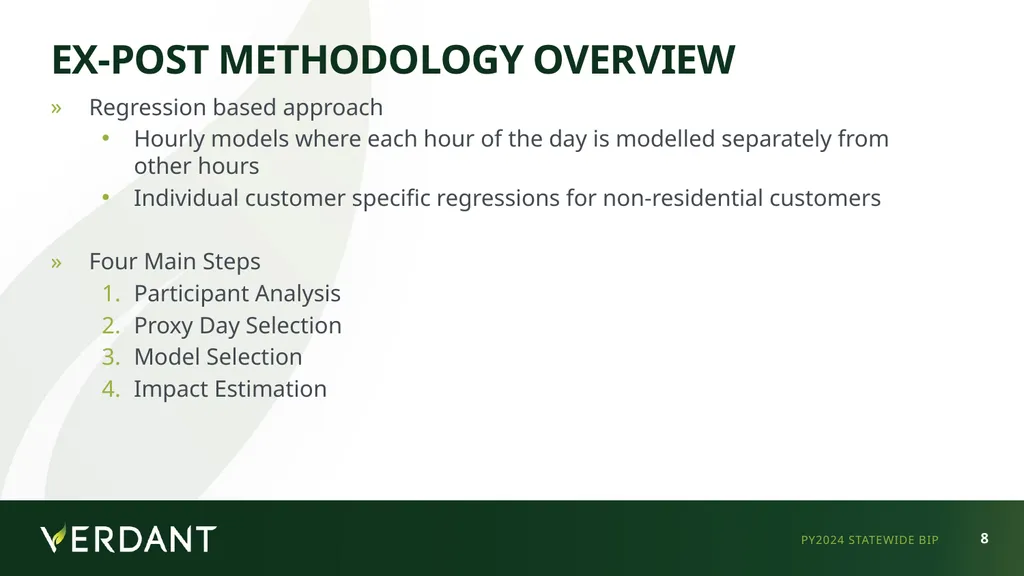
Ex-Post Methodology Overview Regression based approach
Hourly models where each hour of the day is modelled separately from other hours
Individual customer specific regressions for non-residential customers
Four Main Steps
Participant Analysis
Proxy Day Selection
Model Selection
Impact Estimation PY2024 STATEWIDE BIP<br>
Hourly models where each hour of the day is modelled separately from other hours
Individual customer specific regressions for non-residential customers
Four Main Steps
Participant Analysis
Proxy Day Selection
Model Selection
Impact Estimation PY2024 STATEWIDE BIP<br>
09
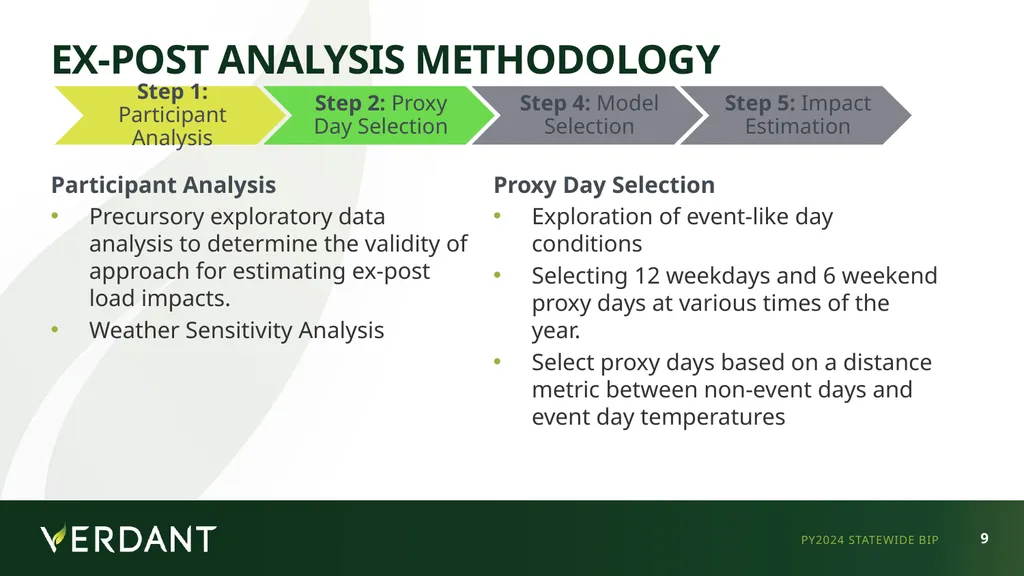
Ex-Post Analysis Methodology PY2024 STATEWIDE BIP Proxy Day Selection
Exploration of event-like day conditions
Selecting 12 weekdays and 6 weekend proxy days at various times of the year.
Select proxy days based on a distance metric between non-event days and event day temperatures Participant Analysis
Precursory exploratory data analysis to determine the validity of approach for estimating ex-post load impacts.
Weather Sensitivity Analysis<br>
Exploration of event-like day conditions
Selecting 12 weekdays and 6 weekend proxy days at various times of the year.
Select proxy days based on a distance metric between non-event days and event day temperatures Participant Analysis
Precursory exploratory data analysis to determine the validity of approach for estimating ex-post load impacts.
Weather Sensitivity Analysis<br>
10
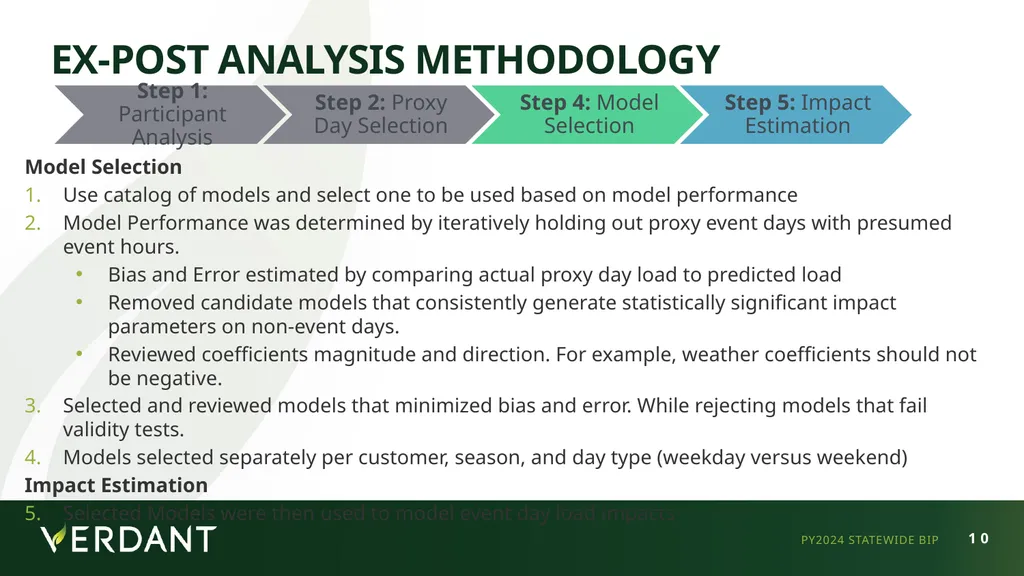
Ex-Post Analysis Methodology PY2024 STATEWIDE BIP Model Selection
Use catalog of models and select one to be used based on model performance
Model Performance was determined by iteratively holding out proxy event days with presumed event hours.
Bias and Error estimated by comparing actual proxy day load to predicted load
Removed candidate models that consistently generate statistically significant impact parameters on non-event days.
Reviewed coefficients magnitude and direction. For example, weather coefficients should not be negative.
Selected and reviewed models that minimized bias and error. While rejecting models that fail validity tests.
Models selected separately per customer, season, and day type (weekday versus weekend)
Impact Estimation
Selected Models were then used to model event day load impacts<br>
Use catalog of models and select one to be used based on model performance
Model Performance was determined by iteratively holding out proxy event days with presumed event hours.
Bias and Error estimated by comparing actual proxy day load to predicted load
Removed candidate models that consistently generate statistically significant impact parameters on non-event days.
Reviewed coefficients magnitude and direction. For example, weather coefficients should not be negative.
Selected and reviewed models that minimized bias and error. While rejecting models that fail validity tests.
Models selected separately per customer, season, and day type (weekday versus weekend)
Impact Estimation
Selected Models were then used to model event day load impacts<br>
11
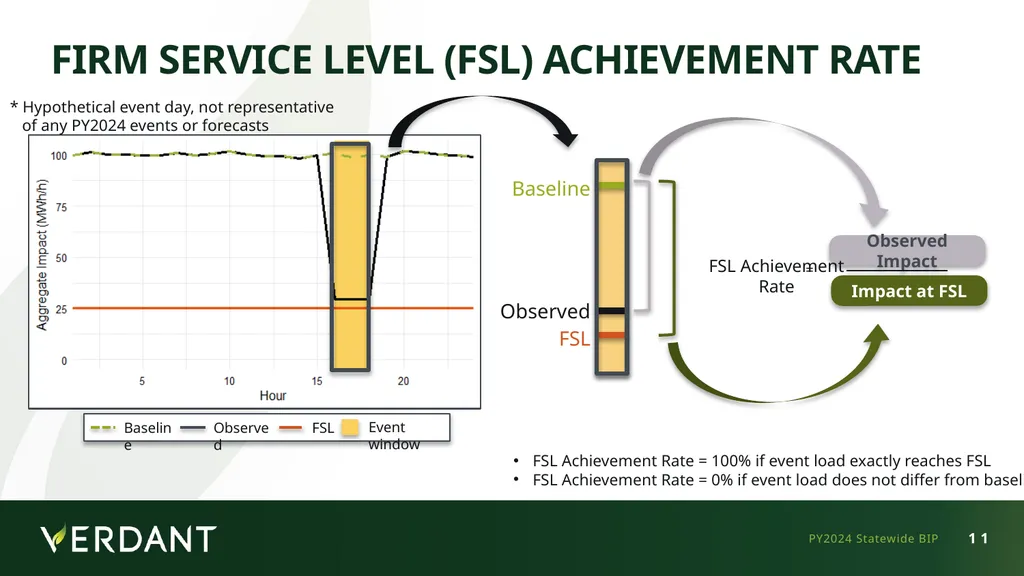
Observed Impact Firm Service Level (FSL) Achievement Rate PY2024 Statewide BIP Baseline Observed FSL FSL Achievement
Rate = Impact at FSL * Hypothetical event day, not representative
of any PY2024 events or forecasts Baseline Observed FSL Event window FSL Achievement Rate = 100% if event load exactly reaches FSL
FSL Achievement Rate = 0% if event load does not differ from baseline<br>
Rate = Impact at FSL * Hypothetical event day, not representative
of any PY2024 events or forecasts Baseline Observed FSL Event window FSL Achievement Rate = 100% if event load exactly reaches FSL
FSL Achievement Rate = 0% if event load does not differ from baseline<br>
12
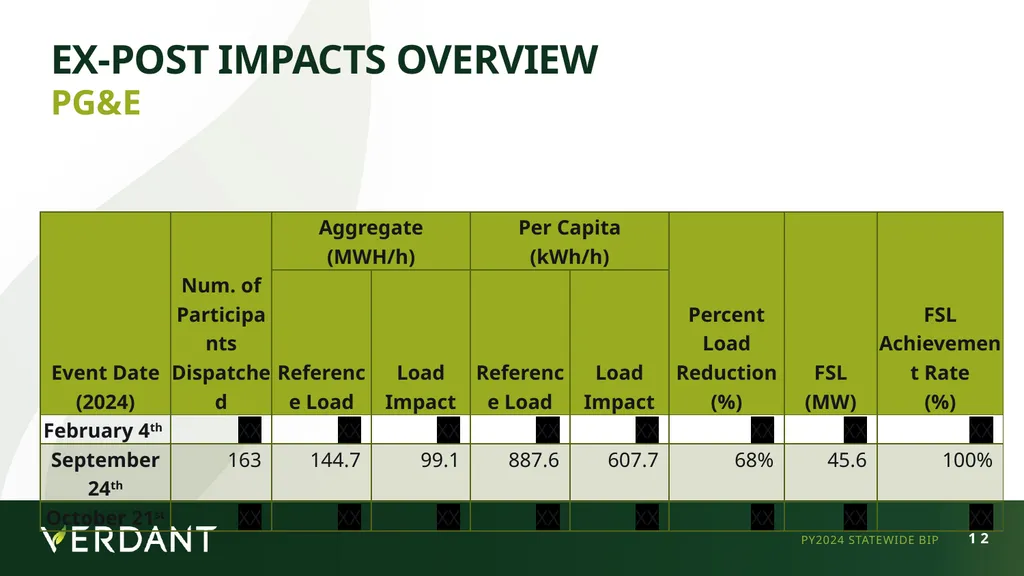
Ex-Post impacts Overview PY2024 STATEWIDE BIP PG&E<br>
13
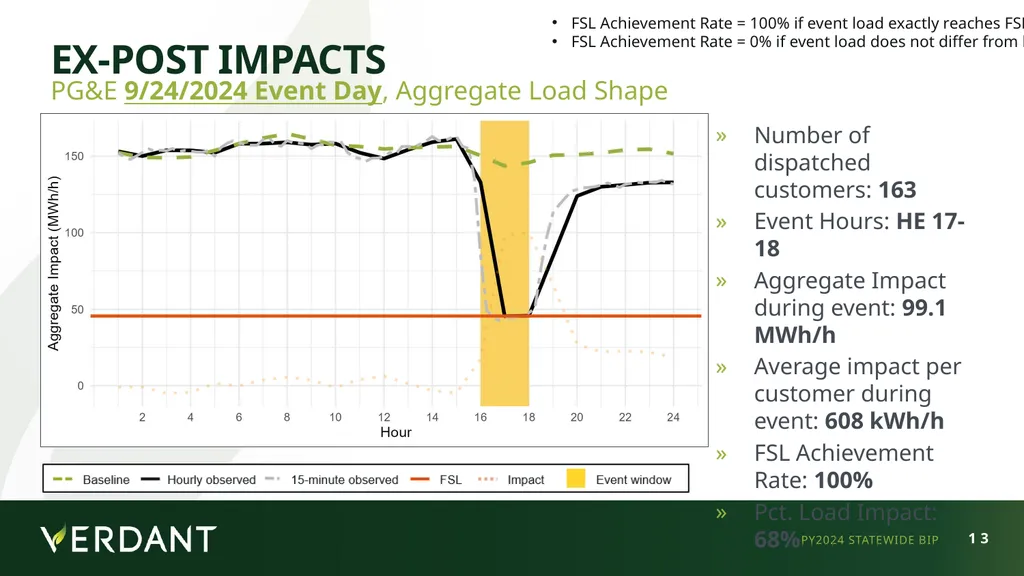
Ex-Post impacts PY2024 STATEWIDE BIP Number of dispatched customers: 163
Event Hours: HE 17-18
Aggregate Impact during event: 99.1 MWh/h
Average impact per customer during event: 608 kWh/h
FSL Achievement Rate: 100%
Pct. Load Impact: 68% PG&E 9/24/2024 Event Day, Aggregate Load Shape FSL Achievement Rate = 100% if event load exactly reaches FSL
FSL Achievement Rate = 0% if event load does not differ from baseline<br>
Event Hours: HE 17-18
Aggregate Impact during event: 99.1 MWh/h
Average impact per customer during event: 608 kWh/h
FSL Achievement Rate: 100%
Pct. Load Impact: 68% PG&E 9/24/2024 Event Day, Aggregate Load Shape FSL Achievement Rate = 100% if event load exactly reaches FSL
FSL Achievement Rate = 0% if event load does not differ from baseline<br>
14
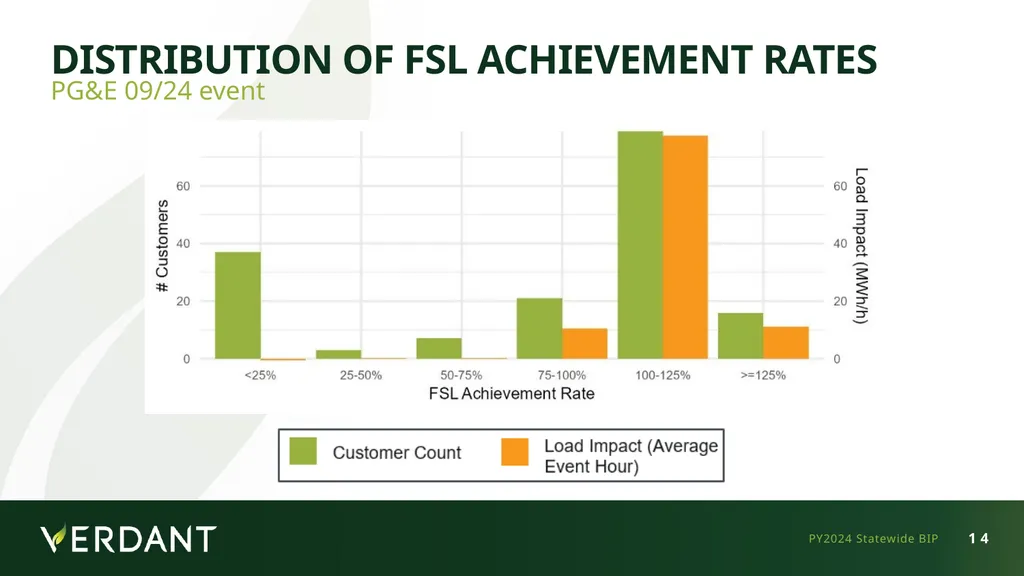
Distribution of FSL achievement rates PG&E 09/24 event PY2024 Statewide BIP<br>
15
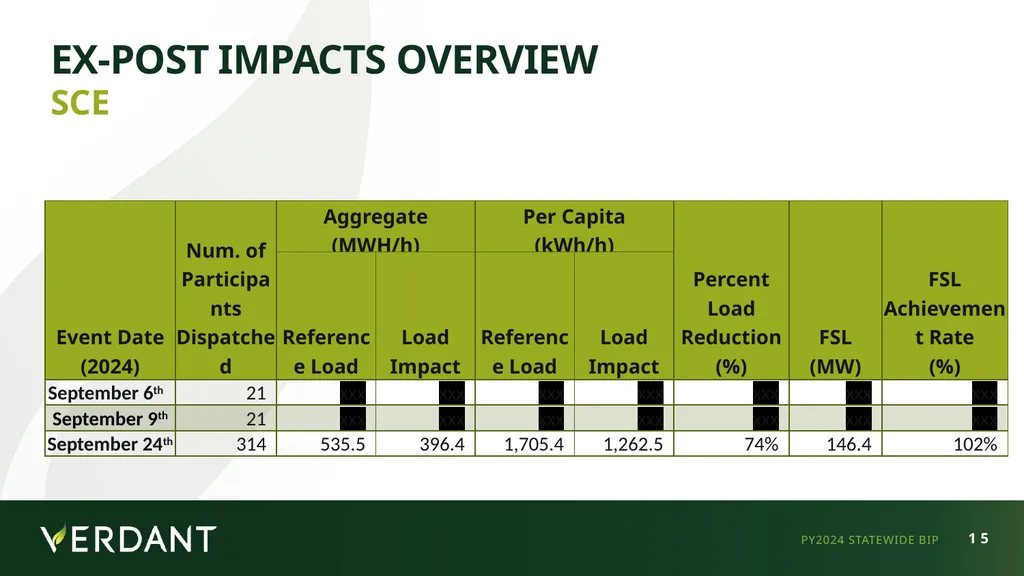
Ex-Post impacts Overview PY2024 STATEWIDE BIP SCE<br>
16
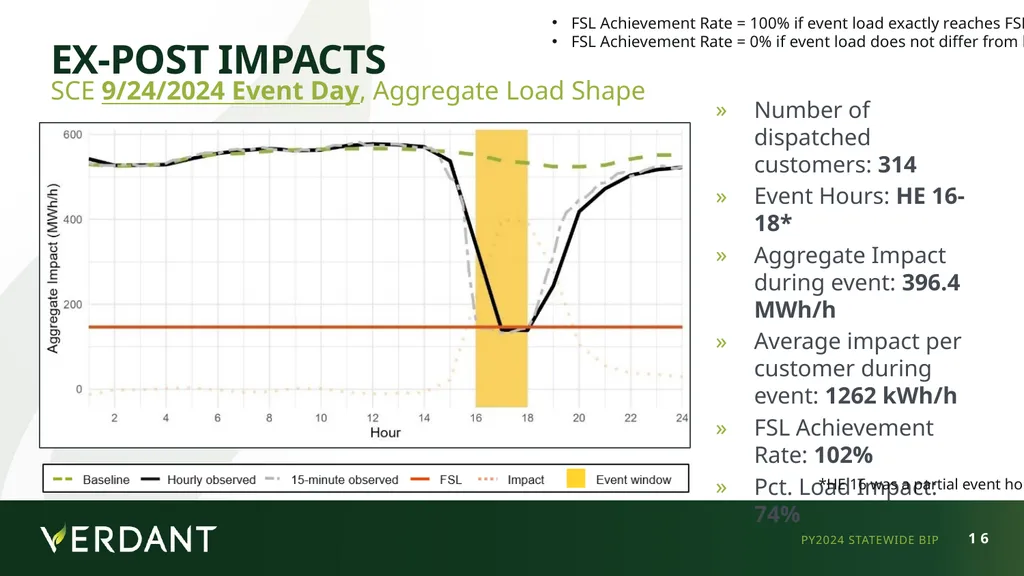
Ex-Post impacts PY2024 STATEWIDE BIP SCE 9/24/2024 Event Day, Aggregate Load Shape Number of dispatched customers: 314
Event Hours: HE 16-18*
Aggregate Impact during event: 396.4 MWh/h
Average impact per customer during event: 1262 kWh/h
FSL Achievement Rate: 102%
Pct. Load Impact: 74% *HE 16 was a partial event hour FSL Achievement Rate = 100% if event load exactly reaches FSL
FSL Achievement Rate = 0% if event load does not differ from baseline<br>
Event Hours: HE 16-18*
Aggregate Impact during event: 396.4 MWh/h
Average impact per customer during event: 1262 kWh/h
FSL Achievement Rate: 102%
Pct. Load Impact: 74% *HE 16 was a partial event hour FSL Achievement Rate = 100% if event load exactly reaches FSL
FSL Achievement Rate = 0% if event load does not differ from baseline<br>
17
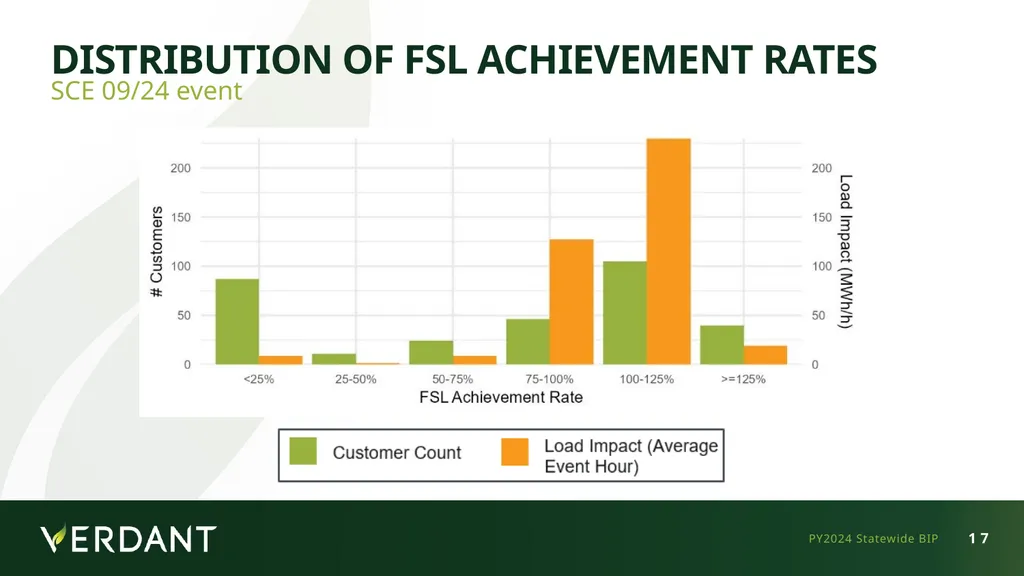
Distribution of FSL achievement rates SCE 09/24 event PY2024 Statewide BIP<br>
18
PY2024 Ex-Ante Analysis PY2024 STATEWIDE BIP<br>
19
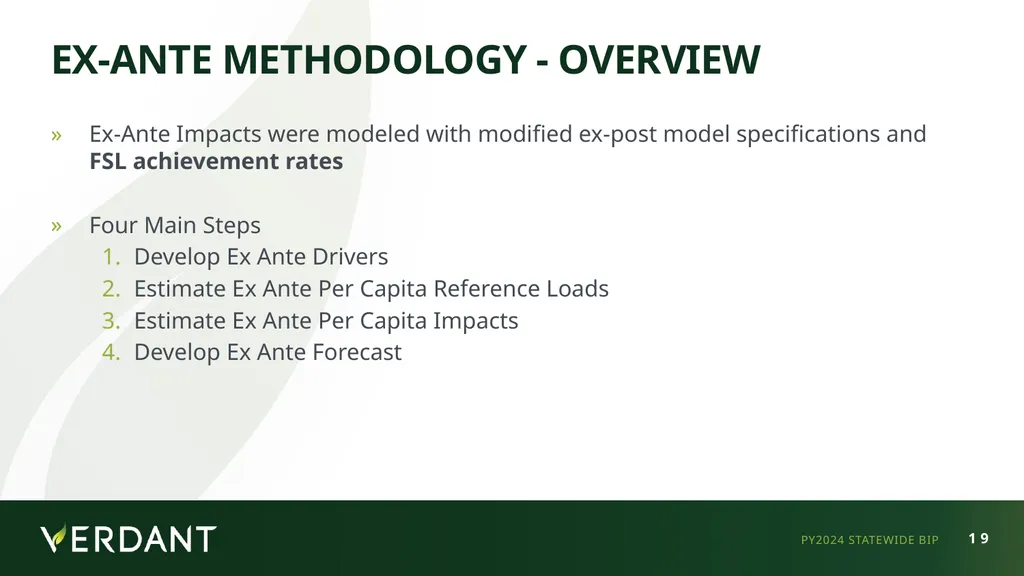
Ex-Ante Methodology - Overview Ex-Ante Impacts were modeled with modified ex-post model specifications and FSL achievement rates
Four Main Steps
Develop Ex Ante Drivers
Estimate Ex Ante Per Capita Reference Loads
Estimate Ex Ante Per Capita Impacts
Develop Ex Ante Forecast PY2024 STATEWIDE BIP<br>
Four Main Steps
Develop Ex Ante Drivers
Estimate Ex Ante Per Capita Reference Loads
Estimate Ex Ante Per Capita Impacts
Develop Ex Ante Forecast PY2024 STATEWIDE BIP<br>
20
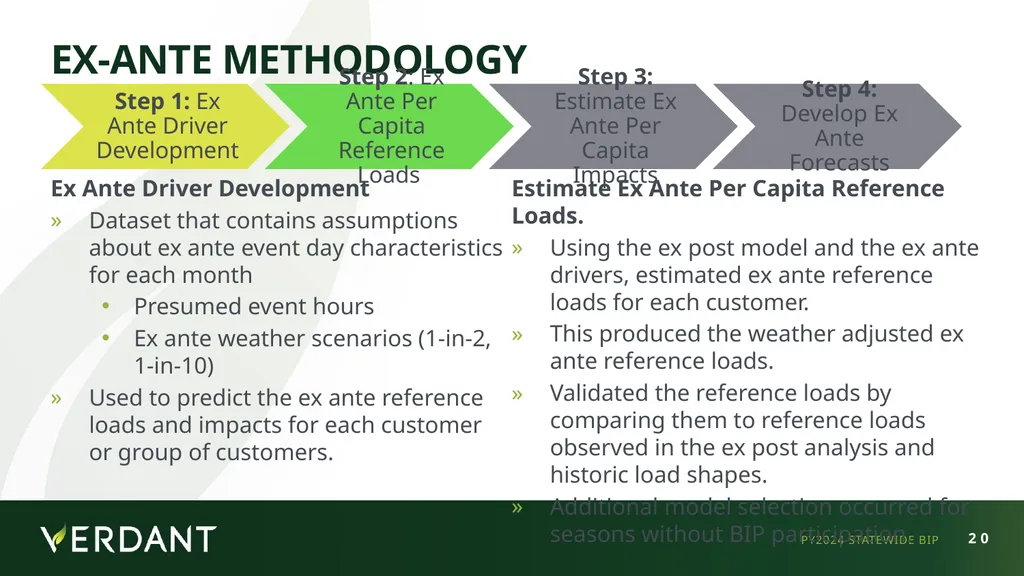
Ex-Ante Methodology PY2024 STATEWIDE BIP Ex Ante Driver Development
Dataset that contains assumptions about ex ante event day characteristics for each month
Presumed event hours
Ex ante weather scenarios (1-in-2, 1-in-10)
Used to predict the ex ante reference loads and impacts for each customer or group of customers. Estimate Ex Ante Per Capita Reference Loads.
Using the ex post model and the ex ante drivers, estimated ex ante reference loads for each customer.
This produced the weather adjusted ex ante reference loads.
Validated the reference loads by comparing them to reference loads observed in the ex post analysis and historic load shapes.
Additional model selection occurred for seasons without BIP participation.<br>
Dataset that contains assumptions about ex ante event day characteristics for each month
Presumed event hours
Ex ante weather scenarios (1-in-2, 1-in-10)
Used to predict the ex ante reference loads and impacts for each customer or group of customers. Estimate Ex Ante Per Capita Reference Loads.
Using the ex post model and the ex ante drivers, estimated ex ante reference loads for each customer.
This produced the weather adjusted ex ante reference loads.
Validated the reference loads by comparing them to reference loads observed in the ex post analysis and historic load shapes.
Additional model selection occurred for seasons without BIP participation.<br>
21
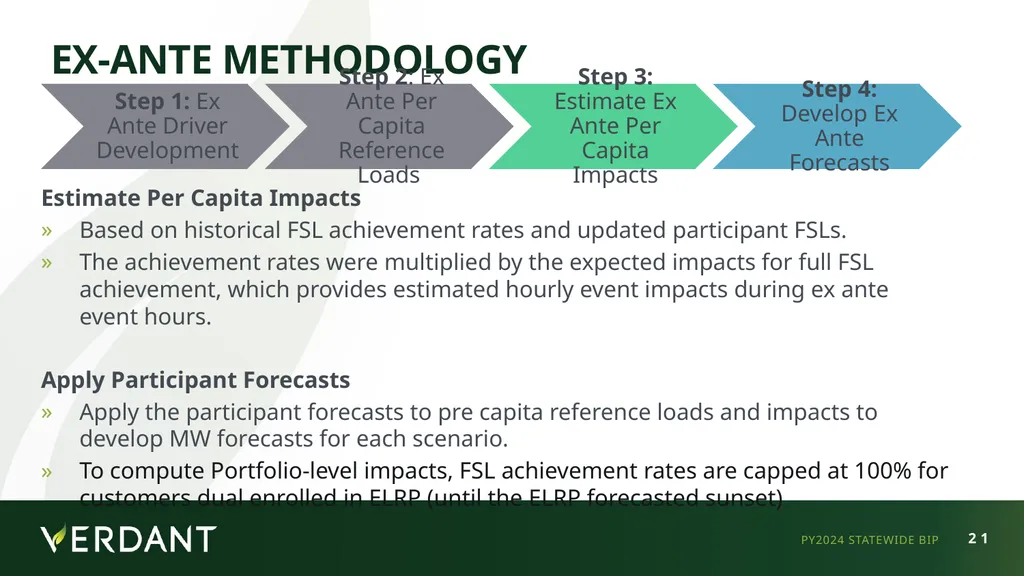
Ex-Ante Methodology Estimate Per Capita Impacts
Based on historical FSL achievement rates and updated participant FSLs.
The achievement rates were multiplied by the expected impacts for full FSL achievement, which provides estimated hourly event impacts during ex ante event hours.
Apply Participant Forecasts
Apply the participant forecasts to pre capita reference loads and impacts to develop MW forecasts for each scenario.
To compute Portfolio-level impacts, FSL achievement rates are capped at 100% for customers dual enrolled in ELRP (until the ELRP forecasted sunset) PY2024 STATEWIDE BIP<br>
Based on historical FSL achievement rates and updated participant FSLs.
The achievement rates were multiplied by the expected impacts for full FSL achievement, which provides estimated hourly event impacts during ex ante event hours.
Apply Participant Forecasts
Apply the participant forecasts to pre capita reference loads and impacts to develop MW forecasts for each scenario.
To compute Portfolio-level impacts, FSL achievement rates are capped at 100% for customers dual enrolled in ELRP (until the ELRP forecasted sunset) PY2024 STATEWIDE BIP<br>
22
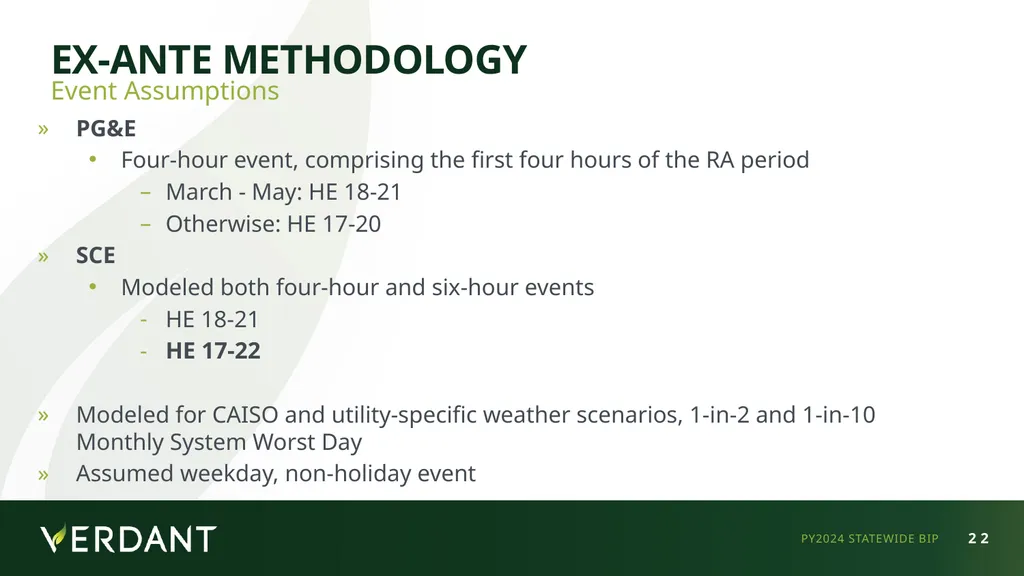
Ex-Ante Methodology Event Assumptions PG&E
Four-hour event, comprising the first four hours of the RA period
March - May: HE 18-21
Otherwise: HE 17-20
SCE
Modeled both four-hour and six-hour events
HE 18-21
HE 17-22
Modeled for CAISO and utility-specific weather scenarios, 1-in-2 and 1-in-10 Monthly System Worst Day
Assumed weekday, non-holiday event PY2024 STATEWIDE BIP<br>
Four-hour event, comprising the first four hours of the RA period
March - May: HE 18-21
Otherwise: HE 17-20
SCE
Modeled both four-hour and six-hour events
HE 18-21
HE 17-22
Modeled for CAISO and utility-specific weather scenarios, 1-in-2 and 1-in-10 Monthly System Worst Day
Assumed weekday, non-holiday event PY2024 STATEWIDE BIP<br>
23
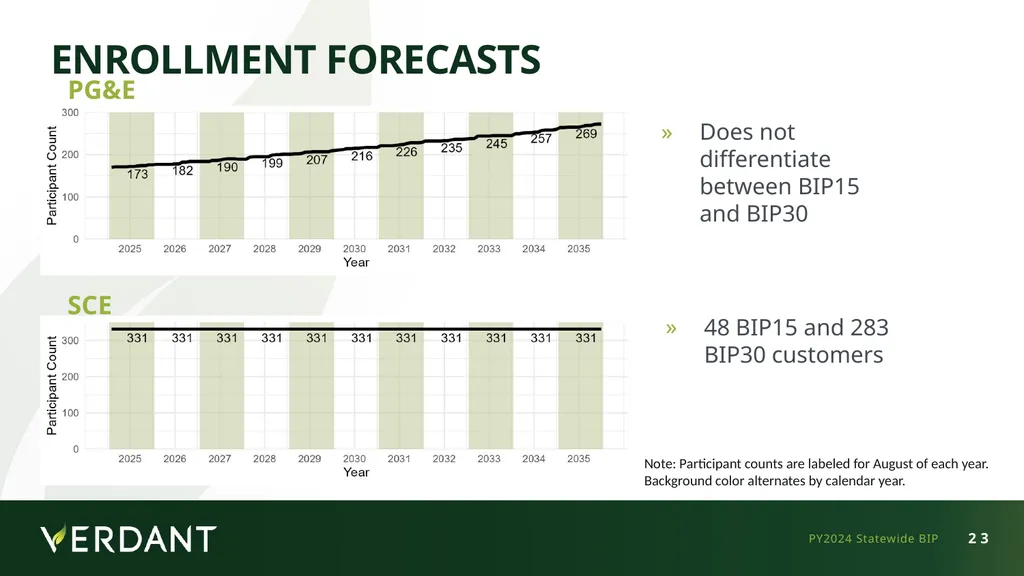
Enrollment Forecasts PG&E Does not differentiate between BIP15 and BIP30 PY2024 Statewide BIP Note: Participant counts are labeled for August of each year. Background color alternates by calendar year. SCE 48 BIP15 and 283 BIP30 customers<br>
24
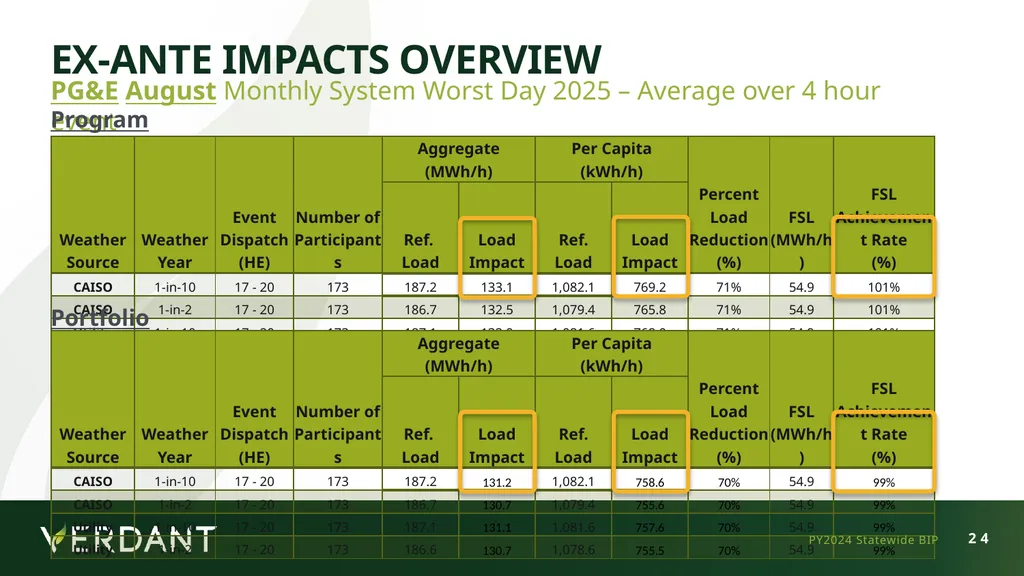
Ex-Ante Impacts Overview PG&E August Monthly System Worst Day 2025 – Average over 4 hour event Program Portfolio PY2024 Statewide BIP<br>
25
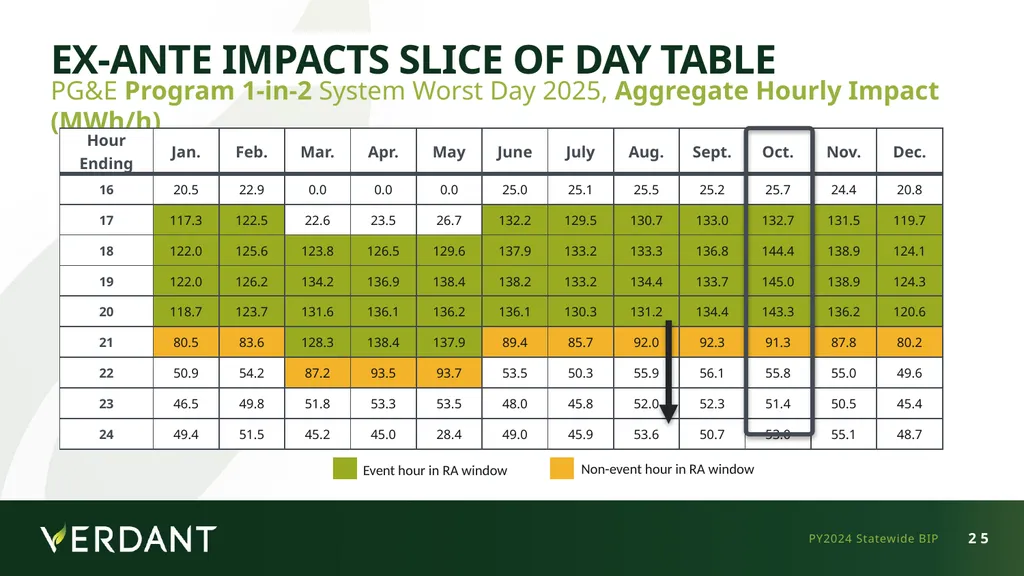
Ex-Ante Impacts Slice of Day Table PG&E Program 1-in-2 System Worst Day 2025, Aggregate Hourly Impact (MWh/h) PY2024 Statewide BIP Event hour in RA window Non-event hour in RA window<br>
26
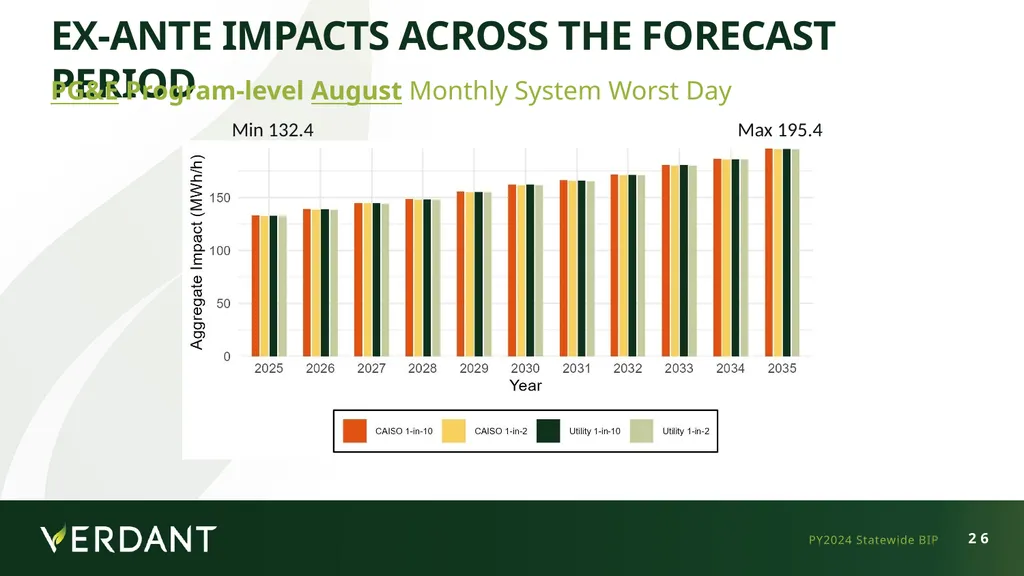
Ex-Ante Impacts Across the Forecast period PG&E Program-level August Monthly System Worst Day Max 195.4 PY2024 Statewide BIP Min 132.4<br>
27
Ex-Ante Load Shape PG&E Program-level August Monthly System Worst Day, 2025 PY2024 Statewide BIP<br>
28
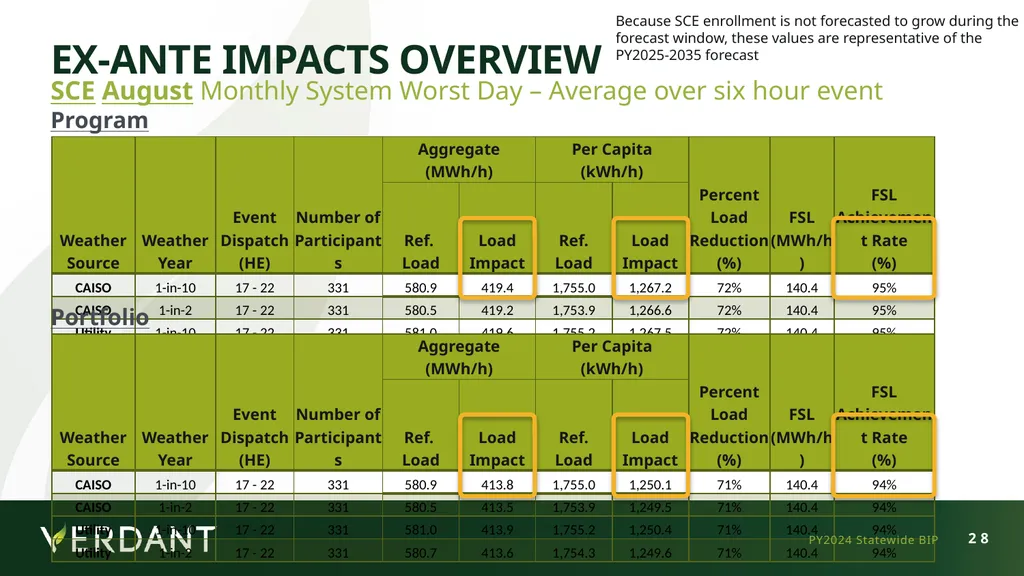
Ex-Ante Impacts Overview SCE August Monthly System Worst Day – Average over six hour event Program Because SCE enrollment is not forecasted to grow during the forecast window, these values are representative of the PY2025-2035 forecast Portfolio PY2024 Statewide BIP<br>
29
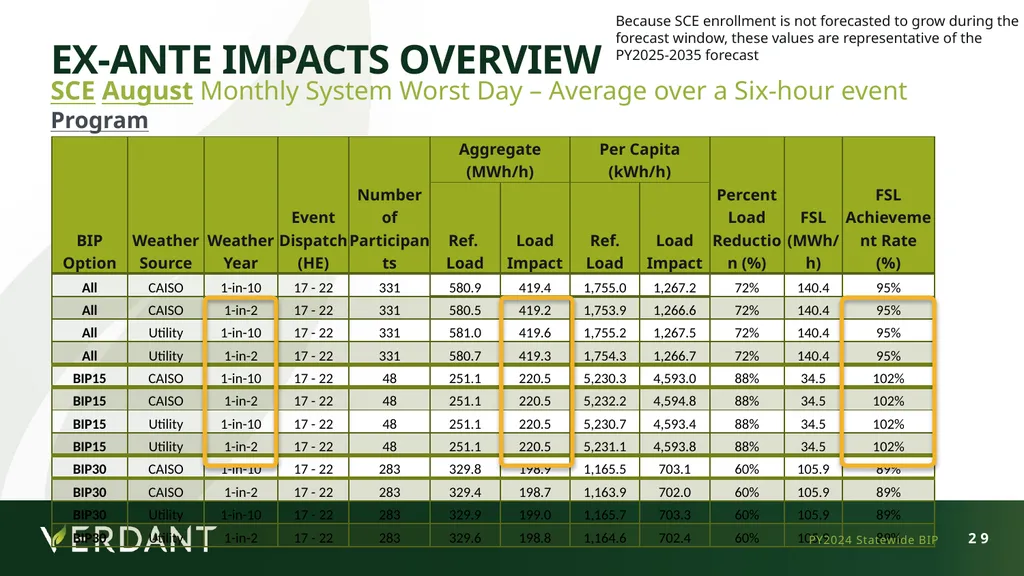
Ex-Ante Impacts Overview SCE August Monthly System Worst Day – Average over a Six-hour event Program Because SCE enrollment is not forecasted to grow during the forecast window, these values are representative of the PY2025-2035 forecast PY2024 Statewide BIP<br>
30
Ex-Ante Impacts Overview SCE August Monthly System Worst Day – Average over six hour event Portfolio Because SCE enrollment is not forecasted to grow during the forecast window, these values are representative of the PY2025-2035 forecast PY2024 Statewide BIP<br>
31
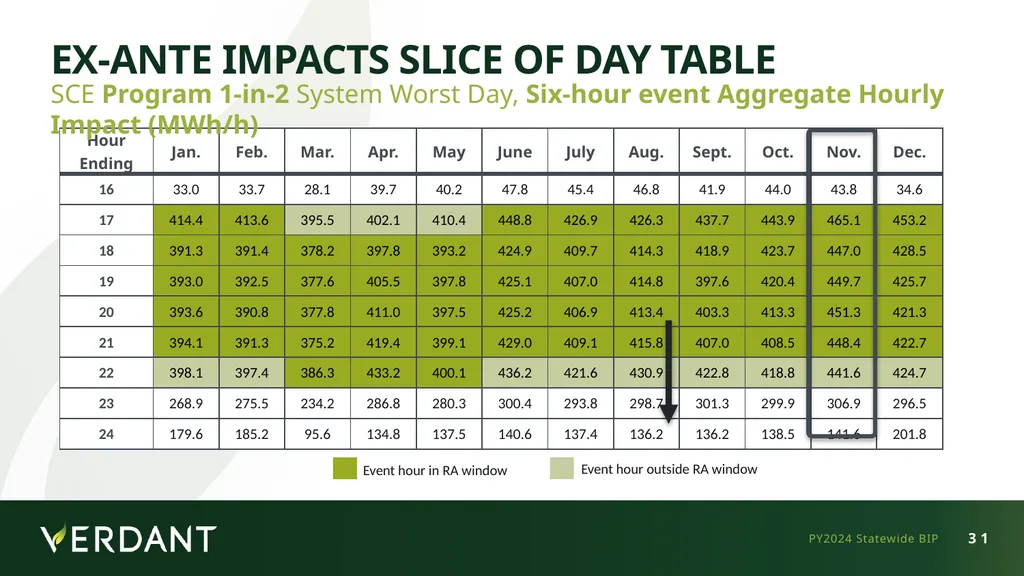
Ex-Ante Impacts Slice of Day Table PY2024 Statewide BIP Event hour in RA window Event hour outside RA window SCE Program 1-in-2 System Worst Day, Six-hour event Aggregate Hourly Impact (MWh/h)<br>
32
Ex-Ante Load Shape SCE Program-level August Monthly System Worst Day, 2025 PY2024 Statewide BIP<br>
33
Comparison of PY2024 and PY2023 results PY2024 STATEWIDE BIP<br>
34
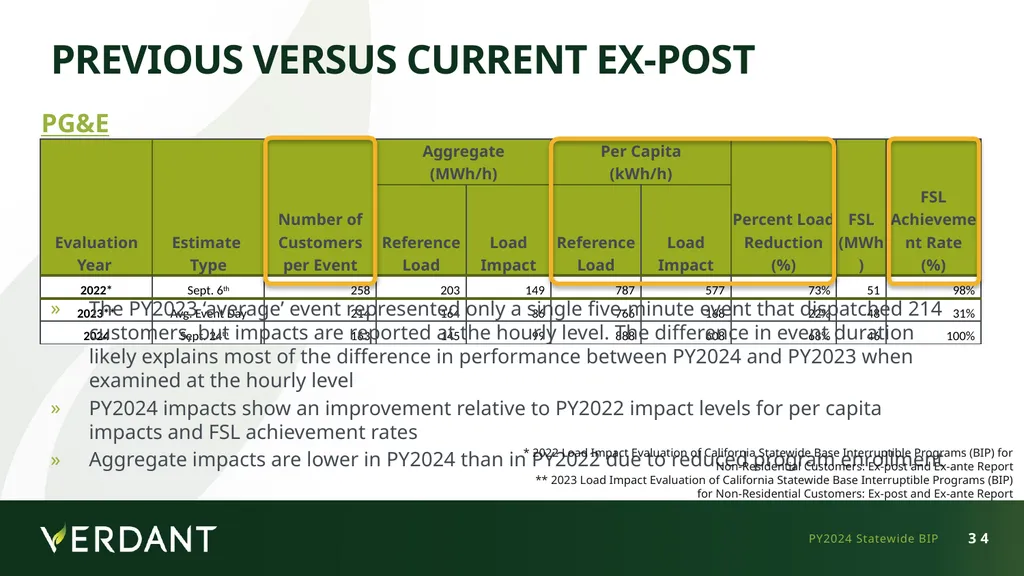
Previous Versus Current Ex-Post PY2024 Statewide BIP The PY2023 ‘average’ event represented only a single five-minute event that dispatched 214 customers, but impacts are reported at the hourly level. The difference in event duration likely explains most of the difference in performance between PY2024 and PY2023 when examined at the hourly level
PY2024 impacts show an improvement relative to PY2022 impact levels for per capita impacts and FSL achievement rates
Aggregate impacts are lower in PY2024 than in PY2022 due to reduced program enrollment PG&E * 2022 Load Impact Evaluation of California Statewide Base Interruptible Programs (BIP) for Non-Residential Customers: Ex-post and Ex-ante Report
** 2023 Load Impact Evaluation of California Statewide Base Interruptible Programs (BIP) for Non-Residential Customers: Ex-post and Ex-ante Report<br>
PY2024 impacts show an improvement relative to PY2022 impact levels for per capita impacts and FSL achievement rates
Aggregate impacts are lower in PY2024 than in PY2022 due to reduced program enrollment PG&E * 2022 Load Impact Evaluation of California Statewide Base Interruptible Programs (BIP) for Non-Residential Customers: Ex-post and Ex-ante Report
** 2023 Load Impact Evaluation of California Statewide Base Interruptible Programs (BIP) for Non-Residential Customers: Ex-post and Ex-ante Report<br>
35
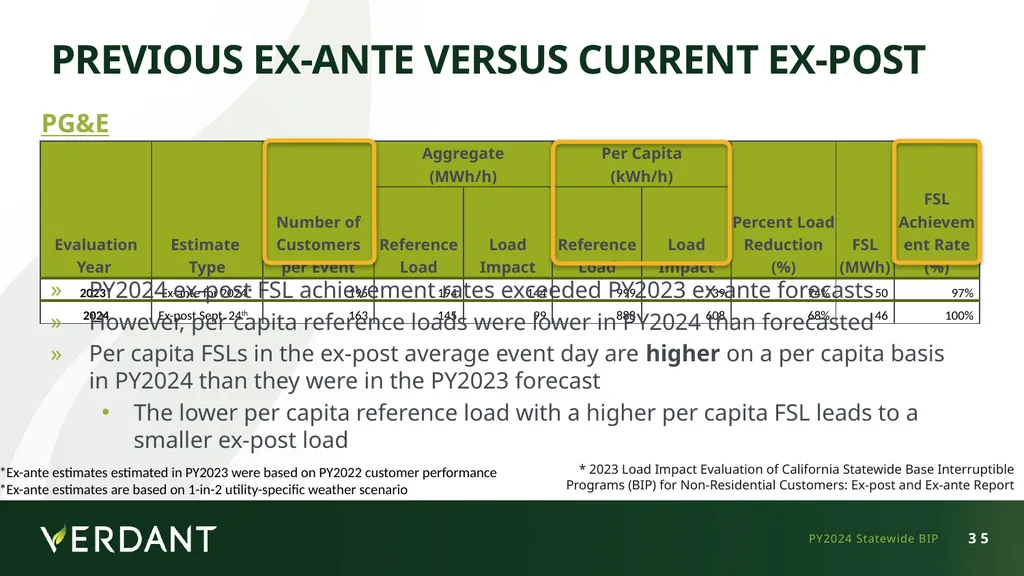
Previous Ex-Ante Versus Current Ex-Post PG&E PY2024 Statewide BIP PY2024 ex-post FSL achievement rates exceeded PY2023 ex-ante forecasts
However, per capita reference loads were lower in PY2024 than forecasted
Per capita FSLs in the ex-post average event day are higher on a per capita basis in PY2024 than they were in the PY2023 forecast
The lower per capita reference load with a higher per capita FSL leads to a smaller ex-post load *Ex-ante estimates estimated in PY2023 were based on PY2022 customer performance
*Ex-ante estimates are based on 1-in-2 utility-specific weather scenario * 2023 Load Impact Evaluation of California Statewide Base Interruptible Programs (BIP) for Non-Residential Customers: Ex-post and Ex-ante Report<br>
However, per capita reference loads were lower in PY2024 than forecasted
Per capita FSLs in the ex-post average event day are higher on a per capita basis in PY2024 than they were in the PY2023 forecast
The lower per capita reference load with a higher per capita FSL leads to a smaller ex-post load *Ex-ante estimates estimated in PY2023 were based on PY2022 customer performance
*Ex-ante estimates are based on 1-in-2 utility-specific weather scenario * 2023 Load Impact Evaluation of California Statewide Base Interruptible Programs (BIP) for Non-Residential Customers: Ex-post and Ex-ante Report<br>
36
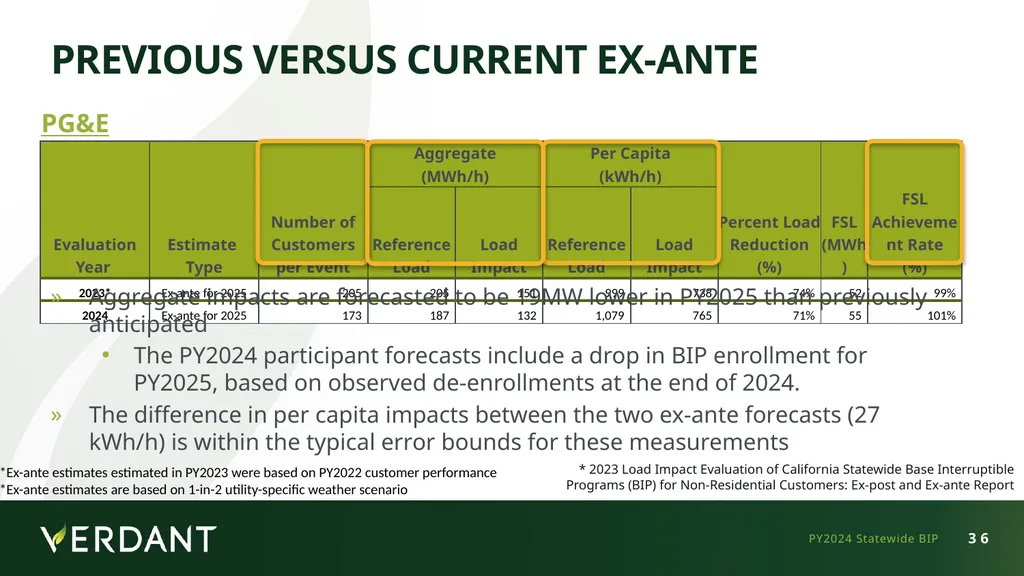
Previous Versus Current Ex-Ante PG&E PY2024 Statewide BIP Aggregate impacts are forecasted to be 19MW lower in PY2025 than previously anticipated
The PY2024 participant forecasts include a drop in BIP enrollment for PY2025, based on observed de-enrollments at the end of 2024.
The difference in per capita impacts between the two ex-ante forecasts (27 kWh/h) is within the typical error bounds for these measurements *Ex-ante estimates estimated in PY2023 were based on PY2022 customer performance
*Ex-ante estimates are based on 1-in-2 utility-specific weather scenario * 2023 Load Impact Evaluation of California Statewide Base Interruptible Programs (BIP) for Non-Residential Customers: Ex-post and Ex-ante Report<br>
The PY2024 participant forecasts include a drop in BIP enrollment for PY2025, based on observed de-enrollments at the end of 2024.
The difference in per capita impacts between the two ex-ante forecasts (27 kWh/h) is within the typical error bounds for these measurements *Ex-ante estimates estimated in PY2023 were based on PY2022 customer performance
*Ex-ante estimates are based on 1-in-2 utility-specific weather scenario * 2023 Load Impact Evaluation of California Statewide Base Interruptible Programs (BIP) for Non-Residential Customers: Ex-post and Ex-ante Report<br>
37
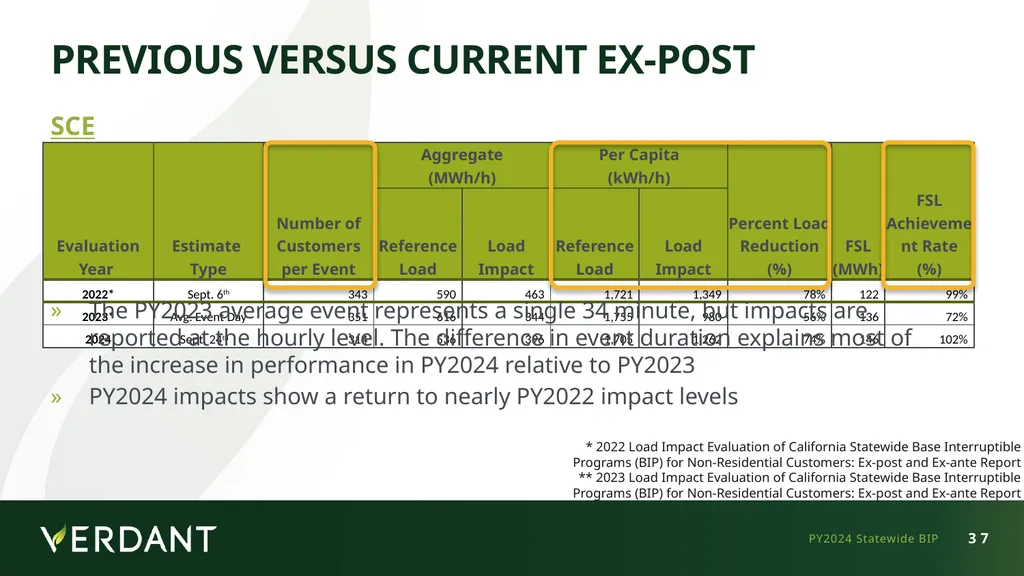
Previous Versus Current Ex-Post PY2024 Statewide BIP SCE The PY2023 average event represents a single 34 minute, but impacts are reported at the hourly level. The difference in event duration explains most of the increase in performance in PY2024 relative to PY2023
PY2024 impacts show a return to nearly PY2022 impact levels * 2022 Load Impact Evaluation of California Statewide Base Interruptible Programs (BIP) for Non-Residential Customers: Ex-post and Ex-ante Report
** 2023 Load Impact Evaluation of California Statewide Base Interruptible Programs (BIP) for Non-Residential Customers: Ex-post and Ex-ante Report<br>
PY2024 impacts show a return to nearly PY2022 impact levels * 2022 Load Impact Evaluation of California Statewide Base Interruptible Programs (BIP) for Non-Residential Customers: Ex-post and Ex-ante Report
** 2023 Load Impact Evaluation of California Statewide Base Interruptible Programs (BIP) for Non-Residential Customers: Ex-post and Ex-ante Report<br>
38
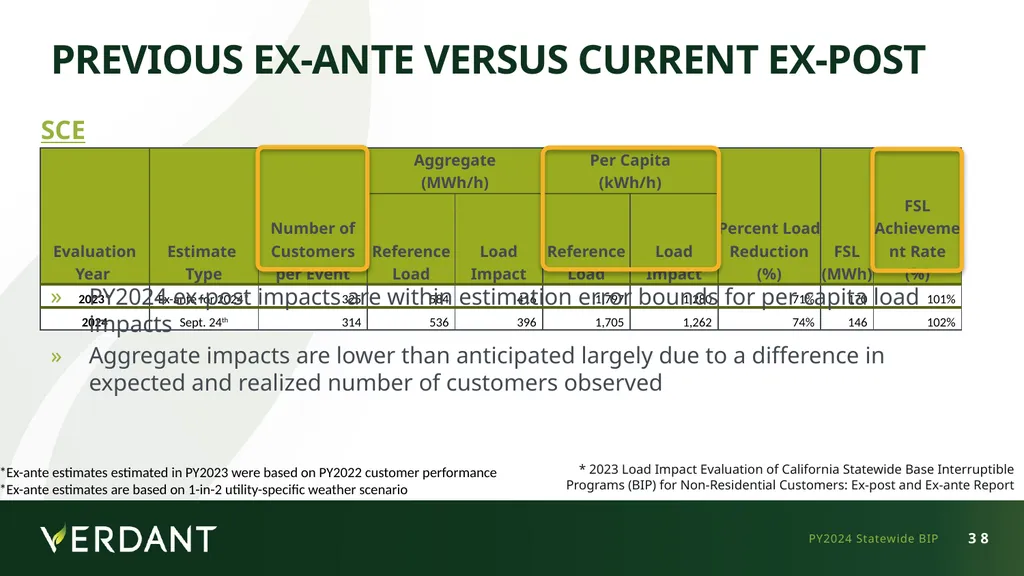
Previous Ex-Ante Versus Current Ex-Post PY2024 Statewide BIP SCE PY2024 ex-post impacts are within estimation error bounds for per capita load impacts
Aggregate impacts are lower than anticipated largely due to a difference in expected and realized number of customers observed *Ex-ante estimates estimated in PY2023 were based on PY2022 customer performance
*Ex-ante estimates are based on 1-in-2 utility-specific weather scenario * 2023 Load Impact Evaluation of California Statewide Base Interruptible Programs (BIP) for Non-Residential Customers: Ex-post and Ex-ante Report<br>
Aggregate impacts are lower than anticipated largely due to a difference in expected and realized number of customers observed *Ex-ante estimates estimated in PY2023 were based on PY2022 customer performance
*Ex-ante estimates are based on 1-in-2 utility-specific weather scenario * 2023 Load Impact Evaluation of California Statewide Base Interruptible Programs (BIP) for Non-Residential Customers: Ex-post and Ex-ante Report<br>
39
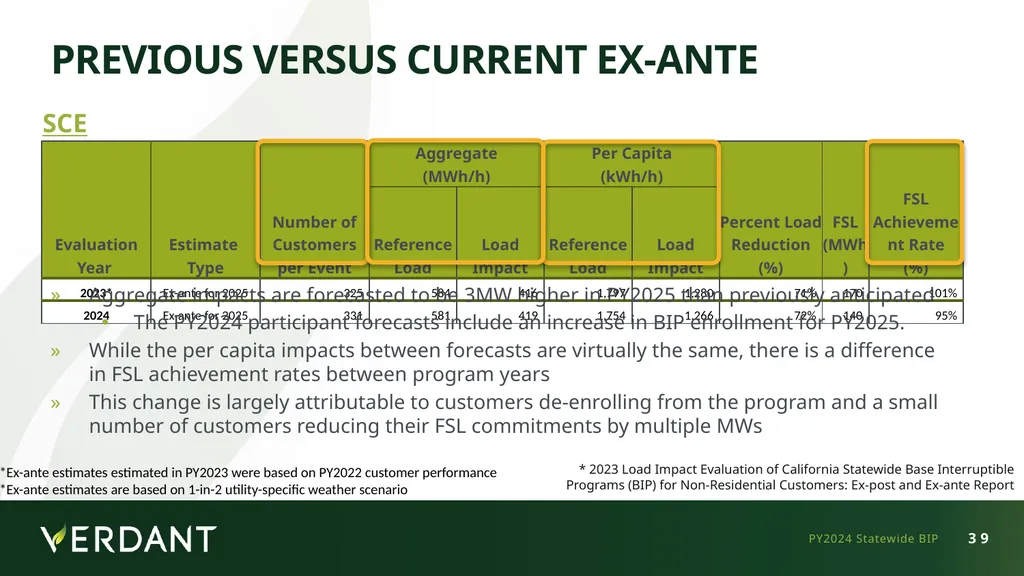
Previous Versus Current Ex-Ante PY2024 Statewide BIP SCE Aggregate impacts are forecasted to be 3MW higher in PY2025 than previously anticipated
The PY2024 participant forecasts include an increase in BIP enrollment for PY2025.
While the per capita impacts between forecasts are virtually the same, there is a difference in FSL achievement rates between program years
This change is largely attributable to customers de-enrolling from the program and a small number of customers reducing their FSL commitments by multiple MWs *Ex-ante estimates estimated in PY2023 were based on PY2022 customer performance
*Ex-ante estimates are based on 1-in-2 utility-specific weather scenario * 2023 Load Impact Evaluation of California Statewide Base Interruptible Programs (BIP) for Non-Residential Customers: Ex-post and Ex-ante Report<br>
The PY2024 participant forecasts include an increase in BIP enrollment for PY2025.
While the per capita impacts between forecasts are virtually the same, there is a difference in FSL achievement rates between program years
This change is largely attributable to customers de-enrolling from the program and a small number of customers reducing their FSL commitments by multiple MWs *Ex-ante estimates estimated in PY2023 were based on PY2022 customer performance
*Ex-ante estimates are based on 1-in-2 utility-specific weather scenario * 2023 Load Impact Evaluation of California Statewide Base Interruptible Programs (BIP) for Non-Residential Customers: Ex-post and Ex-ante Report<br>
40
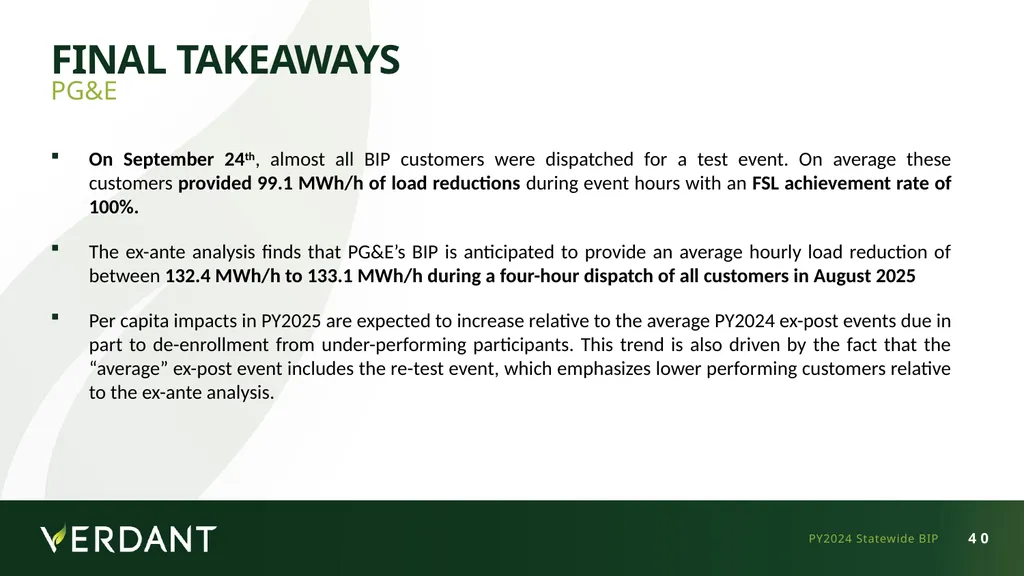
Final Takeaways PG&E On September 24th, almost all BIP customers were dispatched for a test event. On average these customers provided 99.1 MWh/h of load reductions during event hours with an FSL achievement rate of 100%.
The ex-ante analysis finds that PG&E’s BIP is anticipated to provide an average hourly load reduction of between 132.4 MWh/h to 133.1 MWh/h during a four-hour dispatch of all customers in August 2025
Per capita impacts in PY2025 are expected to increase relative to the average PY2024 ex-post events due in part to de-enrollment from under-performing participants. This trend is also driven by the fact that the “average” ex-post event includes the re-test event, which emphasizes lower performing customers relative to the ex-ante analysis. PY2024 Statewide BIP<br>
The ex-ante analysis finds that PG&E’s BIP is anticipated to provide an average hourly load reduction of between 132.4 MWh/h to 133.1 MWh/h during a four-hour dispatch of all customers in August 2025
Per capita impacts in PY2025 are expected to increase relative to the average PY2024 ex-post events due in part to de-enrollment from under-performing participants. This trend is also driven by the fact that the “average” ex-post event includes the re-test event, which emphasizes lower performing customers relative to the ex-ante analysis. PY2024 Statewide BIP<br>
41
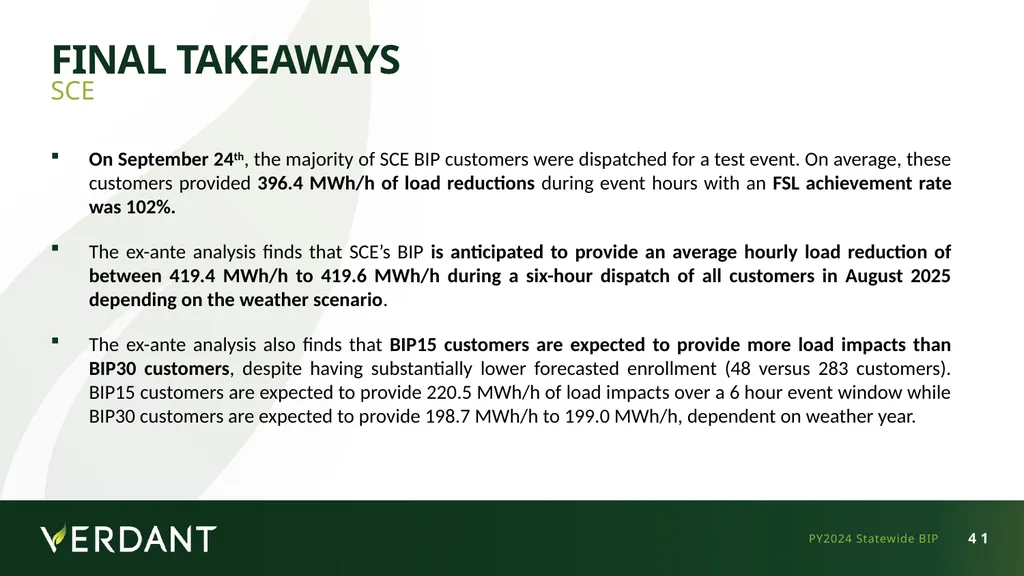
Final Takeaways SCE On September 24th, the majority of SCE BIP customers were dispatched for a test event. On average, these customers provided 396.4 MWh/h of load reductions during event hours with an FSL achievement rate was 102%.
The ex-ante analysis finds that SCE’s BIP is anticipated to provide an average hourly load reduction of between 419.4 MWh/h to 419.6 MWh/h during a six-hour dispatch of all customers in August 2025 depending on the weather scenario.
The ex-ante analysis also finds that BIP15 customers are expected to provide more load impacts than BIP30 customers, despite having substantially lower forecasted enrollment (48 versus 283 customers). BIP15 customers are expected to provide 220.5 MWh/h of load impacts over a 6 hour event window while BIP30 customers are expected to provide 198.7 MWh/h to 199.0 MWh/h, dependent on weather year. PY2024 Statewide BIP<br>
The ex-ante analysis finds that SCE’s BIP is anticipated to provide an average hourly load reduction of between 419.4 MWh/h to 419.6 MWh/h during a six-hour dispatch of all customers in August 2025 depending on the weather scenario.
The ex-ante analysis also finds that BIP15 customers are expected to provide more load impacts than BIP30 customers, despite having substantially lower forecasted enrollment (48 versus 283 customers). BIP15 customers are expected to provide 220.5 MWh/h of load impacts over a 6 hour event window while BIP30 customers are expected to provide 198.7 MWh/h to 199.0 MWh/h, dependent on weather year. PY2024 Statewide BIP<br>