
Lecture 1: Networks: A brief introduction Sudipta
CS
Published · 46 slides · 0 views

1 / 1



Description
Lecture 1: Networks: A brief introduction Sudipta Sarangi Virginia Tech Networks Network: Defines the interaction structure between agents through the set of ties between them. Agents: individuals, organizations, countries, represented as
Related Topics
Share
Embed code
Download this presentation From Below
"Lecture 1: Networks: A brief introduction Sudipta" is the property of its rightful owner. Permission is granted to download and print the materials on this website for personal, non-commercial use only, and to display it on your personal computer provided you do not modify the materials and that you retain all copyright notices contained in the materials. By downloading content from our website, you accept the terms of this agreement.
Presentation Transcript
01
Lecture 1:
Networks: A brief introduction Sudipta Sarangi
Virginia Tech<br>
Virginia Tech<br>
02
Networks Network: Defines the interaction structure between agents through the set of ties between them.
Agents: individuals, organizations, countries, represented as nodes (vertices)
Ties: relationships between actors, represented as links (edges)
A very useful visualization tool<br>
Agents: individuals, organizations, countries, represented as nodes (vertices)
Ties: relationships between actors, represented as links (edges)
A very useful visualization tool<br>
03
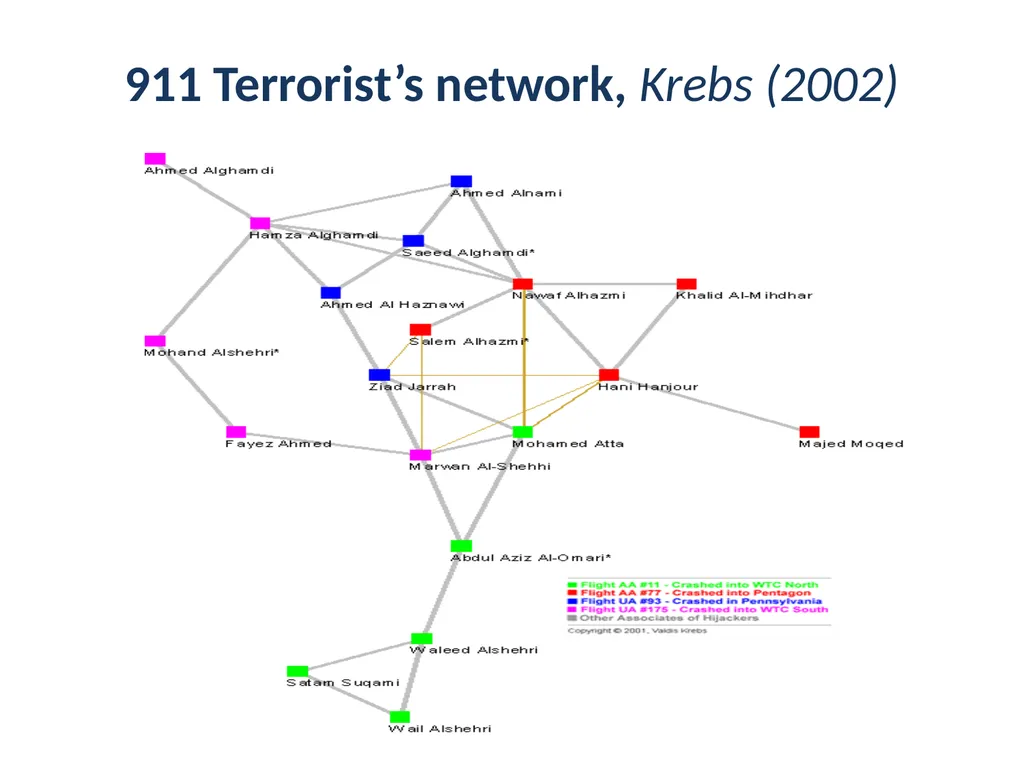
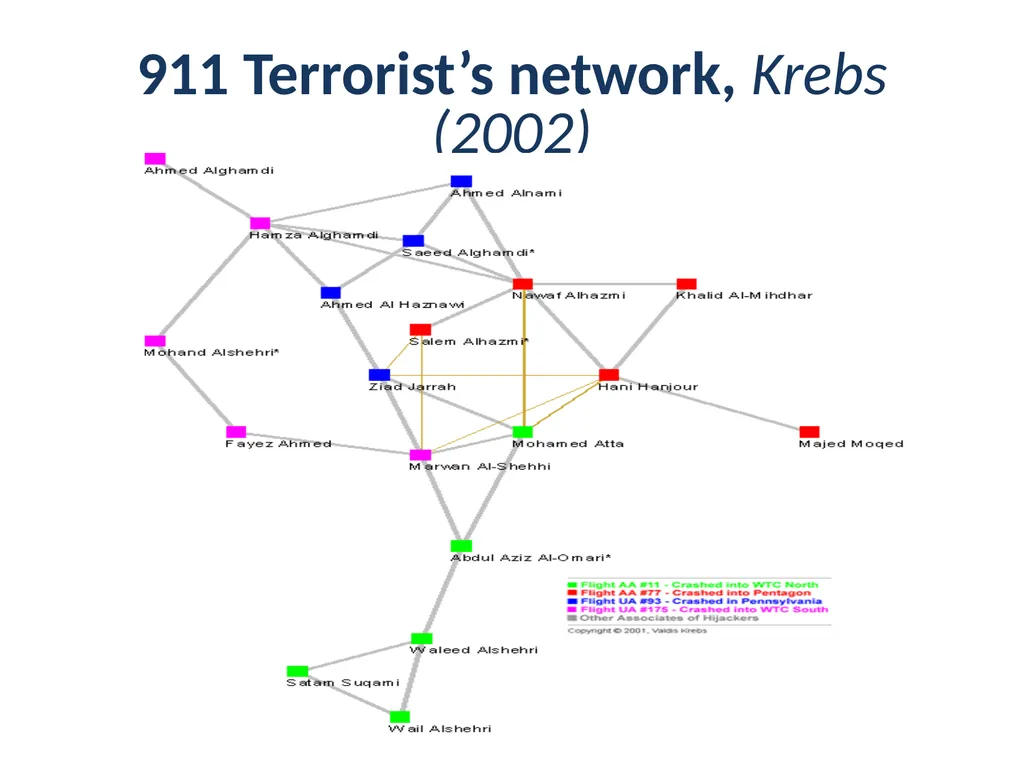
911 Terrorist’s network, Krebs (2002)<br>
04
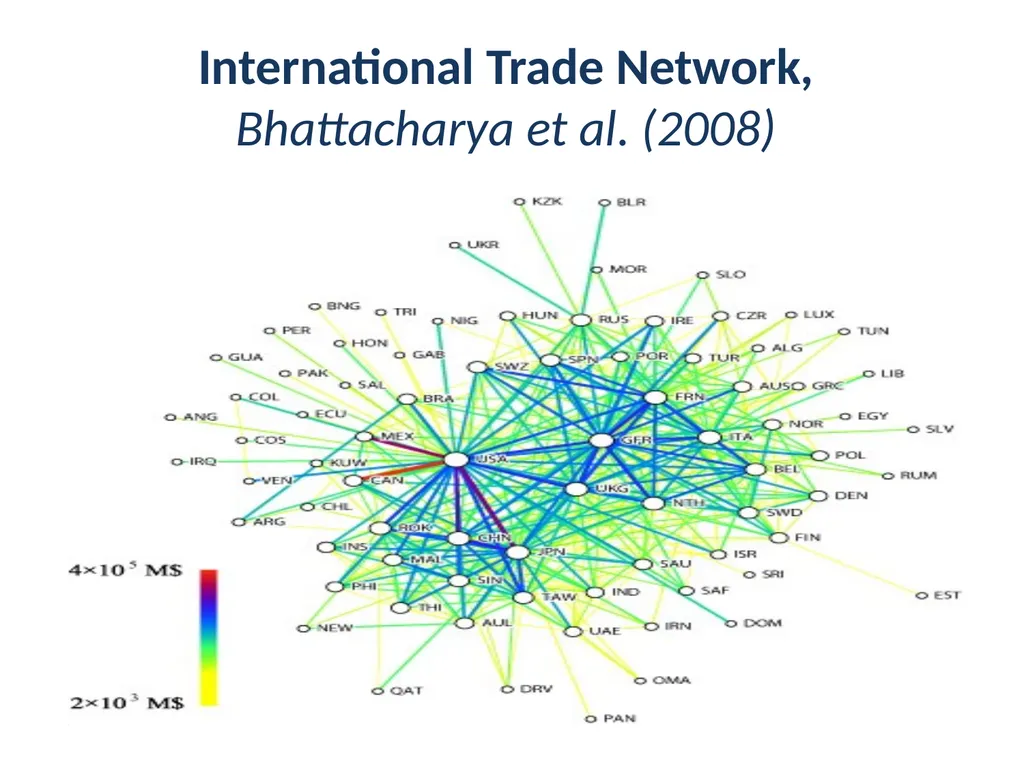
International Trade Network,
Bhattacharya et al. (2008)<br>
05
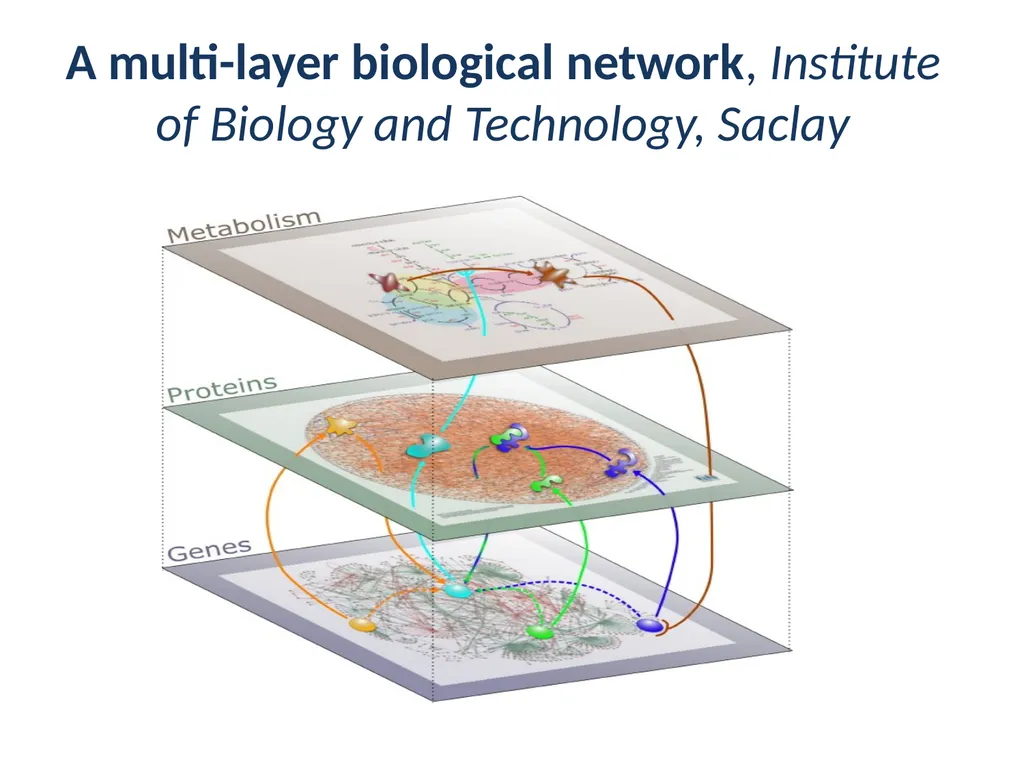
A multi-layer biological network, Institute of Biology and Technology, Saclay<br>
06
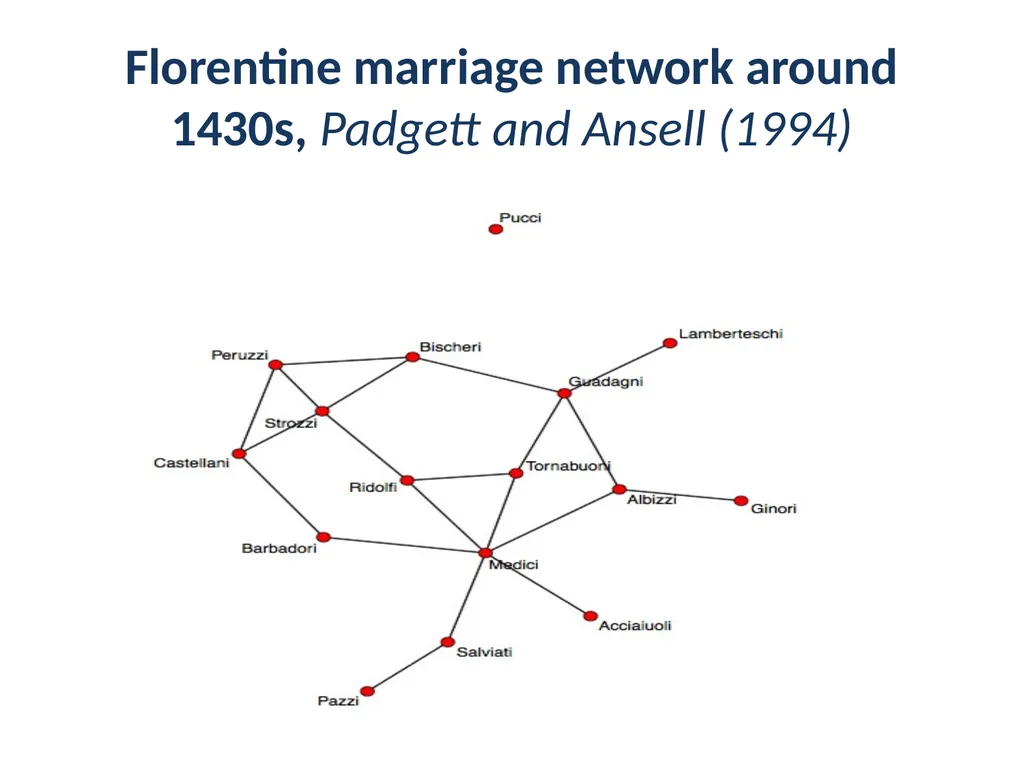
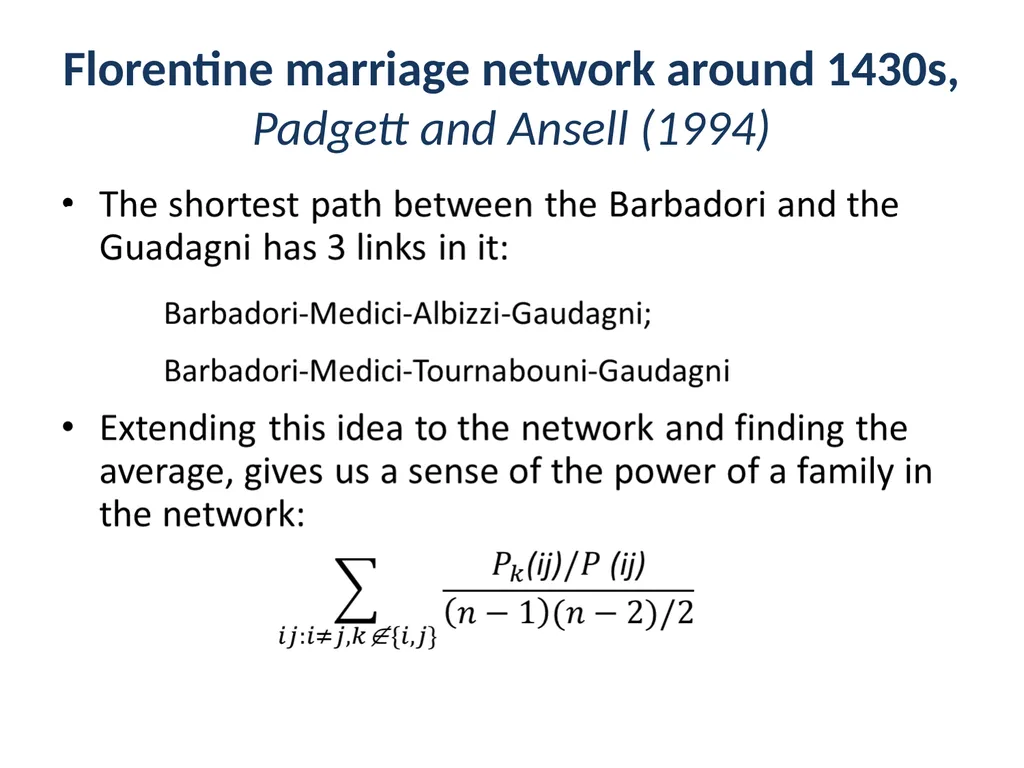
Florentine marriage network around 1430s, Padgett and Ansell (1994)<br>
07
Florence around 1430s and the Rise of the Medici Florence was ruled by an oligarchy of elite families: 16 families
The Medici did not have wealth or political clout but used their social relationships (particularly Cosimo de’ Medici) to rise to power<br>
The Medici did not have wealth or political clout but used their social relationships (particularly Cosimo de’ Medici) to rise to power<br>
08
The marriage networks tells this story…<br>
09
Florentine marriage network around 1430s, Padgett and Ansell (1994)<br>
10
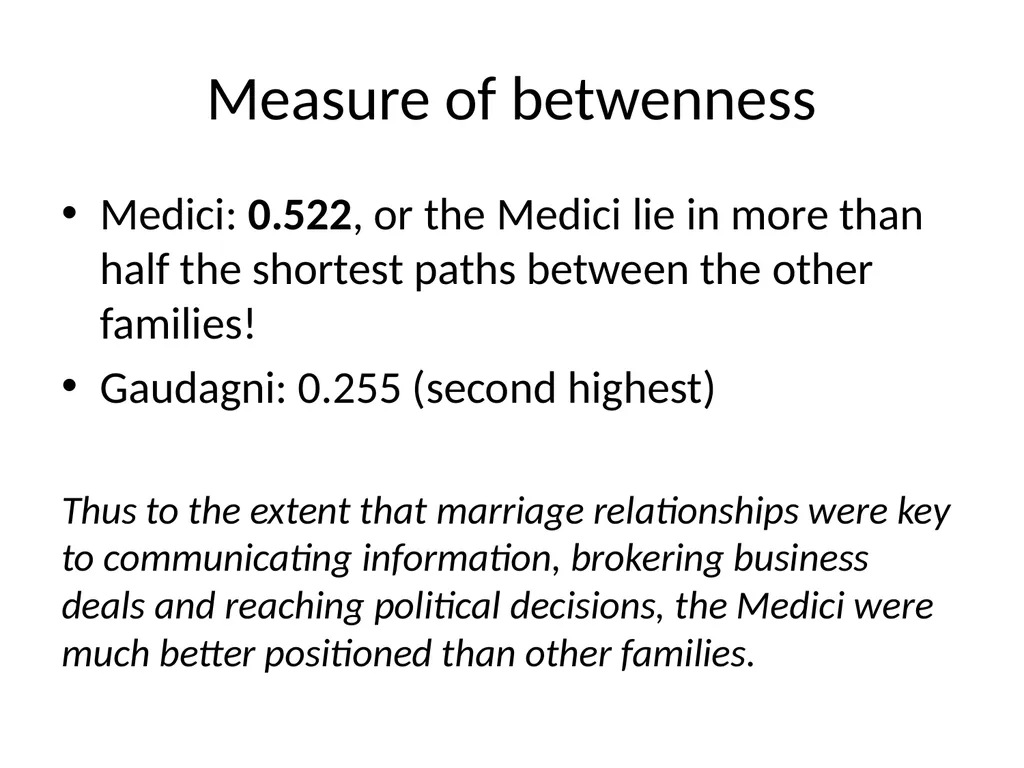
Measure of betwenness Medici: 0.522, or the Medici lie in more than half the shortest paths between the other families!
Gaudagni: 0.255 (second highest)
Thus to the extent that marriage relationships were key to communicating information, brokering business deals and reaching political decisions, the Medici were much better positioned than other families.<br>
Gaudagni: 0.255 (second highest)
Thus to the extent that marriage relationships were key to communicating information, brokering business deals and reaching political decisions, the Medici were much better positioned than other families.<br>
11
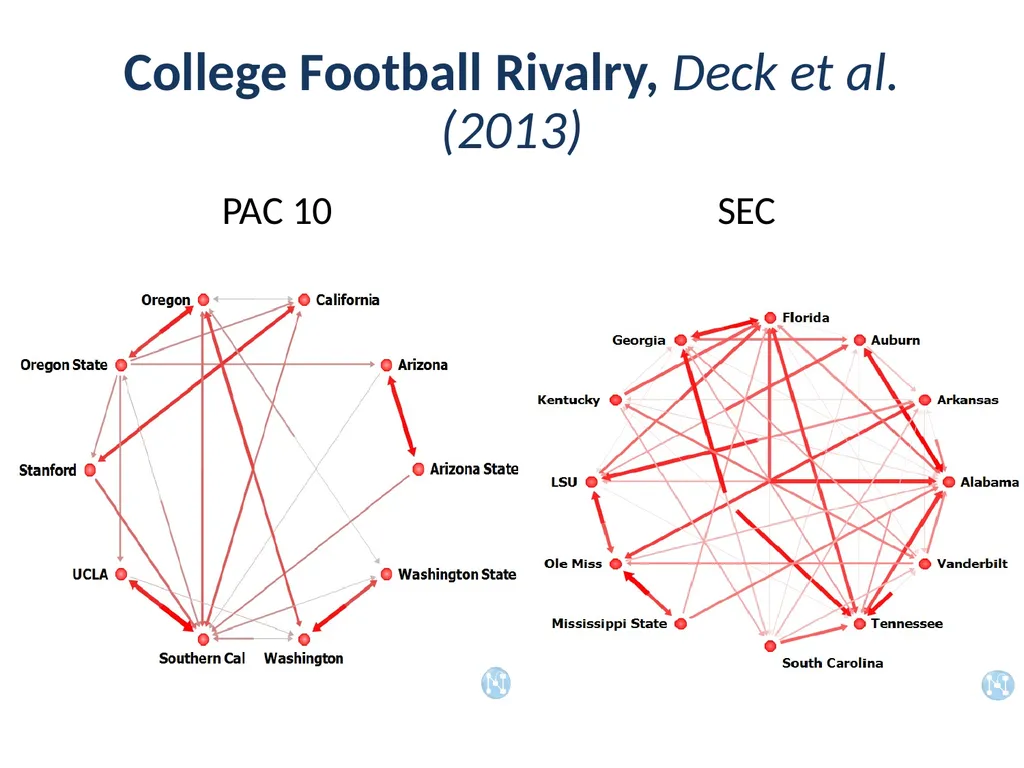
College Football Rivalry, Deck et al. (2013) SEC PAC 10<br>
12
College Football Rivalry, Deck et al. (2013) Use a clustering coefficient measure to assess which conferences present a more tightly knit rivalry network
The higher the clustering coefficient, the higher is the existence of mutual and adjacent rivalries, suggesting a tightly connected conference
Conferences with many strong teams have more pairwise rivalries<br>
The higher the clustering coefficient, the higher is the existence of mutual and adjacent rivalries, suggesting a tightly connected conference
Conferences with many strong teams have more pairwise rivalries<br>
13
A Micro Measure: Centrality Centrality is a quantitative measure which aims at revealing the importance of a node.
Formally, a centrality measure is a real valued function on the nodes of a graph.
There are many different ways to measure it!<br>
Formally, a centrality measure is a real valued function on the nodes of a graph.
There are many different ways to measure it!<br>
14
A Micro Measure: Centrality Degree centrality measures how connected a nodes is in the network.
Who is the most connected?
Who should can you talk to? Who can help you?<br>
Who is the most connected?
Who should can you talk to? Who can help you?<br>
15
A Micro Measure: Centrality Closeness centrality measures how easily a node can reach other nodes in the network, or
How close is someone to the others ?
Who is important locally? How long will it take for information to reach from node x to the others?<br>
How close is someone to the others ?
Who is important locally? How long will it take for information to reach from node x to the others?<br>
16
A Micro Measure: Centrality Betweenness centrality measures how important a node is in terms of connecting other nodes in the network
Who can be used effectively to transfer things in the network?
Sudipta Sarangi to ...<br>
Who can be used effectively to transfer things in the network?
Sudipta Sarangi to ...<br>
17
911 Terrorist’s network, Krebs (2002)<br>
18
How it matters? This network is hard to take down. At least 6 nodes (21%) with the most numerous and important connections will have to taken out before the network will have significant damage.
Degree – measures activity or how often someone contacts others
Betweenness – measures how often someone is a go-between or control in the network
Closeness – measures access or how many people can this person reach
Atta – scores highest on all 3 measures. Al-Shehhi comes in second because he is high on degree and closeness.<br>
Degree – measures activity or how often someone contacts others
Betweenness – measures how often someone is a go-between or control in the network
Closeness – measures access or how many people can this person reach
Atta – scores highest on all 3 measures. Al-Shehhi comes in second because he is high on degree and closeness.<br>
19
How it matters? Alhazmi comes in second in betweenness, suggesting that he exercised a lot of control, but fourth in activity and only seventh in closeness.
If you eliminate the thinnest links (most recent), Alhazmi becomes the most powerful node. He is first in both control and access, and second only to Atta in activity.
Hypothesis: Alhazmi played a large role in planning the attacks, and Atta came to the fore when it was time to carry them out?<br>
If you eliminate the thinnest links (most recent), Alhazmi becomes the most powerful node. He is first in both control and access, and second only to Atta in activity.
Hypothesis: Alhazmi played a large role in planning the attacks, and Atta came to the fore when it was time to carry them out?<br>
20
A Micro Measure: Centrality Centrality measure based on neighbor’s characteristics – how important or connected or influential a neighbor is: Eigen vector centrality, Bonacich centrality, Katz prestige measure.
Bonacich centrality: The centrality of a node is dependent on the centrality of the nodes it is connected to.
How to measure Power, Influence, etc?<br>
Bonacich centrality: The centrality of a node is dependent on the centrality of the nodes it is connected to.
How to measure Power, Influence, etc?<br>
21
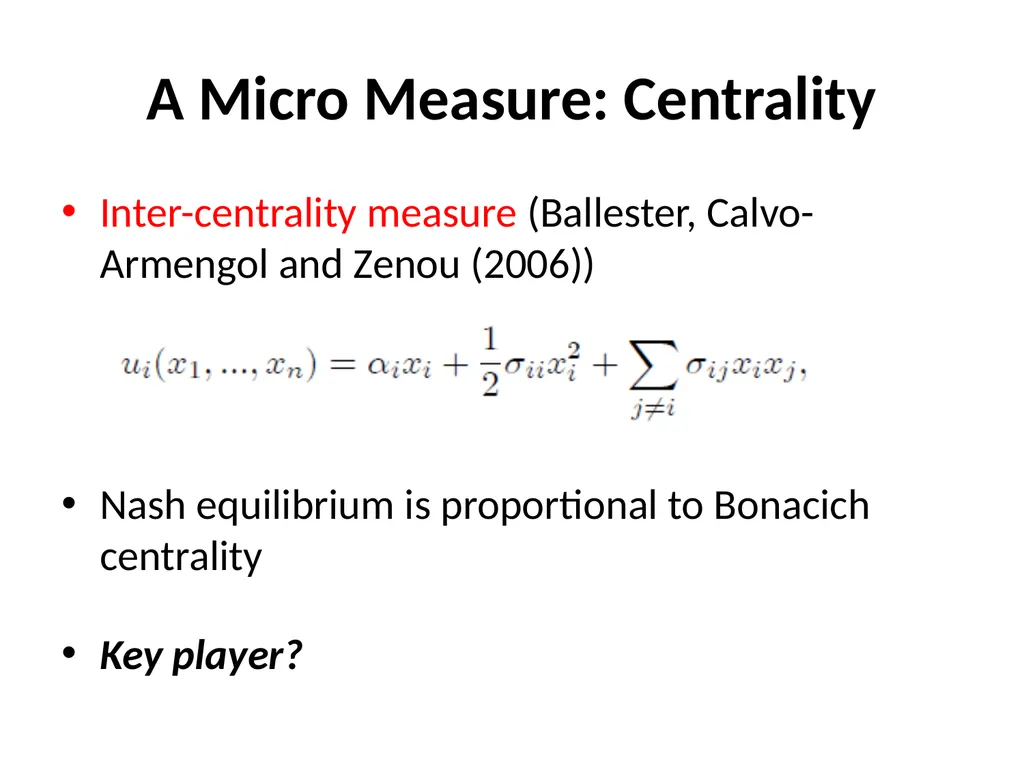
A Micro Measure: Centrality Inter-centrality measure (Ballester, Calvo-Armengol and Zenou (2006))
Nash equilibrium is proportional to Bonacich centrality
Key player?<br>
Nash equilibrium is proportional to Bonacich centrality
Key player?<br>
22
Studying Networks Networks are a conduit for flows. These can be:
Data; Diseases; Trade; Favors; Influence; Associations
Network models attempt to explain how these flows take place.
Networks are inter-disciplinary:
Mathematics; Sociology; Physics; Biology; Computer science; Anthropology; Operations Research
and more recently Economics!<br>
Data; Diseases; Trade; Favors; Influence; Associations
Network models attempt to explain how these flows take place.
Networks are inter-disciplinary:
Mathematics; Sociology; Physics; Biology; Computer science; Anthropology; Operations Research
and more recently Economics!<br>
23
What does Economics Bring to the Table? How do these networks form?
Given that relationships provide benefits but are costly, why do specific networks arise?
Applying them to understand a host of phenomena – exchange, jobs, favors, information, firm behavior, etc.<br>
Given that relationships provide benefits but are costly, why do specific networks arise?
Applying them to understand a host of phenomena – exchange, jobs, favors, information, firm behavior, etc.<br>
24
A brief and idiosyncratic history… Euler – the seven bridges of Konigsberg: (1736)
Emile Durkhiem and Ferdinand Tonnies – pioneered the study of social groups: late 1800s
Major developments in sociology, psychology, mathematics and anthropology in 1930s<br>
Emile Durkhiem and Ferdinand Tonnies – pioneered the study of social groups: late 1800s
Major developments in sociology, psychology, mathematics and anthropology in 1930s<br>
25
A brief and idiosyncratic history… Stanley Milgram: Six Degrees of Separation Experiment; the Oracle of Kevin Bacon
Mark Granovetter: The Strength of Weak Ties
Structural holes
Social capital: the social value of relationships
Frank Harrary: Formal modeling of structural issues in networks<br>
Mark Granovetter: The Strength of Weak Ties
Structural holes
Social capital: the social value of relationships
Frank Harrary: Formal modeling of structural issues in networks<br>
26
A brief and idiosyncratic history… Erdos and Reyni: Random graphs – late 1950s and ’60s
Specify the set of nodes N and a common probability p for link between any two nodes. This generates a random graph. Note that there is no bias towards any node.
Such models became popular in SNA in the 1980s to explain degree based structural effects as well as things like reciprocity, homophily and popularity.<br>
Specify the set of nodes N and a common probability p for link between any two nodes. This generates a random graph. Note that there is no bias towards any node.
Such models became popular in SNA in the 1980s to explain degree based structural effects as well as things like reciprocity, homophily and popularity.<br>
27
A brief and idiosyncratic history… Watts and Strogatz: Small Worlds – late 1990s
Random graph model where each node is linked to its k closest neighbors and then we randomly rewire with probability p. As p gets large we get a random network.
Has small world properties – high clustering coefficients with small average path lengths.
Examples: road maps, power grids, network of brain neurons, telephone call graphs, the networks of economists, etc.<br>
Random graph model where each node is linked to its k closest neighbors and then we randomly rewire with probability p. As p gets large we get a random network.
Has small world properties – high clustering coefficients with small average path lengths.
Examples: road maps, power grids, network of brain neurons, telephone call graphs, the networks of economists, etc.<br>
28
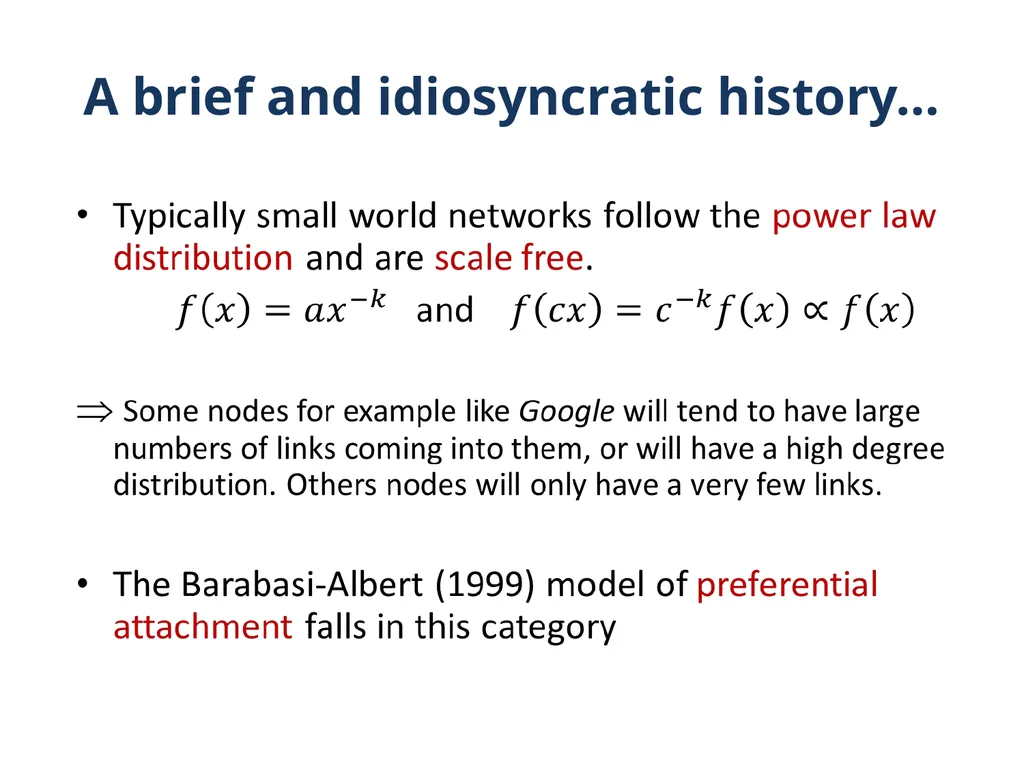
A brief and idiosyncratic history…<br>
29
A brief and idiosyncratic history… A word of caution!
Ajit, Donker and Saxena: An Example – 2012
Use corporate board data from the top 1000 Indian companies (in terms of assets) that are listed on the stock exchange
Corporate boards are a small world – or a sort of old boys network, lack diversity and are dominated by upper castes.
Alternative explanation: It is an old boy’s network not of caste but of (possibly the elite) institutions<br>
Ajit, Donker and Saxena: An Example – 2012
Use corporate board data from the top 1000 Indian companies (in terms of assets) that are listed on the stock exchange
Corporate boards are a small world – or a sort of old boys network, lack diversity and are dominated by upper castes.
Alternative explanation: It is an old boy’s network not of caste but of (possibly the elite) institutions<br>
30
Networks in Economics Issues in network formation games:
What is the architecture of stable networks?
What is the architecture of socially efficient networks?
Do these two architectures always coincide? If not why? Can we find conditions under which they will coincide?
Do stable networks always exist, especially in pure strategies?
How networks affect behavior: Applications!<br>
What is the architecture of stable networks?
What is the architecture of socially efficient networks?
Do these two architectures always coincide? If not why? Can we find conditions under which they will coincide?
Do stable networks always exist, especially in pure strategies?
How networks affect behavior: Applications!<br>
31
Networks in Economics: Approaches Cooperative game theory approach: Coalitions of players produce output and an axiomatic approach is used to define how the output will be shared.
Players do not have strategies. It is assumed that coalitions can write down binding agreements.
Nash networks – non-cooperative approach (Bala and Goyal, 2000a,b)
Pairwise Stability – adds consent to links between pairs (Jackson and Wolinsky, 1996)<br>
Players do not have strategies. It is assumed that coalitions can write down binding agreements.
Nash networks – non-cooperative approach (Bala and Goyal, 2000a,b)
Pairwise Stability – adds consent to links between pairs (Jackson and Wolinsky, 1996)<br>
32
Non-cooperative Network Formation
aka
Nash networks<br>
33
The beginning…<br>
34
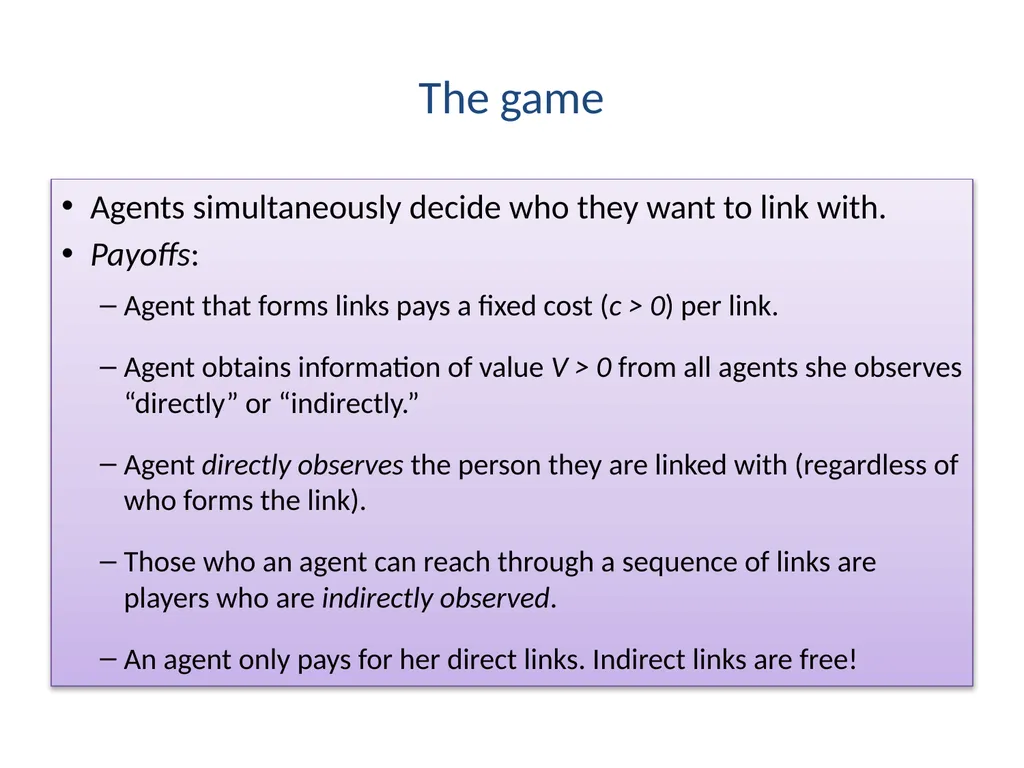
The game Agents simultaneously decide who they want to link with.
Payoffs:
Agent that forms links pays a fixed cost (c > 0) per link.
Agent obtains information of value V > 0 from all agents she observes “directly” or “indirectly.”
Agent directly observes the person they are linked with (regardless of who forms the link).
Those who an agent can reach through a sequence of links are players who are indirectly observed.
An agent only pays for her direct links. Indirect links are free!<br>
Payoffs:
Agent that forms links pays a fixed cost (c > 0) per link.
Agent obtains information of value V > 0 from all agents she observes “directly” or “indirectly.”
Agent directly observes the person they are linked with (regardless of who forms the link).
Those who an agent can reach through a sequence of links are players who are indirectly observed.
An agent only pays for her direct links. Indirect links are free!<br>
35
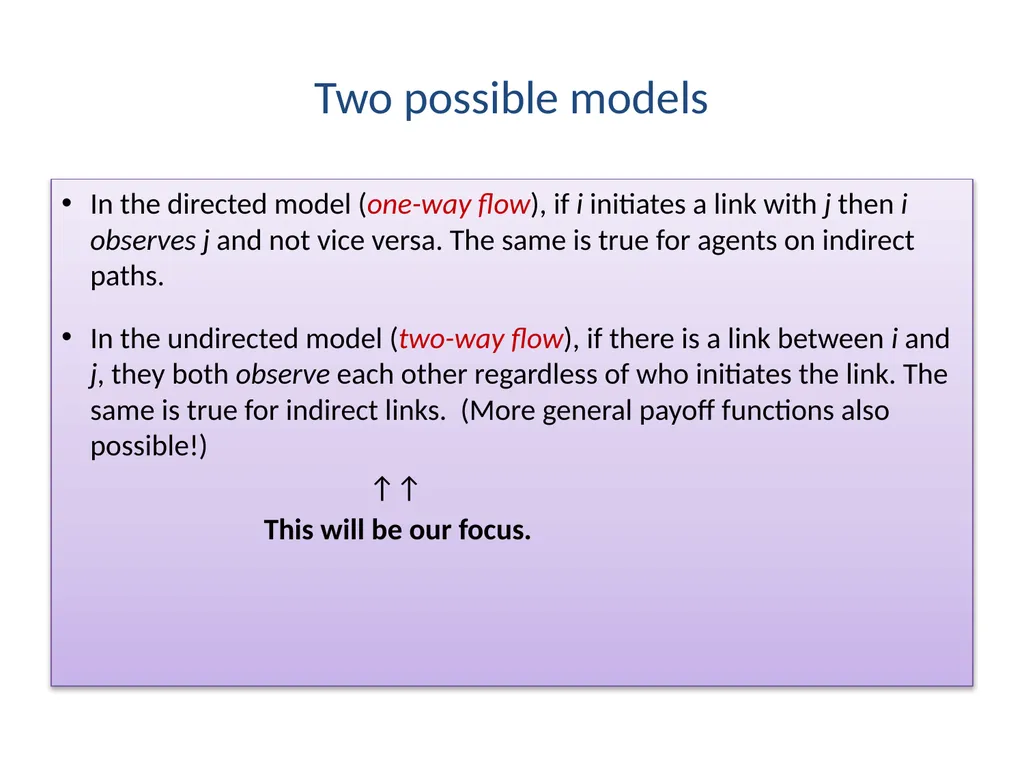
Two possible models In the directed model (one-way flow), if i initiates a link with j then i observes j and not vice versa. The same is true for agents on indirect paths.
In the undirected model (two-way flow), if there is a link between i and j, they both observe each other regardless of who initiates the link. The same is true for indirect links. (More general payoff functions also possible!)
↑↑
This will be our focus.<br>
In the undirected model (two-way flow), if there is a link between i and j, they both observe each other regardless of who initiates the link. The same is true for indirect links. (More general payoff functions also possible!)
↑↑
This will be our focus.<br>
36
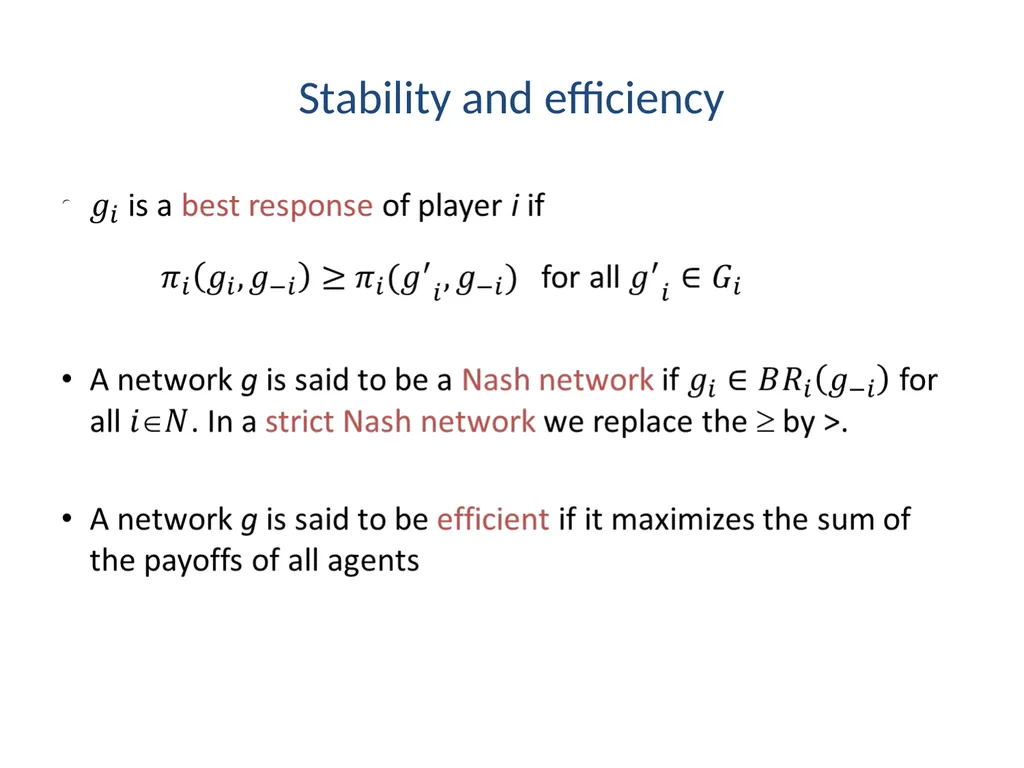
Stability and efficiency<br>
37
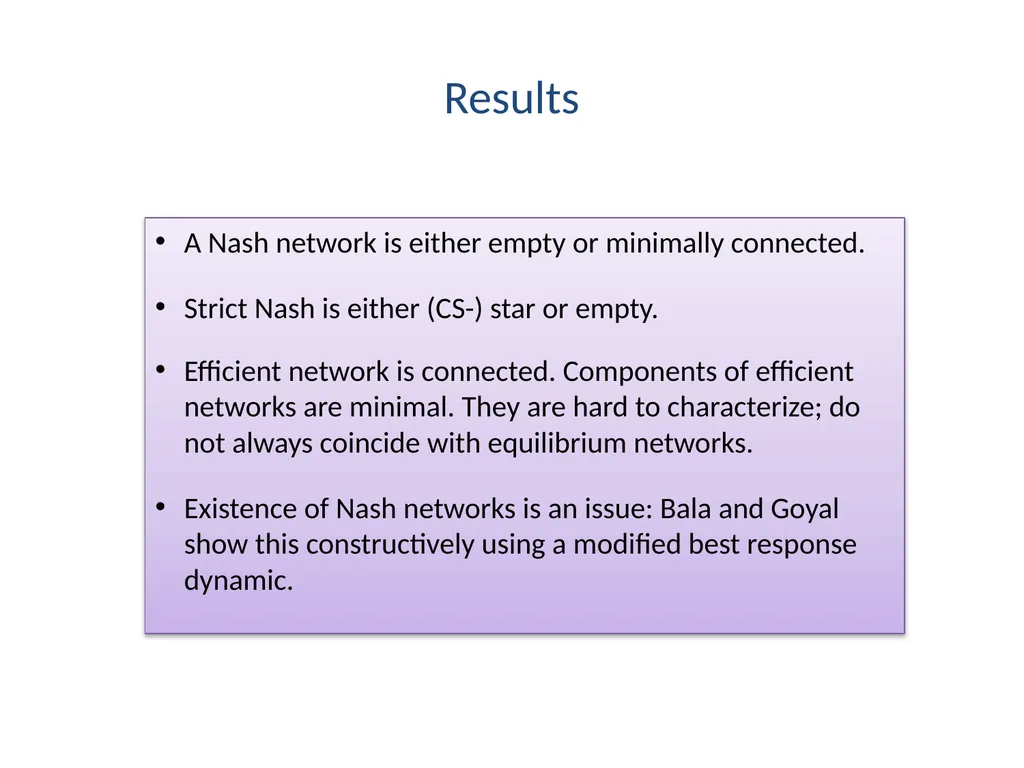
Results A Nash network is either empty or minimally connected.
Strict Nash is either (CS-) star or empty.
Efficient network is connected. Components of efficient networks are minimal. They are hard to characterize; do not always coincide with equilibrium networks.
Existence of Nash networks is an issue: Bala and Goyal show this constructively using a modified best response dynamic.<br>
Strict Nash is either (CS-) star or empty.
Efficient network is connected. Components of efficient networks are minimal. They are hard to characterize; do not always coincide with equilibrium networks.
Existence of Nash networks is an issue: Bala and Goyal show this constructively using a modified best response dynamic.<br>
38
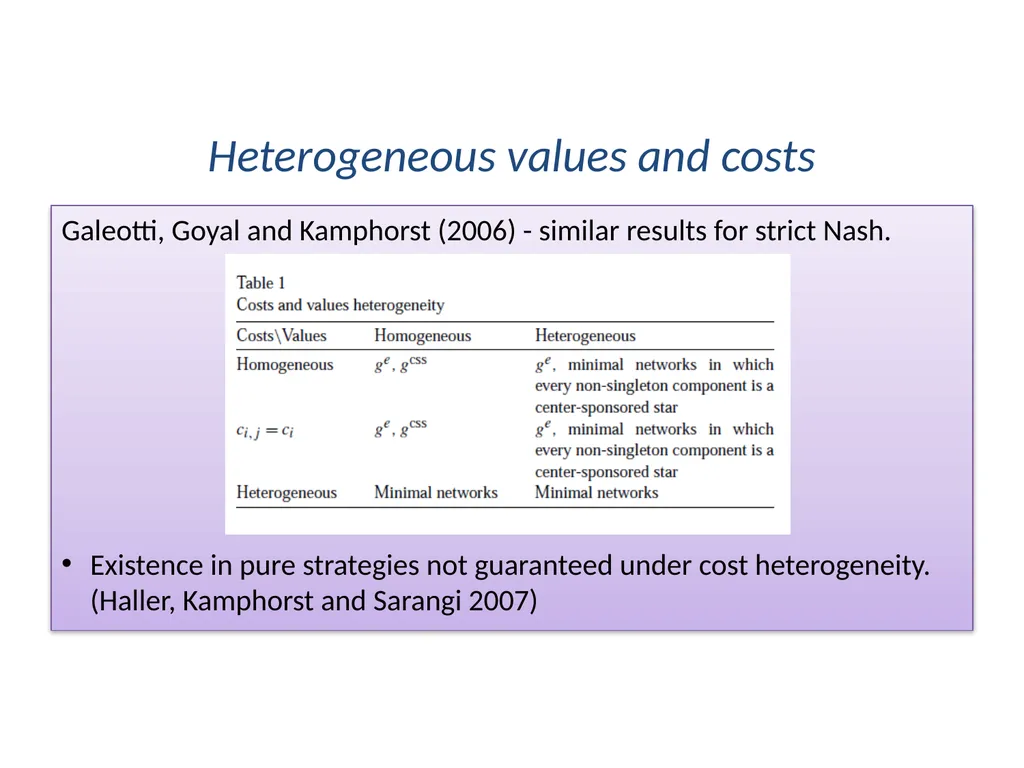
Heterogeneous values and costs Galeotti, Goyal and Kamphorst (2006) - similar results for strict Nash.
Existence in pure strategies not guaranteed under cost heterogeneity. (Haller, Kamphorst and Sarangi 2007)<br>
Existence in pure strategies not guaranteed under cost heterogeneity. (Haller, Kamphorst and Sarangi 2007)<br>
39
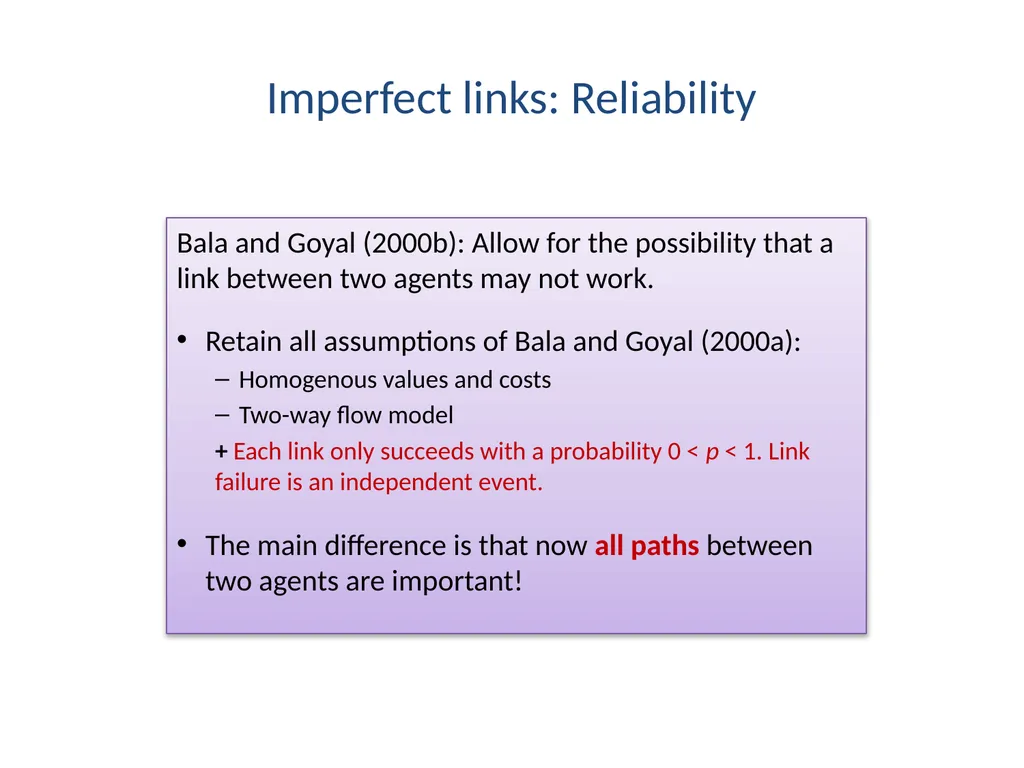
Imperfect links: Reliability Bala and Goyal (2000b): Allow for the possibility that a link between two agents may not work.
Retain all assumptions of Bala and Goyal (2000a):
Homogenous values and costs
Two-way flow model
+ Each link only succeeds with a probability 0 < p < 1. Link failure is an independent event.
The main difference is that now all paths between two agents are important!<br>
Retain all assumptions of Bala and Goyal (2000a):
Homogenous values and costs
Two-way flow model
+ Each link only succeeds with a probability 0 < p < 1. Link failure is an independent event.
The main difference is that now all paths between two agents are important!<br>
40
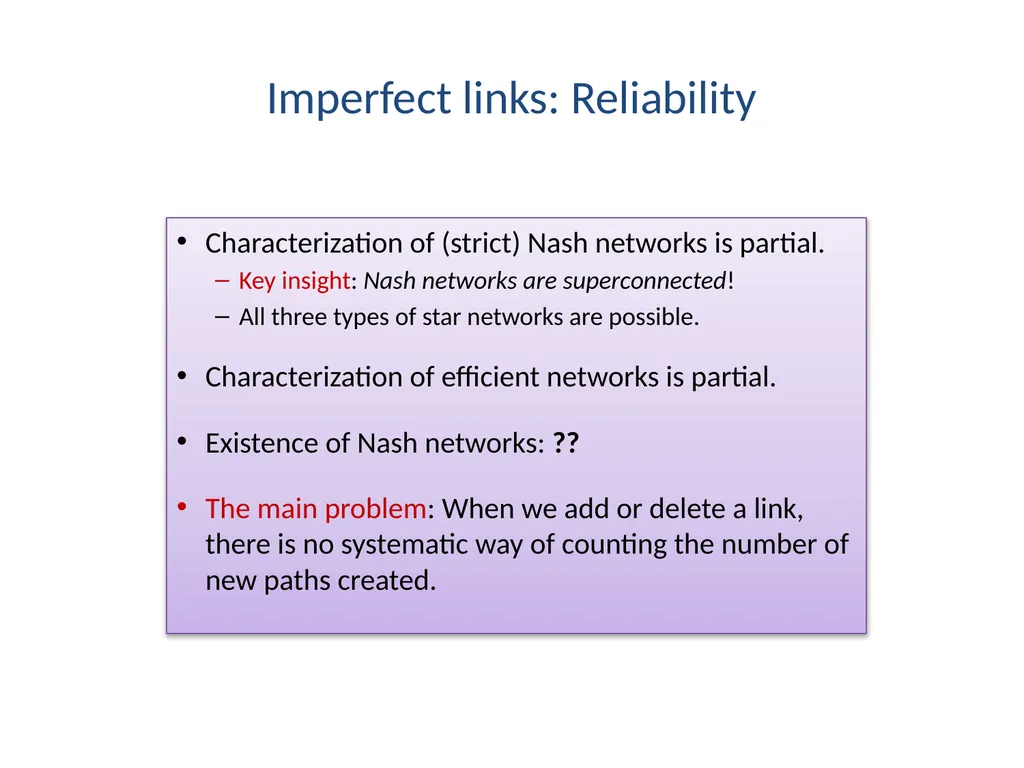
Imperfect links: Reliability Characterization of (strict) Nash networks is partial.
Key insight: Nash networks are superconnected!
All three types of star networks are possible.
Characterization of efficient networks is partial.
Existence of Nash networks: ??
The main problem: When we add or delete a link, there is no systematic way of counting the number of new paths created.<br>
Key insight: Nash networks are superconnected!
All three types of star networks are possible.
Characterization of efficient networks is partial.
Existence of Nash networks: ??
The main problem: When we add or delete a link, there is no systematic way of counting the number of new paths created.<br>
41
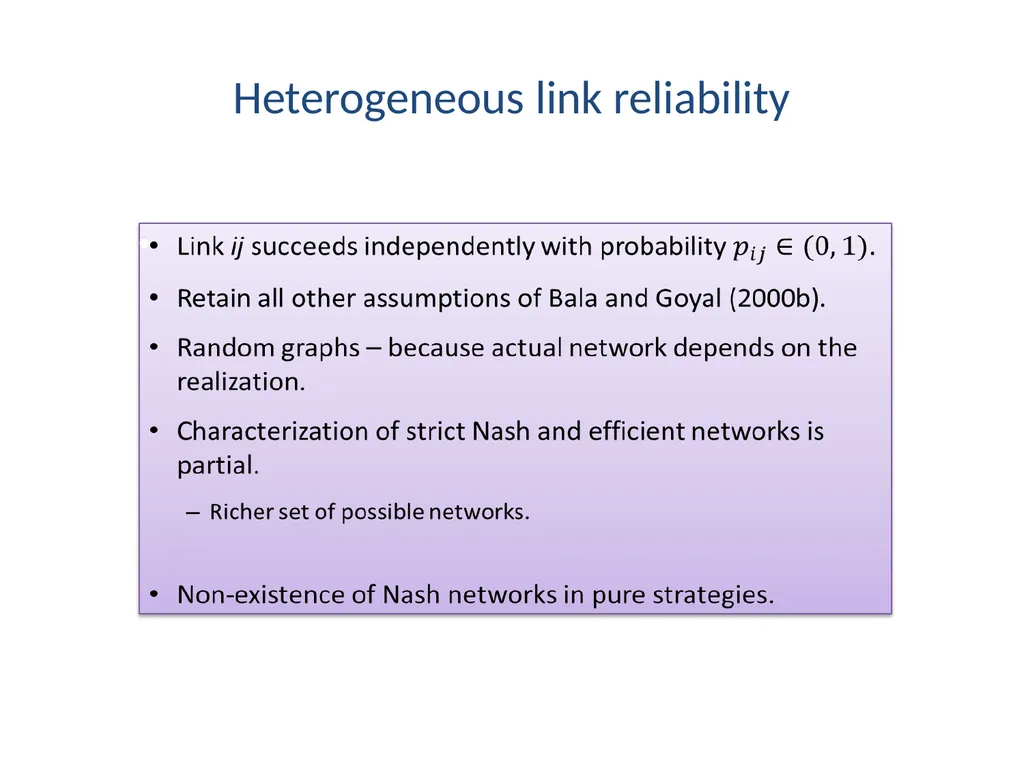
Heterogeneous link reliability<br>
42
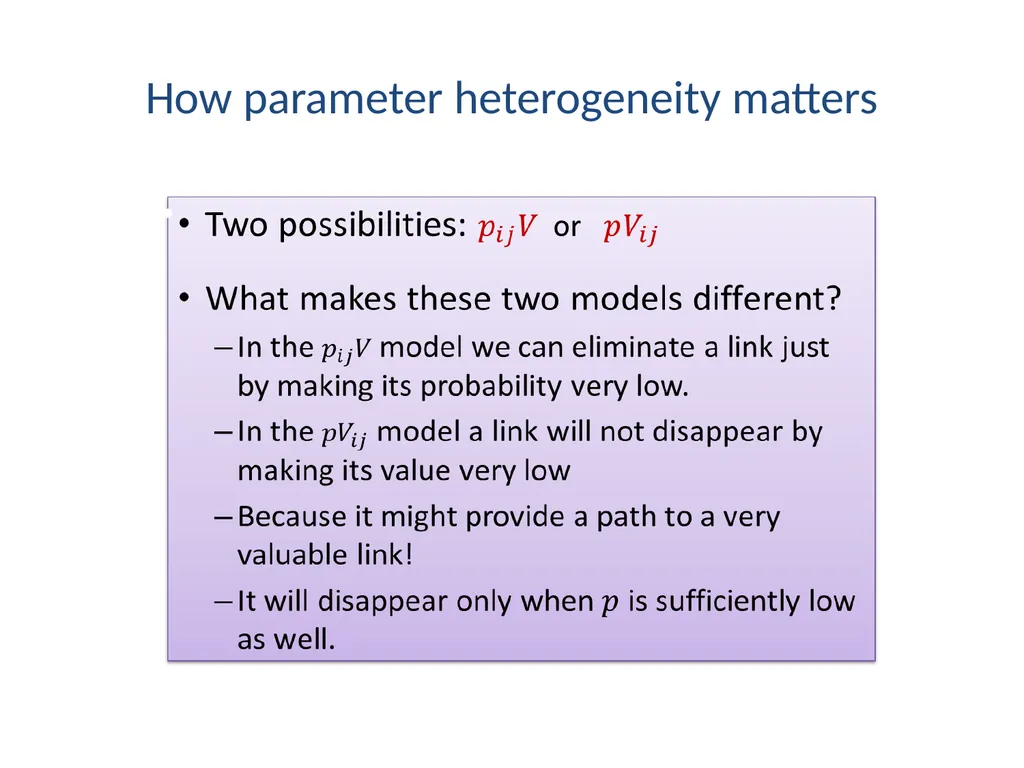
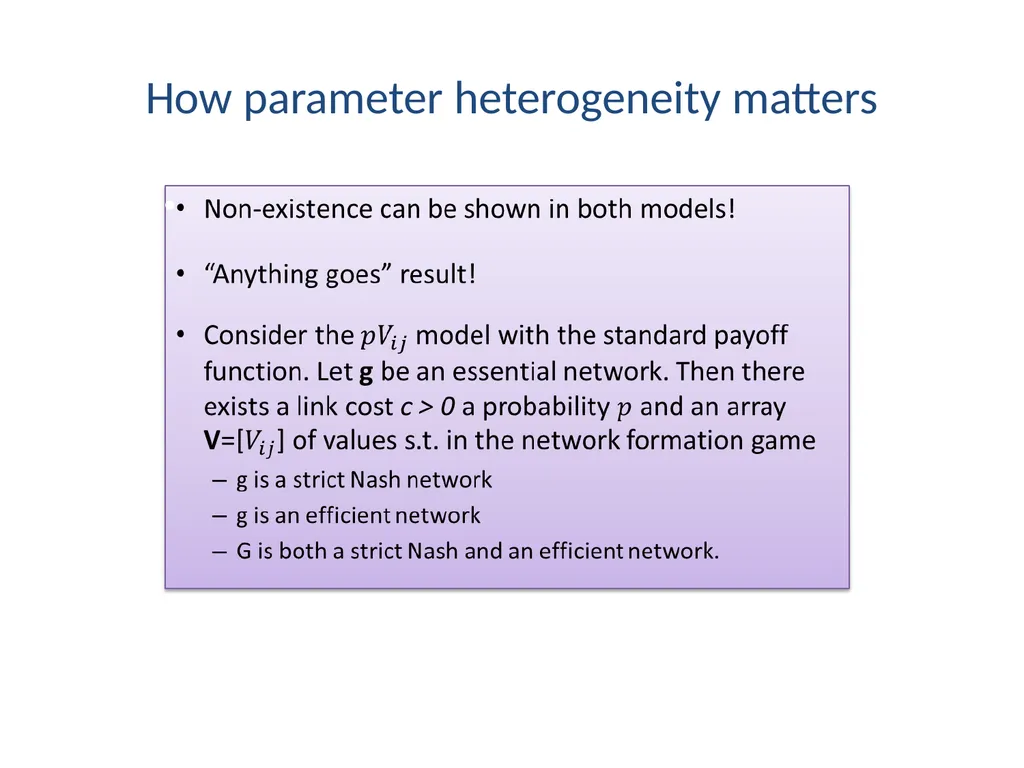
How parameter heterogeneity matters<br>
43
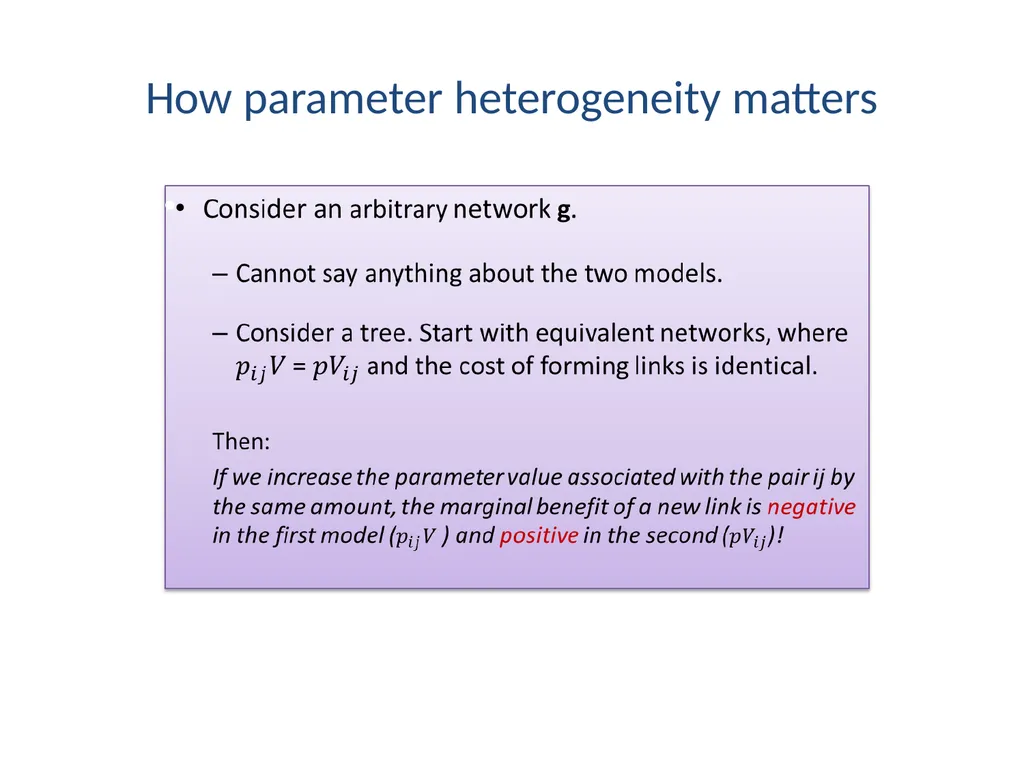
How parameter heterogeneity matters<br>
44
How parameter heterogeneity matters<br>
45
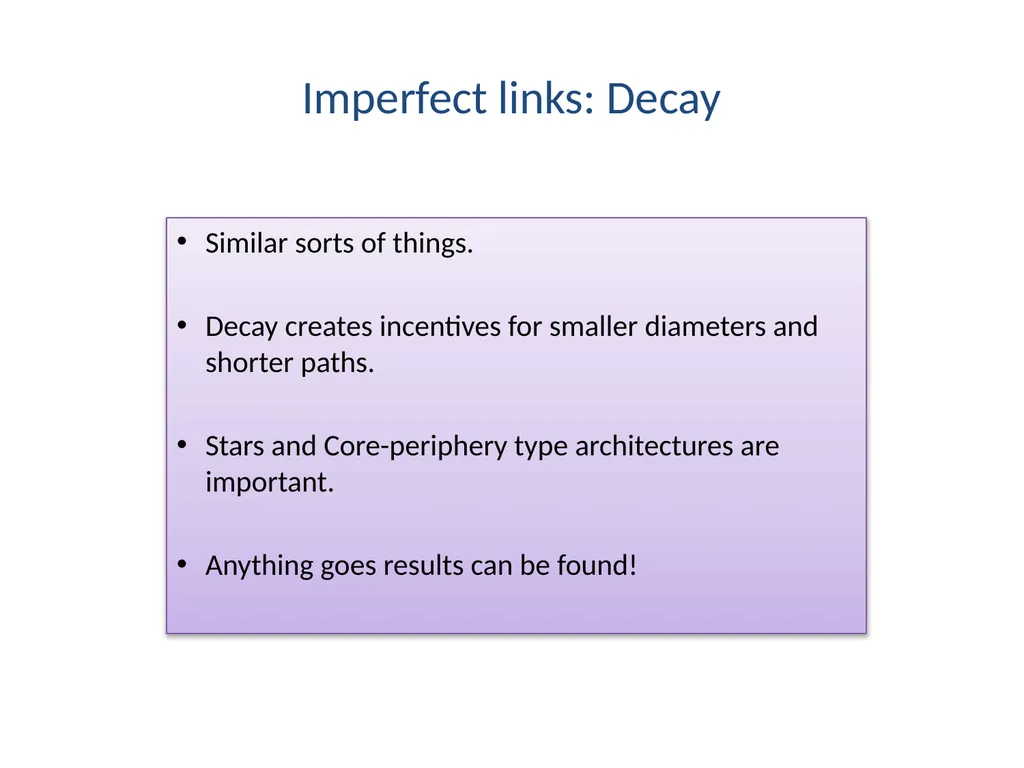
Imperfect links: Decay Similar sorts of things.
Decay creates incentives for smaller diameters and shorter paths.
Stars and Core-periphery type architectures are important.
Anything goes results can be found!<br>
Decay creates incentives for smaller diameters and shorter paths.
Stars and Core-periphery type architectures are important.
Anything goes results can be found!<br>