Local SEO Industry Survey 2015 Type of
Description: Local SEO Industry Survey 2015 Type of Respondents: National International Agencies National International Agencies 21 of all survey respondents Q1. How many people in your company are SEOs? Q1. Key Findings: The average no. of
Related Topics
Download Presentation
"Local SEO Industry Survey 2015 Type of" is the property of its rightful owner. Permission is granted to download and print the materials on this website for personal, non-commercial use only, and to display it on your personal computer provided you do not modify the materials and that you retain all copyright notices contained in the materials. By downloading content from our website, you accept the terms of this agreement.
Presentation Transcript
slide1. Local SEO Industry Survey 2015 Type of Respondents:
National / International Agencies<br>
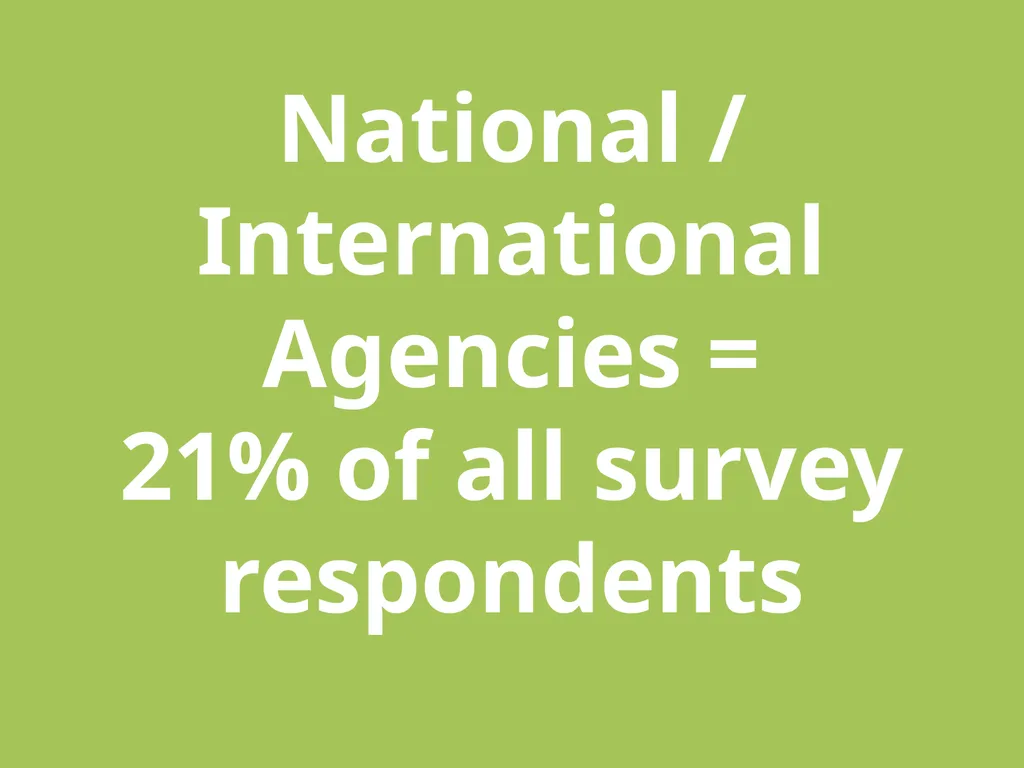
slide2. National / International Agencies =
21% of all survey respondents<br>
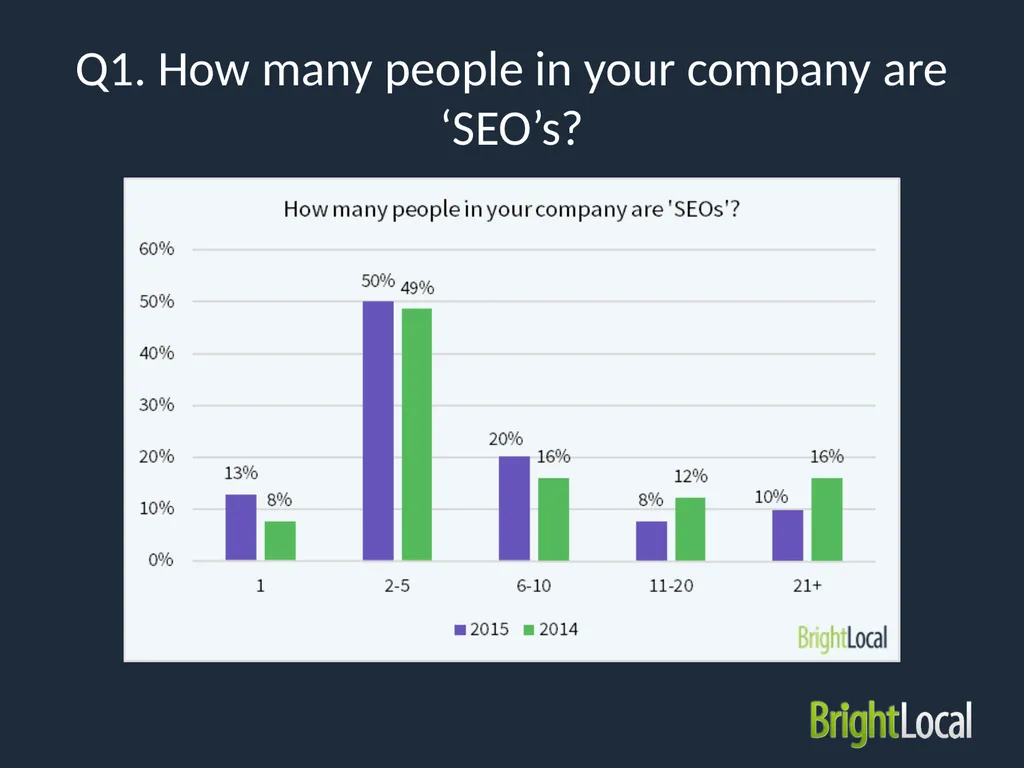
slide3. Q1. How many people in your company are ‘SEO’s?<br>
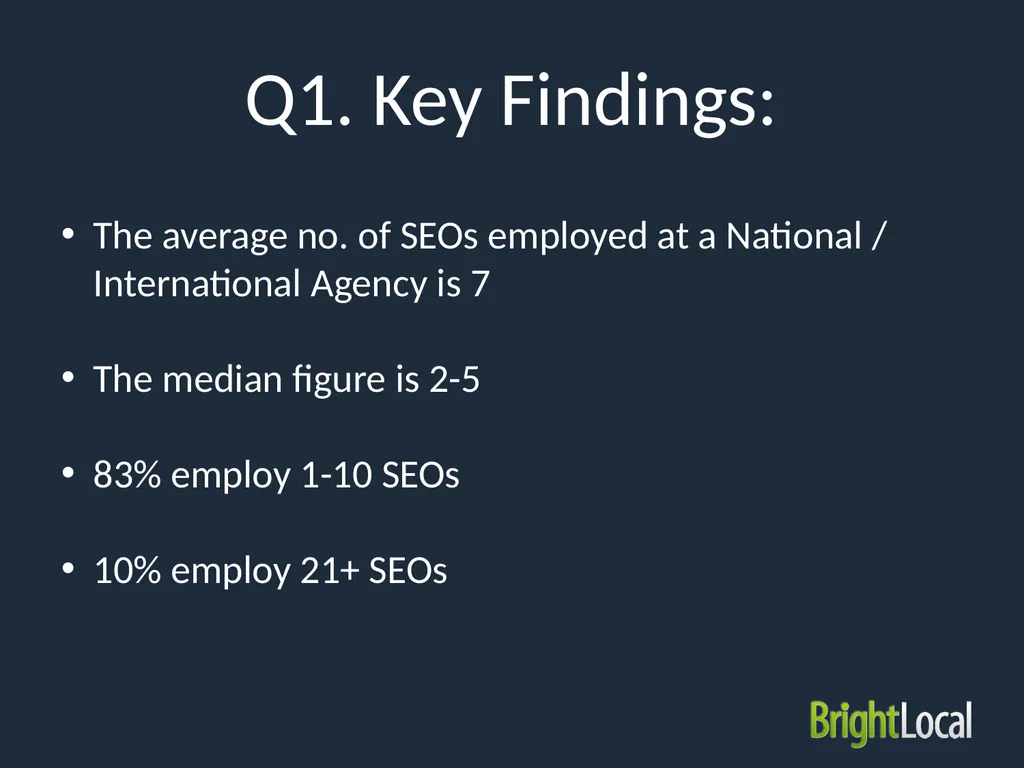
slide4. Q1. Key Findings: The average no. of SEOs employed at a National / International Agency is 7
The median figure is 2-5
83% employ 1-10 SEOs
10% employ 21+ SEOs<br>
slide5. Q2. What was your company revenue in the last 12 months?<br>
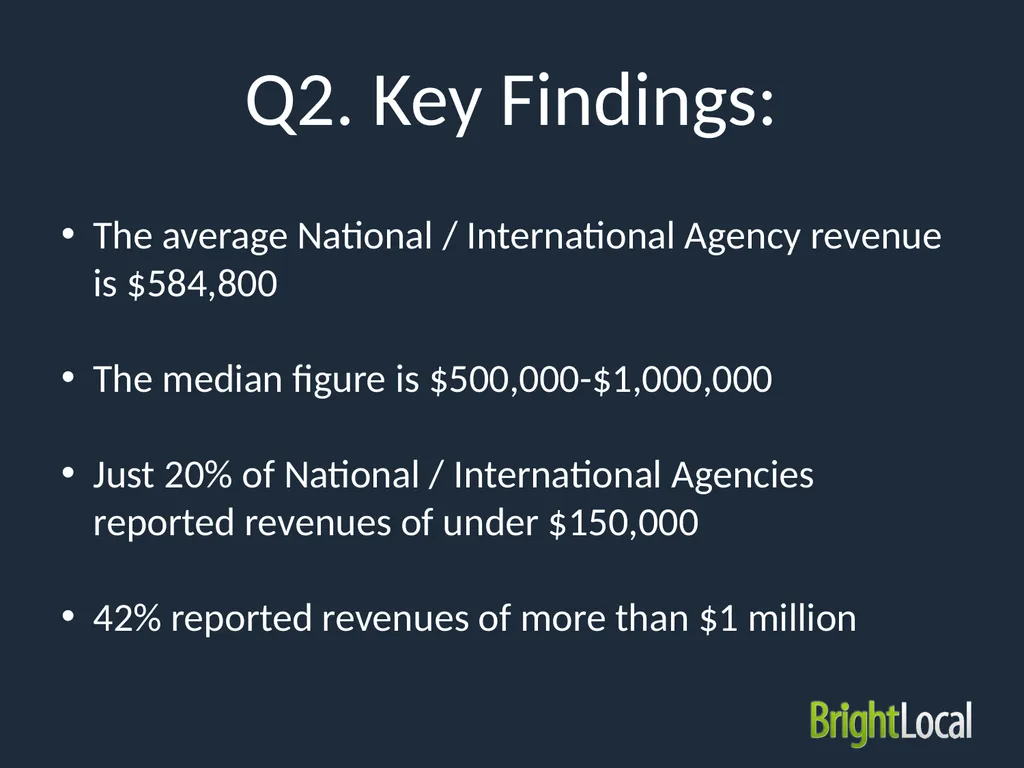
slide6. Q2. Key Findings: The average National / International Agency revenue is $584,800
The median figure is $500,000-$1,000,000
Just 20% of National / International Agencies reported revenues of under $150,000
42% reported revenues of more than $1 million<br>
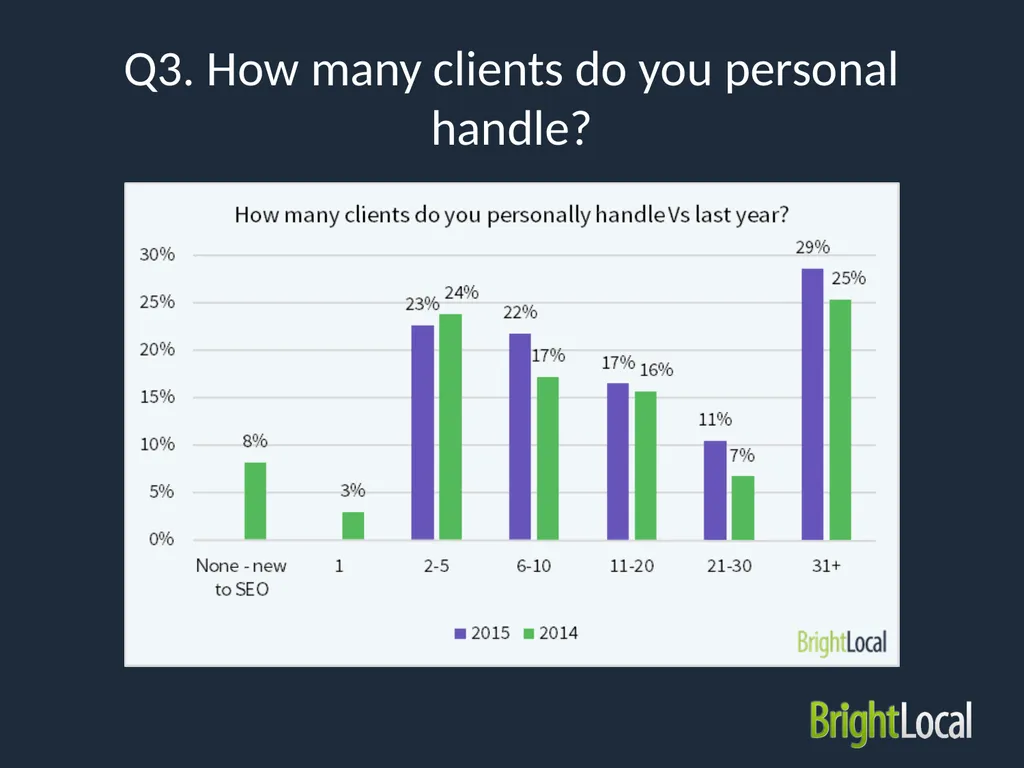
slide7. Q3. How many clients do you personal handle?<br>
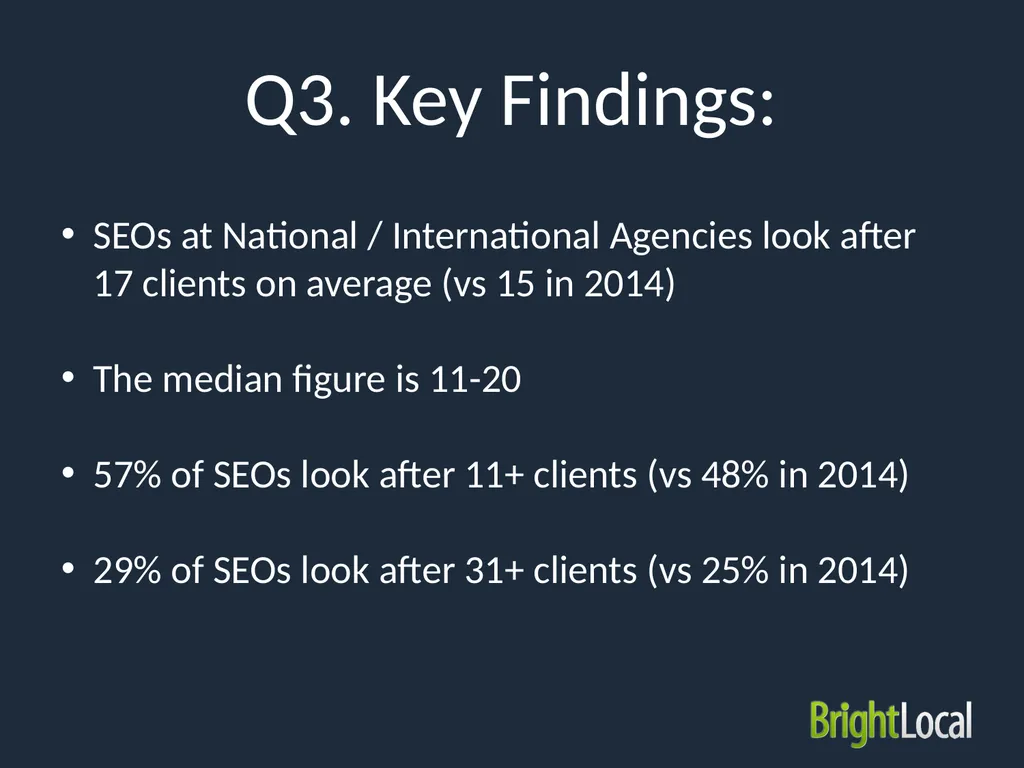
slide8. Q3. Key Findings: SEOs at National / International Agencies look after 17 clients on average (vs 15 in 2014)
The median figure is 11-20
57% of SEOs look after 11+ clients (vs 48% in 2014)
29% of SEOs look after 31+ clients (vs 25% in 2014)<br>
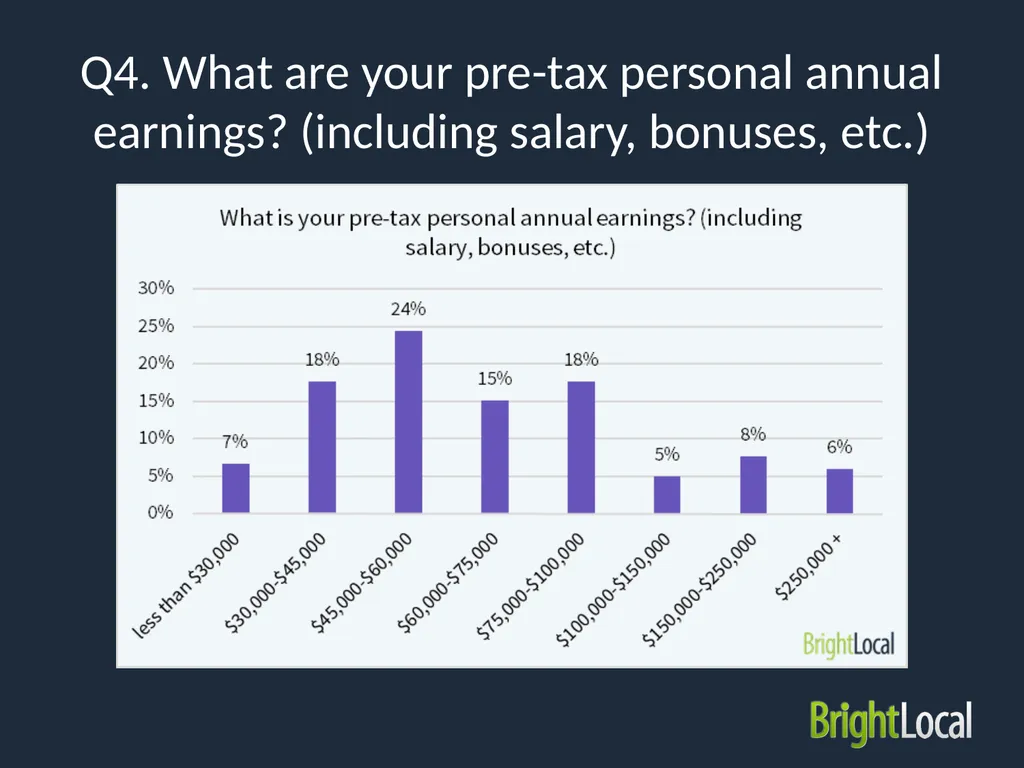
slide9. Q4. What are your pre-tax personal annual earnings? (including salary, bonuses, etc.)<br>
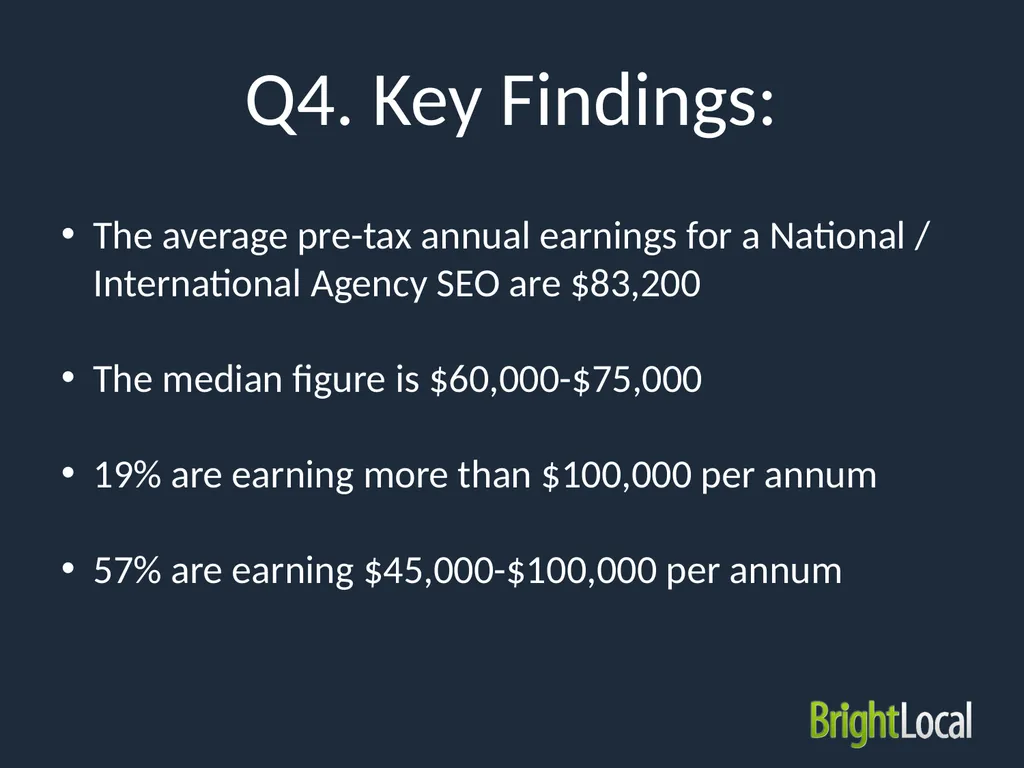
slide10. Q4. Key Findings: The average pre-tax annual earnings for a National / International Agency SEO are $83,200
The median figure is $60,000-$75,000
19% are earning more than $100,000 per annum
57% are earning $45,000-$100,000 per annum<br>
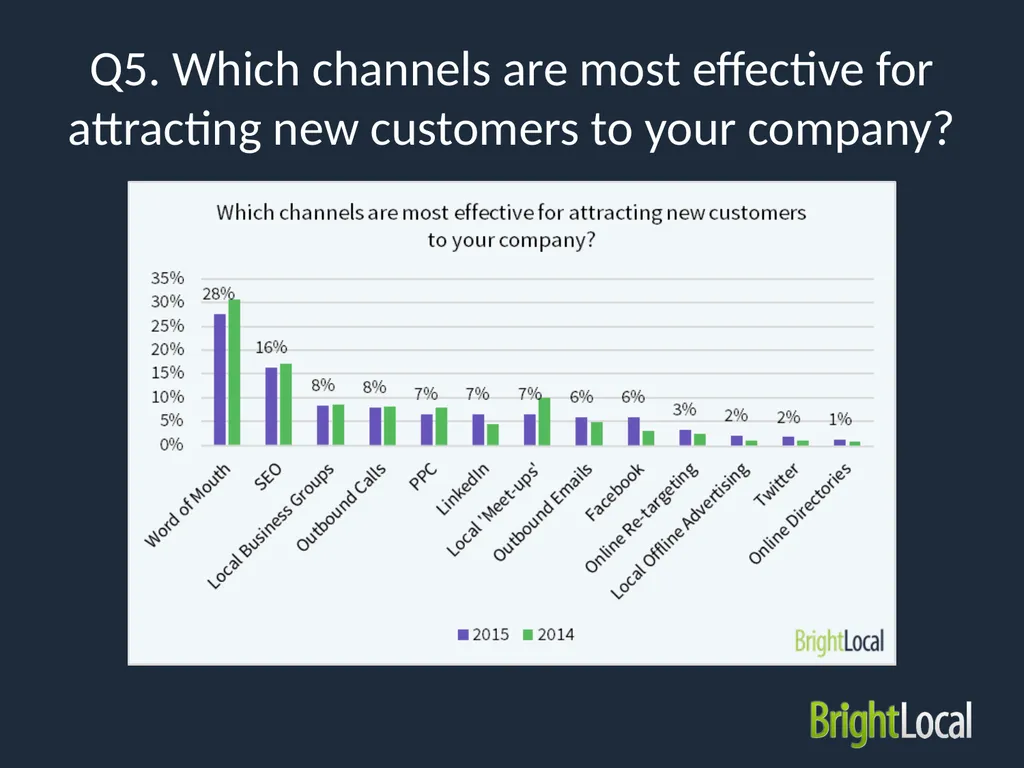
slide11. Q5. Which channels are most effective for attracting new customers to your company?<br>
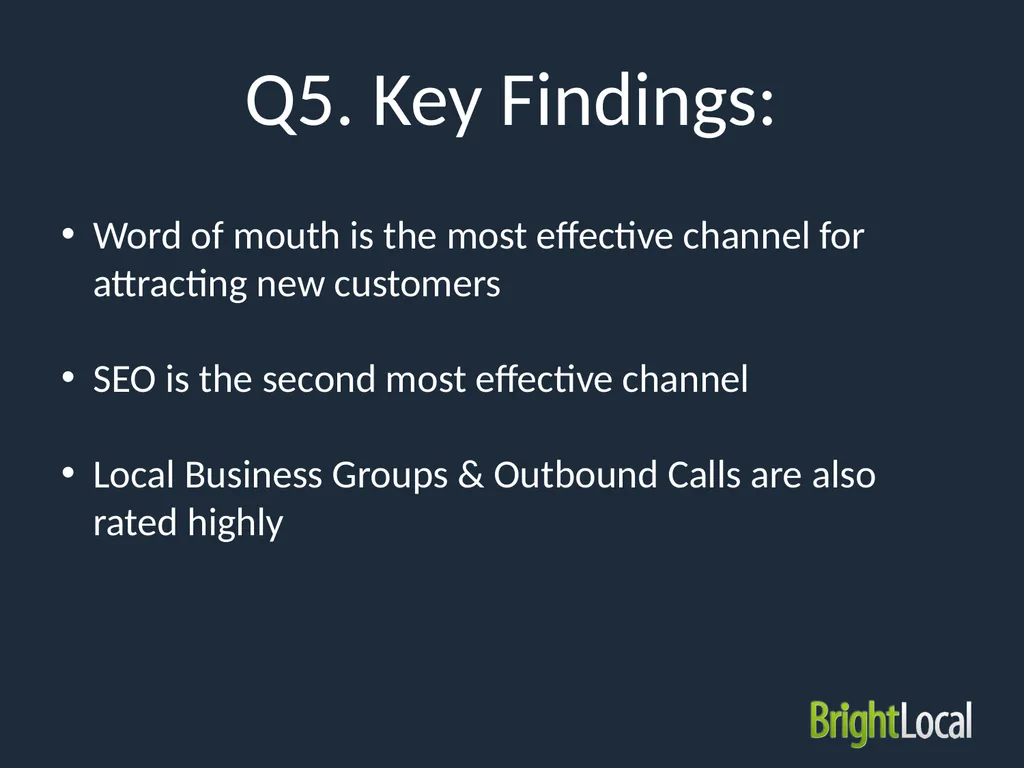
slide12. Q5. Key Findings: Word of mouth is the most effective channel for attracting new customers
SEO is the second most effective channel
Local Business Groups & Outbound Calls are also rated highly<br>
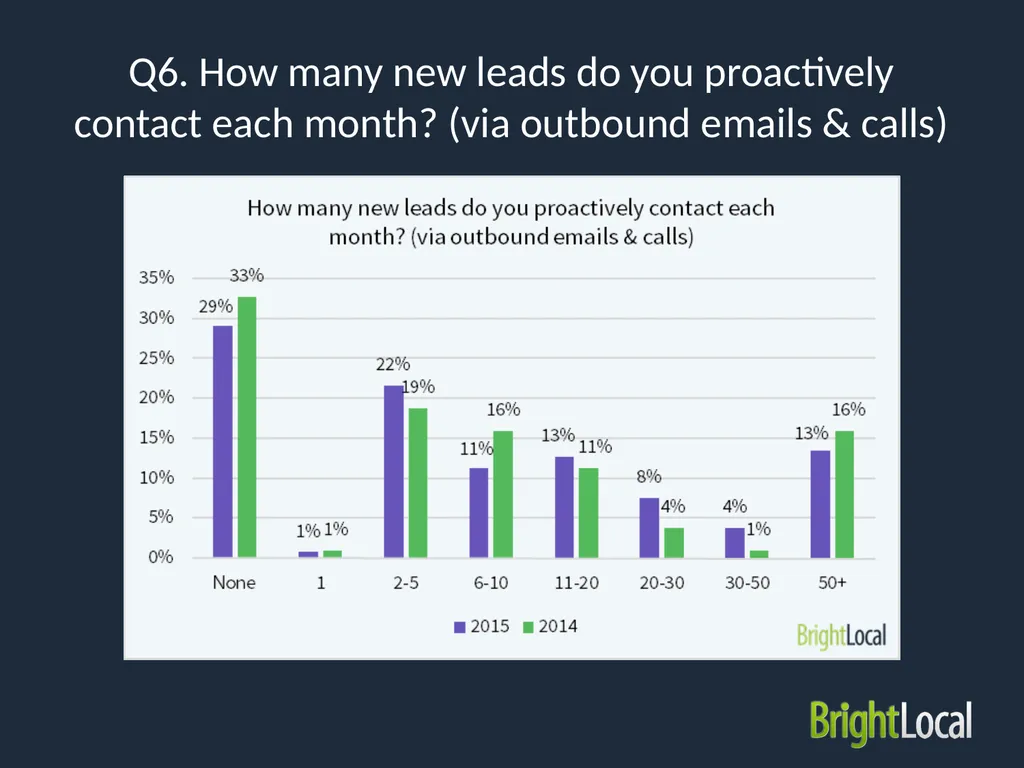
slide13. Q6. How many new leads do you proactively contact each month? (via outbound emails & calls)<br>
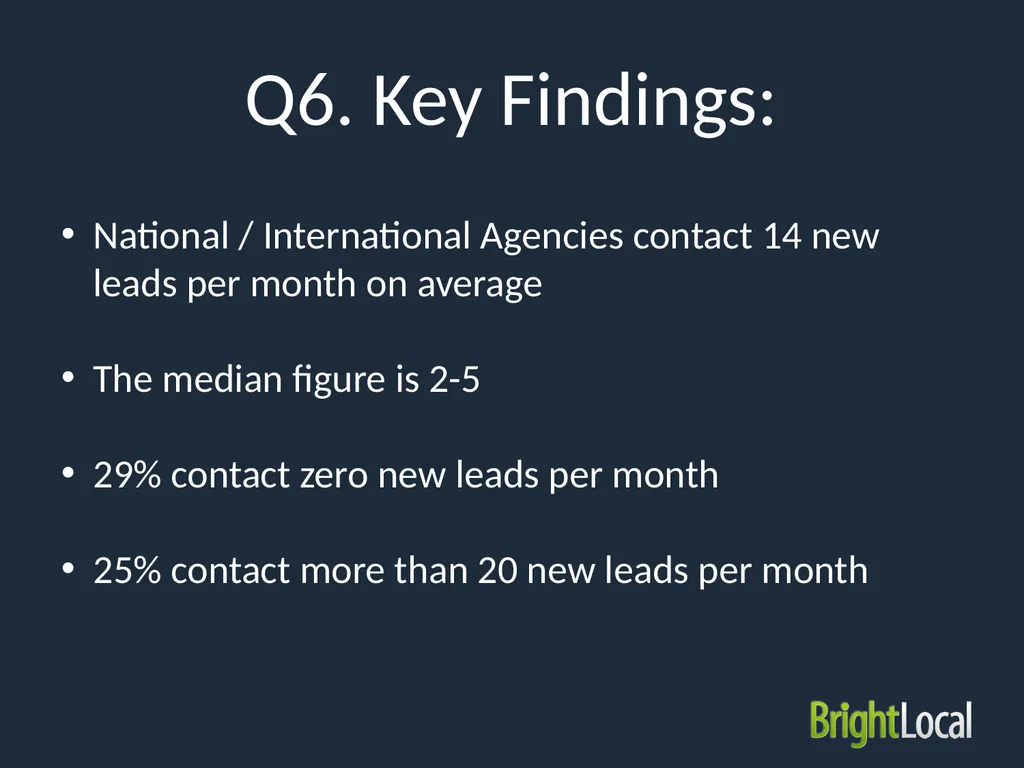
slide14. Q6. Key Findings: National / International Agencies contact 14 new leads per month on average
The median figure is 2-5
29% contact zero new leads per month
25% contact more than 20 new leads per month<br>
slide15. Q7. What is your success rate at converting leads to customers?<br>
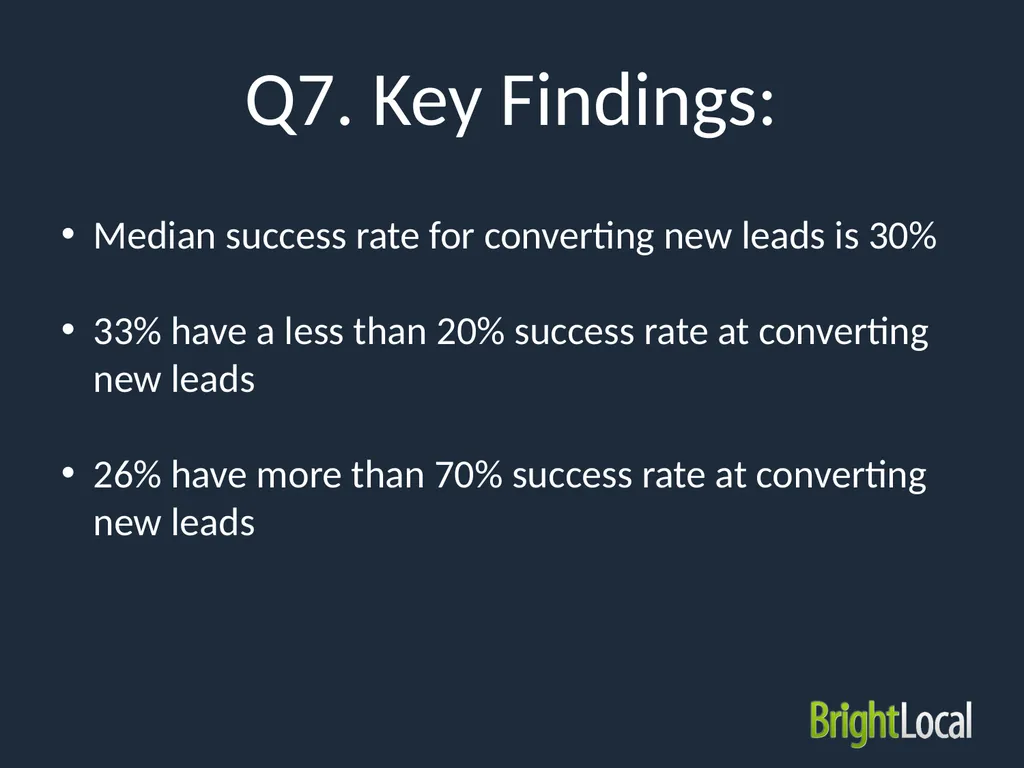
slide16. Q7. Key Findings: Median success rate for converting new leads is 30%
33% have a less than 20% success rate at converting new leads
26% have more than 70% success rate at converting new leads<br>
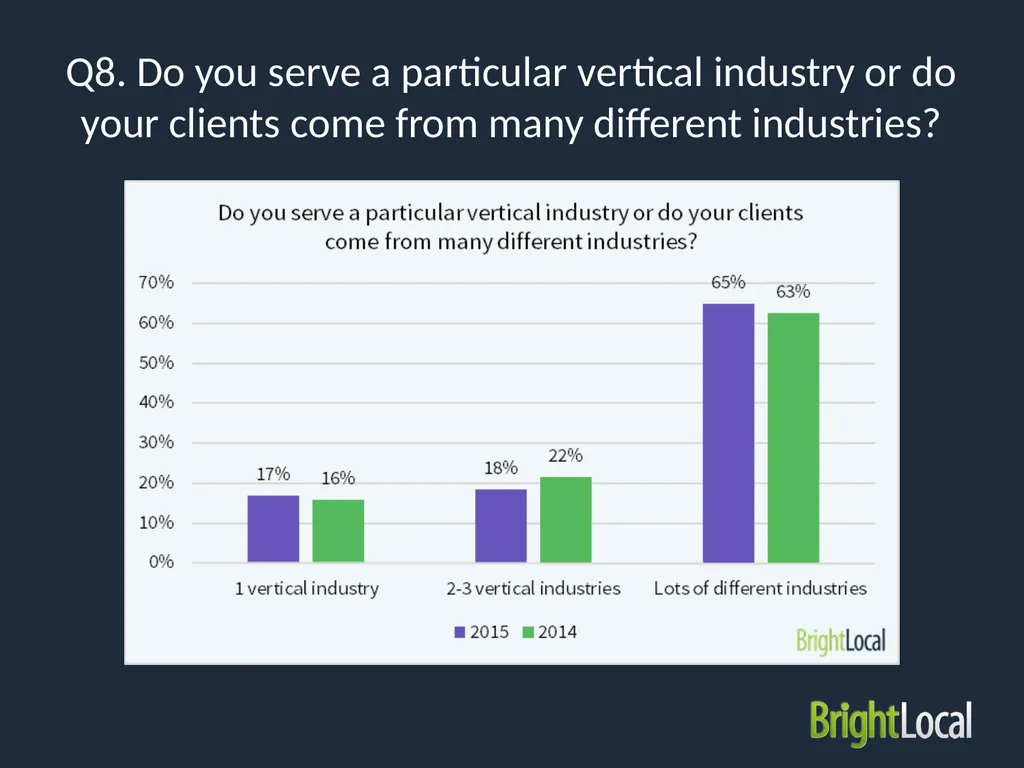
slide17. Q8. Do you serve a particular vertical industry or do your clients come from many different industries?<br>
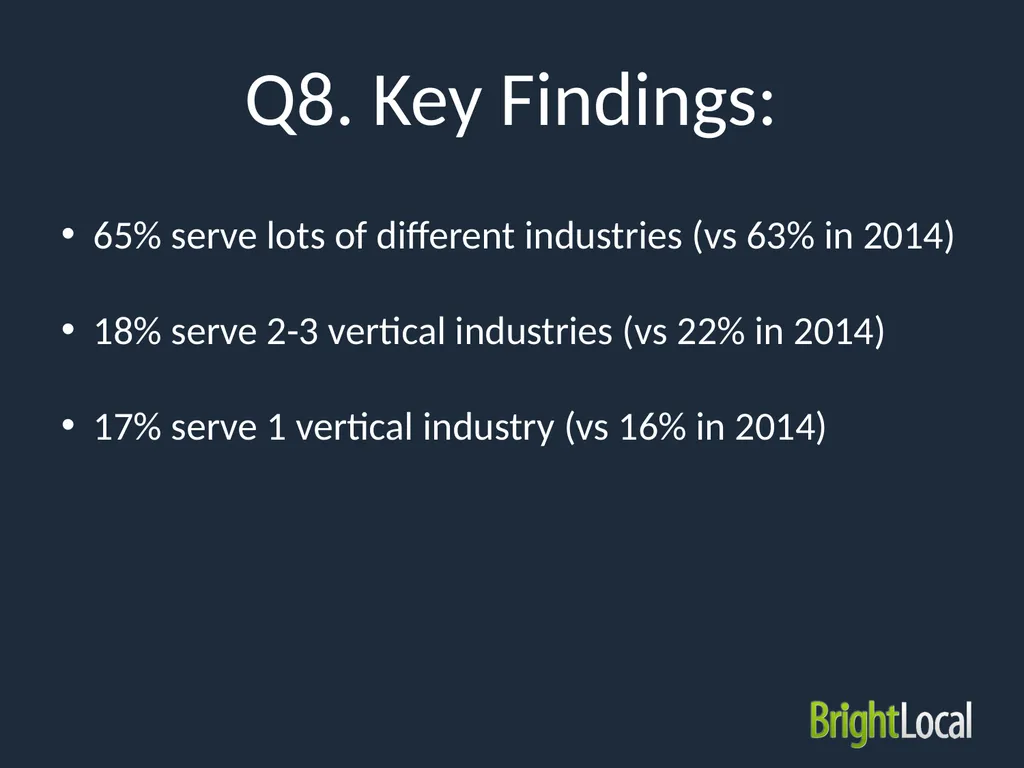
slide18. Q8. Key Findings: 65% serve lots of different industries (vs 63% in 2014)
18% serve 2-3 vertical industries (vs 22% in 2014)
17% serve 1 vertical industry (vs 16% in 2014)<br>
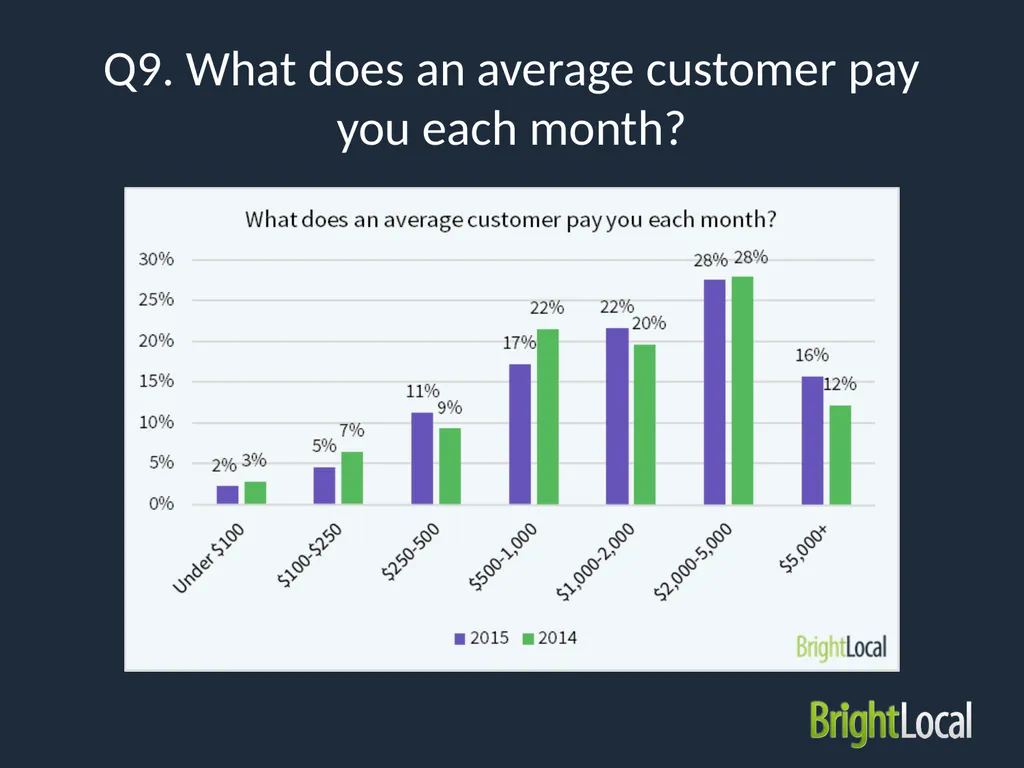
slide19. Q9. What does an average customer pay you each month?<br>
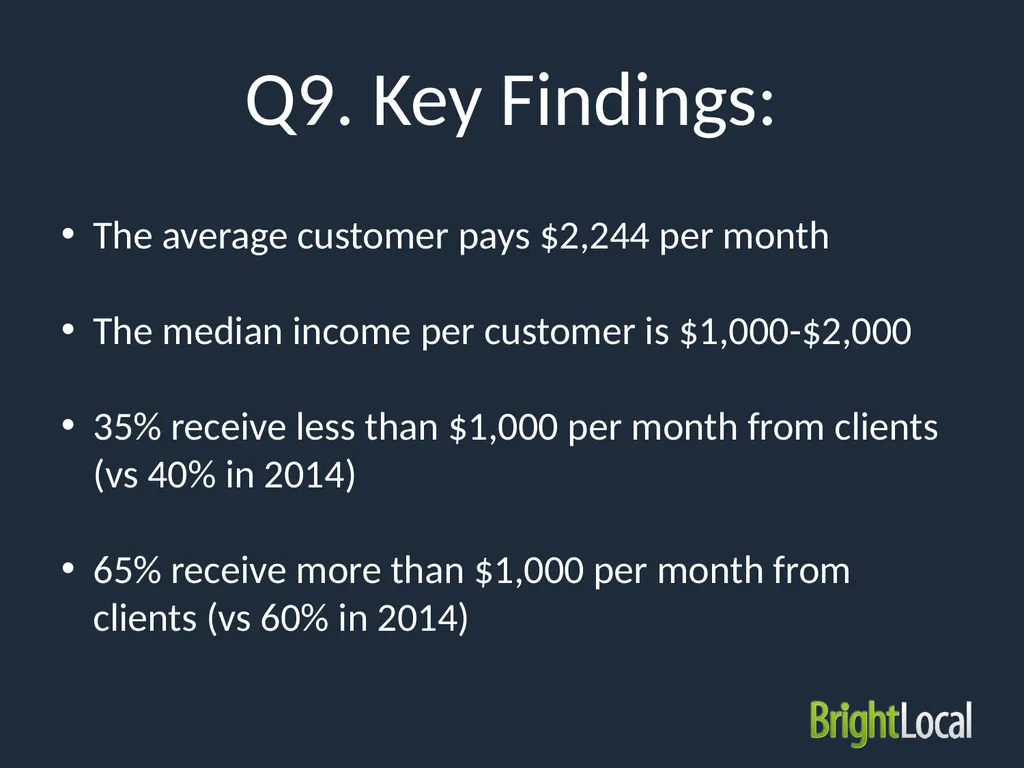
slide20. Q9. Key Findings: The average customer pays $2,244 per month
The median income per customer is $1,000-$2,000
35% receive less than $1,000 per month from clients (vs 40% in 2014)
65% receive more than $1,000 per month from clients (vs 60% in 2014)<br>
slide21. Q10. Do you expect to grow your business in the next 12 months?<br>
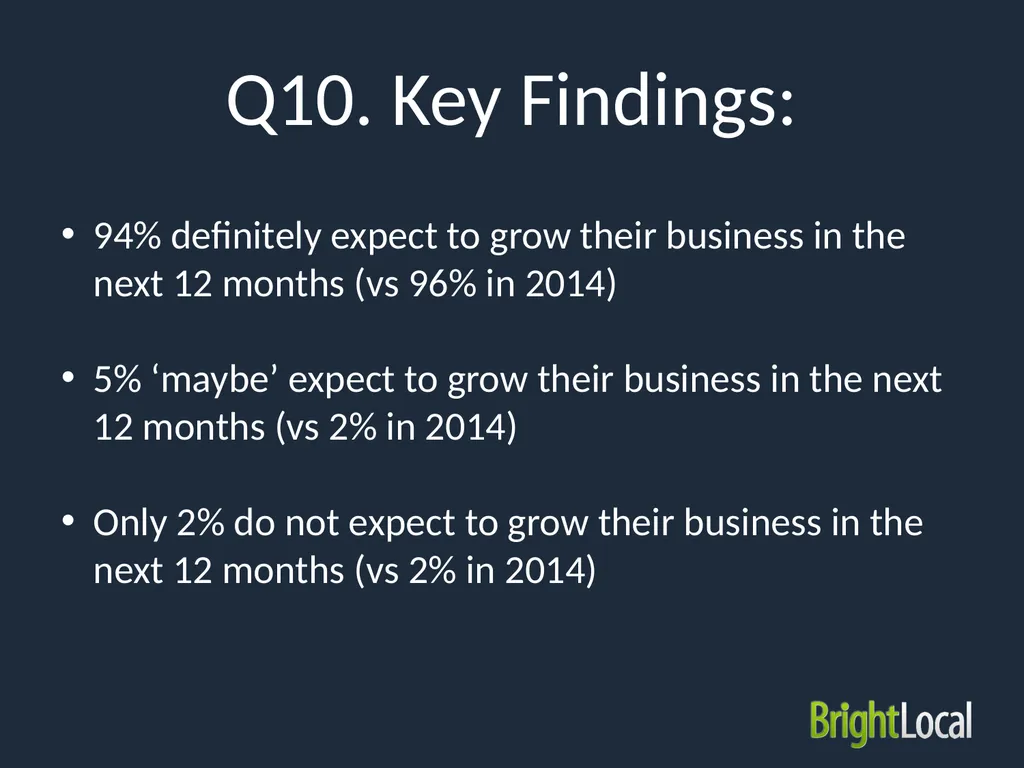
slide22. Q10. Key Findings: 94% definitely expect to grow their business in the next 12 months (vs 96% in 2014)
5% ‘maybe’ expect to grow their business in the next 12 months (vs 2% in 2014)
Only 2% do not expect to grow their business in the next 12 months (vs 2% in 2014)<br>
slide23. Q11. Are you planning to recruit more staff in the next 12 months?<br>
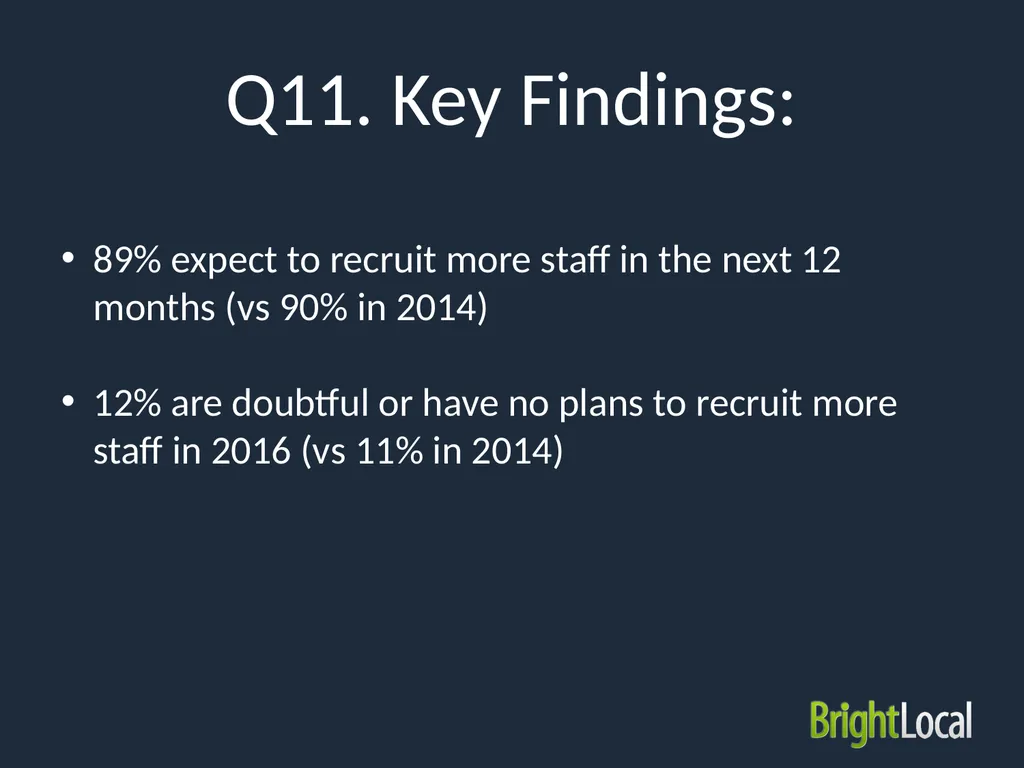
slide24. Q11. Key Findings: 89% expect to recruit more staff in the next 12 months (vs 90% in 2014)
12% are doubtful or have no plans to recruit more staff in 2016 (vs 11% in 2014)<br>
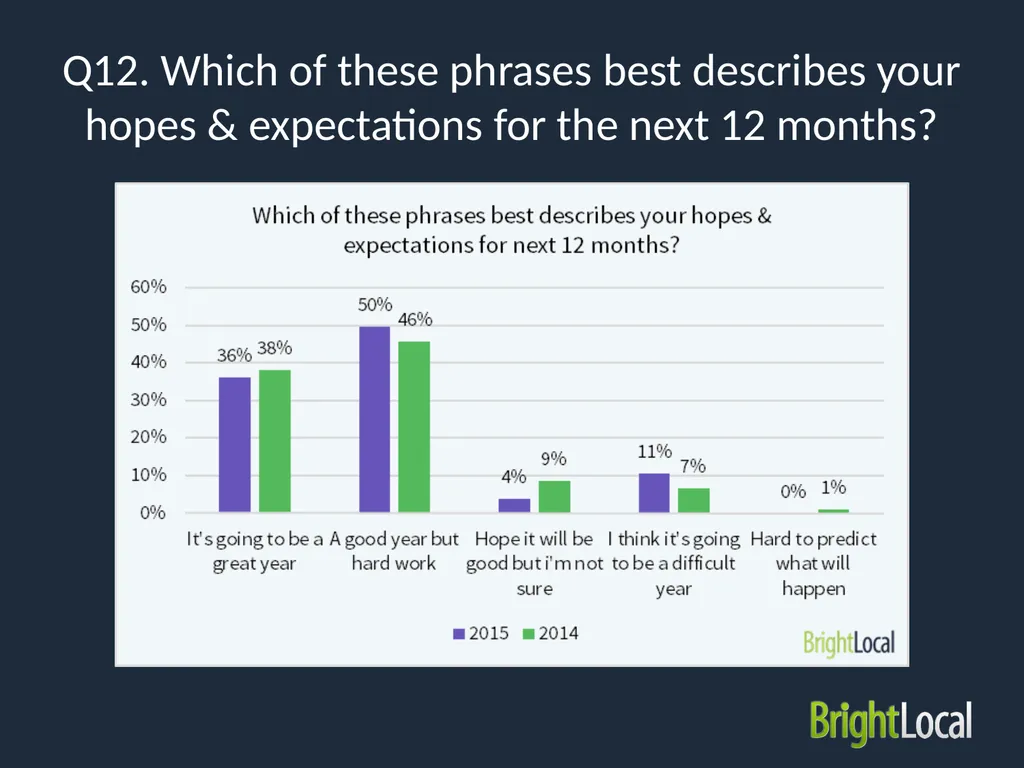
slide25. Q12. Which of these phrases best describes your hopes & expectations for the next 12 months?<br>
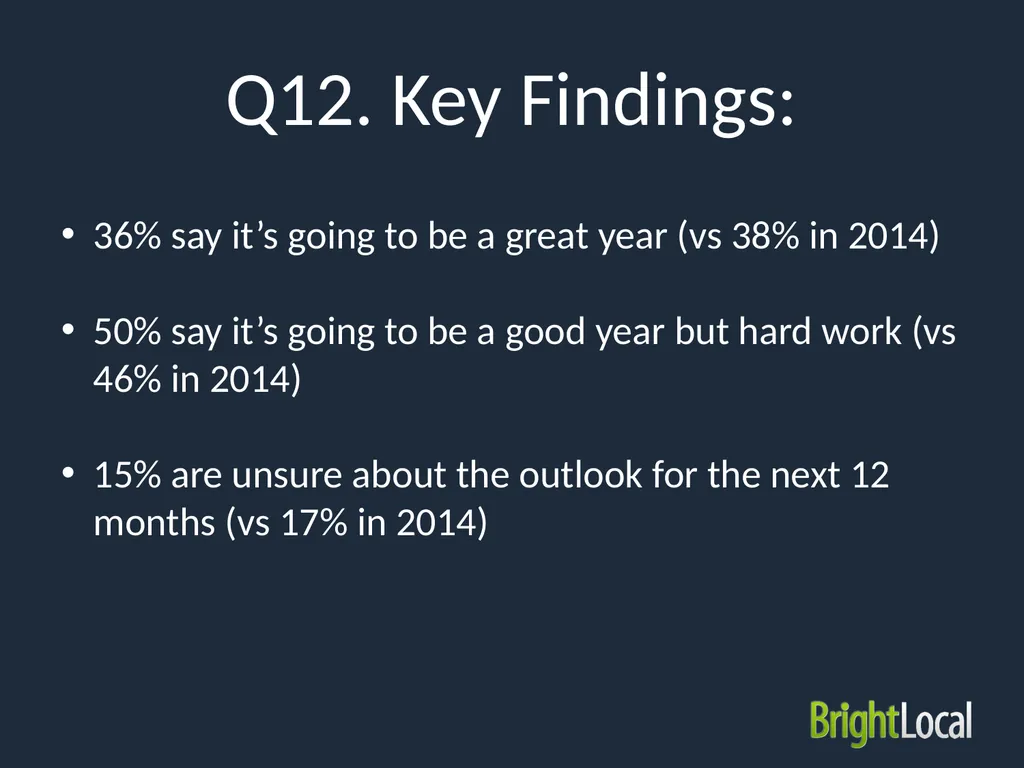
slide26. Q12. Key Findings: 36% say it’s going to be a great year (vs 38% in 2014)
50% say it’s going to be a good year but hard work (vs 46% in 2014)
15% are unsure about the outlook for the next 12 months (vs 17% in 2014)<br>
slide27. Q13. What SEO/online marketing services do you offer?<br>
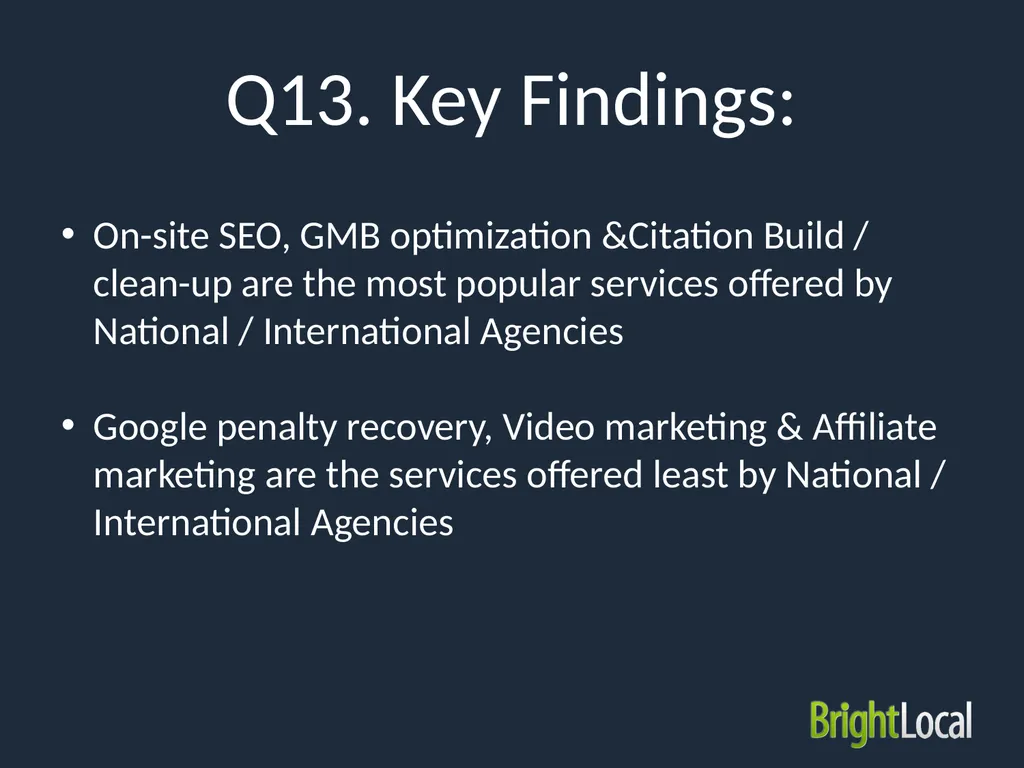
slide28. Q13. Key Findings: On-site SEO, GMB optimization &Citation Build / clean-up are the most popular services offered by National / International Agencies
Google penalty recovery, Video marketing & Affiliate marketing are the services offered least by National / International Agencies<br>
slide29. Q14. Which service is most in demand from your customers?<br>
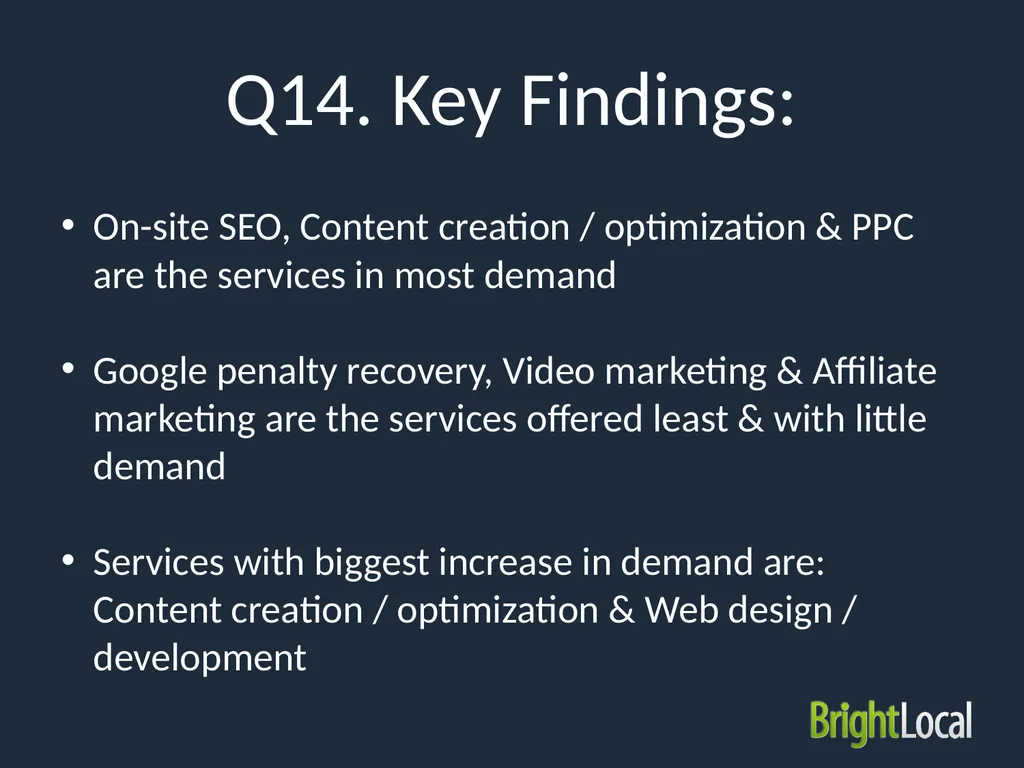
slide30. Q14. Key Findings: On-site SEO, Content creation / optimization & PPC are the services in most demand
Google penalty recovery, Video marketing & Affiliate marketing are the services offered least & with little demand
Services with biggest increase in demand are: Content creation / optimization & Web design / development<br>
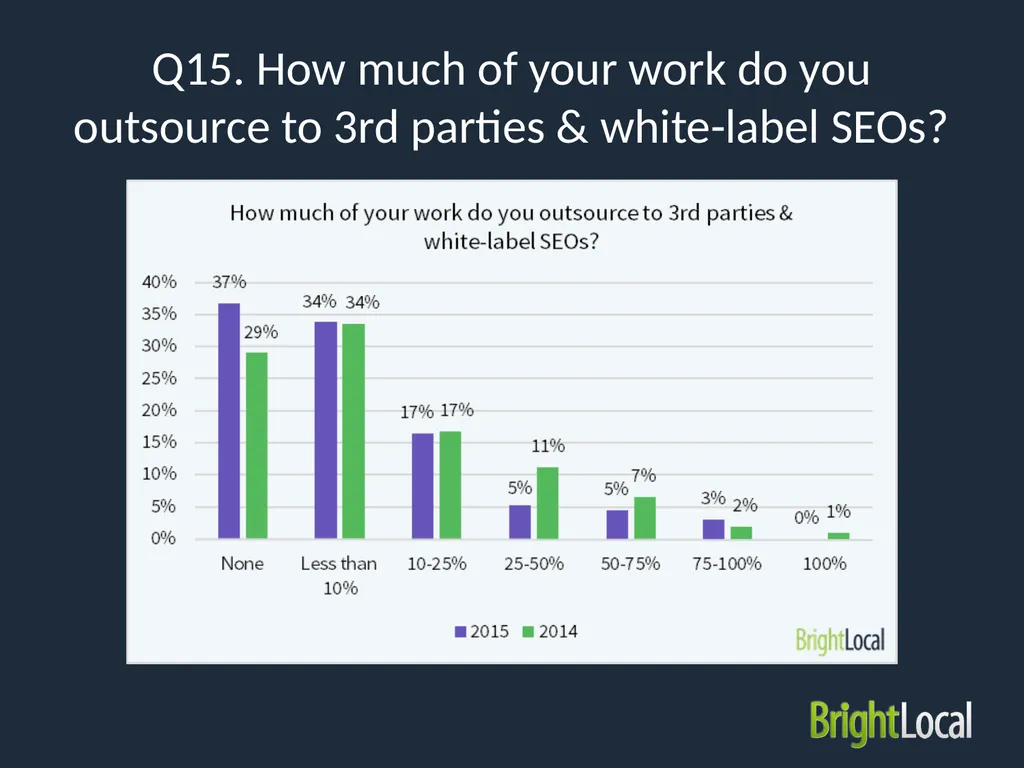
slide31. Q15. How much of your work do you outsource to 3rd parties & white-label SEOs?<br>
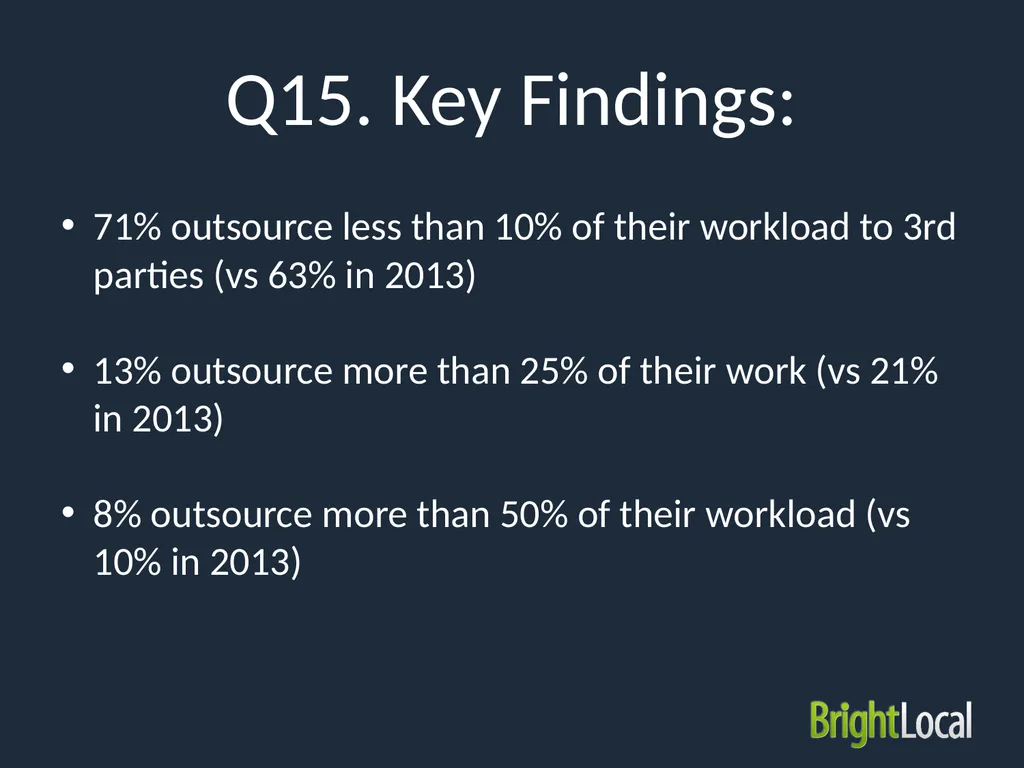
slide32. Q15. Key Findings: 71% outsource less than 10% of their workload to 3rd parties (vs 63% in 2013)
13% outsource more than 25% of their work (vs 21% in 2013)
8% outsource more than 50% of their workload (vs 10% in 2013)<br>
slide33. Q16. Do you believe that Social Media is an effective marketing channel for local businesses?<br>
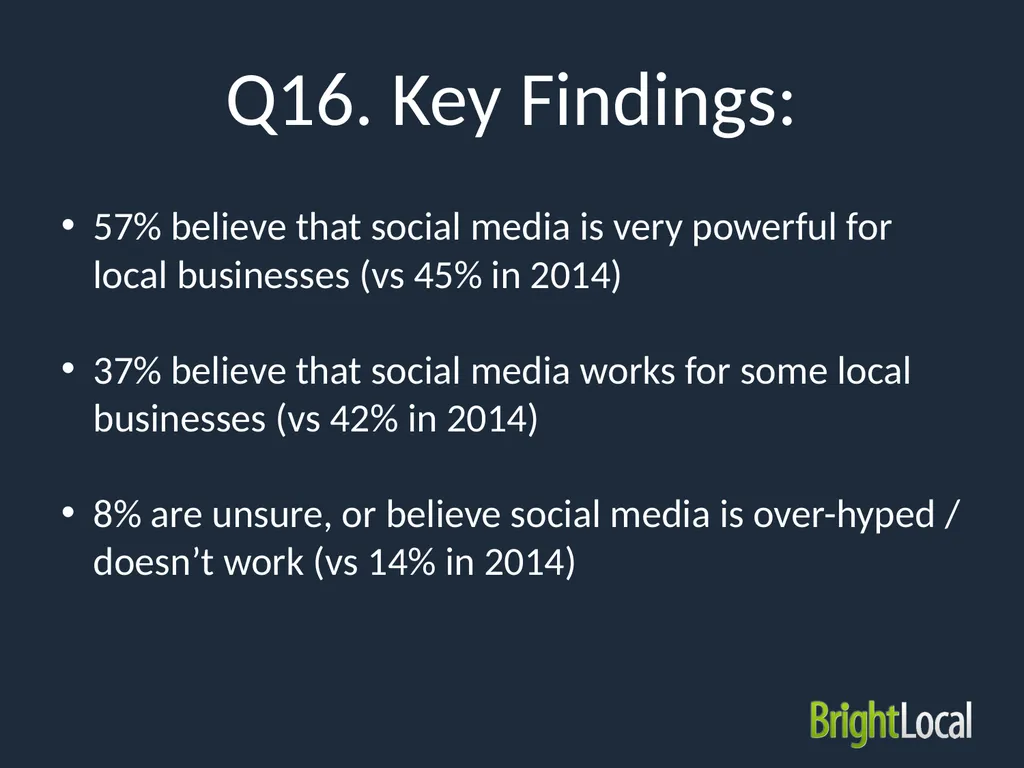
slide34. Q16. Key Findings: 57% believe that social media is very powerful for local businesses (vs 45% in 2014)
37% believe that social media works for some local businesses (vs 42% in 2014)
8% are unsure, or believe social media is over-hyped / doesn’t work (vs 14% in 2014)<br>
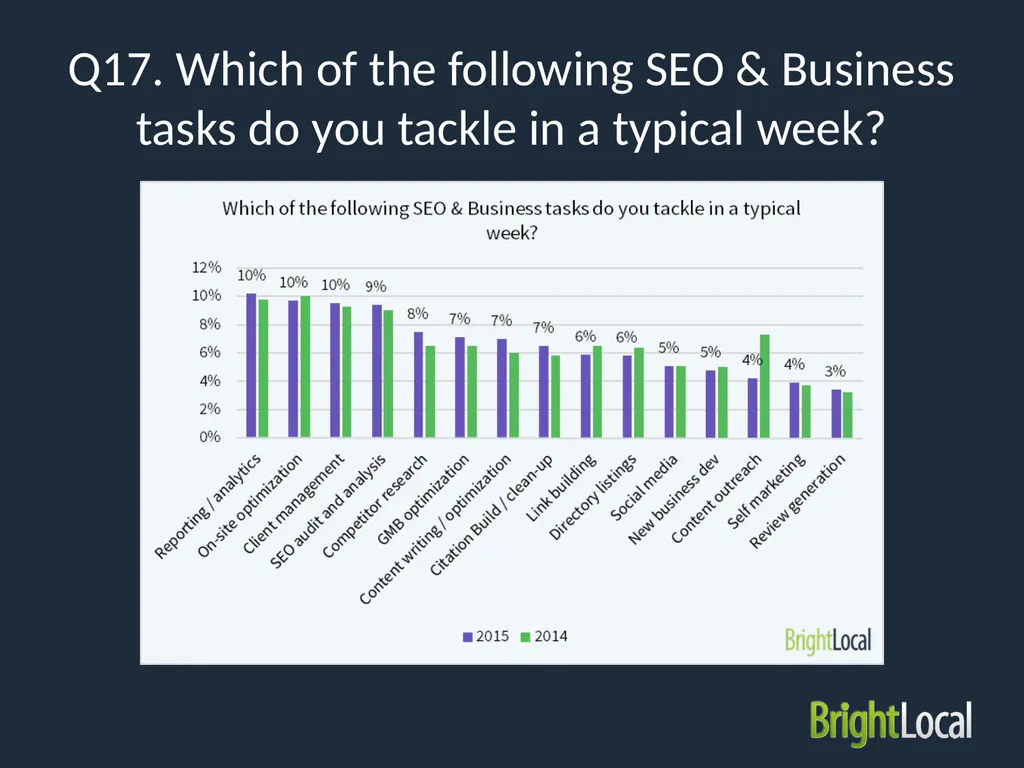
slide35. Q17. Which of the following SEO & Business tasks do you tackle in a typical week?<br>
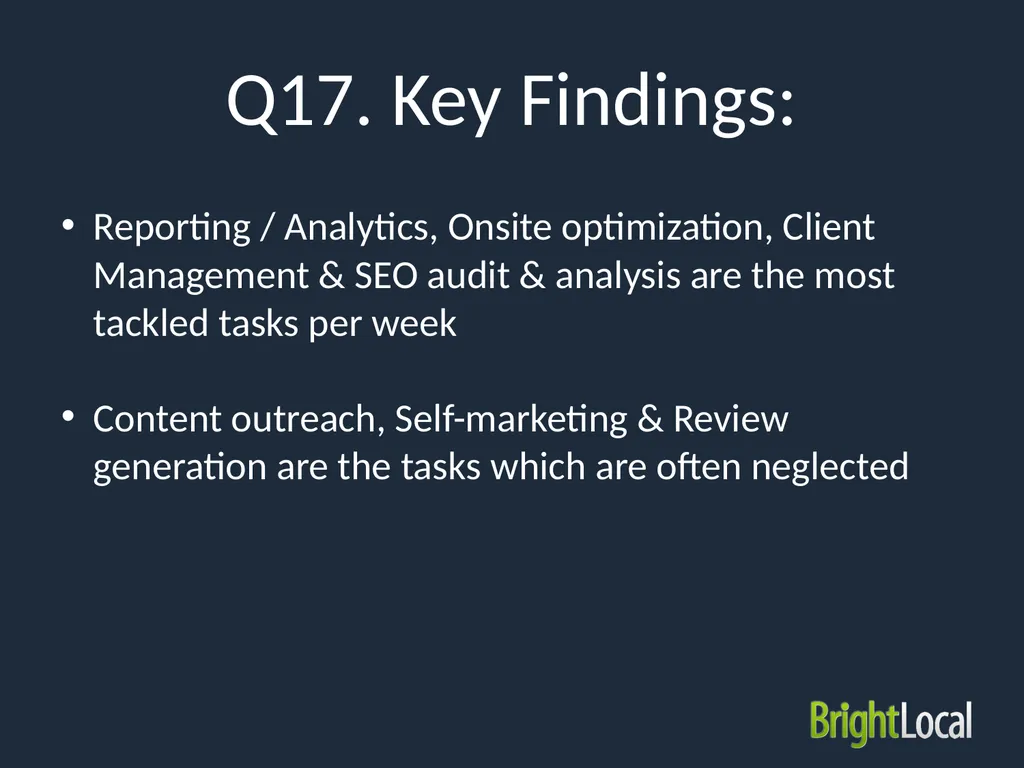
slide36. Q17. Key Findings: Reporting / Analytics, Onsite optimization, Client Management & SEO audit & analysis are the most tackled tasks per week
Content outreach, Self-marketing & Review generation are the tasks which are often neglected<br>
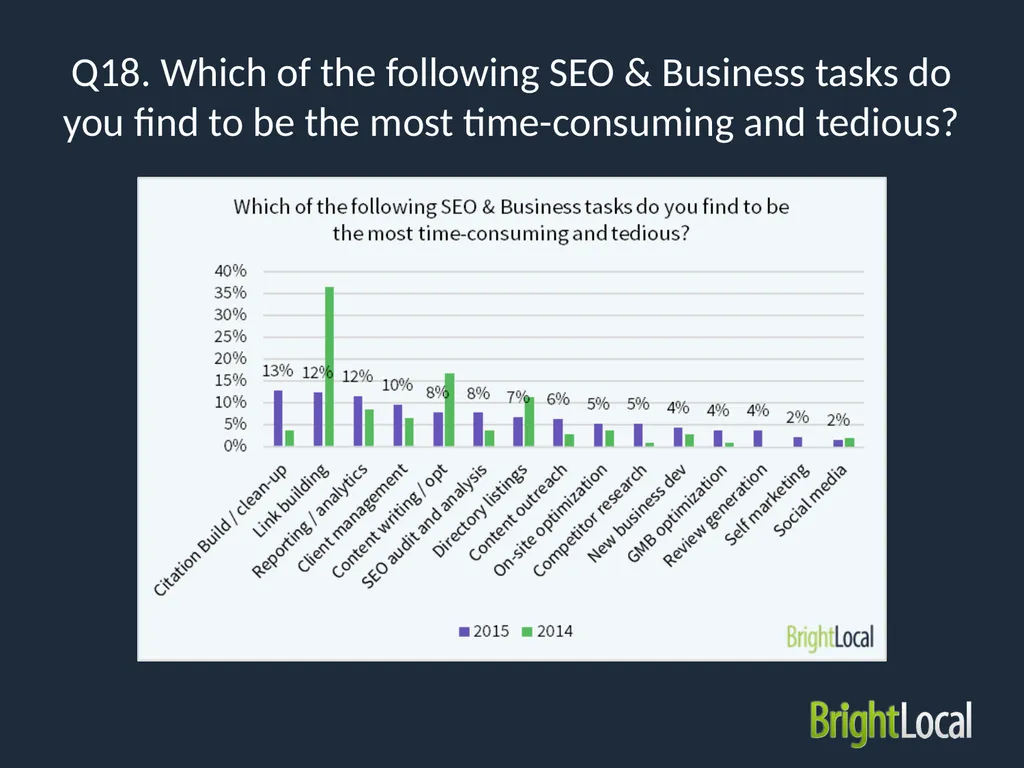
slide37. Q18. Which of the following SEO & Business tasks do you find to be the most time-consuming and tedious?<br>
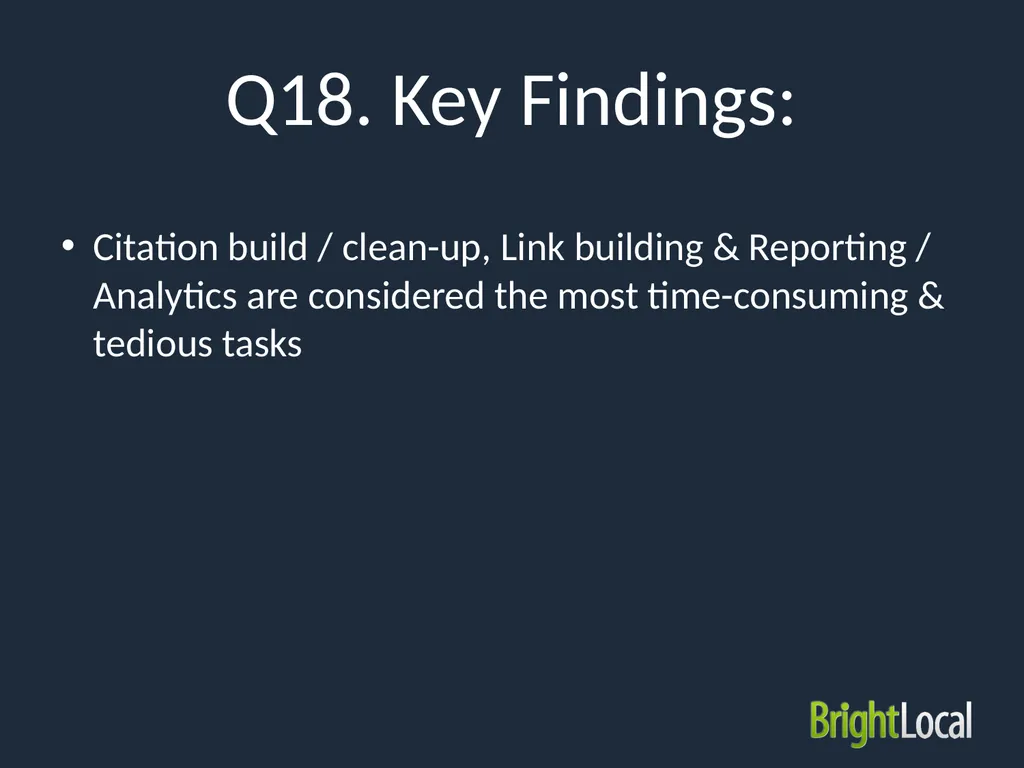
slide38. Q18. Key Findings: Citation build / clean-up, Link building & Reporting / Analytics are considered the most time-consuming & tedious tasks<br>
slide39. Q19. Which of the following SEO & Business tasks do you wish you could do more of?<br>
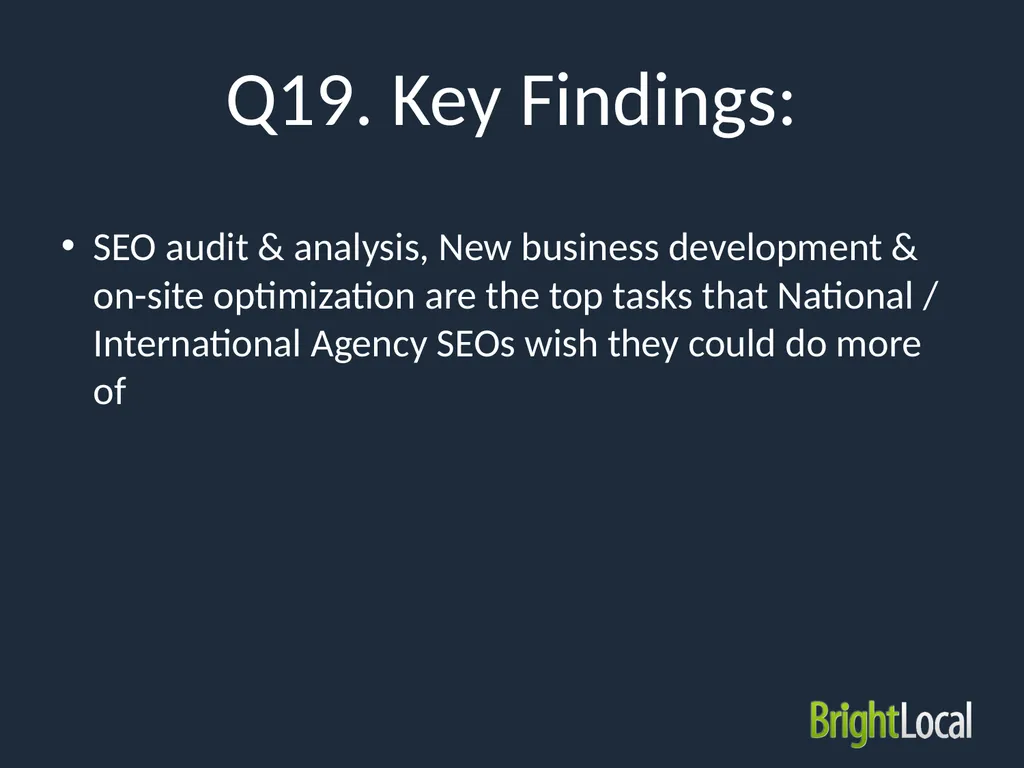
slide40. Q19. Key Findings: SEO audit & analysis, New business development & on-site optimization are the top tasks that National / International Agency SEOs wish they could do more of<br>
slide41. View full survey at: bit.ly/localseosurvey<br>

slide42. Thank you<br>
National / International Agencies<br>
slide2. National / International Agencies =
21% of all survey respondents<br>
slide3. Q1. How many people in your company are ‘SEO’s?<br>
slide4. Q1. Key Findings: The average no. of SEOs employed at a National / International Agency is 7
The median figure is 2-5
83% employ 1-10 SEOs
10% employ 21+ SEOs<br>
slide5. Q2. What was your company revenue in the last 12 months?<br>
slide6. Q2. Key Findings: The average National / International Agency revenue is $584,800
The median figure is $500,000-$1,000,000
Just 20% of National / International Agencies reported revenues of under $150,000
42% reported revenues of more than $1 million<br>
slide7. Q3. How many clients do you personal handle?<br>
slide8. Q3. Key Findings: SEOs at National / International Agencies look after 17 clients on average (vs 15 in 2014)
The median figure is 11-20
57% of SEOs look after 11+ clients (vs 48% in 2014)
29% of SEOs look after 31+ clients (vs 25% in 2014)<br>
slide9. Q4. What are your pre-tax personal annual earnings? (including salary, bonuses, etc.)<br>
slide10. Q4. Key Findings: The average pre-tax annual earnings for a National / International Agency SEO are $83,200
The median figure is $60,000-$75,000
19% are earning more than $100,000 per annum
57% are earning $45,000-$100,000 per annum<br>
slide11. Q5. Which channels are most effective for attracting new customers to your company?<br>
slide12. Q5. Key Findings: Word of mouth is the most effective channel for attracting new customers
SEO is the second most effective channel
Local Business Groups & Outbound Calls are also rated highly<br>
slide13. Q6. How many new leads do you proactively contact each month? (via outbound emails & calls)<br>
slide14. Q6. Key Findings: National / International Agencies contact 14 new leads per month on average
The median figure is 2-5
29% contact zero new leads per month
25% contact more than 20 new leads per month<br>
slide15. Q7. What is your success rate at converting leads to customers?<br>
slide16. Q7. Key Findings: Median success rate for converting new leads is 30%
33% have a less than 20% success rate at converting new leads
26% have more than 70% success rate at converting new leads<br>
slide17. Q8. Do you serve a particular vertical industry or do your clients come from many different industries?<br>
slide18. Q8. Key Findings: 65% serve lots of different industries (vs 63% in 2014)
18% serve 2-3 vertical industries (vs 22% in 2014)
17% serve 1 vertical industry (vs 16% in 2014)<br>
slide19. Q9. What does an average customer pay you each month?<br>
slide20. Q9. Key Findings: The average customer pays $2,244 per month
The median income per customer is $1,000-$2,000
35% receive less than $1,000 per month from clients (vs 40% in 2014)
65% receive more than $1,000 per month from clients (vs 60% in 2014)<br>
slide21. Q10. Do you expect to grow your business in the next 12 months?<br>
slide22. Q10. Key Findings: 94% definitely expect to grow their business in the next 12 months (vs 96% in 2014)
5% ‘maybe’ expect to grow their business in the next 12 months (vs 2% in 2014)
Only 2% do not expect to grow their business in the next 12 months (vs 2% in 2014)<br>
slide23. Q11. Are you planning to recruit more staff in the next 12 months?<br>
slide24. Q11. Key Findings: 89% expect to recruit more staff in the next 12 months (vs 90% in 2014)
12% are doubtful or have no plans to recruit more staff in 2016 (vs 11% in 2014)<br>
slide25. Q12. Which of these phrases best describes your hopes & expectations for the next 12 months?<br>
slide26. Q12. Key Findings: 36% say it’s going to be a great year (vs 38% in 2014)
50% say it’s going to be a good year but hard work (vs 46% in 2014)
15% are unsure about the outlook for the next 12 months (vs 17% in 2014)<br>
slide27. Q13. What SEO/online marketing services do you offer?<br>
slide28. Q13. Key Findings: On-site SEO, GMB optimization &Citation Build / clean-up are the most popular services offered by National / International Agencies
Google penalty recovery, Video marketing & Affiliate marketing are the services offered least by National / International Agencies<br>
slide29. Q14. Which service is most in demand from your customers?<br>
slide30. Q14. Key Findings: On-site SEO, Content creation / optimization & PPC are the services in most demand
Google penalty recovery, Video marketing & Affiliate marketing are the services offered least & with little demand
Services with biggest increase in demand are: Content creation / optimization & Web design / development<br>
slide31. Q15. How much of your work do you outsource to 3rd parties & white-label SEOs?<br>
slide32. Q15. Key Findings: 71% outsource less than 10% of their workload to 3rd parties (vs 63% in 2013)
13% outsource more than 25% of their work (vs 21% in 2013)
8% outsource more than 50% of their workload (vs 10% in 2013)<br>
slide33. Q16. Do you believe that Social Media is an effective marketing channel for local businesses?<br>
slide34. Q16. Key Findings: 57% believe that social media is very powerful for local businesses (vs 45% in 2014)
37% believe that social media works for some local businesses (vs 42% in 2014)
8% are unsure, or believe social media is over-hyped / doesn’t work (vs 14% in 2014)<br>
slide35. Q17. Which of the following SEO & Business tasks do you tackle in a typical week?<br>
slide36. Q17. Key Findings: Reporting / Analytics, Onsite optimization, Client Management & SEO audit & analysis are the most tackled tasks per week
Content outreach, Self-marketing & Review generation are the tasks which are often neglected<br>
slide37. Q18. Which of the following SEO & Business tasks do you find to be the most time-consuming and tedious?<br>
slide38. Q18. Key Findings: Citation build / clean-up, Link building & Reporting / Analytics are considered the most time-consuming & tedious tasks<br>
slide39. Q19. Which of the following SEO & Business tasks do you wish you could do more of?<br>
slide40. Q19. Key Findings: SEO audit & analysis, New business development & on-site optimization are the top tasks that National / International Agency SEOs wish they could do more of<br>
slide41. View full survey at: bit.ly/localseosurvey<br>
slide42. Thank you<br>