
Machine Learning with Python zlyang@smu.edu.sg
Description: Machine Learning with Python zlyangsmu.edu.sg http:www.mysmu.edufacultyzlyang Zhenlin Yang Statistics is the backbone of data science and machine learning. Therefore, to motivate the learning of statistical methods, an overview of
Related Topics
Download Presentation
"Machine Learning with Python zlyang@smu.edu.sg" is the property of its rightful owner. Permission is granted to download and print the materials on this website for personal, non-commercial use only, and to display it on your personal computer provided you do not modify the materials and that you retain all copyright notices contained in the materials. By downloading content from our website, you accept the terms of this agreement.
Presentation Transcript
slide1. Machine Learning with Python zlyang@smu.edu.sg http://www.mysmu.edu/faculty/zlyang/ Zhenlin Yang Statistics is the backbone of data science and machine learning. Therefore, to motivate the learning of statistical methods, an overview of machine learning and Python program language is given.
We will discuss:
Nature of machine learning, common approaches
Machine learning and statistics
Machine learning: Python vs R
Data science: Python vs R
Python machine learning
PySAL: Python Spatial Analysis Library Meta-Package
PyStata: Pyhon and Stata<br>
slide2. 2 Python Installation Python is a free and open-source software. Its homepage is
https://www.python.org/
where a wealth of information is available. We recommend installing the Python distribution Anaconda (also open source), which includes Python plus many tools needed for data analysis.
For more information and installation files, see
https://www.anaconda.com
The main user interface used will be Spyder.
Distributions are available for Windows, Mac, and Linux systems and come in two versions.
The examples are based on the installation of the latest version, Python 3. It is not backwards compatible with Python 2.<br>
slide3. 3 Machine learning approaches have been applied to many fields, where it is too costly to develop algorithms to perform the needed tasks.
ML is known in its application across business problems under the name predictive analytics.
Although not all machine learning is statistically based, computational statistics is an important source of the field's methods.
The term machine learning was coined in 1959 by Arthur Samuel, an IBM employee and pioneer in the field of computer gaming and AI. Machine learning (ML) is a field of study in artificial intelligence (AI) concerned with the development and study of statistical algorithms that can learn from data and generalize to unseen data, and thus perform tasks without explicit instructions. Recently, generative AI have been able to surpass many previous approaches in performance. (https://en.wikipedia.org/wiki/Machine_learning) Machine Learning – An Introduction<br>
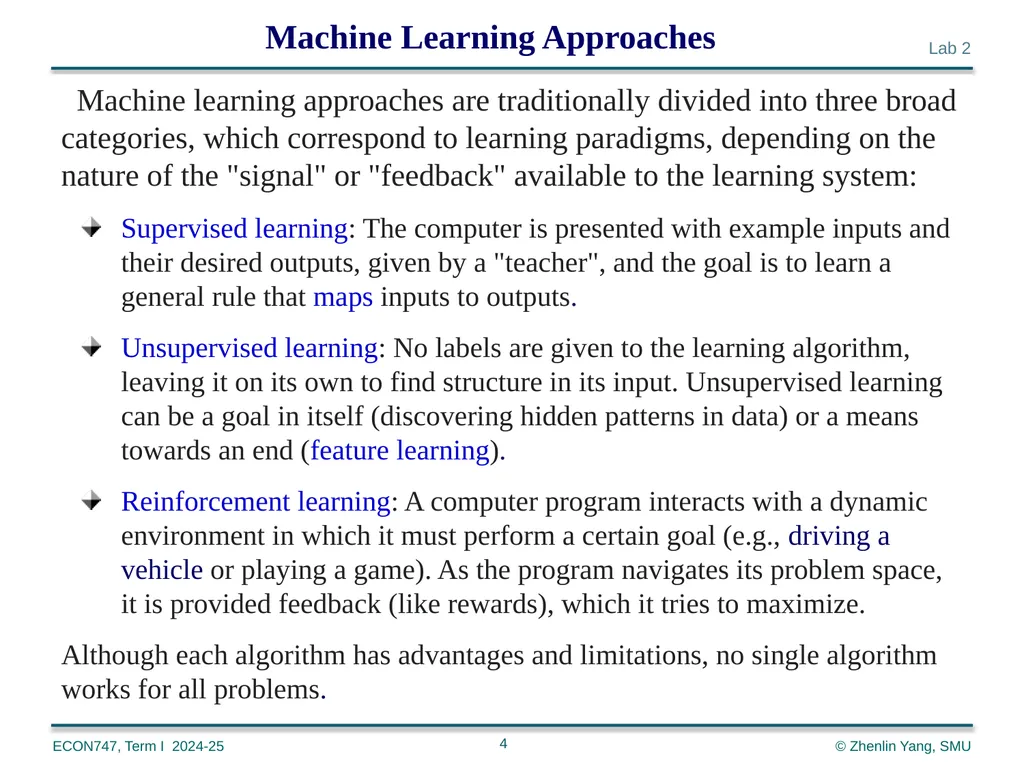
slide4. 4 Machine Learning Approaches Machine learning approaches are traditionally divided into three broad categories, which correspond to learning paradigms, depending on the nature of the "signal" or "feedback" available to the learning system:
Supervised learning: The computer is presented with example inputs and their desired outputs, given by a "teacher", and the goal is to learn a general rule that maps inputs to outputs.
Unsupervised learning: No labels are given to the learning algorithm, leaving it on its own to find structure in its input. Unsupervised learning can be a goal in itself (discovering hidden patterns in data) or a means towards an end (feature learning).
Reinforcement learning: A computer program interacts with a dynamic environment in which it must perform a certain goal (e.g., driving a vehicle or playing a game). As the program navigates its problem space, it is provided feedback (like rewards), which it tries to maximize.
Although each algorithm has advantages and limitations, no single algorithm works for all problems.<br>
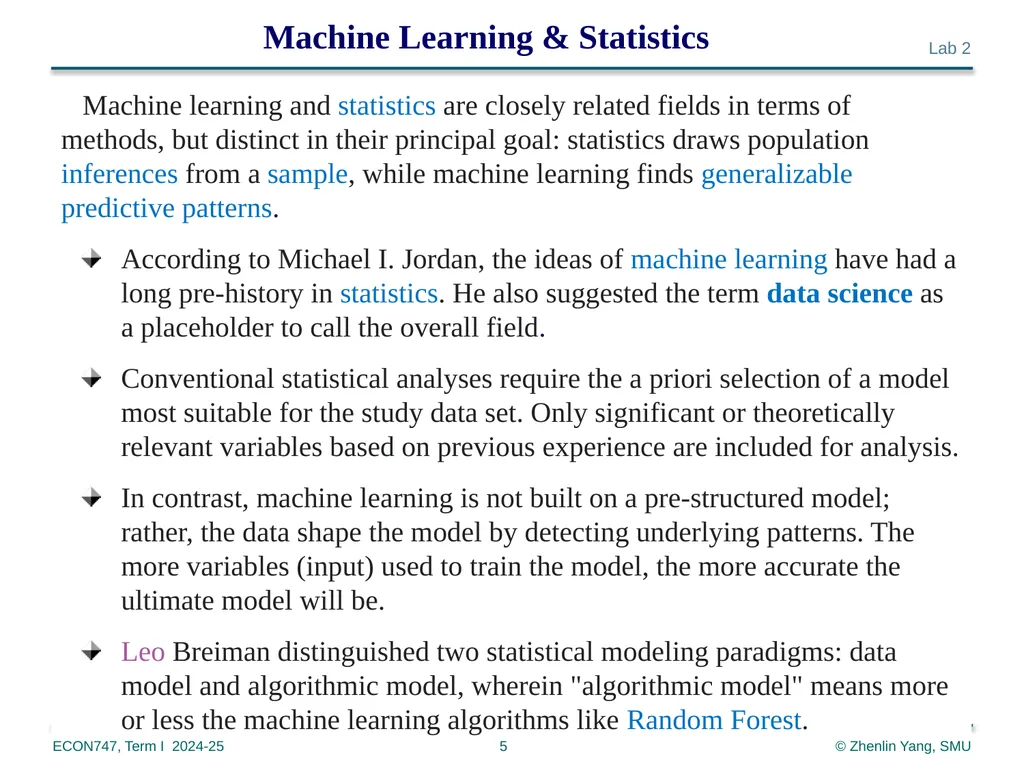
slide5. Machine Learning & Statistics 5 Machine learning and statistics are closely related fields in terms of methods, but distinct in their principal goal: statistics draws population inferences from a sample, while machine learning finds generalizable predictive patterns.
According to Michael I. Jordan, the ideas of machine learning have had a long pre-history in statistics. He also suggested the term data science as a placeholder to call the overall field.
Conventional statistical analyses require the a priori selection of a model most suitable for the study data set. Only significant or theoretically relevant variables based on previous experience are included for analysis.
In contrast, machine learning is not built on a pre-structured model; rather, the data shape the model by detecting underlying patterns. The more variables (input) used to train the model, the more accurate the ultimate model will be.
Leo Breiman distinguished two statistical modeling paradigms: data model and algorithmic model, wherein "algorithmic model" means more or less the machine learning algorithms like Random Forest.<br>
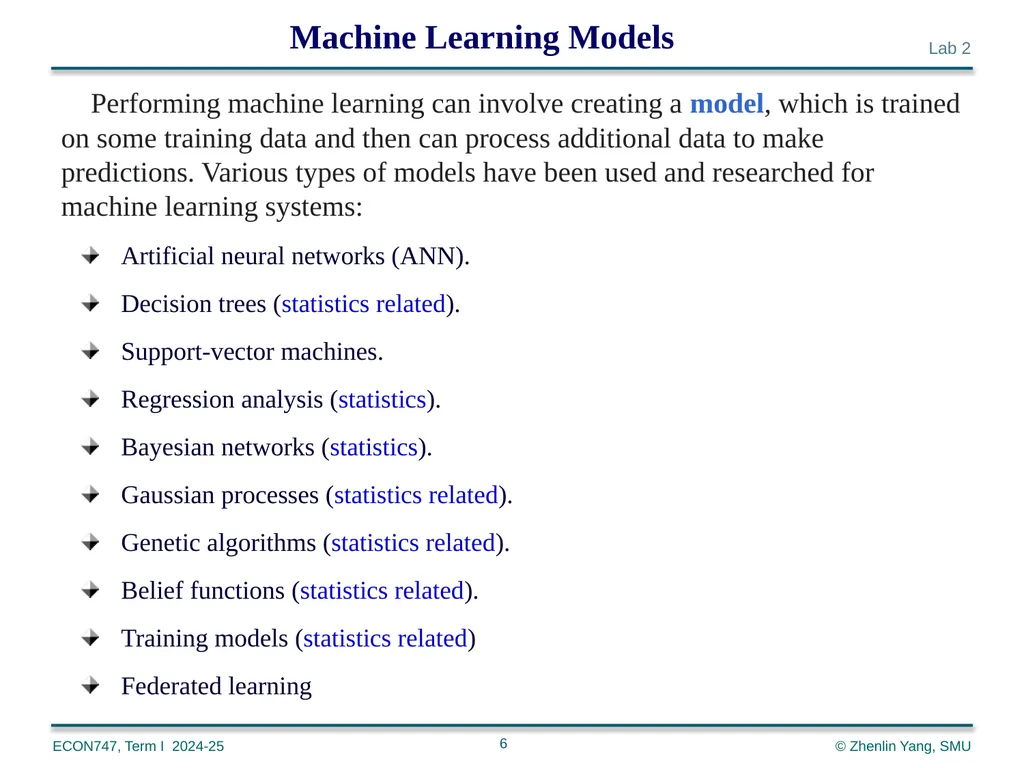
slide6. 6 Machine Learning Models Performing machine learning can involve creating a model, which is trained on some training data and then can process additional data to make predictions. Various types of models have been used and researched for machine learning systems:
Artificial neural networks (ANN).
Decision trees (statistics related).
Support-vector machines.
Regression analysis (statistics).
Bayesian networks (statistics).
Gaussian processes (statistics related).
Genetic algorithms (statistics related).
Belief functions (statistics related).
Training models (statistics related)
Federated learning<br>
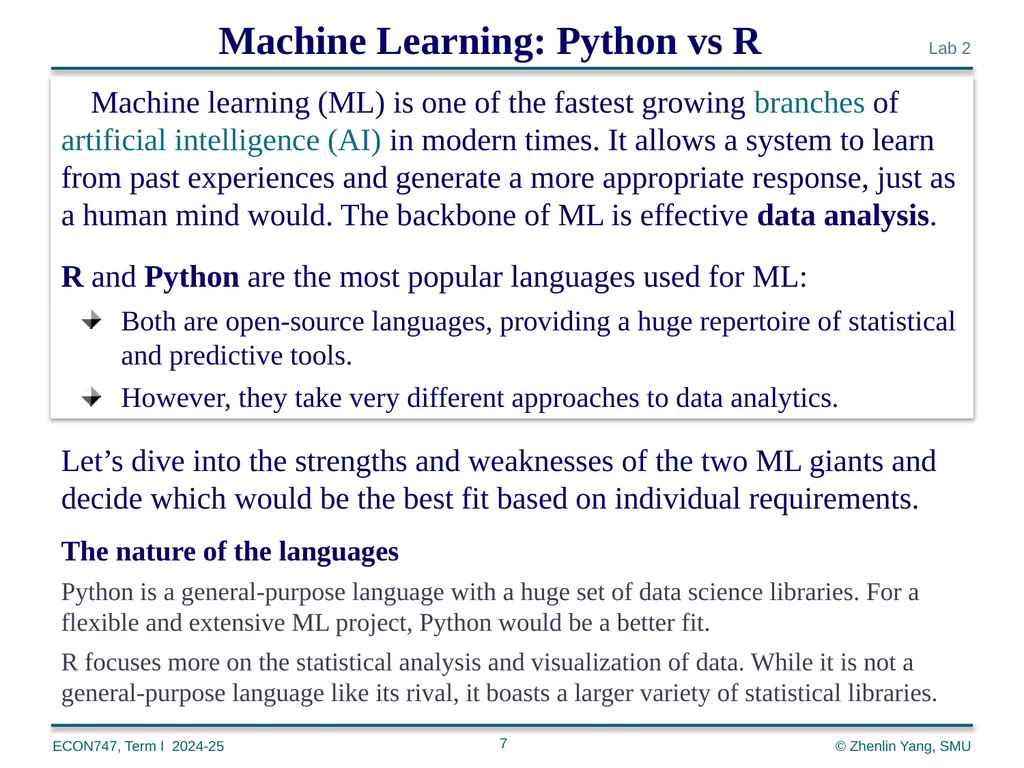
slide7. 7 Machine Learning: Python vs R Machine learning (ML) is one of the fastest growing branches of artificial intelligence (AI) in modern times. It allows a system to learn from past experiences and generate a more appropriate response, just as a human mind would. The backbone of ML is effective data analysis.
R and Python are the most popular languages used for ML:
Both are open-source languages, providing a huge repertoire of statistical and predictive tools.
However, they take very different approaches to data analytics. Let’s dive into the strengths and weaknesses of the two ML giants and decide which would be the best fit based on individual requirements.
The nature of the languages
Python is a general-purpose language with a huge set of data science libraries. For a flexible and extensive ML project, Python would be a better fit.
R focuses more on the statistical analysis and visualization of data. While it is not a general-purpose language like its rival, it boasts a larger variety of statistical libraries.<br>
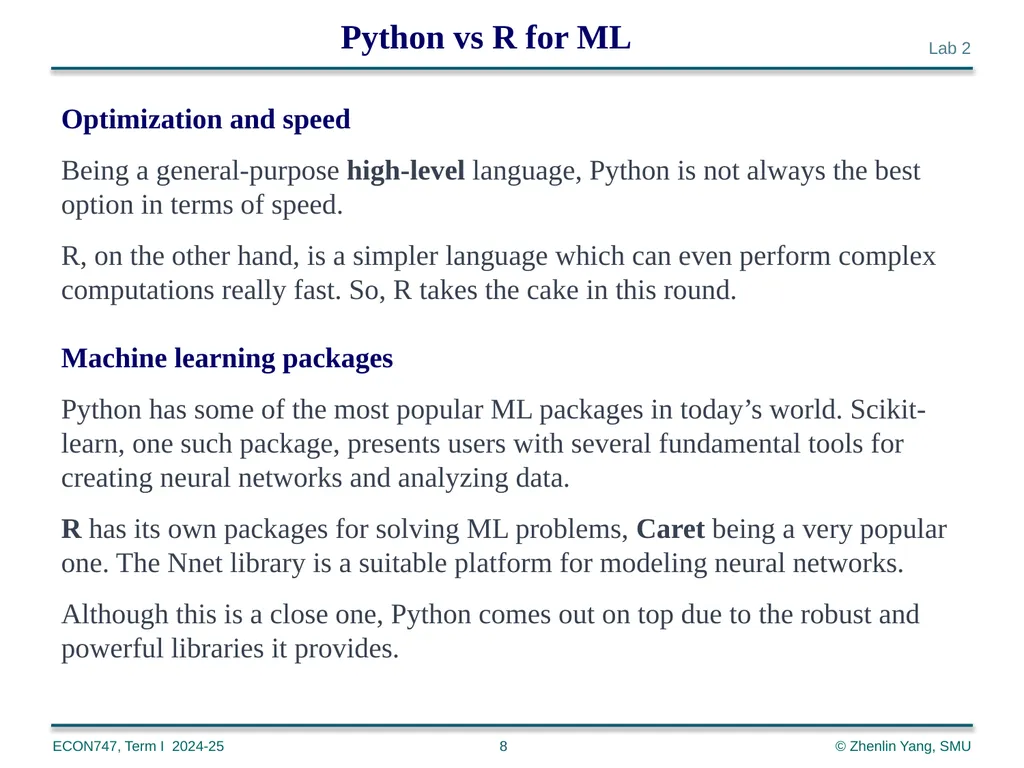
slide8. 8 Python vs R for ML Optimization and speed
Being a general-purpose high-level language, Python is not always the best option in terms of speed.
R, on the other hand, is a simpler language which can even perform complex computations really fast. So, R takes the cake in this round.
Machine learning packages
Python has some of the most popular ML packages in today’s world. Scikit-learn, one such package, presents users with several fundamental tools for creating neural networks and analyzing data.
R has its own packages for solving ML problems, Caret being a very popular one. The Nnet library is a suitable platform for modeling neural networks.
Although this is a close one, Python comes out on top due to the robust and powerful libraries it provides.<br>
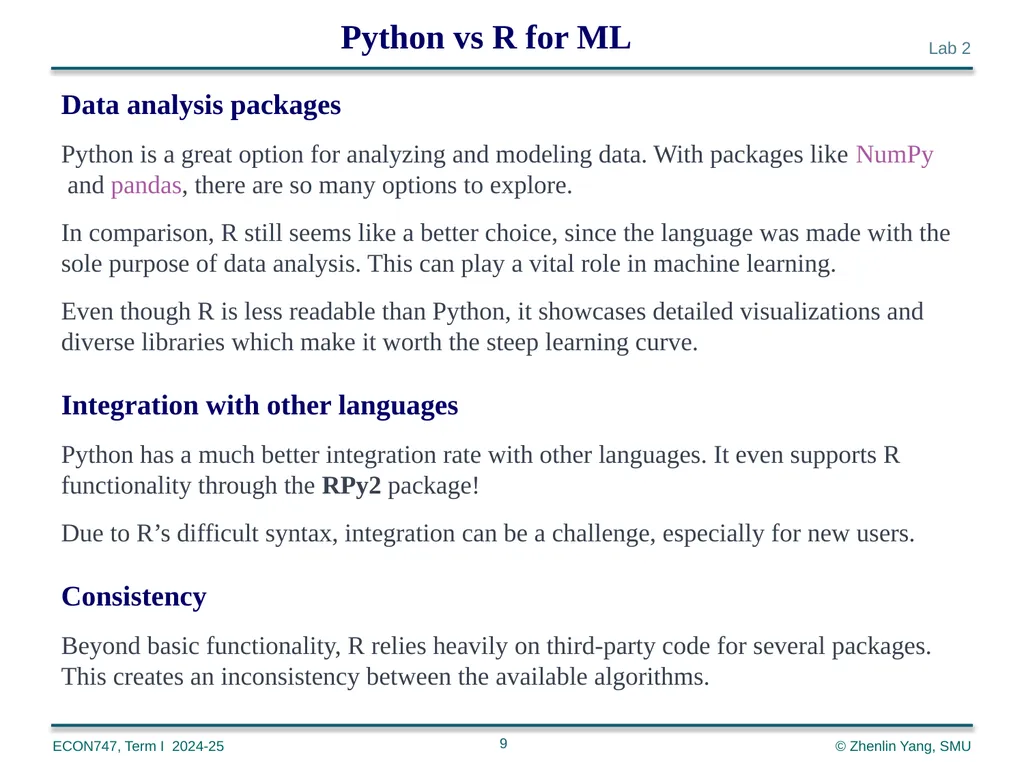
slide9. 9 Data analysis packages
Python is a great option for analyzing and modeling data. With packages like NumPy and pandas, there are so many options to explore.
In comparison, R still seems like a better choice, since the language was made with the sole purpose of data analysis. This can play a vital role in machine learning.
Even though R is less readable than Python, it showcases detailed visualizations and diverse libraries which make it worth the steep learning curve.
Integration with other languages
Python has a much better integration rate with other languages. It even supports R functionality through the RPy2 package!
Due to R’s difficult syntax, integration can be a challenge, especially for new users.
Consistency
Beyond basic functionality, R relies heavily on third-party code for several packages. This creates an inconsistency between the available algorithms. Python vs R for ML<br>
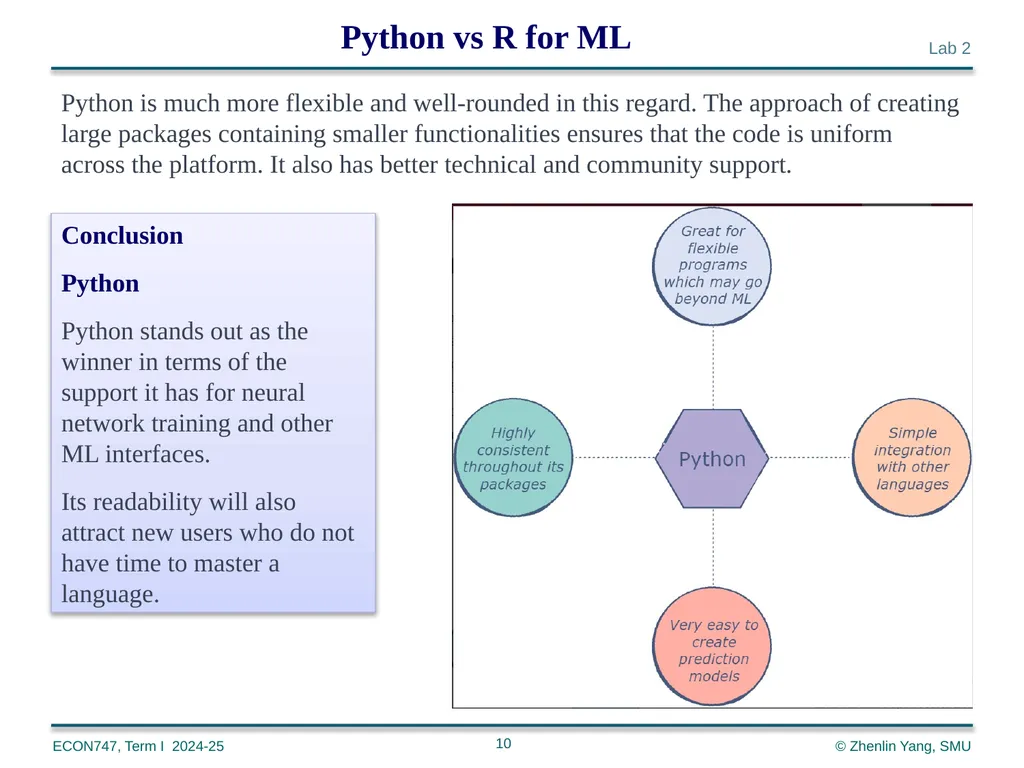
slide10. 10 Python is much more flexible and well-rounded in this regard. The approach of creating large packages containing smaller functionalities ensures that the code is uniform across the platform. It also has better technical and community support. Python vs R for ML Conclusion
Python
Python stands out as the winner in terms of the support it has for neural network training and other ML interfaces.
Its readability will also attract new users who do not have time to master a language.<br>
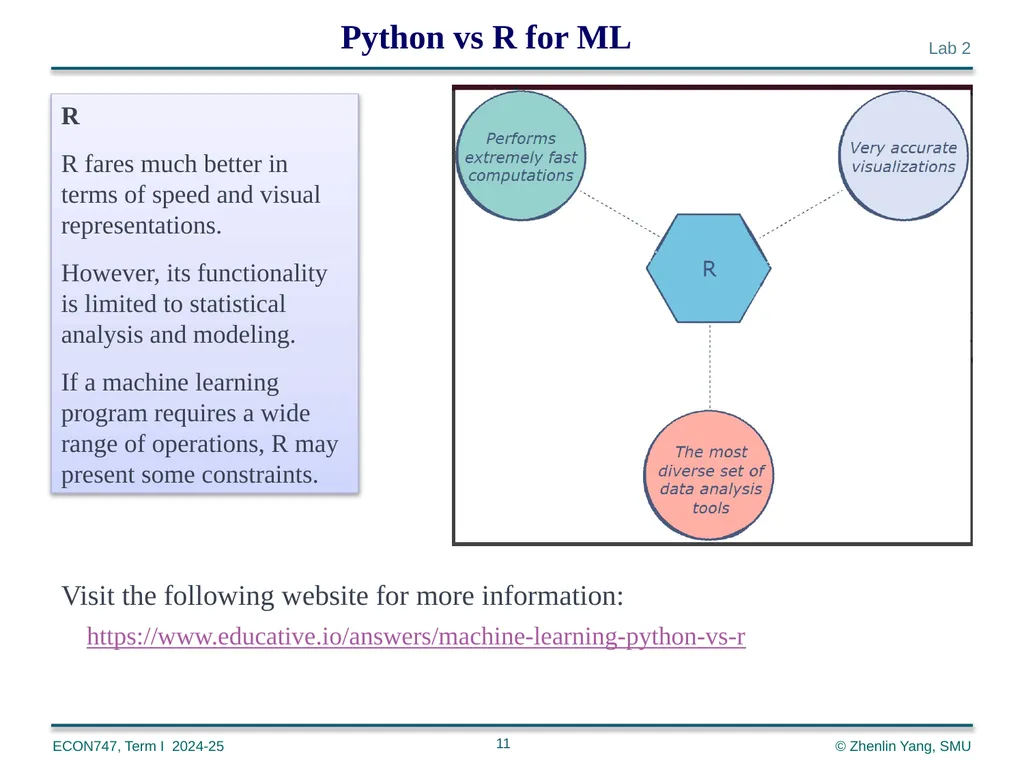
slide11. 11 R
R fares much better in terms of speed and visual representations.
However, its functionality is limited to statistical analysis and modeling.
If a machine learning program requires a wide range of operations, R may present some constraints. Visit the following website for more information:
https://www.educative.io/answers/machine-learning-python-vs-r Python vs R for ML<br>
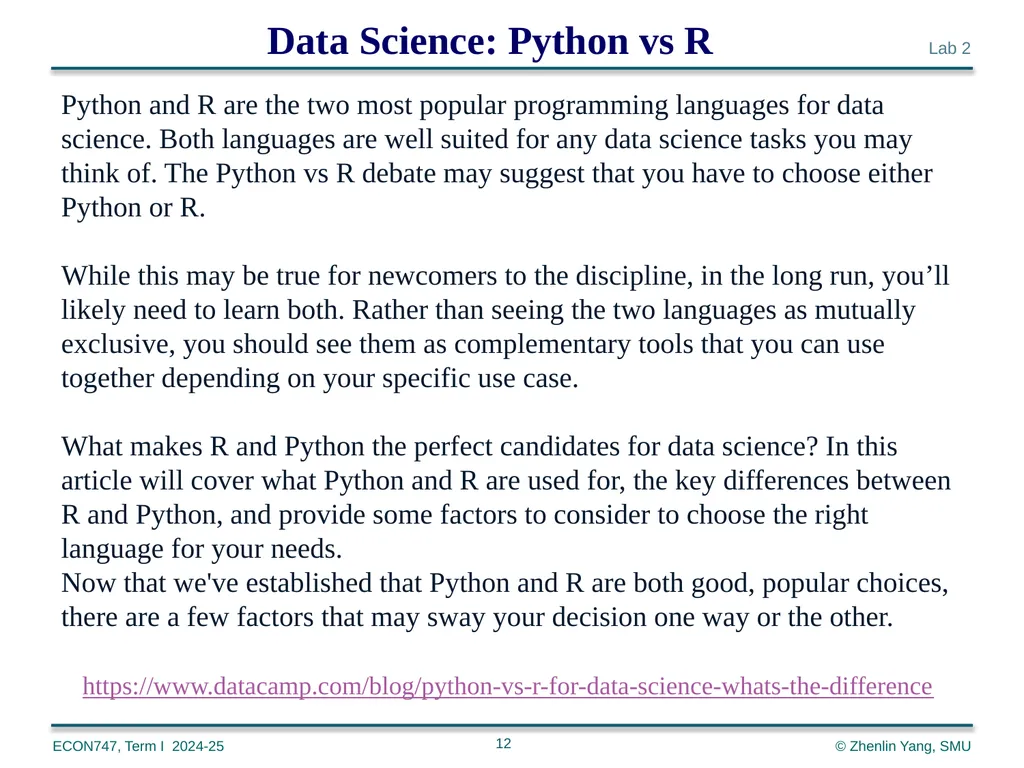
slide12. 12 Data Science: Python vs R Python and R are the two most popular programming languages for data science. Both languages are well suited for any data science tasks you may think of. The Python vs R debate may suggest that you have to choose either Python or R.
While this may be true for newcomers to the discipline, in the long run, you’ll likely need to learn both. Rather than seeing the two languages as mutually exclusive, you should see them as complementary tools that you can use together depending on your specific use case.
What makes R and Python the perfect candidates for data science? In this article will cover what Python and R are used for, the key differences between R and Python, and provide some factors to consider to choose the right language for your needs.
Now that we've established that Python and R are both good, popular choices, there are a few factors that may sway your decision one way or the other.
https://www.datacamp.com/blog/python-vs-r-for-data-science-whats-the-difference<br>
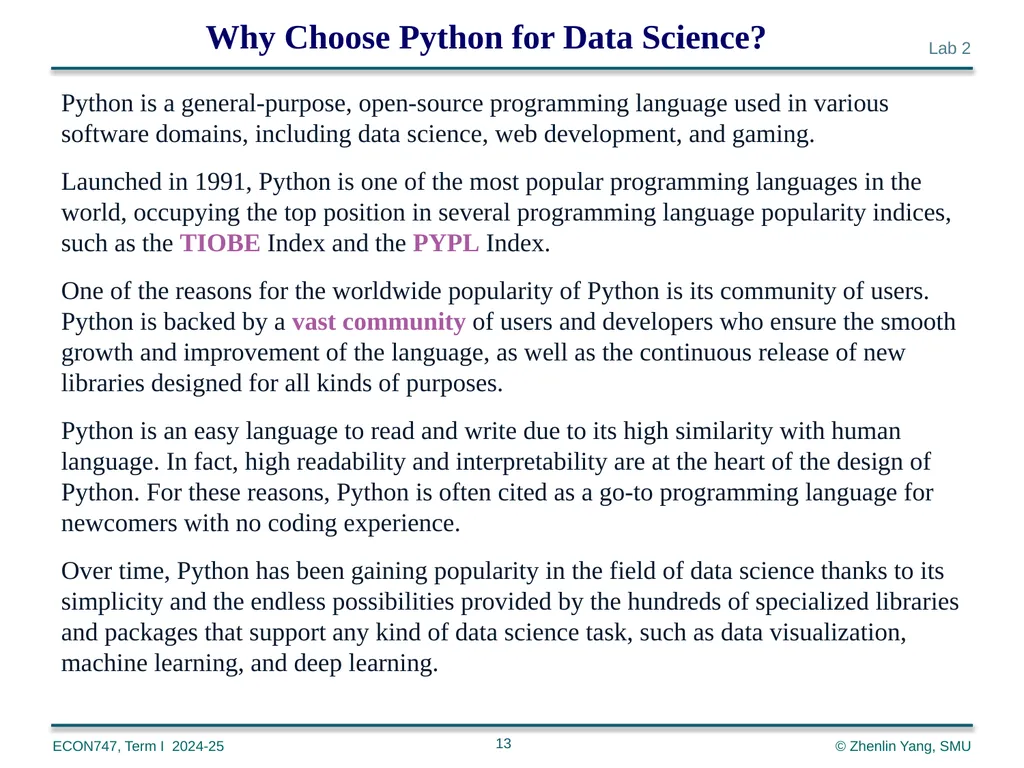
slide13. 13 Why Choose Python for Data Science? Python is a general-purpose, open-source programming language used in various software domains, including data science, web development, and gaming.
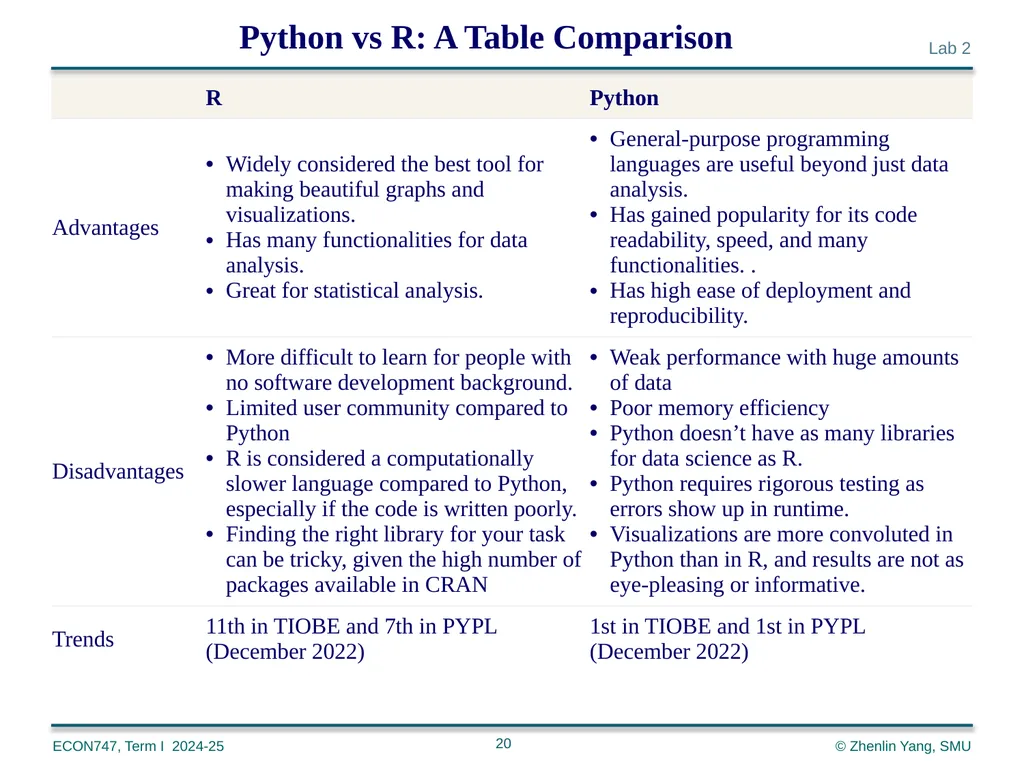
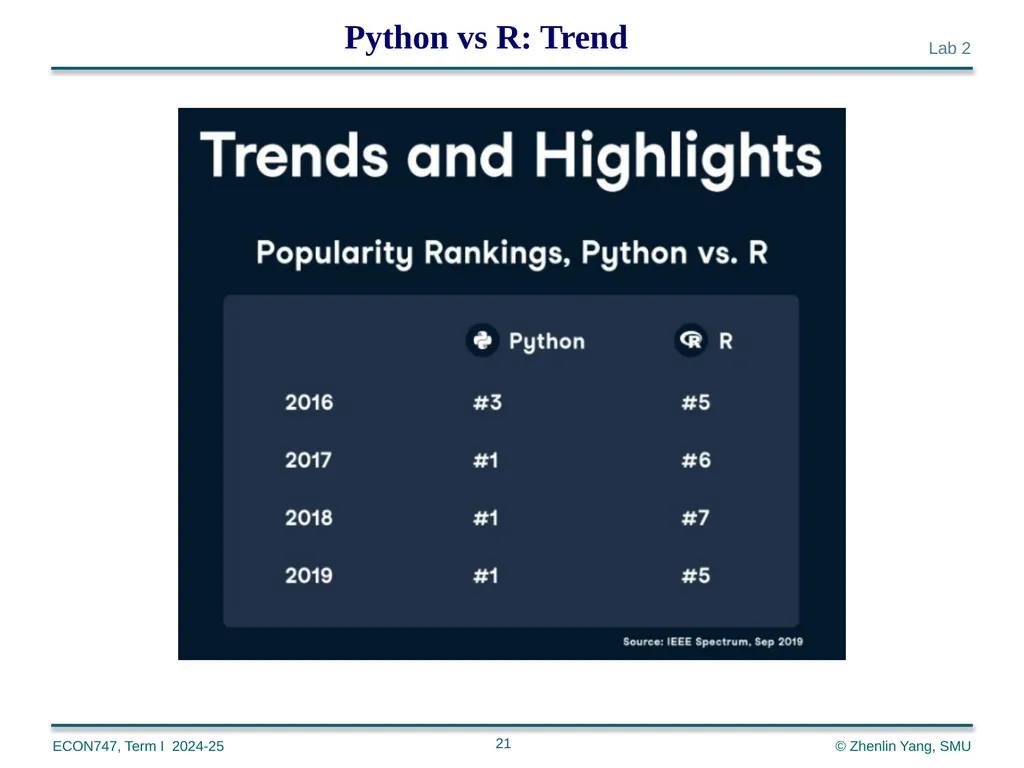
Launched in 1991, Python is one of the most popular programming languages in the world, occupying the top position in several programming language popularity indices, such as the TIOBE Index and the PYPL Index.
One of the reasons for the worldwide popularity of Python is its community of users. Python is backed by a vast community of users and developers who ensure the smooth growth and improvement of the language, as well as the continuous release of new libraries designed for all kinds of purposes.
Python is an easy language to read and write due to its high similarity with human language. In fact, high readability and interpretability are at the heart of the design of Python. For these reasons, Python is often cited as a go-to programming language for newcomers with no coding experience.
Over time, Python has been gaining popularity in the field of data science thanks to its simplicity and the endless possibilities provided by the hundreds of specialized libraries and packages that support any kind of data science task, such as data visualization, machine learning, and deep learning.<br>
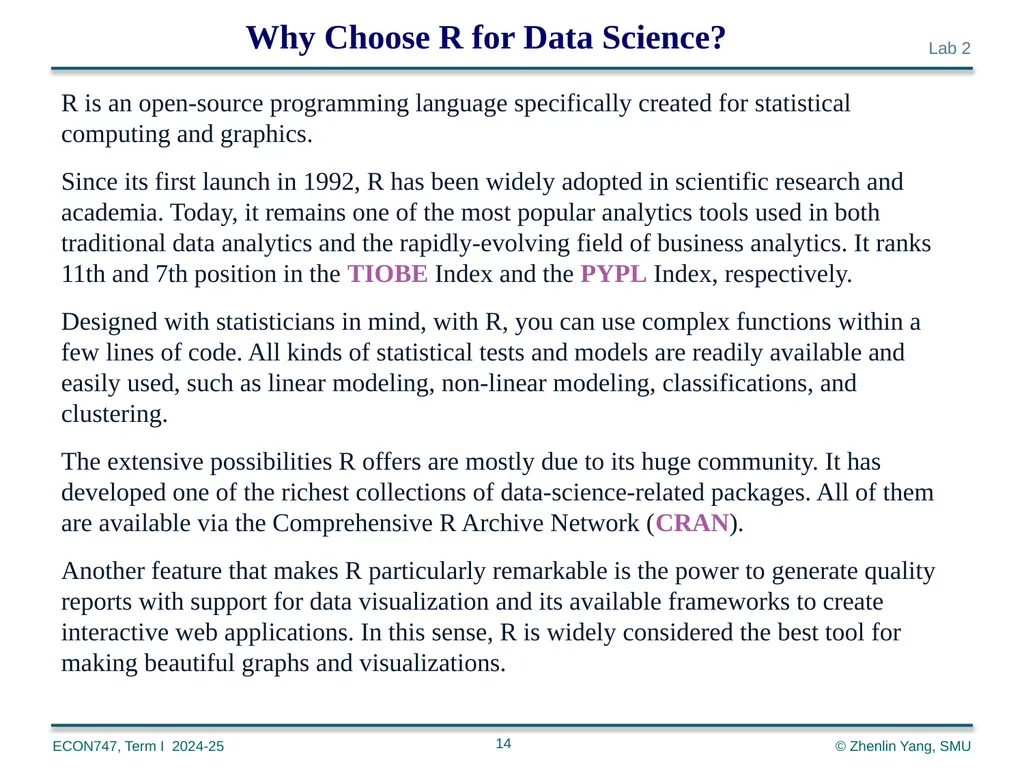
slide14. 14 Why Choose R for Data Science? R is an open-source programming language specifically created for statistical computing and graphics.
Since its first launch in 1992, R has been widely adopted in scientific research and academia. Today, it remains one of the most popular analytics tools used in both traditional data analytics and the rapidly-evolving field of business analytics. It ranks 11th and 7th position in the TIOBE Index and the PYPL Index, respectively.
Designed with statisticians in mind, with R, you can use complex functions within a few lines of code. All kinds of statistical tests and models are readily available and easily used, such as linear modeling, non-linear modeling, classifications, and clustering.
The extensive possibilities R offers are mostly due to its huge community. It has developed one of the richest collections of data-science-related packages. All of them are available via the Comprehensive R Archive Network (CRAN).
Another feature that makes R particularly remarkable is the power to generate quality reports with support for data visualization and its available frameworks to create interactive web applications. In this sense, R is widely considered the best tool for making beautiful graphs and visualizations.<br>
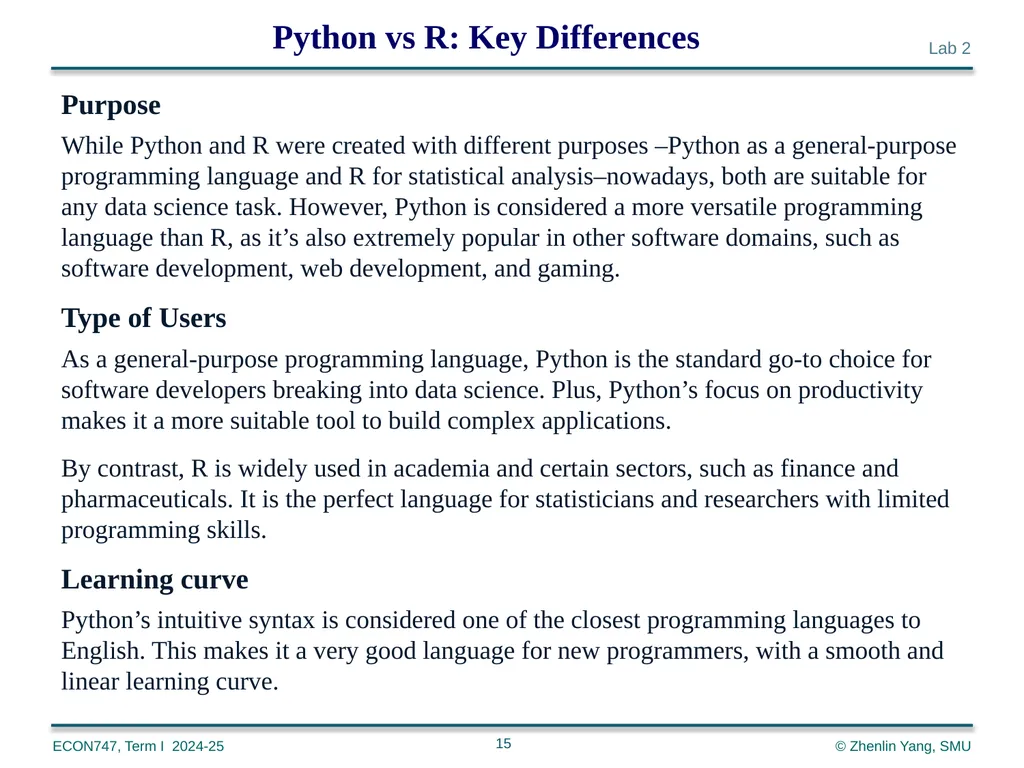
slide15. 15 Python vs R: Key Differences Purpose
While Python and R were created with different purposes –Python as a general-purpose programming language and R for statistical analysis–nowadays, both are suitable for any data science task. However, Python is considered a more versatile programming language than R, as it’s also extremely popular in other software domains, such as software development, web development, and gaming.
Type of Users
As a general-purpose programming language, Python is the standard go-to choice for software developers breaking into data science. Plus, Python’s focus on productivity makes it a more suitable tool to build complex applications.
By contrast, R is widely used in academia and certain sectors, such as finance and pharmaceuticals. It is the perfect language for statisticians and researchers with limited programming skills.
Learning curve
Python’s intuitive syntax is considered one of the closest programming languages to English. This makes it a very good language for new programmers, with a smooth and linear learning curve.<br>
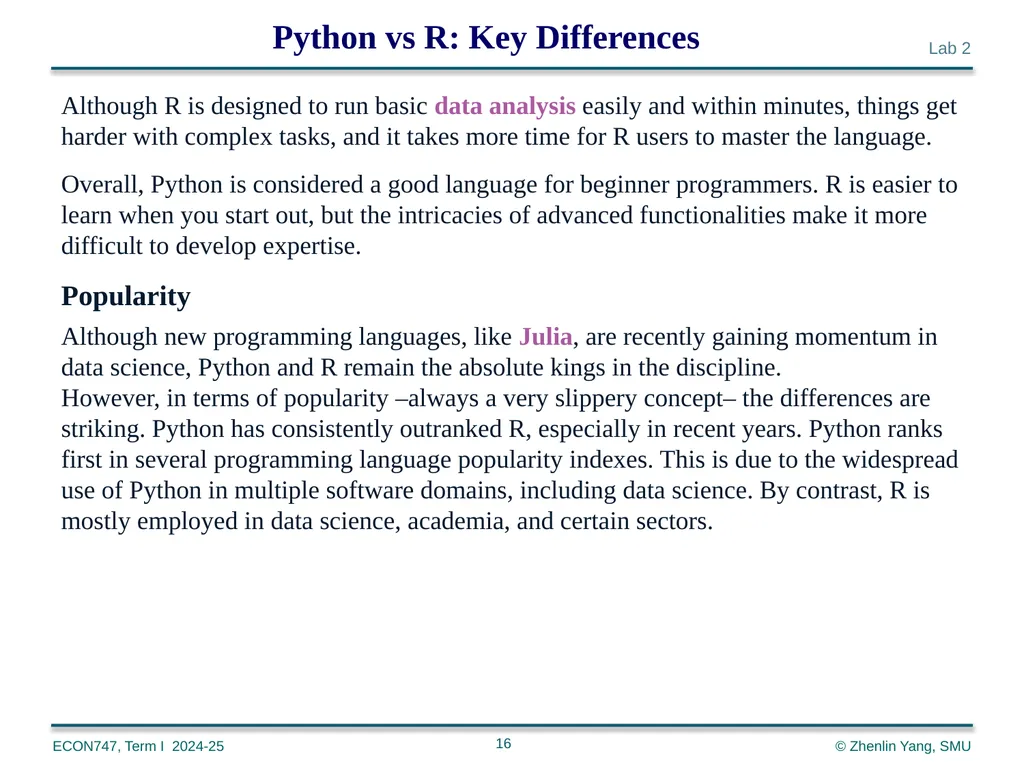
slide16. 16 Python vs R: Key Differences Although R is designed to run basic data analysis easily and within minutes, things get harder with complex tasks, and it takes more time for R users to master the language.
Overall, Python is considered a good language for beginner programmers. R is easier to learn when you start out, but the intricacies of advanced functionalities make it more difficult to develop expertise.
Popularity
Although new programming languages, like Julia, are recently gaining momentum in data science, Python and R remain the absolute kings in the discipline.
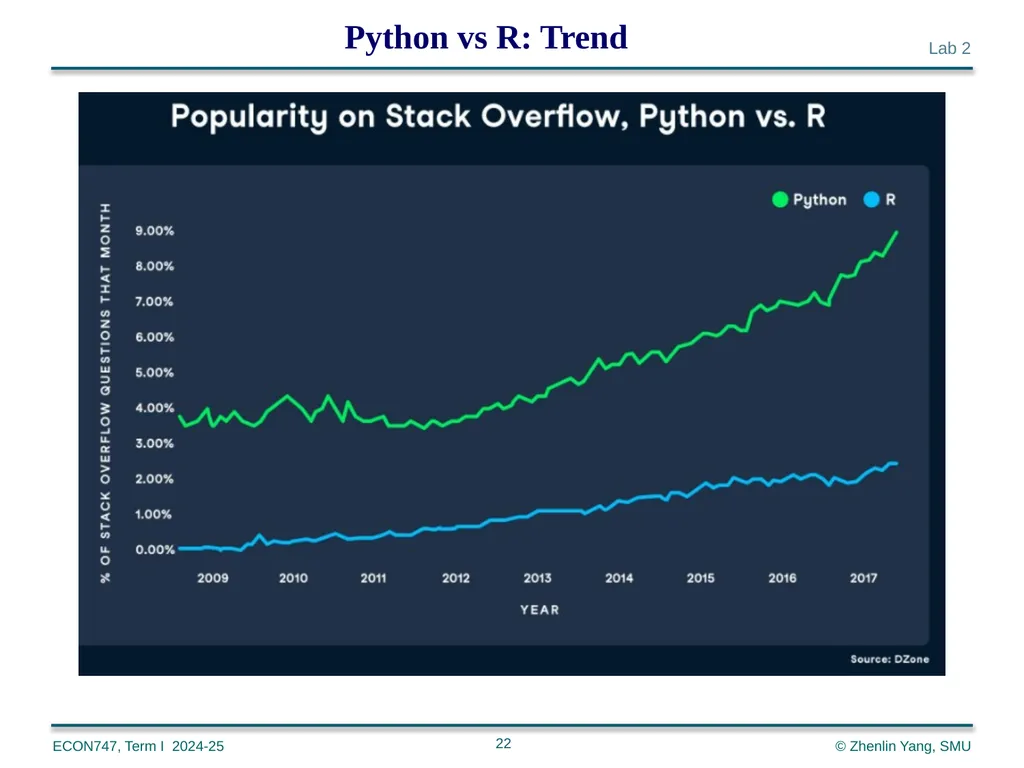
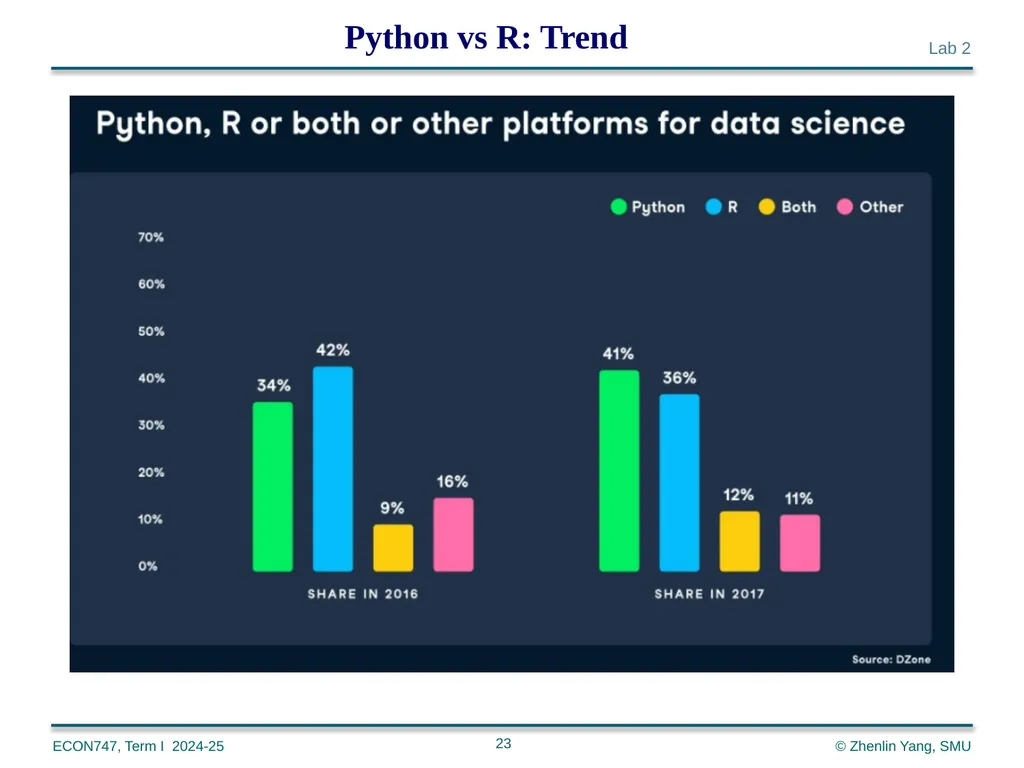
However, in terms of popularity –always a very slippery concept– the differences are striking. Python has consistently outranked R, especially in recent years. Python ranks first in several programming language popularity indexes. This is due to the widespread use of Python in multiple software domains, including data science. By contrast, R is mostly employed in data science, academia, and certain sectors.<br>
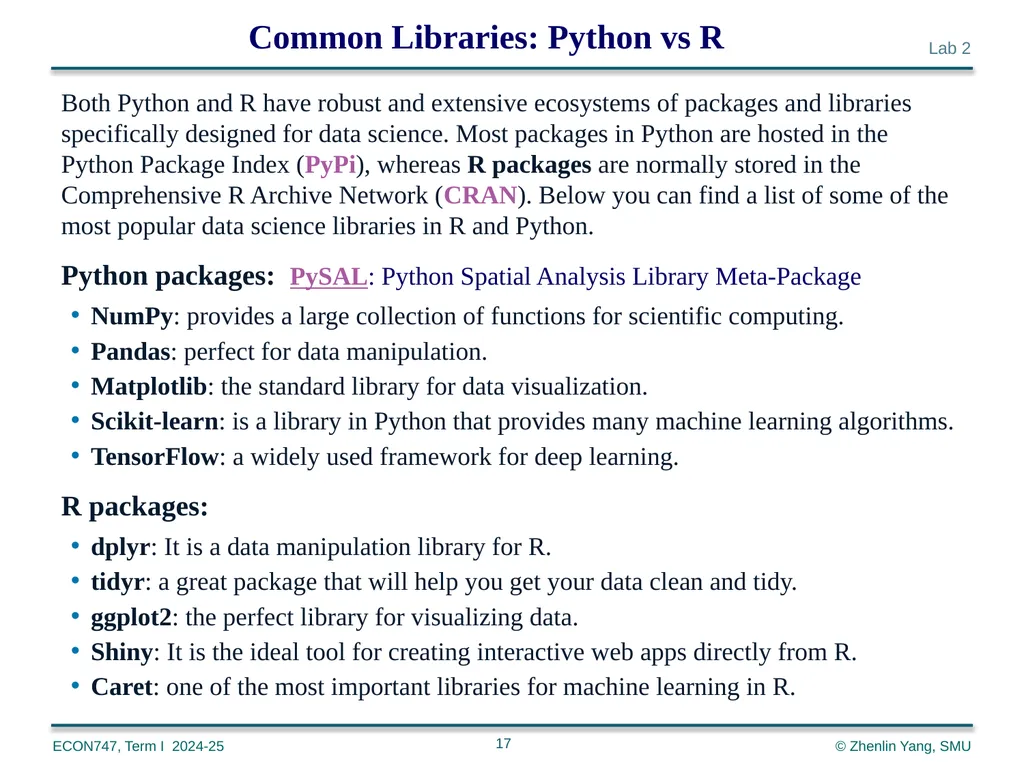
slide17. 17 Both Python and R have robust and extensive ecosystems of packages and libraries specifically designed for data science. Most packages in Python are hosted in the Python Package Index (PyPi), whereas R packages are normally stored in the Comprehensive R Archive Network (CRAN). Below you can find a list of some of the most popular data science libraries in R and Python.
Python packages: PySAL: Python Spatial Analysis Library Meta-Package
NumPy: provides a large collection of functions for scientific computing.
Pandas: perfect for data manipulation.
Matplotlib: the standard library for data visualization.
Scikit-learn: is a library in Python that provides many machine learning algorithms.
TensorFlow: a widely used framework for deep learning.
R packages:
dplyr: It is a data manipulation library for R.
tidyr: a great package that will help you get your data clean and tidy.
ggplot2: the perfect library for visualizing data.
Shiny: It is the ideal tool for creating interactive web apps directly from R.
Caret: one of the most important libraries for machine learning in R. Common Libraries: Python vs R<br>
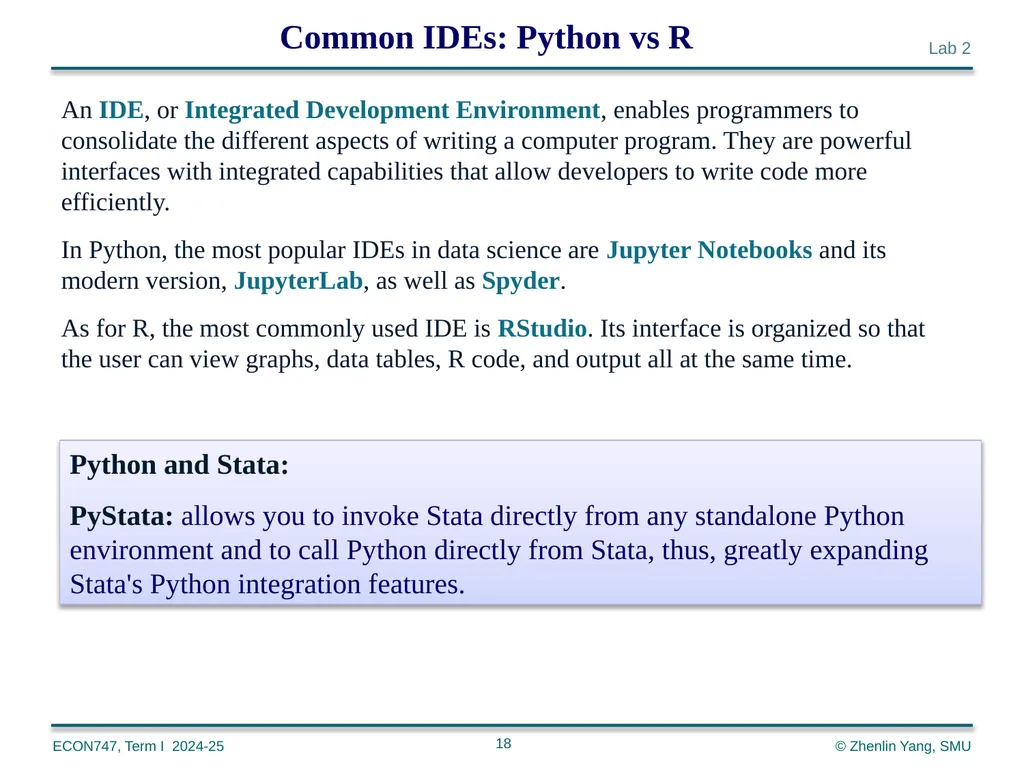
slide18. 18 An IDE, or Integrated Development Environment, enables programmers to consolidate the different aspects of writing a computer program. They are powerful interfaces with integrated capabilities that allow developers to write code more efficiently.
In Python, the most popular IDEs in data science are Jupyter Notebooks and its modern version, JupyterLab, as well as Spyder.
As for R, the most commonly used IDE is RStudio. Its interface is organized so that the user can view graphs, data tables, R code, and output all at the same time. Common IDEs: Python vs R Python and Stata:
PyStata: allows you to invoke Stata directly from any standalone Python environment and to call Python directly from Stata, thus, greatly expanding Stata's Python integration features.<br>
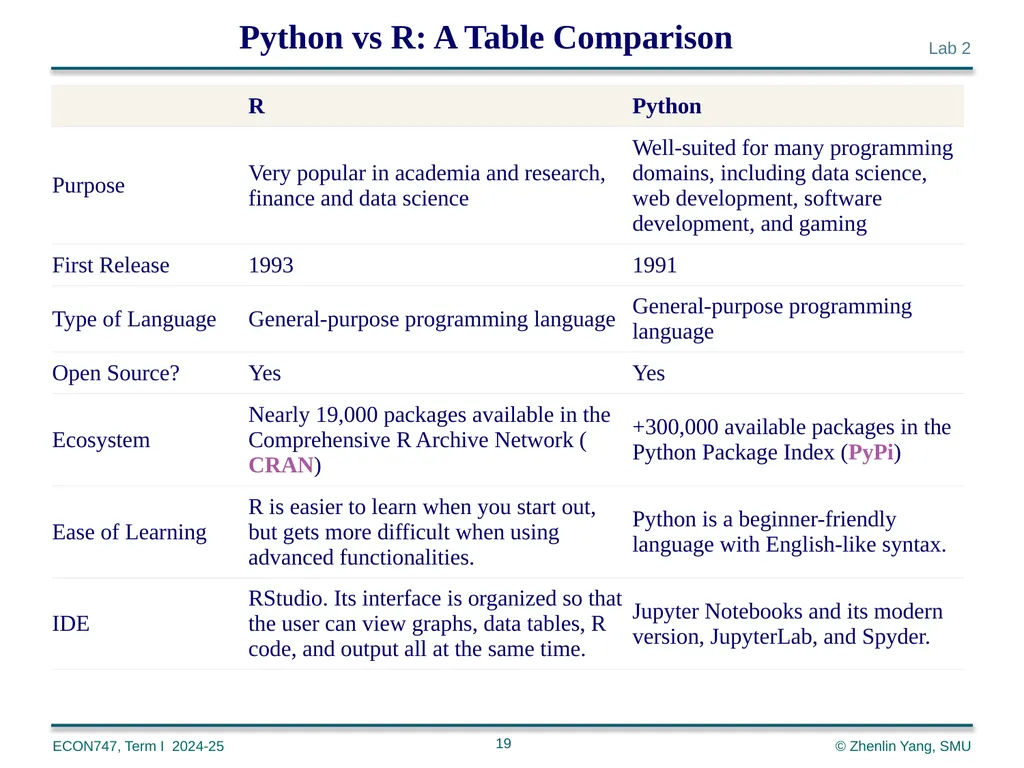
slide19. 19 Python vs R: A Table Comparison<br>
slide20. 20 Python vs R: A Table Comparison<br>
slide21. 21 Python vs R: Trend<br>
slide22. 22 Python vs R: Trend<br>
slide23. 23 Python vs R: Trend<br>
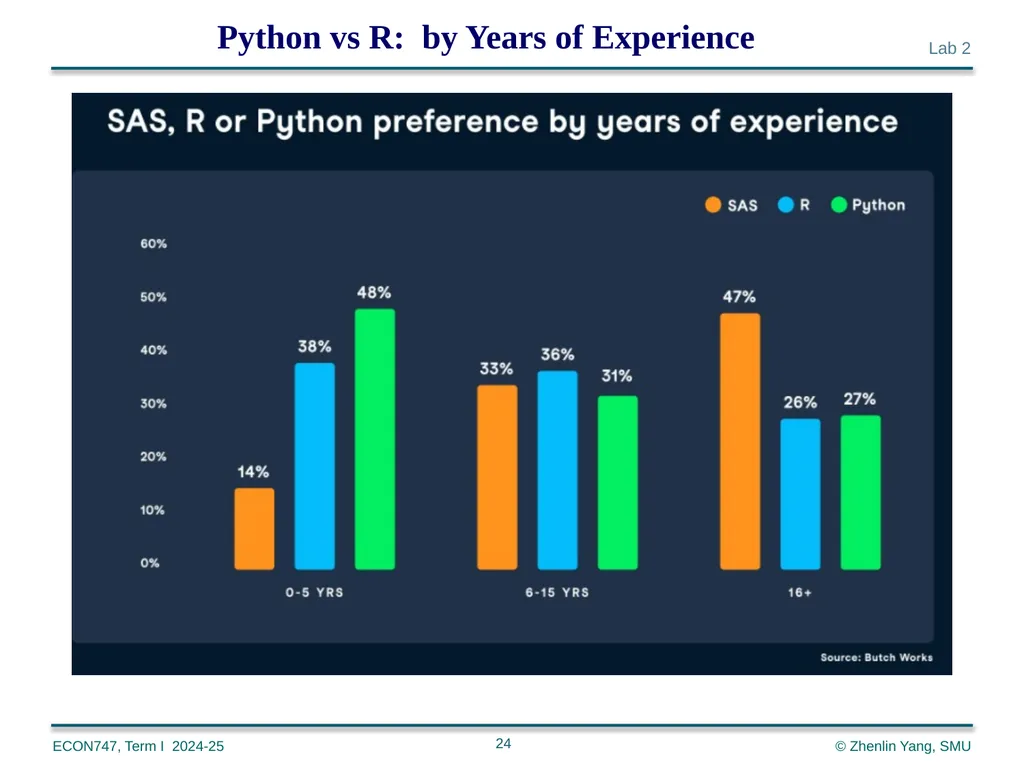
slide24. 24 Python vs R: by Years of Experience<br>
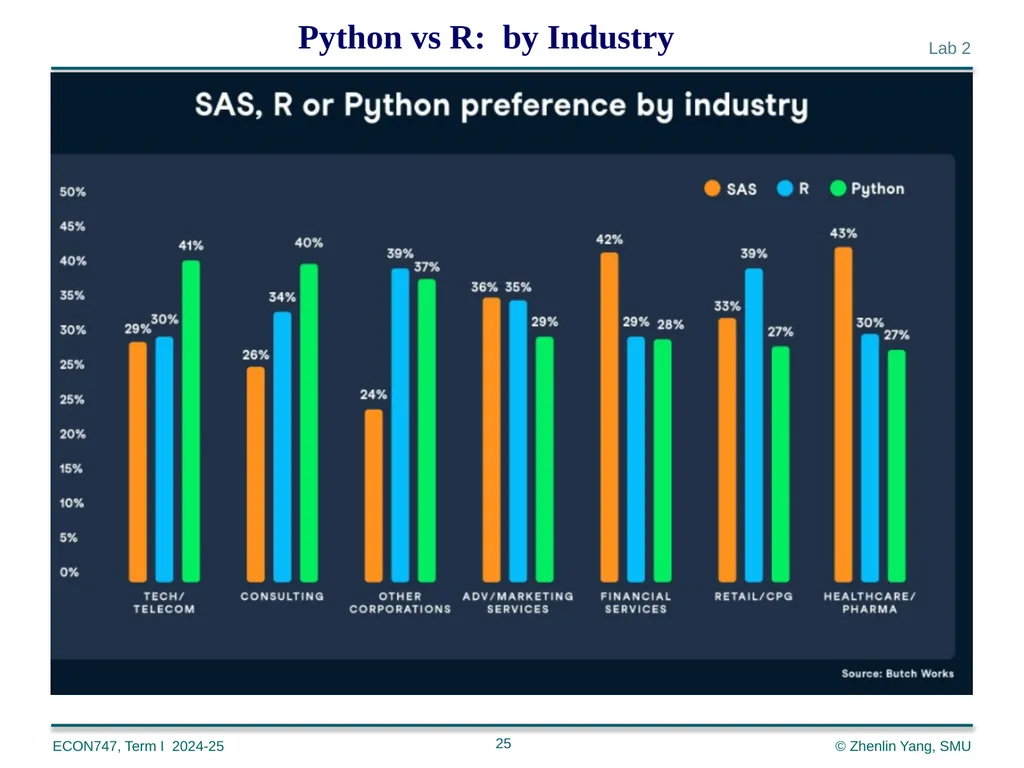
slide25. 25 Python vs R: by Industry<br>
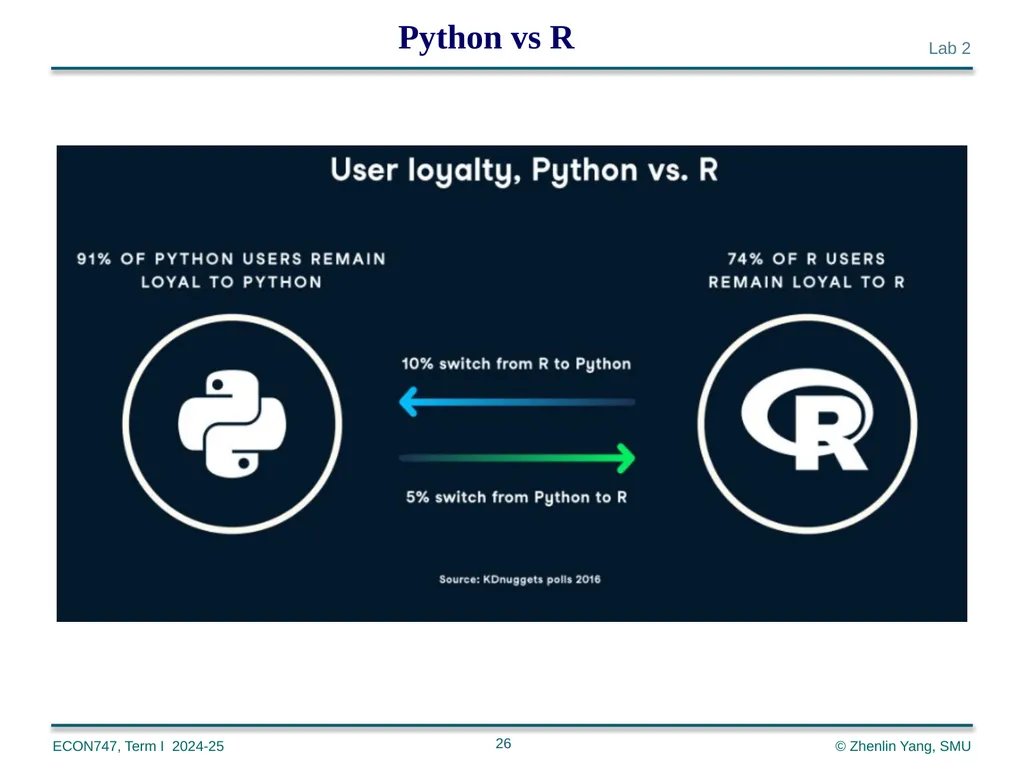
slide26. 26 Python vs R<br>
slide27. 27 Python Machine Learning: an Introduction Machine Learning is making the computer learn from studying data and statistics.
Machine Learning is a step into the direction of artificial intelligence (AI).
Machine Learning is a program that analyses data and learns to predict the outcome. To Start (https://www.w3schools.com/python/python_ml_getting_started.asp)
we will go back to mathematics and study statistics, and how to calculate important numbers based on data sets.
We will also learn how to use various Python modules to get the answers we need.
And we will learn how to make functions that are able to predict the outcome based on what we have learned. Data Set
In the mind of a computer, a data set is any collection of data. It can be anything from an array to a complete database.
A data set: [99,86,87,88,111,86,103,87,94,78,77,85,86]<br>
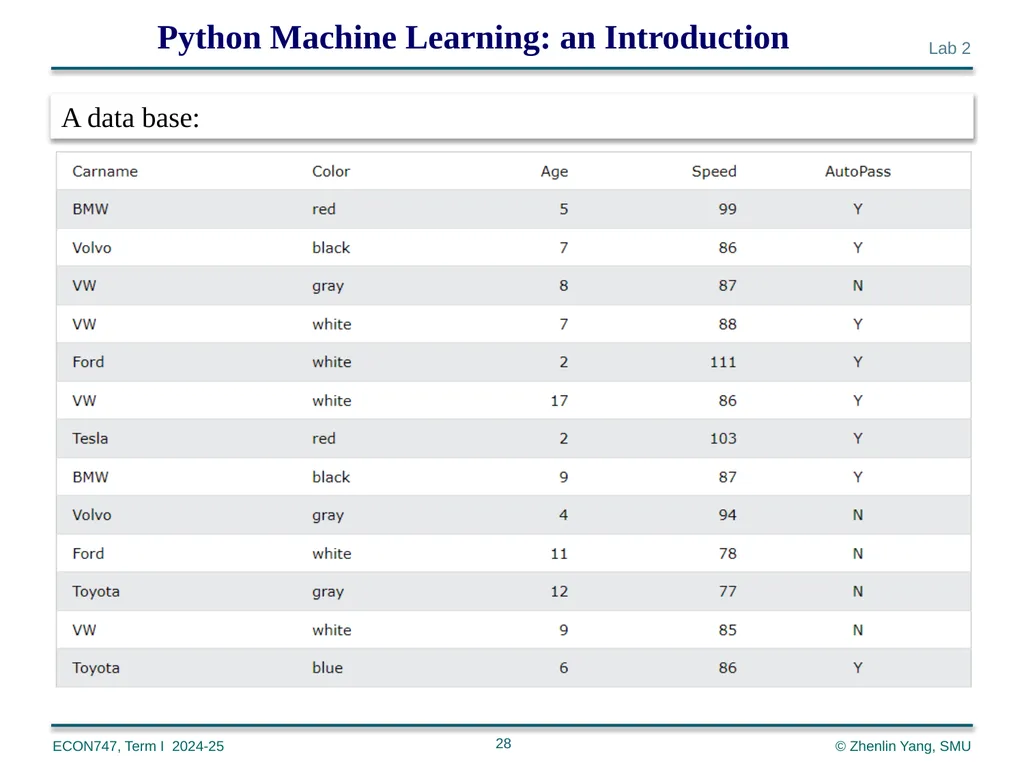
slide28. 28 Python Machine Learning: an Introduction A data base:<br>
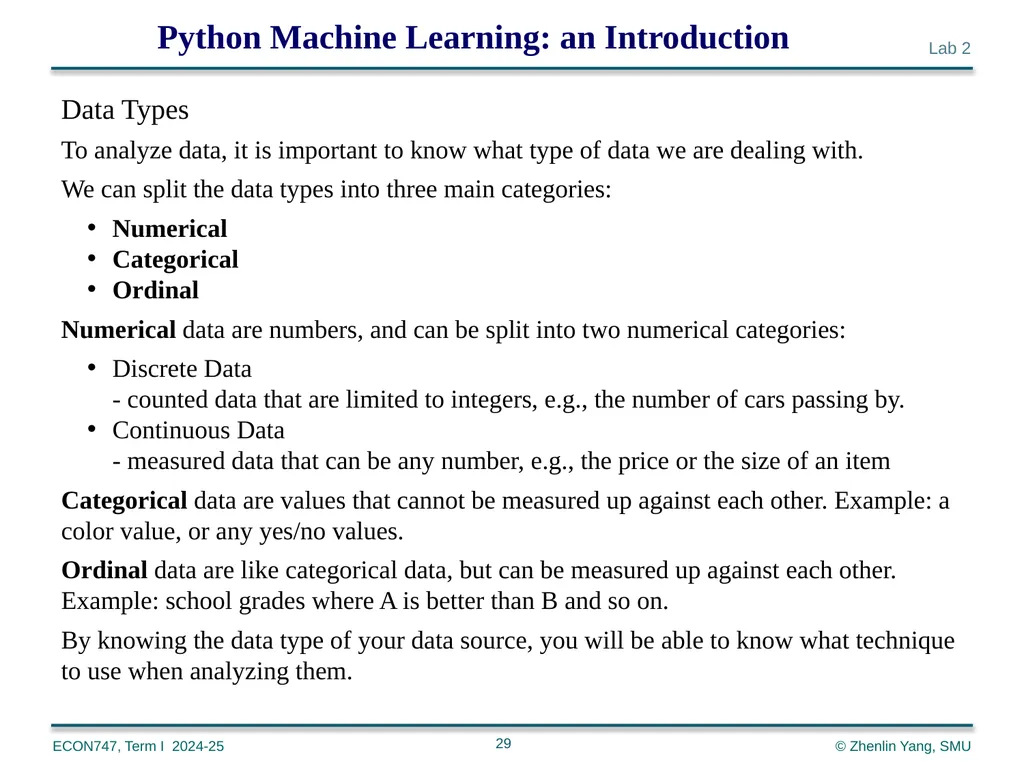
slide29. 29 Python Machine Learning: an Introduction Data Types
To analyze data, it is important to know what type of data we are dealing with.
We can split the data types into three main categories:
Numerical
Categorical
Ordinal
Numerical data are numbers, and can be split into two numerical categories:
Discrete Data - counted data that are limited to integers, e.g., the number of cars passing by.
Continuous Data - measured data that can be any number, e.g., the price or the size of an item
Categorical data are values that cannot be measured up against each other. Example: a color value, or any yes/no values.
Ordinal data are like categorical data, but can be measured up against each other. Example: school grades where A is better than B and so on.
By knowing the data type of your data source, you will be able to know what technique to use when analyzing them.<br>
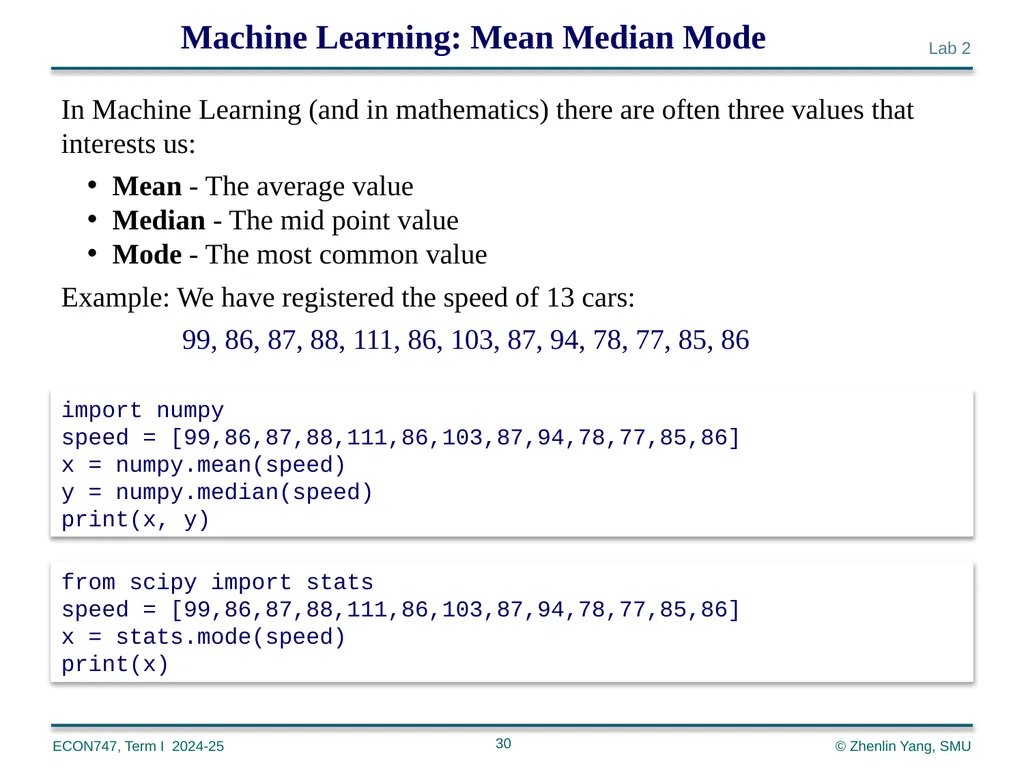
slide30. 30 Machine Learning: Mean Median Mode In Machine Learning (and in mathematics) there are often three values that interests us:
Mean - The average value
Median - The mid point value
Mode - The most common value
Example: We have registered the speed of 13 cars:
99, 86, 87, 88, 111, 86, 103, 87, 94, 78, 77, 85, 86 import numpy
speed = [99,86,87,88,111,86,103,87,94,78,77,85,86]
x = numpy.mean(speed)
y = numpy.median(speed)
print(x, y) from scipy import stats
speed = [99,86,87,88,111,86,103,87,94,78,77,85,86]
x = stats.mode(speed)
print(x)<br>
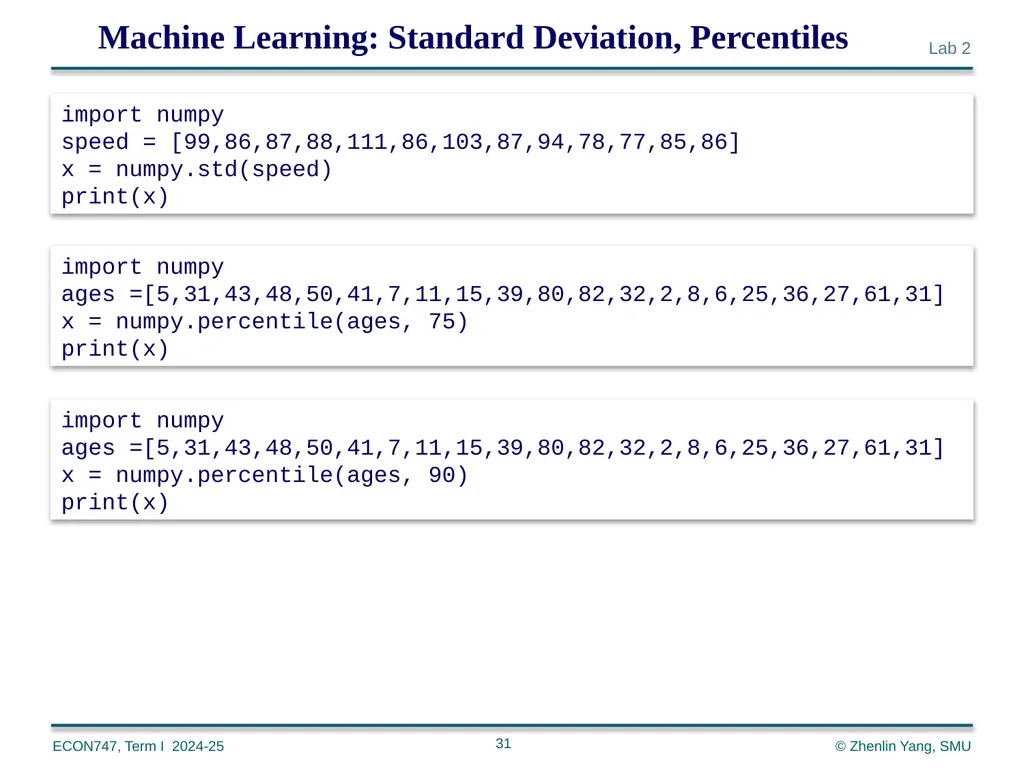
slide31. 31 Machine Learning: Standard Deviation, Percentiles import numpy
speed = [99,86,87,88,111,86,103,87,94,78,77,85,86]
x = numpy.std(speed)
print(x) import numpy
ages =[5,31,43,48,50,41,7,11,15,39,80,82,32,2,8,6,25,36,27,61,31]
x = numpy.percentile(ages, 75)
print(x) import numpy
ages =[5,31,43,48,50,41,7,11,15,39,80,82,32,2,8,6,25,36,27,61,31]
x = numpy.percentile(ages, 90)
print(x)<br>
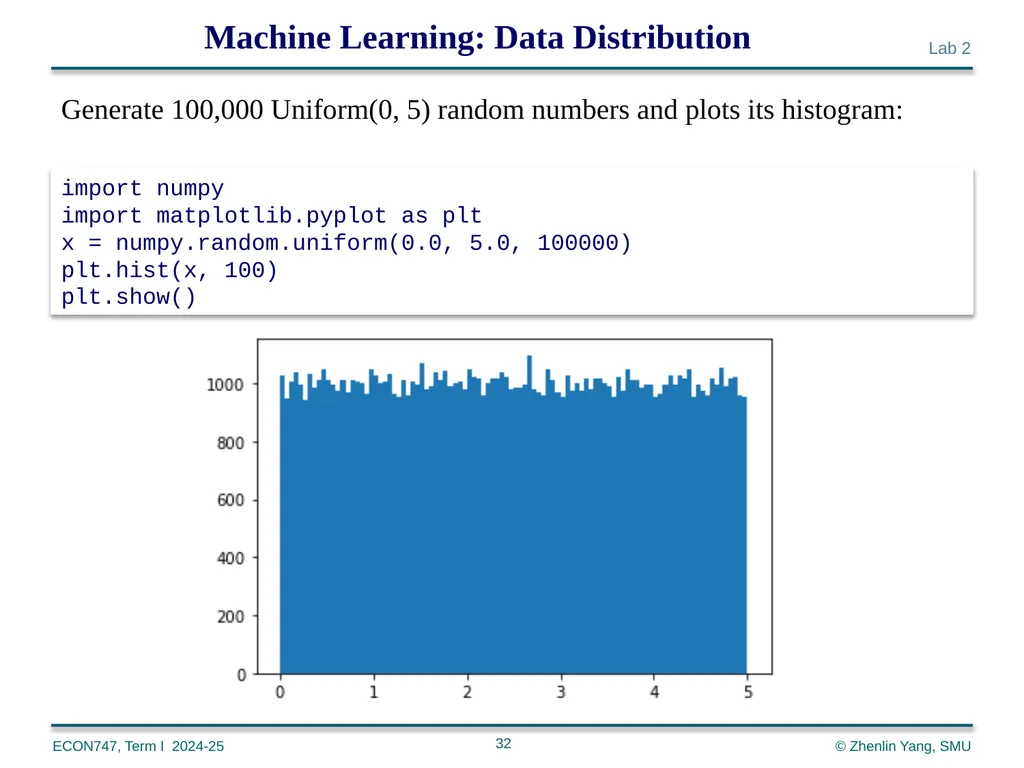
slide32. 32 Machine Learning: Data Distribution import numpy
import matplotlib.pyplot as plt
x = numpy.random.uniform(0.0, 5.0, 100000)
plt.hist(x, 100)
plt.show() Generate 100,000 Uniform(0, 5) random numbers and plots its histogram:<br>
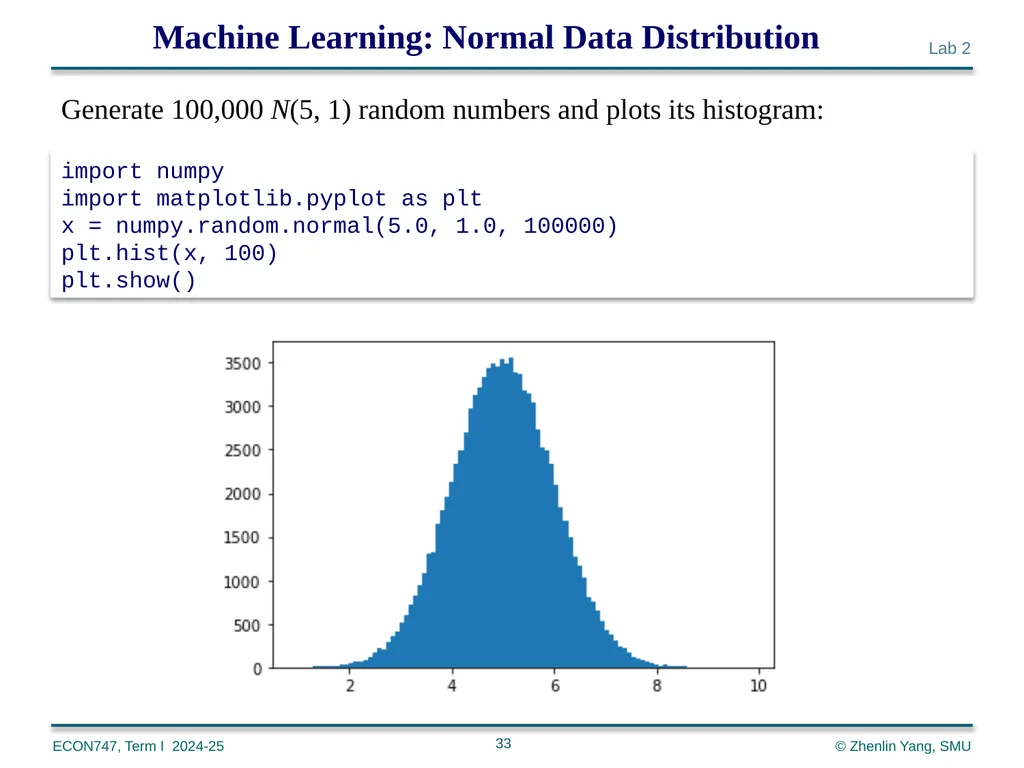
slide33. 33 Machine Learning: Normal Data Distribution import numpy
import matplotlib.pyplot as plt
x = numpy.random.normal(5.0, 1.0, 100000)
plt.hist(x, 100)
plt.show() Generate 100,000 N(5, 1) random numbers and plots its histogram:<br>
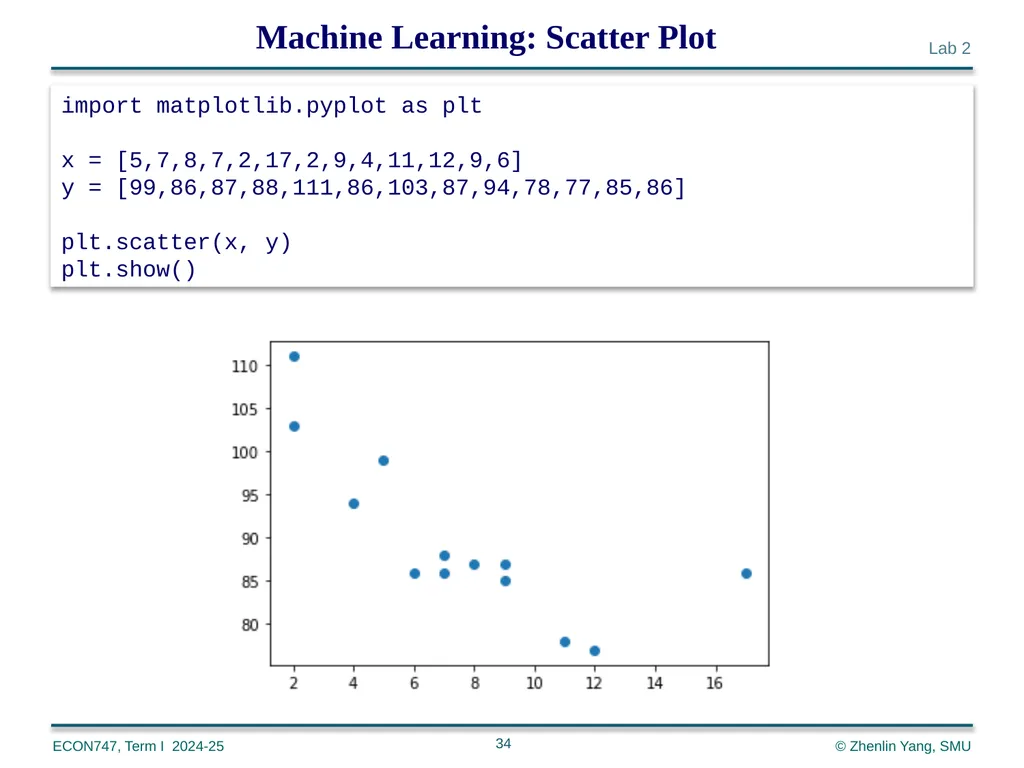
slide34. 34 Machine Learning: Scatter Plot import matplotlib.pyplot as plt
x = [5,7,8,7,2,17,2,9,4,11,12,9,6]
y = [99,86,87,88,111,86,103,87,94,78,77,85,86]
plt.scatter(x, y)
plt.show()<br>
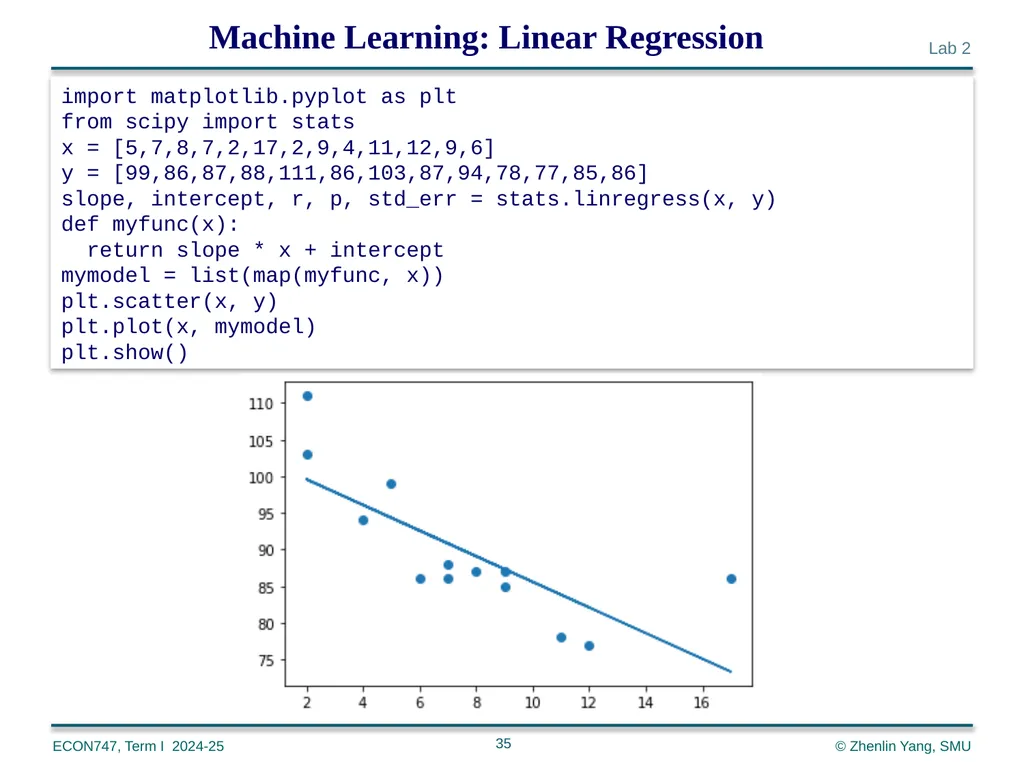
slide35. 35 Machine Learning: Linear Regression import matplotlib.pyplot as plt
from scipy import stats
x = [5,7,8,7,2,17,2,9,4,11,12,9,6]
y = [99,86,87,88,111,86,103,87,94,78,77,85,86]
slope, intercept, r, p, std_err = stats.linregress(x, y)
def myfunc(x):
return slope * x + intercept
mymodel = list(map(myfunc, x))
plt.scatter(x, y)
plt.plot(x, mymodel)
plt.show()<br>
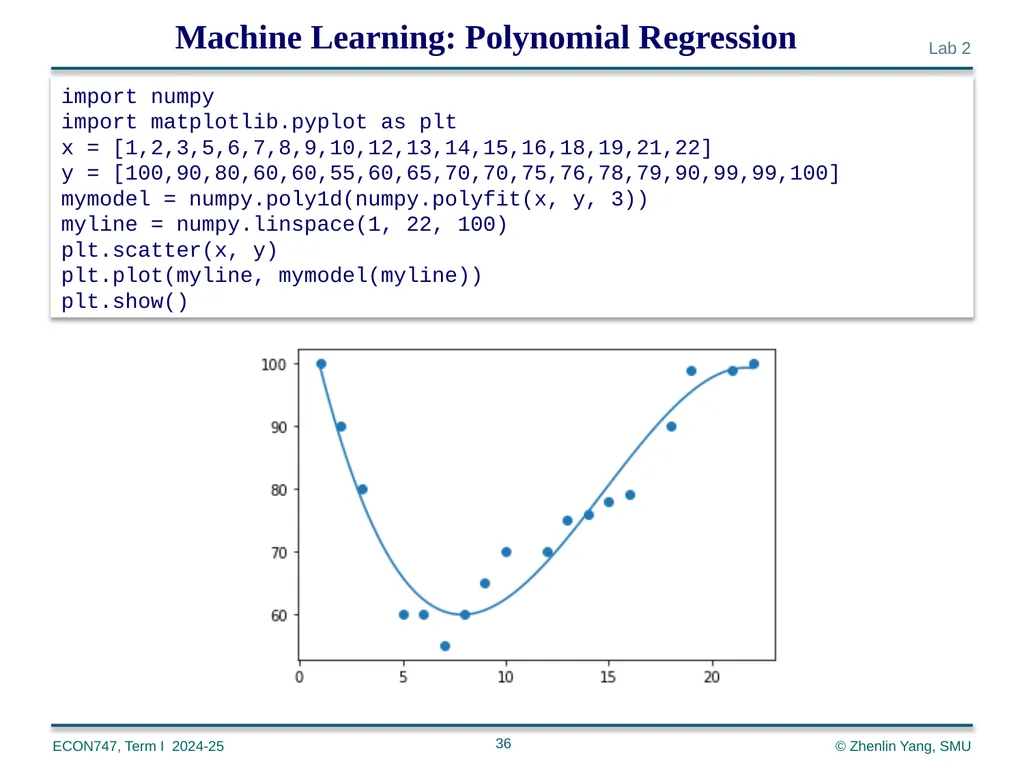
slide36. 36 Machine Learning: Polynomial Regression import numpy
import matplotlib.pyplot as plt
x = [1,2,3,5,6,7,8,9,10,12,13,14,15,16,18,19,21,22]
y = [100,90,80,60,60,55,60,65,70,70,75,76,78,79,90,99,99,100]
mymodel = numpy.poly1d(numpy.polyfit(x, y, 3))
myline = numpy.linspace(1, 22, 100)
plt.scatter(x, y)
plt.plot(myline, mymodel(myline))
plt.show()<br>
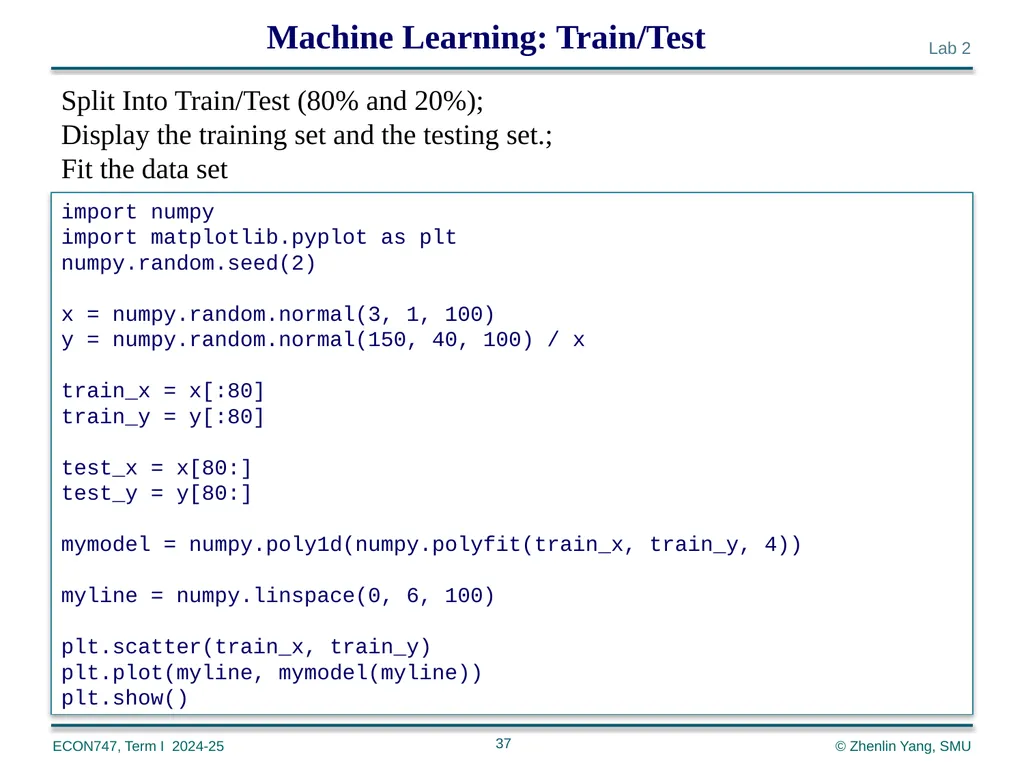
slide37. 37 Machine Learning: Train/Test import numpy
import matplotlib.pyplot as plt
numpy.random.seed(2)
x = numpy.random.normal(3, 1, 100)
y = numpy.random.normal(150, 40, 100) / x
train_x = x[:80]
train_y = y[:80]
test_x = x[80:]
test_y = y[80:]
mymodel = numpy.poly1d(numpy.polyfit(train_x, train_y, 4))
myline = numpy.linspace(0, 6, 100)
plt.scatter(train_x, train_y)
plt.plot(myline, mymodel(myline))
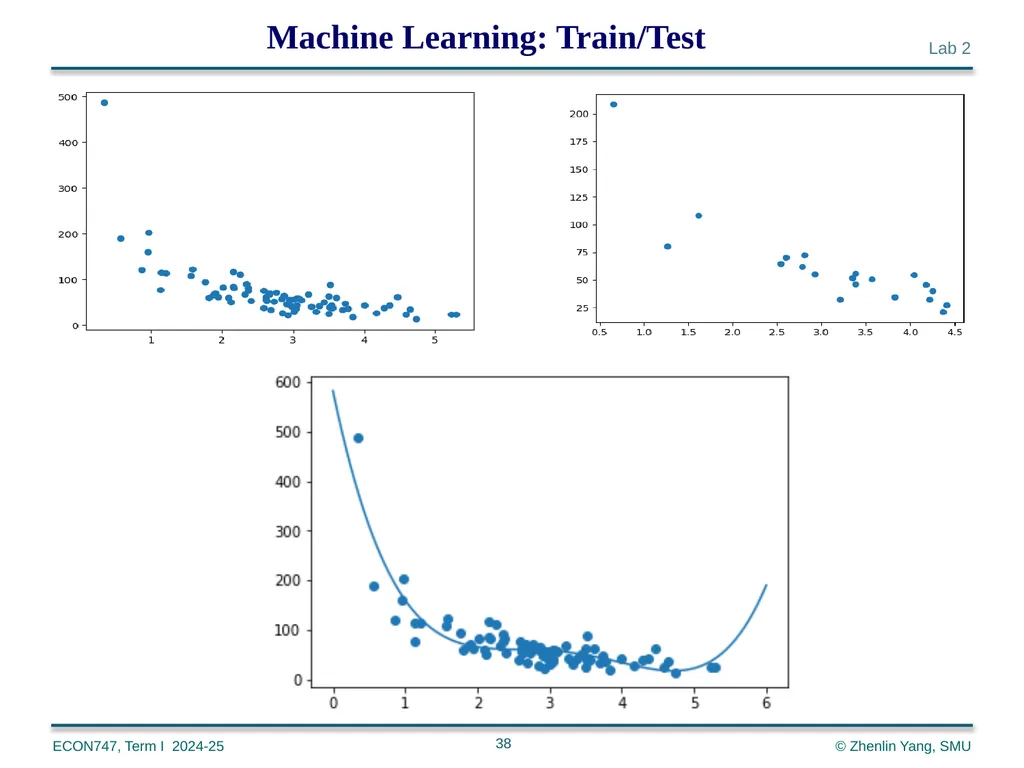
plt.show() Split Into Train/Test (80% and 20%);
Display the training set and the testing set.;
Fit the data set<br>
slide38. 38 Machine Learning: Train/Test<br>
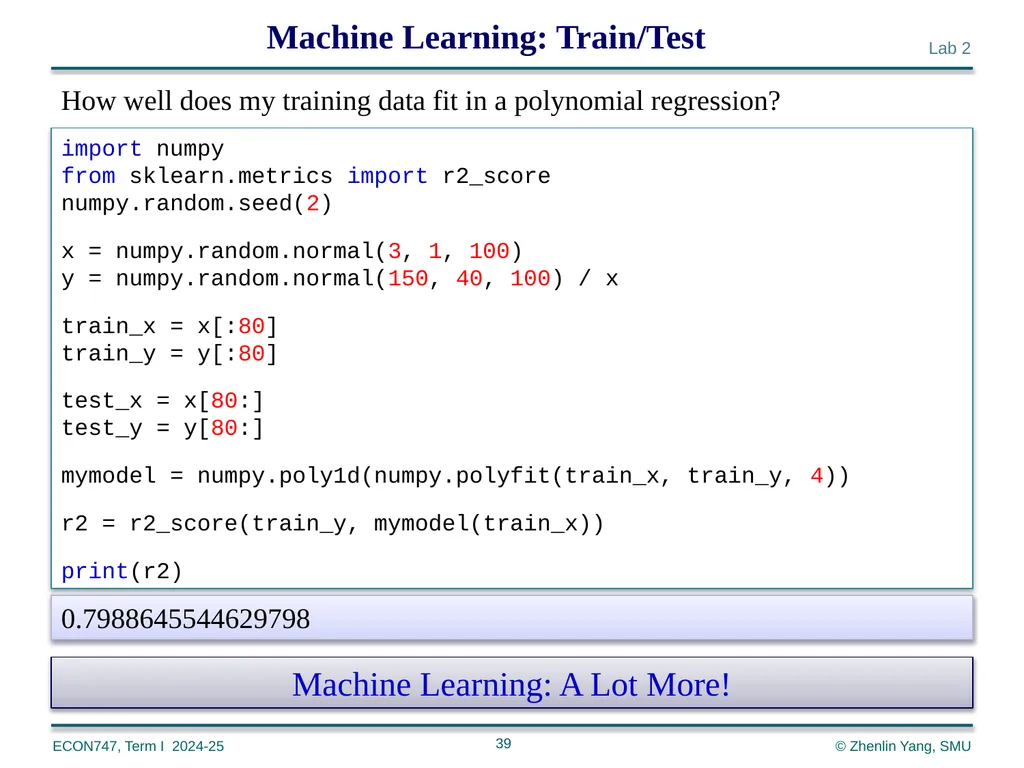
slide39. 39 Machine Learning: Train/Test import numpy from sklearn.metrics import r2_score numpy.random.seed(2) x = numpy.random.normal(3, 1, 100) y = numpy.random.normal(150, 40, 100) / x train_x = x[:80] train_y = y[:80] test_x = x[80:] test_y = y[80:] mymodel = numpy.poly1d(numpy.polyfit(train_x, train_y, 4)) r2 = r2_score(train_y, mymodel(train_x)) print(r2) How well does my training data fit in a polynomial regression? 0.7988645544629798 Machine Learning: A Lot More!<br>
We will discuss:
Nature of machine learning, common approaches
Machine learning and statistics
Machine learning: Python vs R
Data science: Python vs R
Python machine learning
PySAL: Python Spatial Analysis Library Meta-Package
PyStata: Pyhon and Stata<br>
slide2. 2 Python Installation Python is a free and open-source software. Its homepage is
https://www.python.org/
where a wealth of information is available. We recommend installing the Python distribution Anaconda (also open source), which includes Python plus many tools needed for data analysis.
For more information and installation files, see
https://www.anaconda.com
The main user interface used will be Spyder.
Distributions are available for Windows, Mac, and Linux systems and come in two versions.
The examples are based on the installation of the latest version, Python 3. It is not backwards compatible with Python 2.<br>
slide3. 3 Machine learning approaches have been applied to many fields, where it is too costly to develop algorithms to perform the needed tasks.
ML is known in its application across business problems under the name predictive analytics.
Although not all machine learning is statistically based, computational statistics is an important source of the field's methods.
The term machine learning was coined in 1959 by Arthur Samuel, an IBM employee and pioneer in the field of computer gaming and AI. Machine learning (ML) is a field of study in artificial intelligence (AI) concerned with the development and study of statistical algorithms that can learn from data and generalize to unseen data, and thus perform tasks without explicit instructions. Recently, generative AI have been able to surpass many previous approaches in performance. (https://en.wikipedia.org/wiki/Machine_learning) Machine Learning – An Introduction<br>
slide4. 4 Machine Learning Approaches Machine learning approaches are traditionally divided into three broad categories, which correspond to learning paradigms, depending on the nature of the "signal" or "feedback" available to the learning system:
Supervised learning: The computer is presented with example inputs and their desired outputs, given by a "teacher", and the goal is to learn a general rule that maps inputs to outputs.
Unsupervised learning: No labels are given to the learning algorithm, leaving it on its own to find structure in its input. Unsupervised learning can be a goal in itself (discovering hidden patterns in data) or a means towards an end (feature learning).
Reinforcement learning: A computer program interacts with a dynamic environment in which it must perform a certain goal (e.g., driving a vehicle or playing a game). As the program navigates its problem space, it is provided feedback (like rewards), which it tries to maximize.
Although each algorithm has advantages and limitations, no single algorithm works for all problems.<br>
slide5. Machine Learning & Statistics 5 Machine learning and statistics are closely related fields in terms of methods, but distinct in their principal goal: statistics draws population inferences from a sample, while machine learning finds generalizable predictive patterns.
According to Michael I. Jordan, the ideas of machine learning have had a long pre-history in statistics. He also suggested the term data science as a placeholder to call the overall field.
Conventional statistical analyses require the a priori selection of a model most suitable for the study data set. Only significant or theoretically relevant variables based on previous experience are included for analysis.
In contrast, machine learning is not built on a pre-structured model; rather, the data shape the model by detecting underlying patterns. The more variables (input) used to train the model, the more accurate the ultimate model will be.
Leo Breiman distinguished two statistical modeling paradigms: data model and algorithmic model, wherein "algorithmic model" means more or less the machine learning algorithms like Random Forest.<br>
slide6. 6 Machine Learning Models Performing machine learning can involve creating a model, which is trained on some training data and then can process additional data to make predictions. Various types of models have been used and researched for machine learning systems:
Artificial neural networks (ANN).
Decision trees (statistics related).
Support-vector machines.
Regression analysis (statistics).
Bayesian networks (statistics).
Gaussian processes (statistics related).
Genetic algorithms (statistics related).
Belief functions (statistics related).
Training models (statistics related)
Federated learning<br>
slide7. 7 Machine Learning: Python vs R Machine learning (ML) is one of the fastest growing branches of artificial intelligence (AI) in modern times. It allows a system to learn from past experiences and generate a more appropriate response, just as a human mind would. The backbone of ML is effective data analysis.
R and Python are the most popular languages used for ML:
Both are open-source languages, providing a huge repertoire of statistical and predictive tools.
However, they take very different approaches to data analytics. Let’s dive into the strengths and weaknesses of the two ML giants and decide which would be the best fit based on individual requirements.
The nature of the languages
Python is a general-purpose language with a huge set of data science libraries. For a flexible and extensive ML project, Python would be a better fit.
R focuses more on the statistical analysis and visualization of data. While it is not a general-purpose language like its rival, it boasts a larger variety of statistical libraries.<br>
slide8. 8 Python vs R for ML Optimization and speed
Being a general-purpose high-level language, Python is not always the best option in terms of speed.
R, on the other hand, is a simpler language which can even perform complex computations really fast. So, R takes the cake in this round.
Machine learning packages
Python has some of the most popular ML packages in today’s world. Scikit-learn, one such package, presents users with several fundamental tools for creating neural networks and analyzing data.
R has its own packages for solving ML problems, Caret being a very popular one. The Nnet library is a suitable platform for modeling neural networks.
Although this is a close one, Python comes out on top due to the robust and powerful libraries it provides.<br>
slide9. 9 Data analysis packages
Python is a great option for analyzing and modeling data. With packages like NumPy and pandas, there are so many options to explore.
In comparison, R still seems like a better choice, since the language was made with the sole purpose of data analysis. This can play a vital role in machine learning.
Even though R is less readable than Python, it showcases detailed visualizations and diverse libraries which make it worth the steep learning curve.
Integration with other languages
Python has a much better integration rate with other languages. It even supports R functionality through the RPy2 package!
Due to R’s difficult syntax, integration can be a challenge, especially for new users.
Consistency
Beyond basic functionality, R relies heavily on third-party code for several packages. This creates an inconsistency between the available algorithms. Python vs R for ML<br>
slide10. 10 Python is much more flexible and well-rounded in this regard. The approach of creating large packages containing smaller functionalities ensures that the code is uniform across the platform. It also has better technical and community support. Python vs R for ML Conclusion
Python
Python stands out as the winner in terms of the support it has for neural network training and other ML interfaces.
Its readability will also attract new users who do not have time to master a language.<br>
slide11. 11 R
R fares much better in terms of speed and visual representations.
However, its functionality is limited to statistical analysis and modeling.
If a machine learning program requires a wide range of operations, R may present some constraints. Visit the following website for more information:
https://www.educative.io/answers/machine-learning-python-vs-r Python vs R for ML<br>
slide12. 12 Data Science: Python vs R Python and R are the two most popular programming languages for data science. Both languages are well suited for any data science tasks you may think of. The Python vs R debate may suggest that you have to choose either Python or R.
While this may be true for newcomers to the discipline, in the long run, you’ll likely need to learn both. Rather than seeing the two languages as mutually exclusive, you should see them as complementary tools that you can use together depending on your specific use case.
What makes R and Python the perfect candidates for data science? In this article will cover what Python and R are used for, the key differences between R and Python, and provide some factors to consider to choose the right language for your needs.
Now that we've established that Python and R are both good, popular choices, there are a few factors that may sway your decision one way or the other.
https://www.datacamp.com/blog/python-vs-r-for-data-science-whats-the-difference<br>
slide13. 13 Why Choose Python for Data Science? Python is a general-purpose, open-source programming language used in various software domains, including data science, web development, and gaming.
Launched in 1991, Python is one of the most popular programming languages in the world, occupying the top position in several programming language popularity indices, such as the TIOBE Index and the PYPL Index.
One of the reasons for the worldwide popularity of Python is its community of users. Python is backed by a vast community of users and developers who ensure the smooth growth and improvement of the language, as well as the continuous release of new libraries designed for all kinds of purposes.
Python is an easy language to read and write due to its high similarity with human language. In fact, high readability and interpretability are at the heart of the design of Python. For these reasons, Python is often cited as a go-to programming language for newcomers with no coding experience.
Over time, Python has been gaining popularity in the field of data science thanks to its simplicity and the endless possibilities provided by the hundreds of specialized libraries and packages that support any kind of data science task, such as data visualization, machine learning, and deep learning.<br>
slide14. 14 Why Choose R for Data Science? R is an open-source programming language specifically created for statistical computing and graphics.
Since its first launch in 1992, R has been widely adopted in scientific research and academia. Today, it remains one of the most popular analytics tools used in both traditional data analytics and the rapidly-evolving field of business analytics. It ranks 11th and 7th position in the TIOBE Index and the PYPL Index, respectively.
Designed with statisticians in mind, with R, you can use complex functions within a few lines of code. All kinds of statistical tests and models are readily available and easily used, such as linear modeling, non-linear modeling, classifications, and clustering.
The extensive possibilities R offers are mostly due to its huge community. It has developed one of the richest collections of data-science-related packages. All of them are available via the Comprehensive R Archive Network (CRAN).
Another feature that makes R particularly remarkable is the power to generate quality reports with support for data visualization and its available frameworks to create interactive web applications. In this sense, R is widely considered the best tool for making beautiful graphs and visualizations.<br>
slide15. 15 Python vs R: Key Differences Purpose
While Python and R were created with different purposes –Python as a general-purpose programming language and R for statistical analysis–nowadays, both are suitable for any data science task. However, Python is considered a more versatile programming language than R, as it’s also extremely popular in other software domains, such as software development, web development, and gaming.
Type of Users
As a general-purpose programming language, Python is the standard go-to choice for software developers breaking into data science. Plus, Python’s focus on productivity makes it a more suitable tool to build complex applications.
By contrast, R is widely used in academia and certain sectors, such as finance and pharmaceuticals. It is the perfect language for statisticians and researchers with limited programming skills.
Learning curve
Python’s intuitive syntax is considered one of the closest programming languages to English. This makes it a very good language for new programmers, with a smooth and linear learning curve.<br>
slide16. 16 Python vs R: Key Differences Although R is designed to run basic data analysis easily and within minutes, things get harder with complex tasks, and it takes more time for R users to master the language.
Overall, Python is considered a good language for beginner programmers. R is easier to learn when you start out, but the intricacies of advanced functionalities make it more difficult to develop expertise.
Popularity
Although new programming languages, like Julia, are recently gaining momentum in data science, Python and R remain the absolute kings in the discipline.
However, in terms of popularity –always a very slippery concept– the differences are striking. Python has consistently outranked R, especially in recent years. Python ranks first in several programming language popularity indexes. This is due to the widespread use of Python in multiple software domains, including data science. By contrast, R is mostly employed in data science, academia, and certain sectors.<br>
slide17. 17 Both Python and R have robust and extensive ecosystems of packages and libraries specifically designed for data science. Most packages in Python are hosted in the Python Package Index (PyPi), whereas R packages are normally stored in the Comprehensive R Archive Network (CRAN). Below you can find a list of some of the most popular data science libraries in R and Python.
Python packages: PySAL: Python Spatial Analysis Library Meta-Package
NumPy: provides a large collection of functions for scientific computing.
Pandas: perfect for data manipulation.
Matplotlib: the standard library for data visualization.
Scikit-learn: is a library in Python that provides many machine learning algorithms.
TensorFlow: a widely used framework for deep learning.
R packages:
dplyr: It is a data manipulation library for R.
tidyr: a great package that will help you get your data clean and tidy.
ggplot2: the perfect library for visualizing data.
Shiny: It is the ideal tool for creating interactive web apps directly from R.
Caret: one of the most important libraries for machine learning in R. Common Libraries: Python vs R<br>
slide18. 18 An IDE, or Integrated Development Environment, enables programmers to consolidate the different aspects of writing a computer program. They are powerful interfaces with integrated capabilities that allow developers to write code more efficiently.
In Python, the most popular IDEs in data science are Jupyter Notebooks and its modern version, JupyterLab, as well as Spyder.
As for R, the most commonly used IDE is RStudio. Its interface is organized so that the user can view graphs, data tables, R code, and output all at the same time. Common IDEs: Python vs R Python and Stata:
PyStata: allows you to invoke Stata directly from any standalone Python environment and to call Python directly from Stata, thus, greatly expanding Stata's Python integration features.<br>
slide19. 19 Python vs R: A Table Comparison<br>
slide20. 20 Python vs R: A Table Comparison<br>
slide21. 21 Python vs R: Trend<br>
slide22. 22 Python vs R: Trend<br>
slide23. 23 Python vs R: Trend<br>
slide24. 24 Python vs R: by Years of Experience<br>
slide25. 25 Python vs R: by Industry<br>
slide26. 26 Python vs R<br>
slide27. 27 Python Machine Learning: an Introduction Machine Learning is making the computer learn from studying data and statistics.
Machine Learning is a step into the direction of artificial intelligence (AI).
Machine Learning is a program that analyses data and learns to predict the outcome. To Start (https://www.w3schools.com/python/python_ml_getting_started.asp)
we will go back to mathematics and study statistics, and how to calculate important numbers based on data sets.
We will also learn how to use various Python modules to get the answers we need.
And we will learn how to make functions that are able to predict the outcome based on what we have learned. Data Set
In the mind of a computer, a data set is any collection of data. It can be anything from an array to a complete database.
A data set: [99,86,87,88,111,86,103,87,94,78,77,85,86]<br>
slide28. 28 Python Machine Learning: an Introduction A data base:<br>
slide29. 29 Python Machine Learning: an Introduction Data Types
To analyze data, it is important to know what type of data we are dealing with.
We can split the data types into three main categories:
Numerical
Categorical
Ordinal
Numerical data are numbers, and can be split into two numerical categories:
Discrete Data - counted data that are limited to integers, e.g., the number of cars passing by.
Continuous Data - measured data that can be any number, e.g., the price or the size of an item
Categorical data are values that cannot be measured up against each other. Example: a color value, or any yes/no values.
Ordinal data are like categorical data, but can be measured up against each other. Example: school grades where A is better than B and so on.
By knowing the data type of your data source, you will be able to know what technique to use when analyzing them.<br>
slide30. 30 Machine Learning: Mean Median Mode In Machine Learning (and in mathematics) there are often three values that interests us:
Mean - The average value
Median - The mid point value
Mode - The most common value
Example: We have registered the speed of 13 cars:
99, 86, 87, 88, 111, 86, 103, 87, 94, 78, 77, 85, 86 import numpy
speed = [99,86,87,88,111,86,103,87,94,78,77,85,86]
x = numpy.mean(speed)
y = numpy.median(speed)
print(x, y) from scipy import stats
speed = [99,86,87,88,111,86,103,87,94,78,77,85,86]
x = stats.mode(speed)
print(x)<br>
slide31. 31 Machine Learning: Standard Deviation, Percentiles import numpy
speed = [99,86,87,88,111,86,103,87,94,78,77,85,86]
x = numpy.std(speed)
print(x) import numpy
ages =[5,31,43,48,50,41,7,11,15,39,80,82,32,2,8,6,25,36,27,61,31]
x = numpy.percentile(ages, 75)
print(x) import numpy
ages =[5,31,43,48,50,41,7,11,15,39,80,82,32,2,8,6,25,36,27,61,31]
x = numpy.percentile(ages, 90)
print(x)<br>
slide32. 32 Machine Learning: Data Distribution import numpy
import matplotlib.pyplot as plt
x = numpy.random.uniform(0.0, 5.0, 100000)
plt.hist(x, 100)
plt.show() Generate 100,000 Uniform(0, 5) random numbers and plots its histogram:<br>
slide33. 33 Machine Learning: Normal Data Distribution import numpy
import matplotlib.pyplot as plt
x = numpy.random.normal(5.0, 1.0, 100000)
plt.hist(x, 100)
plt.show() Generate 100,000 N(5, 1) random numbers and plots its histogram:<br>
slide34. 34 Machine Learning: Scatter Plot import matplotlib.pyplot as plt
x = [5,7,8,7,2,17,2,9,4,11,12,9,6]
y = [99,86,87,88,111,86,103,87,94,78,77,85,86]
plt.scatter(x, y)
plt.show()<br>
slide35. 35 Machine Learning: Linear Regression import matplotlib.pyplot as plt
from scipy import stats
x = [5,7,8,7,2,17,2,9,4,11,12,9,6]
y = [99,86,87,88,111,86,103,87,94,78,77,85,86]
slope, intercept, r, p, std_err = stats.linregress(x, y)
def myfunc(x):
return slope * x + intercept
mymodel = list(map(myfunc, x))
plt.scatter(x, y)
plt.plot(x, mymodel)
plt.show()<br>
slide36. 36 Machine Learning: Polynomial Regression import numpy
import matplotlib.pyplot as plt
x = [1,2,3,5,6,7,8,9,10,12,13,14,15,16,18,19,21,22]
y = [100,90,80,60,60,55,60,65,70,70,75,76,78,79,90,99,99,100]
mymodel = numpy.poly1d(numpy.polyfit(x, y, 3))
myline = numpy.linspace(1, 22, 100)
plt.scatter(x, y)
plt.plot(myline, mymodel(myline))
plt.show()<br>
slide37. 37 Machine Learning: Train/Test import numpy
import matplotlib.pyplot as plt
numpy.random.seed(2)
x = numpy.random.normal(3, 1, 100)
y = numpy.random.normal(150, 40, 100) / x
train_x = x[:80]
train_y = y[:80]
test_x = x[80:]
test_y = y[80:]
mymodel = numpy.poly1d(numpy.polyfit(train_x, train_y, 4))
myline = numpy.linspace(0, 6, 100)
plt.scatter(train_x, train_y)
plt.plot(myline, mymodel(myline))
plt.show() Split Into Train/Test (80% and 20%);
Display the training set and the testing set.;
Fit the data set<br>
slide38. 38 Machine Learning: Train/Test<br>
slide39. 39 Machine Learning: Train/Test import numpy from sklearn.metrics import r2_score numpy.random.seed(2) x = numpy.random.normal(3, 1, 100) y = numpy.random.normal(150, 40, 100) / x train_x = x[:80] train_y = y[:80] test_x = x[80:] test_y = y[80:] mymodel = numpy.poly1d(numpy.polyfit(train_x, train_y, 4)) r2 = r2_score(train_y, mymodel(train_x)) print(r2) How well does my training data fit in a polynomial regression? 0.7988645544629798 Machine Learning: A Lot More!<br>