
Market Data Analytics Methodology Jan 2017


Description: Market Data Analytics Methodology Jan 2017 Introduction This document sets out how MarketLine produces market sizing data for retail Consumer Packaged Goods (CPG) markets by Volume Value Brand manufacturer Channel. Market Data Analytics
Related Topics
Download Presentation
"Market Data Analytics Methodology Jan 2017" is the property of its rightful owner. Permission is granted to download and print the materials on this website for personal, non-commercial use only, and to display it on your personal computer provided you do not modify the materials and that you retain all copyright notices contained in the materials. By downloading content from our website, you accept the terms of this agreement.
Presentation Transcript
slide1. Market Data Analytics Methodology
Jan 2017<br>
slide2. Introduction This document sets out how MarketLine produces market sizing data for retail Consumer Packaged Goods (CPG) markets by
Volume
Value
Brand / manufacturer
Channel. Market Data Analytics Methodology 2<br>
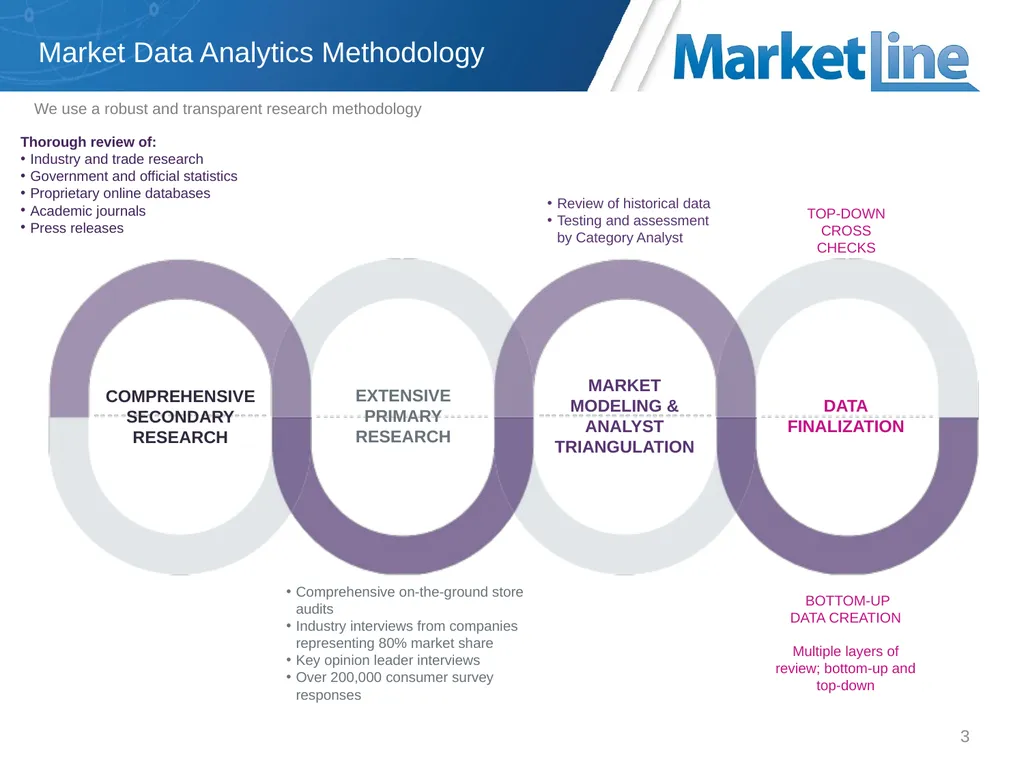
slide3. Market Data Analytics Methodology 3 We use a robust and transparent research methodology Thorough review of:
Industry and trade research
Government and official statistics
Proprietary online databases
Academic journals
Press releases COMPREHENSIVE
SECONDARY
RESEARCH EXTENSIVE
PRIMARY
RESEARCH MARKET
MODELING &
ANALYST
TRIANGULATION DATA
FINALIZATION Review of historical data
Testing and assessment by Category Analyst TOP-DOWN CROSS CHECKS Comprehensive on-the-ground store audits
Industry interviews from companies representing 80% market share
Key opinion leader interviews
Over 200,000 consumer survey responses<br>
slide4. MarketLine creates market data country by country with each country file undergoing multi-step management review Consumer Packaged Goods Retail Data 4 MarketLine builds market data from the bottom up, with each country undergoing a thorough analyst review at the segment and sub-segment level. Each country’s data file undergoes multiple rounds of proofing by a senior analyst and project manager before sign off.
Using last year’s data as an initial baseline input, every row of data is audited and assigned a confidence score based on the level of sourcing available.
Research inputs at this stage include contact with:
Trade bodies
Manufacturers and brands
Native retailers
Financial/broker reports
National statistics
MarketLine’s internal resources such as consumer surveys, macroeconomic databases, deals and company news tracking, consumer sentiment analysis, country and city profiles.
These inputs are triangulated to produce a final category, segment, or sub-segment data point. Each data point is checked on a country by country basis against population size and economic information to ensure consumption per capita, expenditure per capita and average prices are robust.
MarketLine also conducts primary interviews with multiple players across the value chain in order to confirm market sizing and brand and manufacturer shares. Market size figures are also confirmed with MarketLine’s network of industry contacts.
Forecasts are created using the first draft data set, which is fed into a multivariate forecasting tool. The tool runs correlation tests on over 20 macro-economic and socio-demographic market drivers and indicators, and selects the most statistically significant to be used as final forecasting inputs. Forecasting models are then applied and the results of these are then rigorously reviewed against research on trends and forecasts to ensure final forecasts fully reflect market signals.<br>
slide5. A primary research team conducts interviews to confirm the data Consumer Packaged Goods Retail Data 5 MarketLine conducts primary interviews with multiple players across the value chain in order to gain primary industry inputs into our market sizing data, as well as brand, manufacturer and channel shares.
Over the entire process, which includes on-going data validation, every brand present in the dataset is contacted so that they may verify or amend the market share assigned them. Market size figures are also confirmed with the MarketLine network of industry contacts.
A dedicated in-house primary calling team works to verify the data after each country file has been created, in particular focusing on any areas where information was scarce or on any points of query arising from the review.
Full details and transcripts of each interview are recorded and the information that is provided is sanity-checked against other inputs before use. Once checked, the data is either considered verified or updated in line with the new primary information.
Post-review, a quality audit team conducts a thorough review of the new dataset in order to quantify how much improvement has been made and if there are any areas where further work is needed. A final numerical score is created and this score is reviewed by senior management. Sectors where scores are not considered satisfactory receive additional attention and review.
Calls also take place post-publication to help further validate and verify the data and in order to contact as many brands and manufacturers as possible.<br>
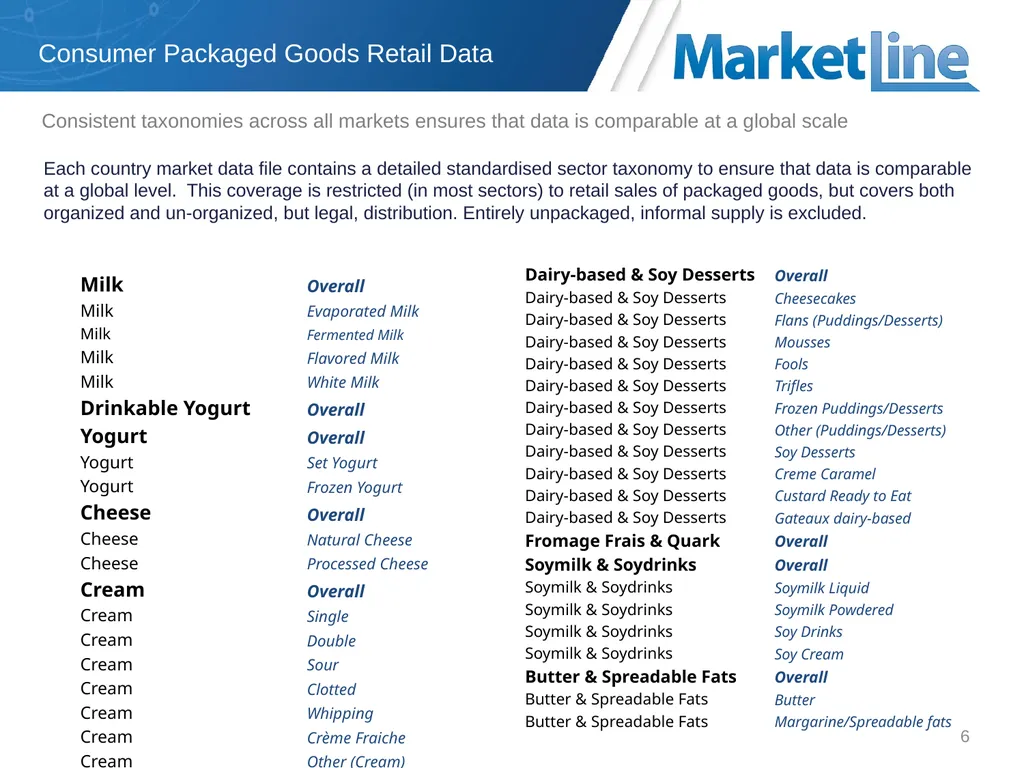
slide6. Consistent taxonomies across all markets ensures that data is comparable at a global scale Consumer Packaged Goods Retail Data 6 Each country market data file contains a detailed standardised sector taxonomy to ensure that data is comparable at a global level. This coverage is restricted (in most sectors) to retail sales of packaged goods, but covers both organized and un-organized, but legal, distribution. Entirely unpackaged, informal supply is excluded.<br>
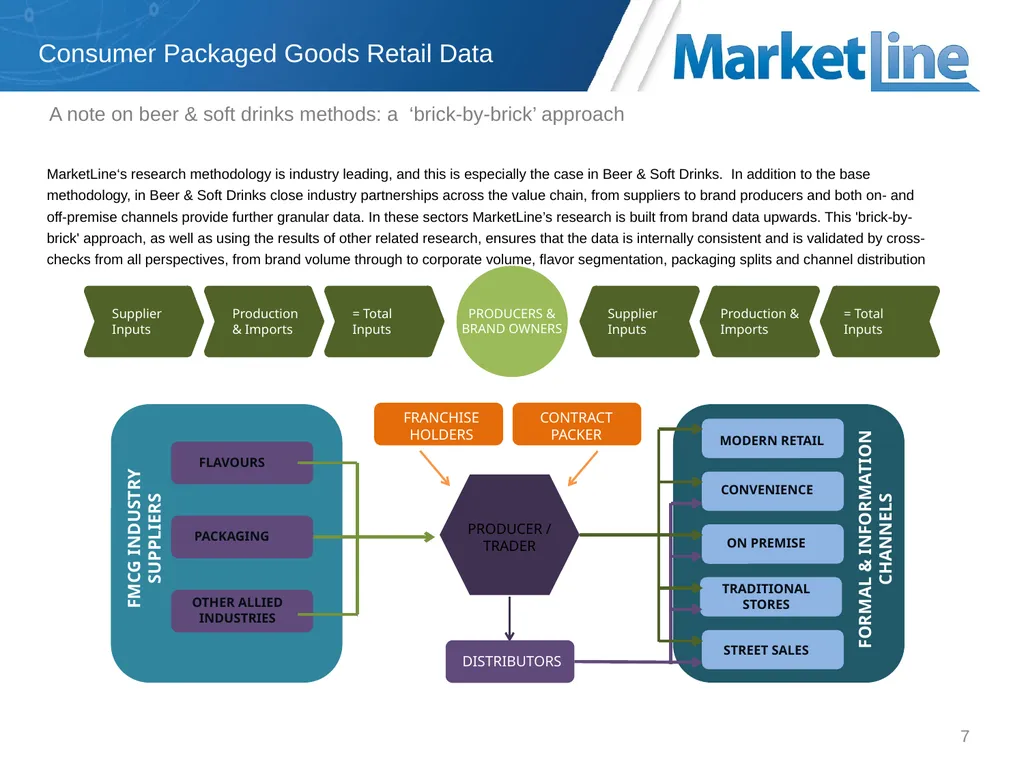
slide7. A note on beer & soft drinks methods: a ‘brick-by-brick’ approach Consumer Packaged Goods Retail Data 7 MarketLine‘s research methodology is industry leading, and this is especially the case in Beer & Soft Drinks. In addition to the base methodology, in Beer & Soft Drinks close industry partnerships across the value chain, from suppliers to brand producers and both on- and off-premise channels provide further granular data. In these sectors MarketLine’s research is built from brand data upwards. This 'brick-by-brick' approach, as well as using the results of other related research, ensures that the data is internally consistent and is validated by cross-checks from all perspectives, from brand volume through to corporate volume, flavor segmentation, packaging splits and channel distribution Supplier Inputs Production & Imports Supplier Inputs = Total Inputs Production & Imports = Total Inputs PRODUCERS & BRAND OWNERS FLAVOURS PACKAGING OTHER ALLIED INDUSTRIES MODERN RETAIL CONVENIENCE TRADITIONAL STORES ON PREMISE STREET SALES DISTRIBUTORS PRODUCER / TRADER FRANCHISE HOLDERS CONTRACT PACKER FMCG INDUSTRY SUPPLIERS FORMAL & INFORMATION CHANNELS<br>
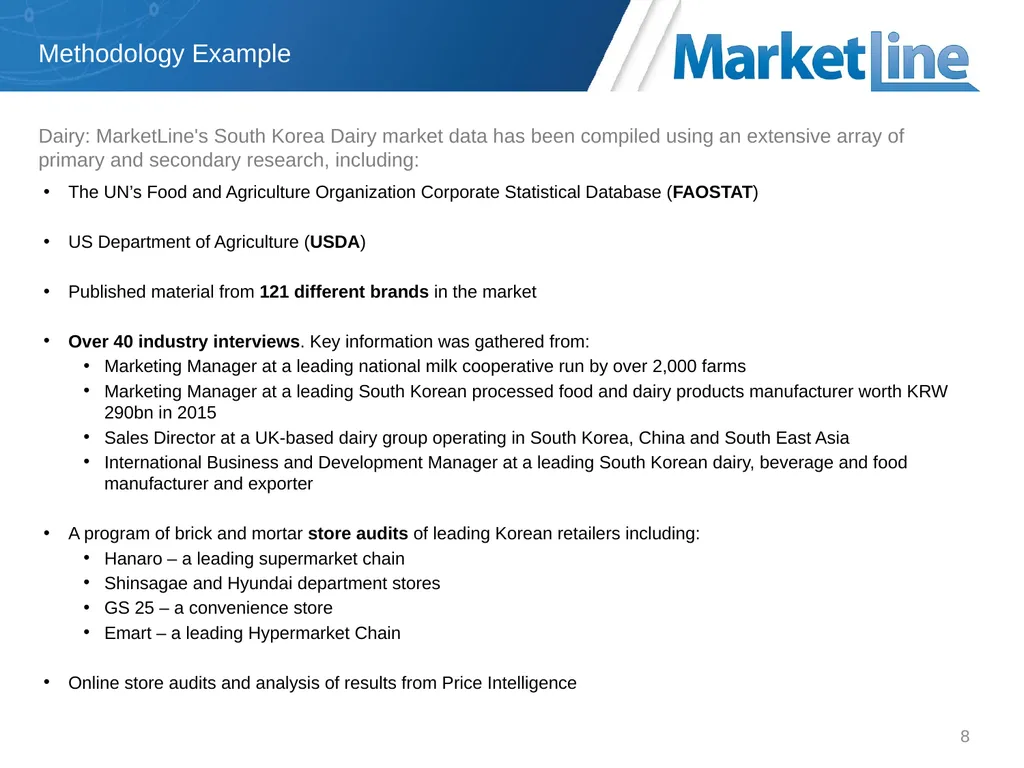
slide8. Dairy: MarketLine's South Korea Dairy market data has been compiled using an extensive array of primary and secondary research, including: Methodology Example 8 The UN’s Food and Agriculture Organization Corporate Statistical Database (FAOSTAT)
US Department of Agriculture (USDA)
Published material from 121 different brands in the market
Over 40 industry interviews. Key information was gathered from:
Marketing Manager at a leading national milk cooperative run by over 2,000 farms
Marketing Manager at a leading South Korean processed food and dairy products manufacturer worth KRW 290bn in 2015
Sales Director at a UK-based dairy group operating in South Korea, China and South East Asia
International Business and Development Manager at a leading South Korean dairy, beverage and food manufacturer and exporter
A program of brick and mortar store audits of leading Korean retailers including:
Hanaro – a leading supermarket chain
Shinsagae and Hyundai department stores
GS 25 – a convenience store
Emart – a leading Hypermarket Chain
Online store audits and analysis of results from Price Intelligence<br>
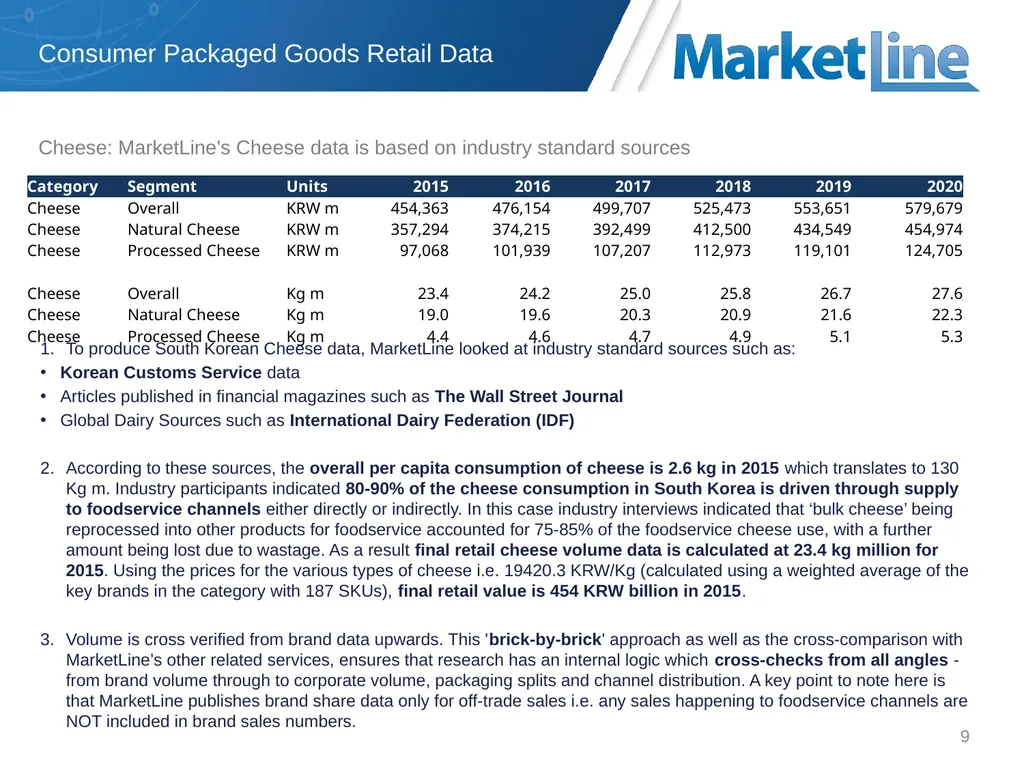
slide9. Cheese: MarketLine's Cheese data is based on industry standard sources Consumer Packaged Goods Retail Data 9 To produce South Korean Cheese data, MarketLine looked at industry standard sources such as:
Korean Customs Service data
Articles published in financial magazines such as The Wall Street Journal
Global Dairy Sources such as International Dairy Federation (IDF)
According to these sources, the overall per capita consumption of cheese is 2.6 kg in 2015 which translates to 130 Kg m. Industry participants indicated 80-90% of the cheese consumption in South Korea is driven through supply to foodservice channels either directly or indirectly. In this case industry interviews indicated that ‘bulk cheese’ being reprocessed into other products for foodservice accounted for 75-85% of the foodservice cheese use, with a further amount being lost due to wastage. As a result final retail cheese volume data is calculated at 23.4 kg million for 2015. Using the prices for the various types of cheese i.e. 19420.3 KRW/Kg (calculated using a weighted average of the key brands in the category with 187 SKUs), final retail value is 454 KRW billion in 2015.
Volume is cross verified from brand data upwards. This 'brick-by-brick' approach as well as the cross-comparison with MarketLine’s other related services, ensures that research has an internal logic which cross-checks from all angles - from brand volume through to corporate volume, packaging splits and channel distribution. A key point to note here is that MarketLine publishes brand share data only for off-trade sales i.e. any sales happening to foodservice channels are NOT included in brand sales numbers.<br>
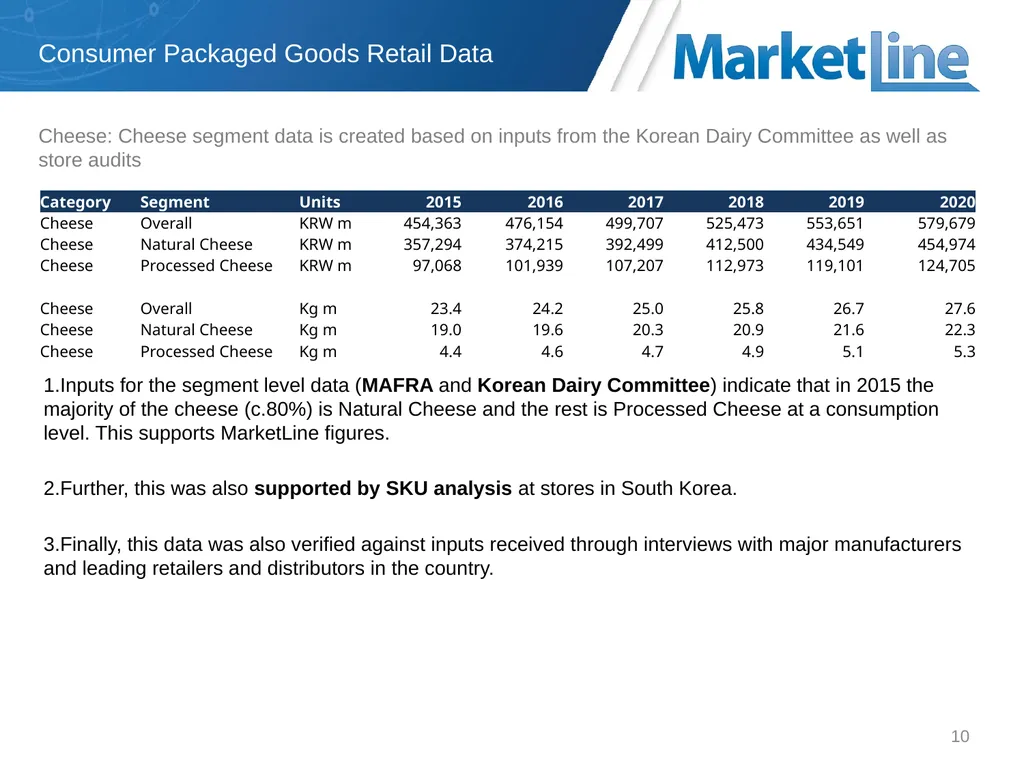
slide10. Cheese: Cheese segment data is created based on inputs from the Korean Dairy Committee as well as store audits Consumer Packaged Goods Retail Data 10 Inputs for the segment level data (MAFRA and Korean Dairy Committee) indicate that in 2015 the majority of the cheese (c.80%) is Natural Cheese and the rest is Processed Cheese at a consumption level. This supports MarketLine figures.
Further, this was also supported by SKU analysis at stores in South Korea.
Finally, this data was also verified against inputs received through interviews with major manufacturers and leading retailers and distributors in the country.<br>
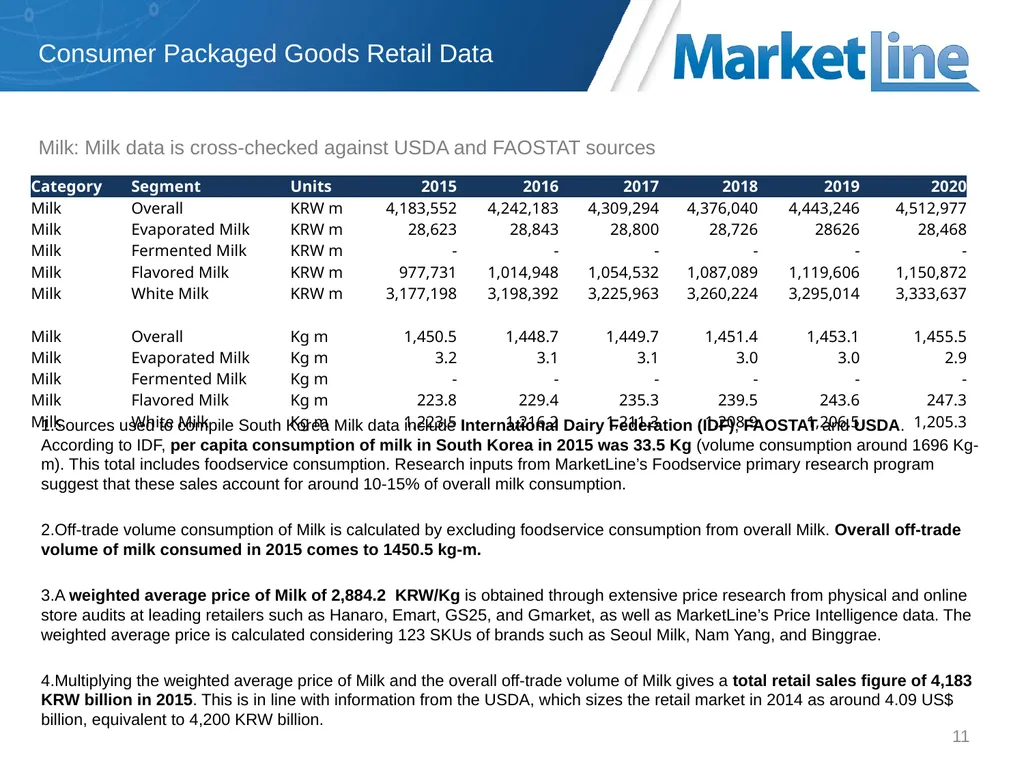
slide11. Milk: Milk data is cross-checked against USDA and FAOSTAT sources Consumer Packaged Goods Retail Data 11 Sources used to compile South Korea Milk data include International Dairy Federation (IDF), FAOSTAT and USDA. According to IDF, per capita consumption of milk in South Korea in 2015 was 33.5 Kg (volume consumption around 1696 Kg-m). This total includes foodservice consumption. Research inputs from MarketLine’s Foodservice primary research program suggest that these sales account for around 10-15% of overall milk consumption.
Off-trade volume consumption of Milk is calculated by excluding foodservice consumption from overall Milk. Overall off-trade volume of milk consumed in 2015 comes to 1450.5 kg-m.
A weighted average price of Milk of 2,884.2 KRW/Kg is obtained through extensive price research from physical and online store audits at leading retailers such as Hanaro, Emart, GS25, and Gmarket, as well as MarketLine’s Price Intelligence data. The weighted average price is calculated considering 123 SKUs of brands such as Seoul Milk, Nam Yang, and Binggrae.
Multiplying the weighted average price of Milk and the overall off-trade volume of Milk gives a total retail sales figure of 4,183 KRW billion in 2015. This is in line with information from the USDA, which sizes the retail market in 2014 as around 4.09 US$ billion, equivalent to 4,200 KRW billion.<br>
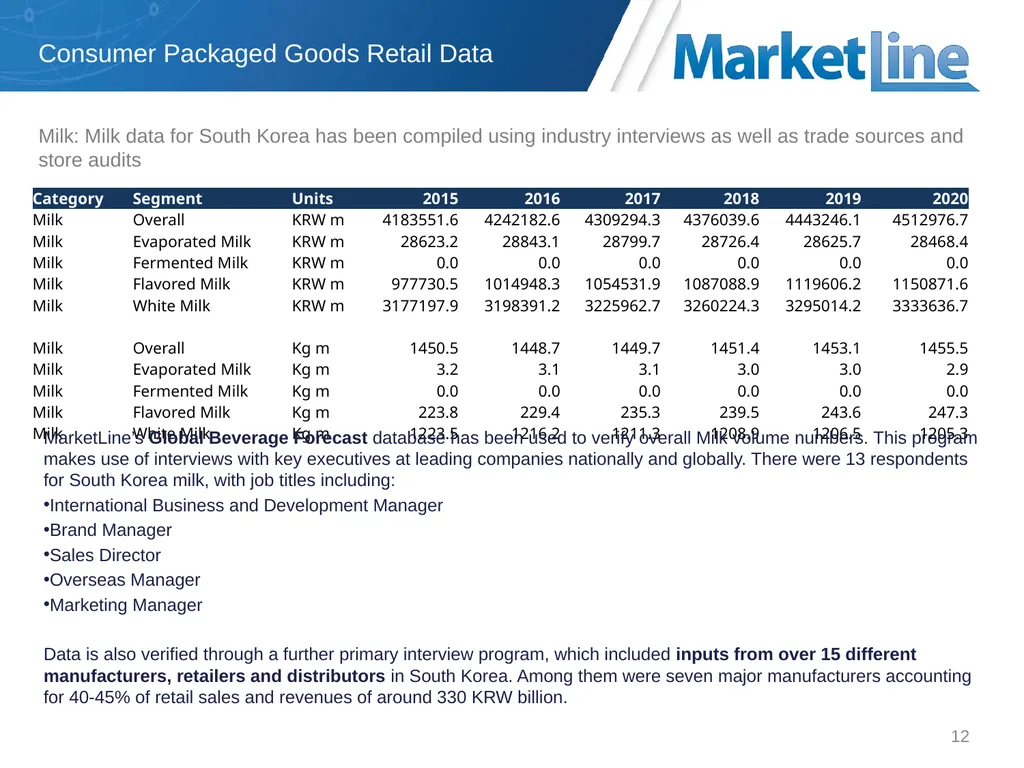
slide12. Milk: Milk data for South Korea has been compiled using industry interviews as well as trade sources and store audits Consumer Packaged Goods Retail Data 12 MarketLine’s Global Beverage Forecast database has been used to verify overall Milk volume numbers. This program makes use of interviews with key executives at leading companies nationally and globally. There were 13 respondents for South Korea milk, with job titles including:
International Business and Development Manager
Brand Manager
Sales Director
Overseas Manager
Marketing Manager
Data is also verified through a further primary interview program, which included inputs from over 15 different manufacturers, retailers and distributors in South Korea. Among them were seven major manufacturers accounting for 40-45% of retail sales and revenues of around 330 KRW billion.<br>
slide13. Ask the Analyst If you have any questions regarding our research or would like more information on our service offering please contact us.
Email:
reachus@marketline.com
Phone:
UK +44 (0) 207 936 6991 US +1 646 625 7389 AP +61 (0)3 8842 2478 Appendix 13<br>
slide2. Introduction This document sets out how MarketLine produces market sizing data for retail Consumer Packaged Goods (CPG) markets by
Volume
Value
Brand / manufacturer
Channel. Market Data Analytics Methodology 2<br>
slide3. Market Data Analytics Methodology 3 We use a robust and transparent research methodology Thorough review of:
Industry and trade research
Government and official statistics
Proprietary online databases
Academic journals
Press releases COMPREHENSIVE
SECONDARY
RESEARCH EXTENSIVE
PRIMARY
RESEARCH MARKET
MODELING &
ANALYST
TRIANGULATION DATA
FINALIZATION Review of historical data
Testing and assessment by Category Analyst TOP-DOWN CROSS CHECKS Comprehensive on-the-ground store audits
Industry interviews from companies representing 80% market share
Key opinion leader interviews
Over 200,000 consumer survey responses<br>
slide4. MarketLine creates market data country by country with each country file undergoing multi-step management review Consumer Packaged Goods Retail Data 4 MarketLine builds market data from the bottom up, with each country undergoing a thorough analyst review at the segment and sub-segment level. Each country’s data file undergoes multiple rounds of proofing by a senior analyst and project manager before sign off.
Using last year’s data as an initial baseline input, every row of data is audited and assigned a confidence score based on the level of sourcing available.
Research inputs at this stage include contact with:
Trade bodies
Manufacturers and brands
Native retailers
Financial/broker reports
National statistics
MarketLine’s internal resources such as consumer surveys, macroeconomic databases, deals and company news tracking, consumer sentiment analysis, country and city profiles.
These inputs are triangulated to produce a final category, segment, or sub-segment data point. Each data point is checked on a country by country basis against population size and economic information to ensure consumption per capita, expenditure per capita and average prices are robust.
MarketLine also conducts primary interviews with multiple players across the value chain in order to confirm market sizing and brand and manufacturer shares. Market size figures are also confirmed with MarketLine’s network of industry contacts.
Forecasts are created using the first draft data set, which is fed into a multivariate forecasting tool. The tool runs correlation tests on over 20 macro-economic and socio-demographic market drivers and indicators, and selects the most statistically significant to be used as final forecasting inputs. Forecasting models are then applied and the results of these are then rigorously reviewed against research on trends and forecasts to ensure final forecasts fully reflect market signals.<br>
slide5. A primary research team conducts interviews to confirm the data Consumer Packaged Goods Retail Data 5 MarketLine conducts primary interviews with multiple players across the value chain in order to gain primary industry inputs into our market sizing data, as well as brand, manufacturer and channel shares.
Over the entire process, which includes on-going data validation, every brand present in the dataset is contacted so that they may verify or amend the market share assigned them. Market size figures are also confirmed with the MarketLine network of industry contacts.
A dedicated in-house primary calling team works to verify the data after each country file has been created, in particular focusing on any areas where information was scarce or on any points of query arising from the review.
Full details and transcripts of each interview are recorded and the information that is provided is sanity-checked against other inputs before use. Once checked, the data is either considered verified or updated in line with the new primary information.
Post-review, a quality audit team conducts a thorough review of the new dataset in order to quantify how much improvement has been made and if there are any areas where further work is needed. A final numerical score is created and this score is reviewed by senior management. Sectors where scores are not considered satisfactory receive additional attention and review.
Calls also take place post-publication to help further validate and verify the data and in order to contact as many brands and manufacturers as possible.<br>
slide6. Consistent taxonomies across all markets ensures that data is comparable at a global scale Consumer Packaged Goods Retail Data 6 Each country market data file contains a detailed standardised sector taxonomy to ensure that data is comparable at a global level. This coverage is restricted (in most sectors) to retail sales of packaged goods, but covers both organized and un-organized, but legal, distribution. Entirely unpackaged, informal supply is excluded.<br>
slide7. A note on beer & soft drinks methods: a ‘brick-by-brick’ approach Consumer Packaged Goods Retail Data 7 MarketLine‘s research methodology is industry leading, and this is especially the case in Beer & Soft Drinks. In addition to the base methodology, in Beer & Soft Drinks close industry partnerships across the value chain, from suppliers to brand producers and both on- and off-premise channels provide further granular data. In these sectors MarketLine’s research is built from brand data upwards. This 'brick-by-brick' approach, as well as using the results of other related research, ensures that the data is internally consistent and is validated by cross-checks from all perspectives, from brand volume through to corporate volume, flavor segmentation, packaging splits and channel distribution Supplier Inputs Production & Imports Supplier Inputs = Total Inputs Production & Imports = Total Inputs PRODUCERS & BRAND OWNERS FLAVOURS PACKAGING OTHER ALLIED INDUSTRIES MODERN RETAIL CONVENIENCE TRADITIONAL STORES ON PREMISE STREET SALES DISTRIBUTORS PRODUCER / TRADER FRANCHISE HOLDERS CONTRACT PACKER FMCG INDUSTRY SUPPLIERS FORMAL & INFORMATION CHANNELS<br>
slide8. Dairy: MarketLine's South Korea Dairy market data has been compiled using an extensive array of primary and secondary research, including: Methodology Example 8 The UN’s Food and Agriculture Organization Corporate Statistical Database (FAOSTAT)
US Department of Agriculture (USDA)
Published material from 121 different brands in the market
Over 40 industry interviews. Key information was gathered from:
Marketing Manager at a leading national milk cooperative run by over 2,000 farms
Marketing Manager at a leading South Korean processed food and dairy products manufacturer worth KRW 290bn in 2015
Sales Director at a UK-based dairy group operating in South Korea, China and South East Asia
International Business and Development Manager at a leading South Korean dairy, beverage and food manufacturer and exporter
A program of brick and mortar store audits of leading Korean retailers including:
Hanaro – a leading supermarket chain
Shinsagae and Hyundai department stores
GS 25 – a convenience store
Emart – a leading Hypermarket Chain
Online store audits and analysis of results from Price Intelligence<br>
slide9. Cheese: MarketLine's Cheese data is based on industry standard sources Consumer Packaged Goods Retail Data 9 To produce South Korean Cheese data, MarketLine looked at industry standard sources such as:
Korean Customs Service data
Articles published in financial magazines such as The Wall Street Journal
Global Dairy Sources such as International Dairy Federation (IDF)
According to these sources, the overall per capita consumption of cheese is 2.6 kg in 2015 which translates to 130 Kg m. Industry participants indicated 80-90% of the cheese consumption in South Korea is driven through supply to foodservice channels either directly or indirectly. In this case industry interviews indicated that ‘bulk cheese’ being reprocessed into other products for foodservice accounted for 75-85% of the foodservice cheese use, with a further amount being lost due to wastage. As a result final retail cheese volume data is calculated at 23.4 kg million for 2015. Using the prices for the various types of cheese i.e. 19420.3 KRW/Kg (calculated using a weighted average of the key brands in the category with 187 SKUs), final retail value is 454 KRW billion in 2015.
Volume is cross verified from brand data upwards. This 'brick-by-brick' approach as well as the cross-comparison with MarketLine’s other related services, ensures that research has an internal logic which cross-checks from all angles - from brand volume through to corporate volume, packaging splits and channel distribution. A key point to note here is that MarketLine publishes brand share data only for off-trade sales i.e. any sales happening to foodservice channels are NOT included in brand sales numbers.<br>
slide10. Cheese: Cheese segment data is created based on inputs from the Korean Dairy Committee as well as store audits Consumer Packaged Goods Retail Data 10 Inputs for the segment level data (MAFRA and Korean Dairy Committee) indicate that in 2015 the majority of the cheese (c.80%) is Natural Cheese and the rest is Processed Cheese at a consumption level. This supports MarketLine figures.
Further, this was also supported by SKU analysis at stores in South Korea.
Finally, this data was also verified against inputs received through interviews with major manufacturers and leading retailers and distributors in the country.<br>
slide11. Milk: Milk data is cross-checked against USDA and FAOSTAT sources Consumer Packaged Goods Retail Data 11 Sources used to compile South Korea Milk data include International Dairy Federation (IDF), FAOSTAT and USDA. According to IDF, per capita consumption of milk in South Korea in 2015 was 33.5 Kg (volume consumption around 1696 Kg-m). This total includes foodservice consumption. Research inputs from MarketLine’s Foodservice primary research program suggest that these sales account for around 10-15% of overall milk consumption.
Off-trade volume consumption of Milk is calculated by excluding foodservice consumption from overall Milk. Overall off-trade volume of milk consumed in 2015 comes to 1450.5 kg-m.
A weighted average price of Milk of 2,884.2 KRW/Kg is obtained through extensive price research from physical and online store audits at leading retailers such as Hanaro, Emart, GS25, and Gmarket, as well as MarketLine’s Price Intelligence data. The weighted average price is calculated considering 123 SKUs of brands such as Seoul Milk, Nam Yang, and Binggrae.
Multiplying the weighted average price of Milk and the overall off-trade volume of Milk gives a total retail sales figure of 4,183 KRW billion in 2015. This is in line with information from the USDA, which sizes the retail market in 2014 as around 4.09 US$ billion, equivalent to 4,200 KRW billion.<br>
slide12. Milk: Milk data for South Korea has been compiled using industry interviews as well as trade sources and store audits Consumer Packaged Goods Retail Data 12 MarketLine’s Global Beverage Forecast database has been used to verify overall Milk volume numbers. This program makes use of interviews with key executives at leading companies nationally and globally. There were 13 respondents for South Korea milk, with job titles including:
International Business and Development Manager
Brand Manager
Sales Director
Overseas Manager
Marketing Manager
Data is also verified through a further primary interview program, which included inputs from over 15 different manufacturers, retailers and distributors in South Korea. Among them were seven major manufacturers accounting for 40-45% of retail sales and revenues of around 330 KRW billion.<br>
slide13. Ask the Analyst If you have any questions regarding our research or would like more information on our service offering please contact us.
Email:
reachus@marketline.com
Phone:
UK +44 (0) 207 936 6991 US +1 646 625 7389 AP +61 (0)3 8842 2478 Appendix 13<br>