
Material for MDAG meeting 24 August 2022 100%
PM
Published · 30 slides · 0 views

1 / 1
Description
Material for MDAG meeting 24 August 2022 100 renewable electricity supply competition issues 1 The Issues Paper found that competition for mediumlonger term flexibility services (e.g. wind firming) may thin as the system shifts to
Related Topics
Share
Embed code
Download this presentation From Below
"Material for MDAG meeting 24 August 2022 100%" is the property of its rightful owner. Permission is granted to download and print the materials on this website for personal, non-commercial use only, and to display it on your personal computer provided you do not modify the materials and that you retain all copyright notices contained in the materials. By downloading content from our website, you accept the terms of this agreement.
Presentation Transcript
01
Material for MDAG meeting 24 August 2022 100% renewable electricity supply – competition issues 1<br>
02
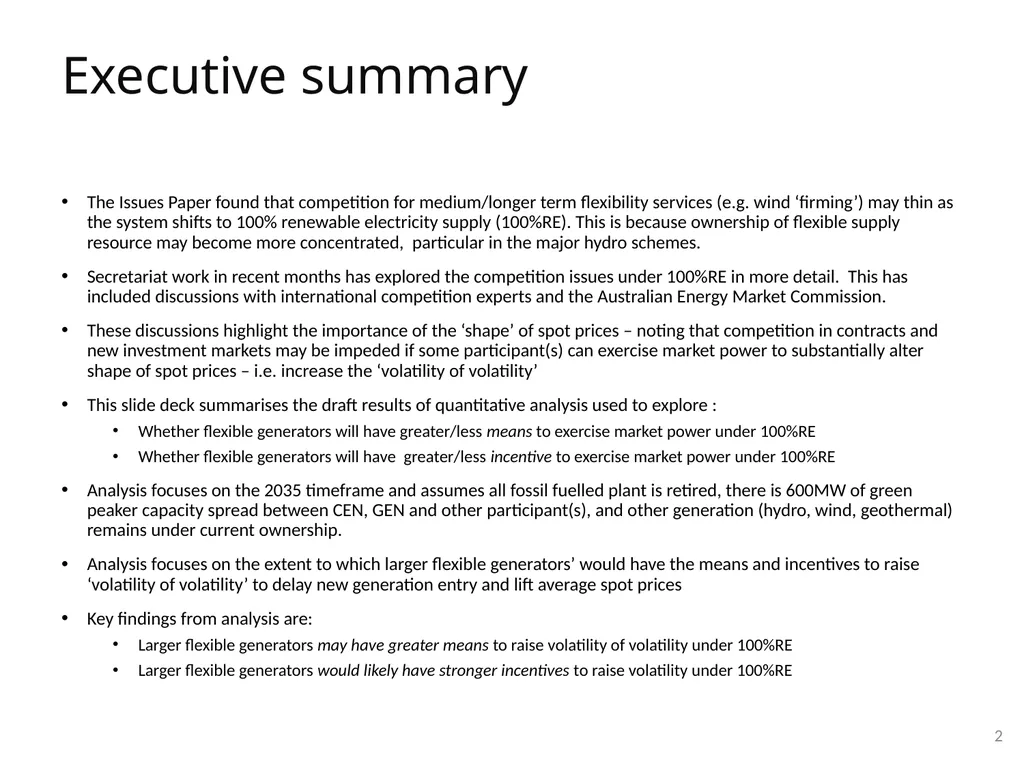
The Issues Paper found that competition for medium/longer term flexibility services (e.g. wind ‘firming’) may thin as the system shifts to 100% renewable electricity supply (100%RE). This is because ownership of flexible supply resource may become more concentrated, particular in the major hydro schemes.
Secretariat work in recent months has explored the competition issues under 100%RE in more detail. This has included discussions with international competition experts and the Australian Energy Market Commission.
These discussions highlight the importance of the ‘shape’ of spot prices – noting that competition in contracts and new investment markets may be impeded if some participant(s) can exercise market power to substantially alter shape of spot prices – i.e. increase the ‘volatility of volatility’
This slide deck summarises the draft results of quantitative analysis used to explore :
Whether flexible generators will have greater/less means to exercise market power under 100%RE
Whether flexible generators will have greater/less incentive to exercise market power under 100%RE
Analysis focuses on the 2035 timeframe and assumes all fossil fuelled plant is retired, there is 600MW of green peaker capacity spread between CEN, GEN and other participant(s), and other generation (hydro, wind, geothermal) remains under current ownership.
Analysis focuses on the extent to which larger flexible generators’ would have the means and incentives to raise ‘volatility of volatility’ to delay new generation entry and lift average spot prices
Key findings from analysis are:
Larger flexible generators may have greater means to raise volatility of volatility under 100%RE
Larger flexible generators would likely have stronger incentives to raise volatility under 100%RE Executive summary 2<br>
Secretariat work in recent months has explored the competition issues under 100%RE in more detail. This has included discussions with international competition experts and the Australian Energy Market Commission.
These discussions highlight the importance of the ‘shape’ of spot prices – noting that competition in contracts and new investment markets may be impeded if some participant(s) can exercise market power to substantially alter shape of spot prices – i.e. increase the ‘volatility of volatility’
This slide deck summarises the draft results of quantitative analysis used to explore :
Whether flexible generators will have greater/less means to exercise market power under 100%RE
Whether flexible generators will have greater/less incentive to exercise market power under 100%RE
Analysis focuses on the 2035 timeframe and assumes all fossil fuelled plant is retired, there is 600MW of green peaker capacity spread between CEN, GEN and other participant(s), and other generation (hydro, wind, geothermal) remains under current ownership.
Analysis focuses on the extent to which larger flexible generators’ would have the means and incentives to raise ‘volatility of volatility’ to delay new generation entry and lift average spot prices
Key findings from analysis are:
Larger flexible generators may have greater means to raise volatility of volatility under 100%RE
Larger flexible generators would likely have stronger incentives to raise volatility under 100%RE Executive summary 2<br>
03
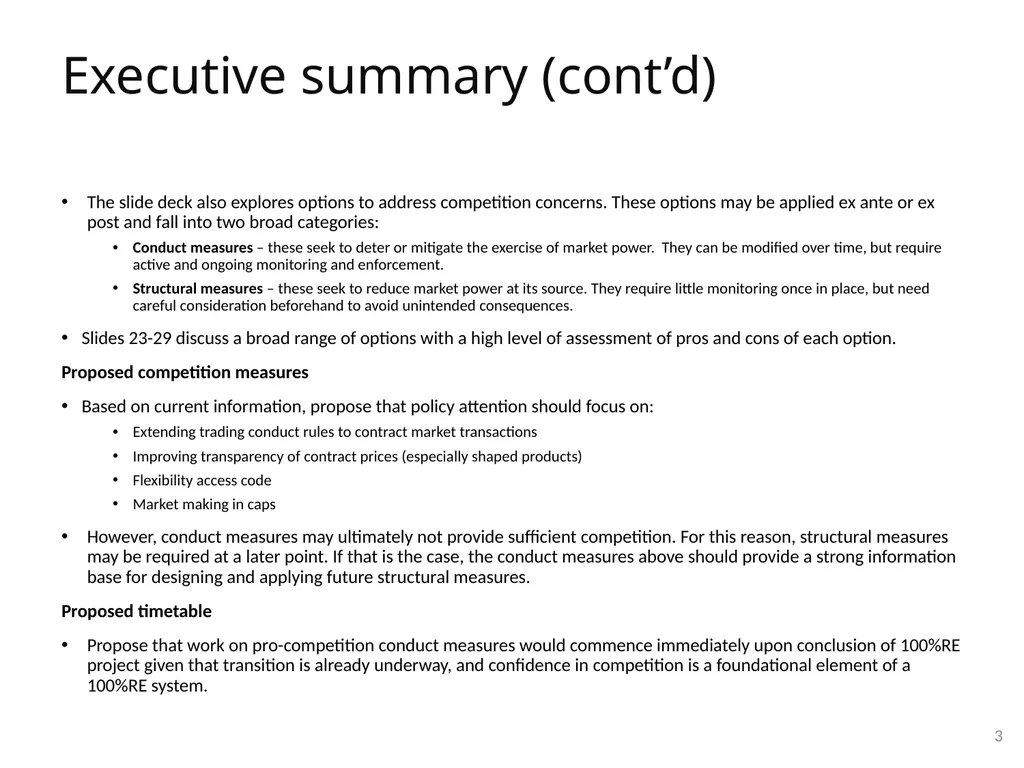
The slide deck also explores options to address competition concerns. These options may be applied ex ante or ex post and fall into two broad categories:
Conduct measures – these seek to deter or mitigate the exercise of market power. They can be modified over time, but require active and ongoing monitoring and enforcement.
Structural measures – these seek to reduce market power at its source. They require little monitoring once in place, but need careful consideration beforehand to avoid unintended consequences.
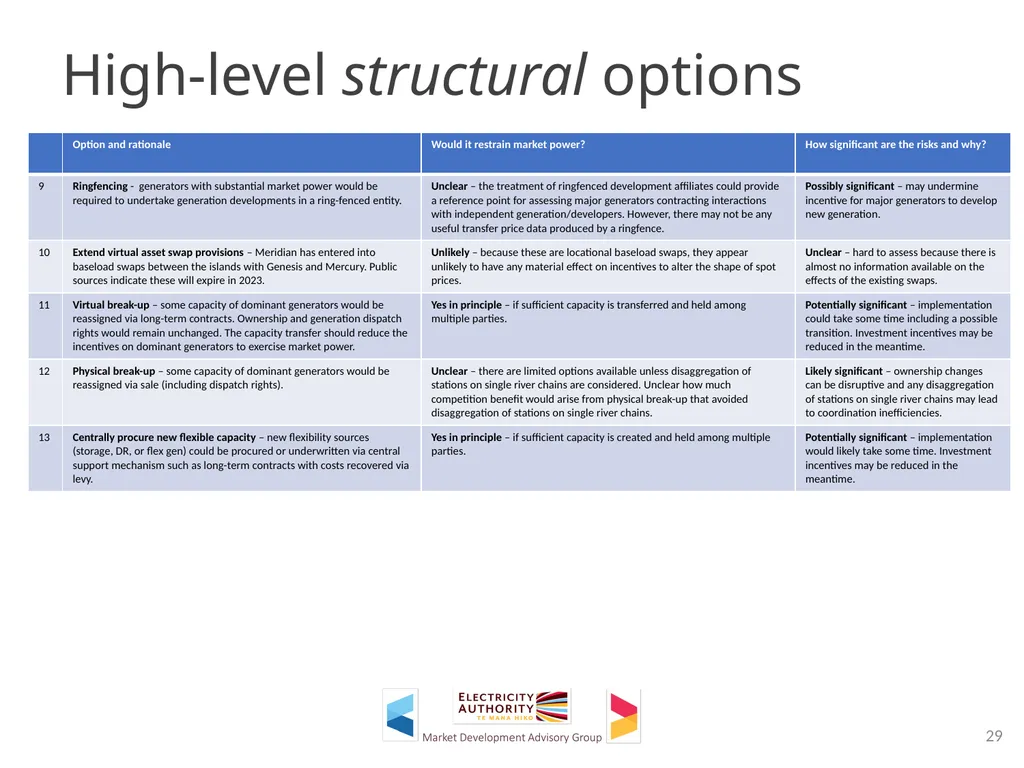
Slides 23-29 discuss a broad range of options with a high level of assessment of pros and cons of each option.
Proposed competition measures
Based on current information, propose that policy attention should focus on:
Extending trading conduct rules to contract market transactions
Improving transparency of contract prices (especially shaped products)
Flexibility access code
Market making in caps
However, conduct measures may ultimately not provide sufficient competition. For this reason, structural measures may be required at a later point. If that is the case, the conduct measures above should provide a strong information base for designing and applying future structural measures.
Proposed timetable
Propose that work on pro-competition conduct measures would commence immediately upon conclusion of 100%RE project given that transition is already underway, and confidence in competition is a foundational element of a 100%RE system. Executive summary (cont’d) 3<br>
Conduct measures – these seek to deter or mitigate the exercise of market power. They can be modified over time, but require active and ongoing monitoring and enforcement.
Structural measures – these seek to reduce market power at its source. They require little monitoring once in place, but need careful consideration beforehand to avoid unintended consequences.
Slides 23-29 discuss a broad range of options with a high level of assessment of pros and cons of each option.
Proposed competition measures
Based on current information, propose that policy attention should focus on:
Extending trading conduct rules to contract market transactions
Improving transparency of contract prices (especially shaped products)
Flexibility access code
Market making in caps
However, conduct measures may ultimately not provide sufficient competition. For this reason, structural measures may be required at a later point. If that is the case, the conduct measures above should provide a strong information base for designing and applying future structural measures.
Proposed timetable
Propose that work on pro-competition conduct measures would commence immediately upon conclusion of 100%RE project given that transition is already underway, and confidence in competition is a foundational element of a 100%RE system. Executive summary (cont’d) 3<br>
04
What competition concerns might arise with 100% renewables
Approach to gauging significance of potential concerns
Options to address potential concerns What this pack covers 4<br>
Approach to gauging significance of potential concerns
Options to address potential concerns What this pack covers 4<br>
05
What competition concern might arise with 100% renewables? 5<br>
06
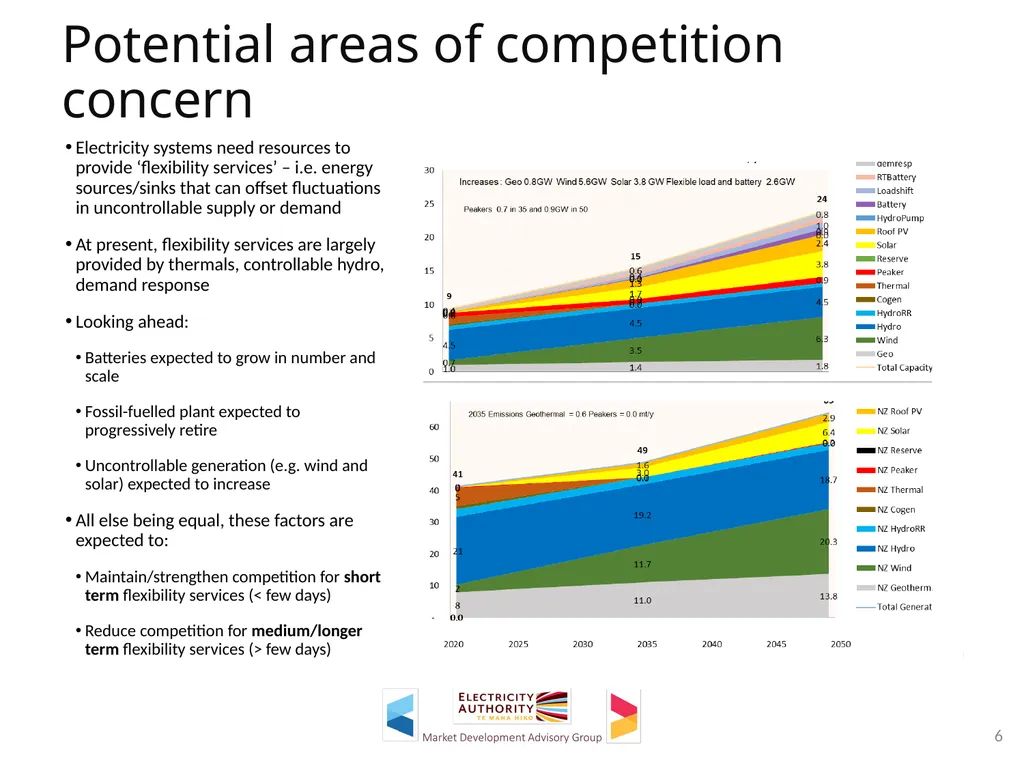
Electricity systems need resources to provide ‘flexibility services’ – i.e. energy sources/sinks that can offset fluctuations in uncontrollable supply or demand
At present, flexibility services are largely provided by thermals, controllable hydro, demand response
Looking ahead:
Batteries expected to grow in number and scale
Fossil-fuelled plant expected to progressively retire
Uncontrollable generation (e.g. wind and solar) expected to increase
All else being equal, these factors are expected to:
Maintain/strengthen competition for short term flexibility services (< few days)
Reduce competition for medium/longer term flexibility services (> few days) Potential areas of competition concern 6<br>
At present, flexibility services are largely provided by thermals, controllable hydro, demand response
Looking ahead:
Batteries expected to grow in number and scale
Fossil-fuelled plant expected to progressively retire
Uncontrollable generation (e.g. wind and solar) expected to increase
All else being equal, these factors are expected to:
Maintain/strengthen competition for short term flexibility services (< few days)
Reduce competition for medium/longer term flexibility services (> few days) Potential areas of competition concern 6<br>
07
Approach used to gauge significance of potential concerns 7<br>
08
Engaged with Prof George Yarrow and Dr Chris Decker (UK-based competition experts) to discuss competition issues that might arise under 100%RE
Engaged with AEMC to obtain Australian perspective on competition issues in NEM as thermals wind down
Key points to emerge from discussions:
Analysis of competition for flexible resources is complex – but the ‘shape’ of spot prices is likely to be a key issue
Competition in contracts and new investment markets may be impeded if some participant(s) can exercise market power to substantially alter shape of spot prices – i.e. increase the ‘volatility of volatility’
This type of issue was a concern in UK in early 1990s when two large players were regarded as having significant market power
Market power can be regarded as significant if the economic cost of the harm exceeds economic cost of the remedy
Electricity markets are unusual – a lot of harm can be done in a short period
Key issues to consider are whether participants will have means and incentive to exercise market power – and how this changes relative to historical position
Potential solutions to competition problems typically fall into a 2x2 matrix –solutions can be structural or conduct-based, and can be applied ex ante or ex post Analytical framework 8<br>
Engaged with AEMC to obtain Australian perspective on competition issues in NEM as thermals wind down
Key points to emerge from discussions:
Analysis of competition for flexible resources is complex – but the ‘shape’ of spot prices is likely to be a key issue
Competition in contracts and new investment markets may be impeded if some participant(s) can exercise market power to substantially alter shape of spot prices – i.e. increase the ‘volatility of volatility’
This type of issue was a concern in UK in early 1990s when two large players were regarded as having significant market power
Market power can be regarded as significant if the economic cost of the harm exceeds economic cost of the remedy
Electricity markets are unusual – a lot of harm can be done in a short period
Key issues to consider are whether participants will have means and incentive to exercise market power – and how this changes relative to historical position
Potential solutions to competition problems typically fall into a 2x2 matrix –solutions can be structural or conduct-based, and can be applied ex ante or ex post Analytical framework 8<br>
09
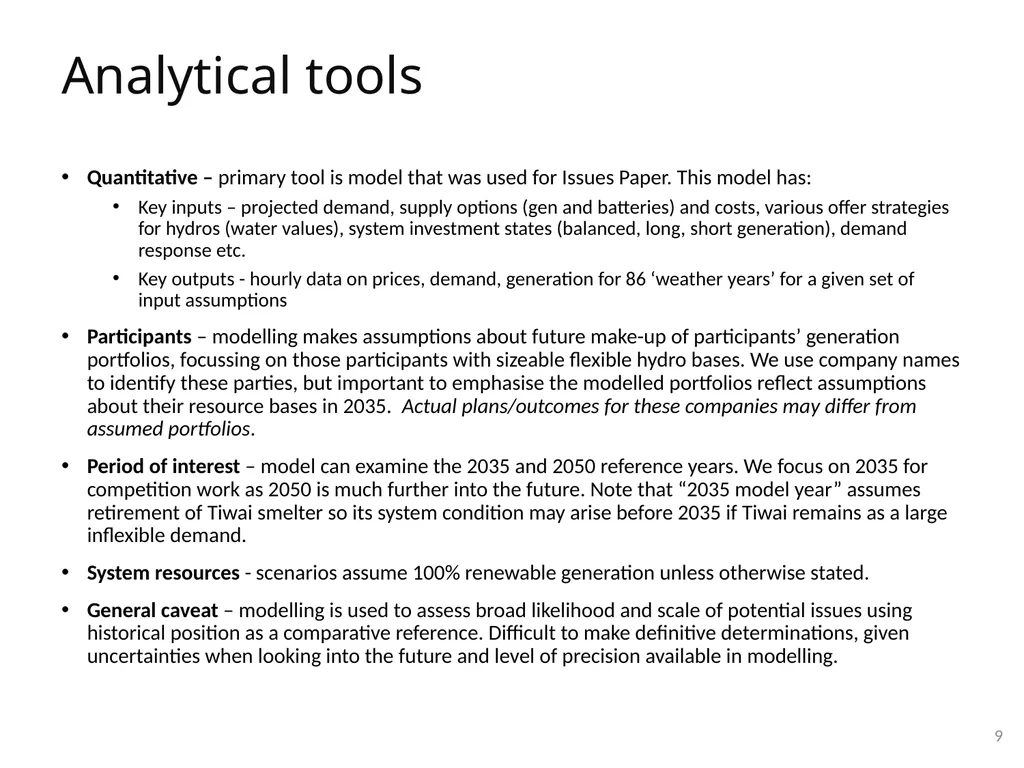
Quantitative – primary tool is model that was used for Issues Paper. This model has:
Key inputs – projected demand, supply options (gen and batteries) and costs, various offer strategies for hydros (water values), system investment states (balanced, long, short generation), demand response etc.
Key outputs - hourly data on prices, demand, generation for 86 ‘weather years’ for a given set of input assumptions
Participants – modelling makes assumptions about future make-up of participants’ generation portfolios, focussing on those participants with sizeable flexible hydro bases. We use company names to identify these parties, but important to emphasise the modelled portfolios reflect assumptions about their resource bases in 2035. Actual plans/outcomes for these companies may differ from assumed portfolios.
Period of interest – model can examine the 2035 and 2050 reference years. We focus on 2035 for competition work as 2050 is much further into the future. Note that “2035 model year” assumes retirement of Tiwai smelter so its system condition may arise before 2035 if Tiwai remains as a large inflexible demand.
System resources - scenarios assume 100% renewable generation unless otherwise stated.
General caveat – modelling is used to assess broad likelihood and scale of potential issues using historical position as a comparative reference. Difficult to make definitive determinations, given uncertainties when looking into the future and level of precision available in modelling. Analytical tools 9<br>
Key inputs – projected demand, supply options (gen and batteries) and costs, various offer strategies for hydros (water values), system investment states (balanced, long, short generation), demand response etc.
Key outputs - hourly data on prices, demand, generation for 86 ‘weather years’ for a given set of input assumptions
Participants – modelling makes assumptions about future make-up of participants’ generation portfolios, focussing on those participants with sizeable flexible hydro bases. We use company names to identify these parties, but important to emphasise the modelled portfolios reflect assumptions about their resource bases in 2035. Actual plans/outcomes for these companies may differ from assumed portfolios.
Period of interest – model can examine the 2035 and 2050 reference years. We focus on 2035 for competition work as 2050 is much further into the future. Note that “2035 model year” assumes retirement of Tiwai smelter so its system condition may arise before 2035 if Tiwai remains as a large inflexible demand.
System resources - scenarios assume 100% renewable generation unless otherwise stated.
General caveat – modelling is used to assess broad likelihood and scale of potential issues using historical position as a comparative reference. Difficult to make definitive determinations, given uncertainties when looking into the future and level of precision available in modelling. Analytical tools 9<br>
10
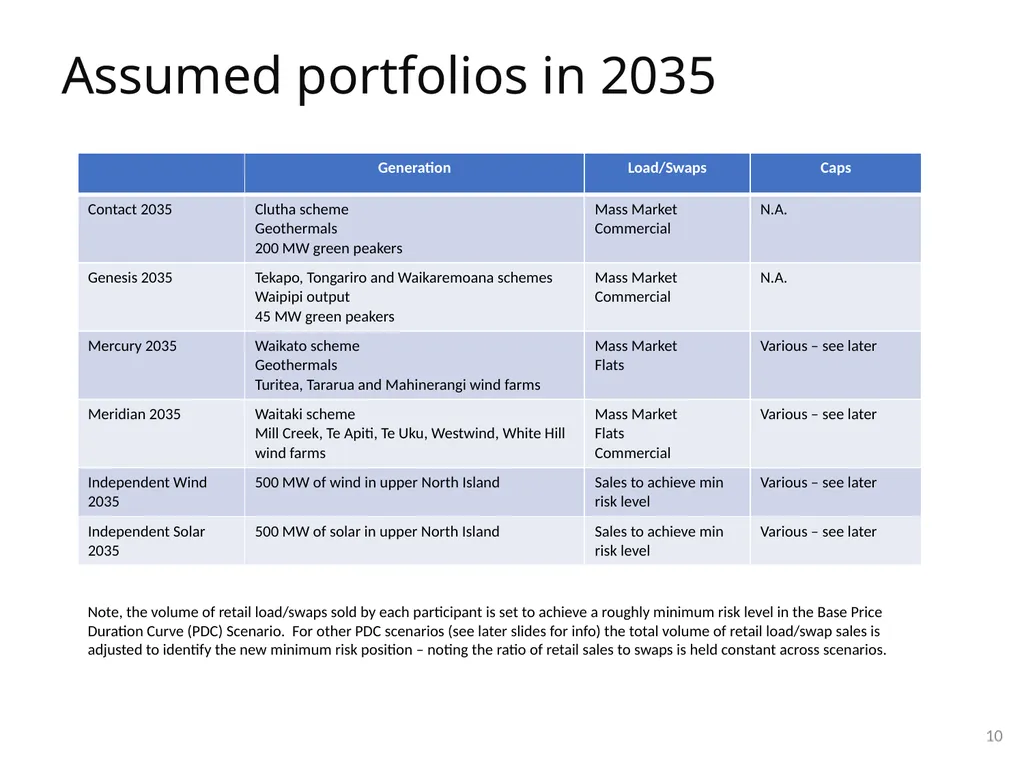
Assumed portfolios in 2035 10 Note, the volume of retail load/swaps sold by each participant is set to achieve a roughly minimum risk level in the Base Price Duration Curve (PDC) Scenario. For other PDC scenarios (see later slides for info) the total volume of retail load/swap sales is adjusted to identify the new minimum risk position – noting the ratio of retail sales to swaps is held constant across scenarios.<br>
11
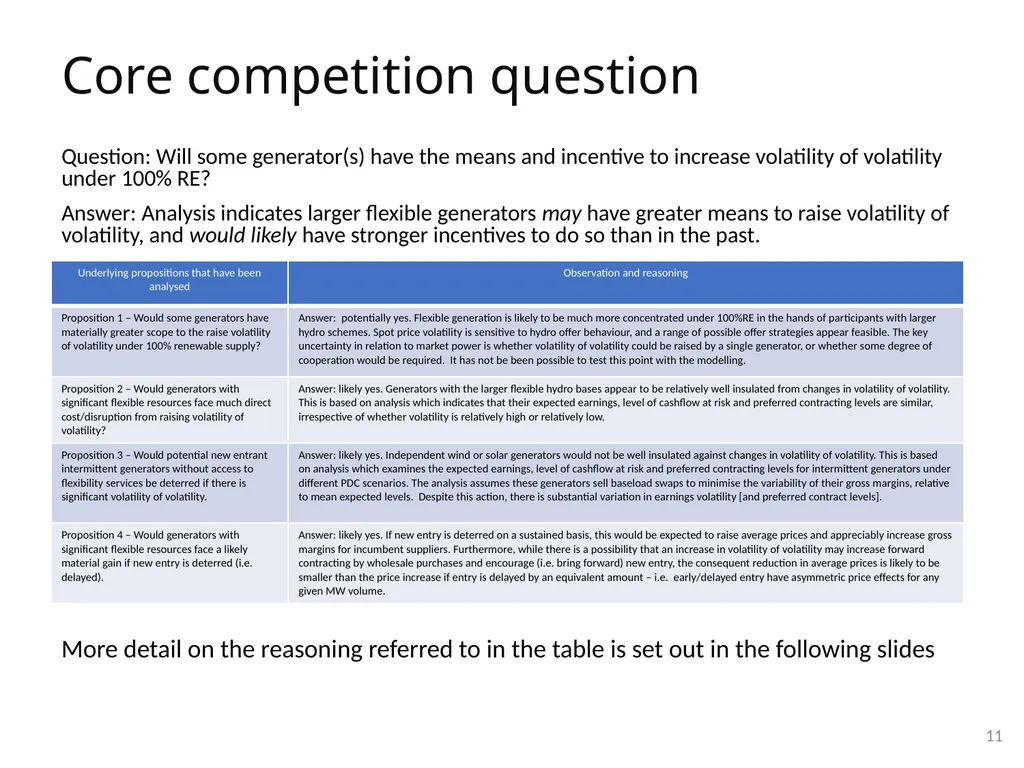
Question: Will some generator(s) have the means and incentive to increase volatility of volatility under 100% RE?
Answer: Analysis indicates larger flexible generators may have greater means to raise volatility of volatility, and would likely have stronger incentives to do so than in the past. Core competition question 11 More detail on the reasoning referred to in the table is set out in the following slides<br>
Answer: Analysis indicates larger flexible generators may have greater means to raise volatility of volatility, and would likely have stronger incentives to do so than in the past. Core competition question 11 More detail on the reasoning referred to in the table is set out in the following slides<br>
12
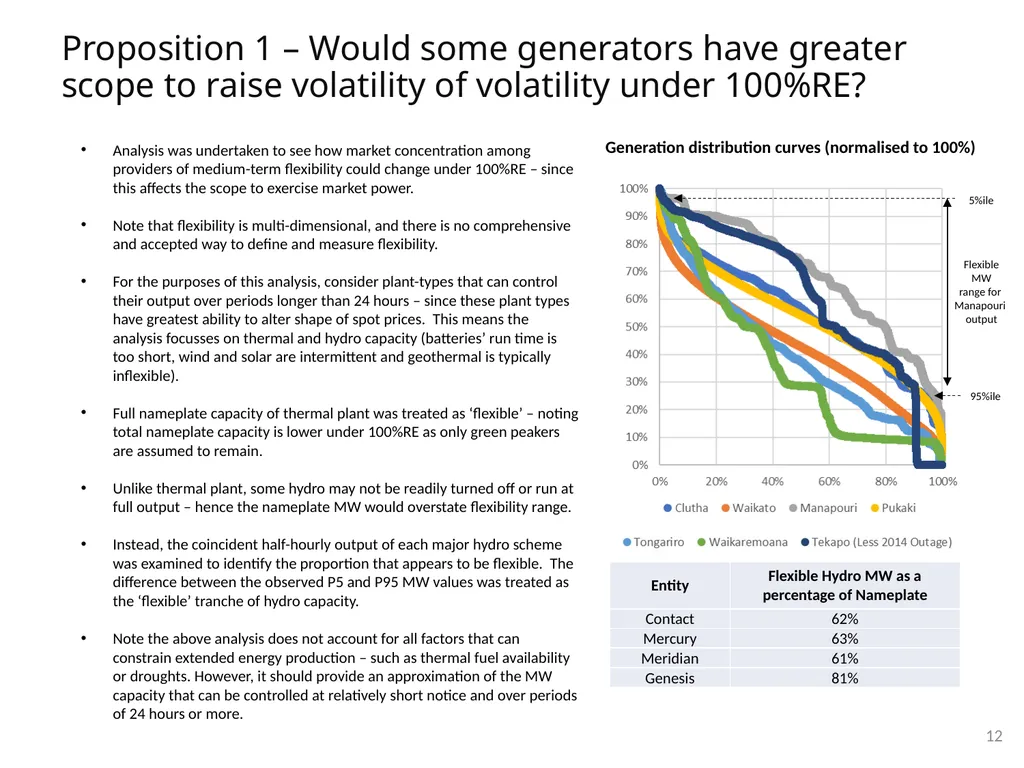
Proposition 1 – Would some generators have greater scope to raise volatility of volatility under 100%RE? 12 Analysis was undertaken to see how market concentration among providers of medium-term flexibility could change under 100%RE – since this affects the scope to exercise market power.
Note that flexibility is multi-dimensional, and there is no comprehensive and accepted way to define and measure flexibility.
For the purposes of this analysis, consider plant-types that can control their output over periods longer than 24 hours – since these plant types have greatest ability to alter shape of spot prices. This means the analysis focusses on thermal and hydro capacity (batteries’ run time is too short, wind and solar are intermittent and geothermal is typically inflexible).
Full nameplate capacity of thermal plant was treated as ‘flexible’ – noting total nameplate capacity is lower under 100%RE as only green peakers are assumed to remain.
Unlike thermal plant, some hydro may not be readily turned off or run at full output – hence the nameplate MW would overstate flexibility range.
Instead, the coincident half-hourly output of each major hydro scheme was examined to identify the proportion that appears to be flexible. The difference between the observed P5 and P95 MW values was treated as the ‘flexible’ tranche of hydro capacity.
Note the above analysis does not account for all factors that can constrain extended energy production – such as thermal fuel availability or droughts. However, it should provide an approximation of the MW capacity that can be controlled at relatively short notice and over periods of 24 hours or more. Generation distribution curves (normalised to 100%) 95%ile 5%ile Flexible
MW
range for
Manapouri
output<br>
Note that flexibility is multi-dimensional, and there is no comprehensive and accepted way to define and measure flexibility.
For the purposes of this analysis, consider plant-types that can control their output over periods longer than 24 hours – since these plant types have greatest ability to alter shape of spot prices. This means the analysis focusses on thermal and hydro capacity (batteries’ run time is too short, wind and solar are intermittent and geothermal is typically inflexible).
Full nameplate capacity of thermal plant was treated as ‘flexible’ – noting total nameplate capacity is lower under 100%RE as only green peakers are assumed to remain.
Unlike thermal plant, some hydro may not be readily turned off or run at full output – hence the nameplate MW would overstate flexibility range.
Instead, the coincident half-hourly output of each major hydro scheme was examined to identify the proportion that appears to be flexible. The difference between the observed P5 and P95 MW values was treated as the ‘flexible’ tranche of hydro capacity.
Note the above analysis does not account for all factors that can constrain extended energy production – such as thermal fuel availability or droughts. However, it should provide an approximation of the MW capacity that can be controlled at relatively short notice and over periods of 24 hours or more. Generation distribution curves (normalised to 100%) 95%ile 5%ile Flexible
MW
range for
Manapouri
output<br>
13
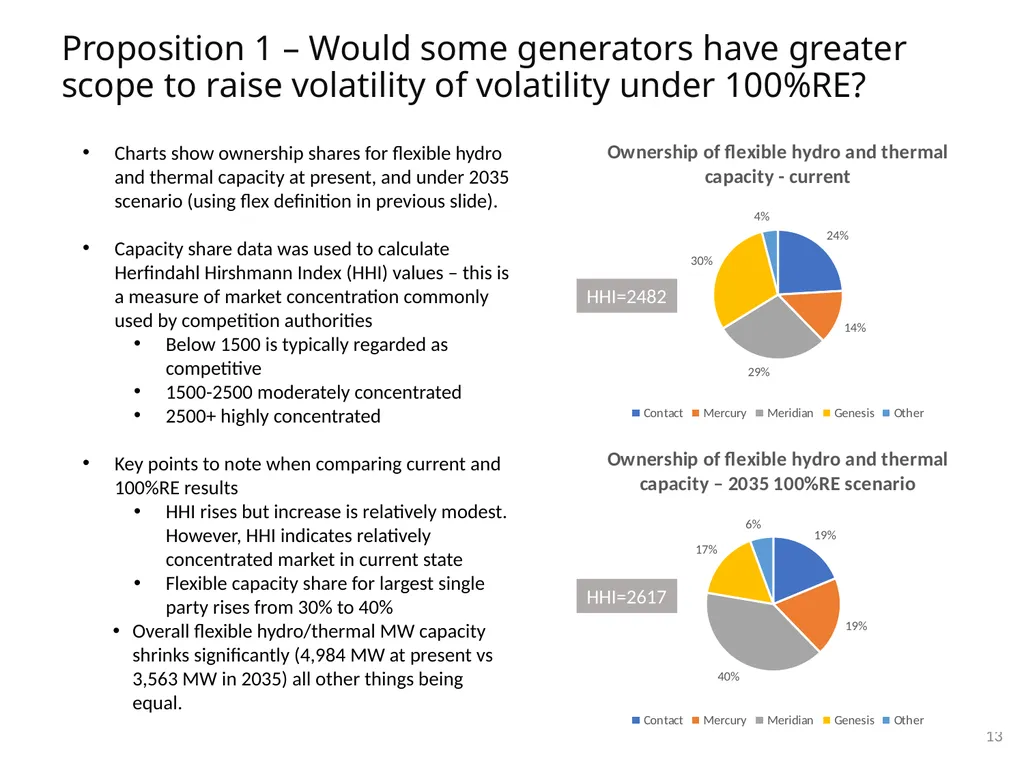
Proposition 1 – Would some generators have greater scope to raise volatility of volatility under 100%RE? 13 Charts show ownership shares for flexible hydro and thermal capacity at present, and under 2035 scenario (using flex definition in previous slide).
Capacity share data was used to calculate Herfindahl Hirshmann Index (HHI) values – this is a measure of market concentration commonly used by competition authorities
Below 1500 is typically regarded as competitive
1500-2500 moderately concentrated
2500+ highly concentrated
Key points to note when comparing current and 100%RE results
HHI rises but increase is relatively modest. However, HHI indicates relatively concentrated market in current state
Flexible capacity share for largest single party rises from 30% to 40%
Overall flexible hydro/thermal MW capacity shrinks significantly (4,984 MW at present vs 3,563 MW in 2035) all other things being equal. HHI=2482 HHI=2617<br>
Capacity share data was used to calculate Herfindahl Hirshmann Index (HHI) values – this is a measure of market concentration commonly used by competition authorities
Below 1500 is typically regarded as competitive
1500-2500 moderately concentrated
2500+ highly concentrated
Key points to note when comparing current and 100%RE results
HHI rises but increase is relatively modest. However, HHI indicates relatively concentrated market in current state
Flexible capacity share for largest single party rises from 30% to 40%
Overall flexible hydro/thermal MW capacity shrinks significantly (4,984 MW at present vs 3,563 MW in 2035) all other things being equal. HHI=2482 HHI=2617<br>
14
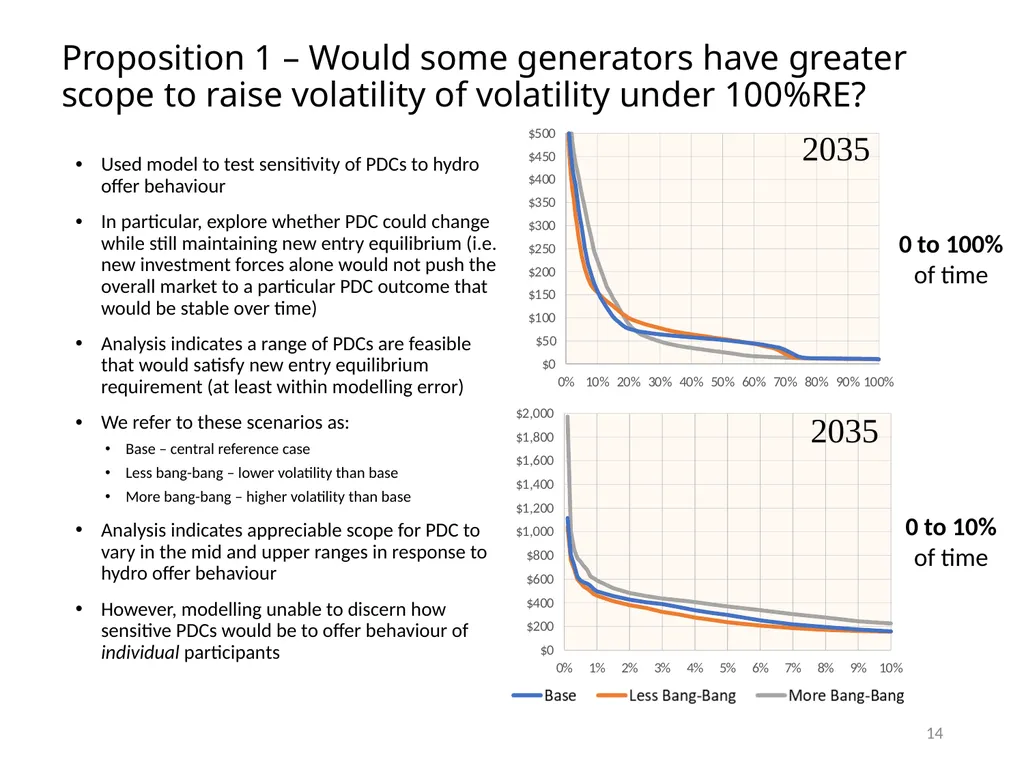
14 Used model to test sensitivity of PDCs to hydro offer behaviour
In particular, explore whether PDC could change while still maintaining new entry equilibrium (i.e. new investment forces alone would not push the overall market to a particular PDC outcome that would be stable over time)
Analysis indicates a range of PDCs are feasible that would satisfy new entry equilibrium requirement (at least within modelling error)
We refer to these scenarios as:
Base – central reference case
Less bang-bang – lower volatility than base
More bang-bang – higher volatility than base
Analysis indicates appreciable scope for PDC to vary in the mid and upper ranges in response to hydro offer behaviour
However, modelling unable to discern how sensitive PDCs would be to offer behaviour of individual participants Proposition 1 – Would some generators have greater scope to raise volatility of volatility under 100%RE? 0 to 100% of time 0 to 10% of time<br>
In particular, explore whether PDC could change while still maintaining new entry equilibrium (i.e. new investment forces alone would not push the overall market to a particular PDC outcome that would be stable over time)
Analysis indicates a range of PDCs are feasible that would satisfy new entry equilibrium requirement (at least within modelling error)
We refer to these scenarios as:
Base – central reference case
Less bang-bang – lower volatility than base
More bang-bang – higher volatility than base
Analysis indicates appreciable scope for PDC to vary in the mid and upper ranges in response to hydro offer behaviour
However, modelling unable to discern how sensitive PDCs would be to offer behaviour of individual participants Proposition 1 – Would some generators have greater scope to raise volatility of volatility under 100%RE? 0 to 100% of time 0 to 10% of time<br>
15
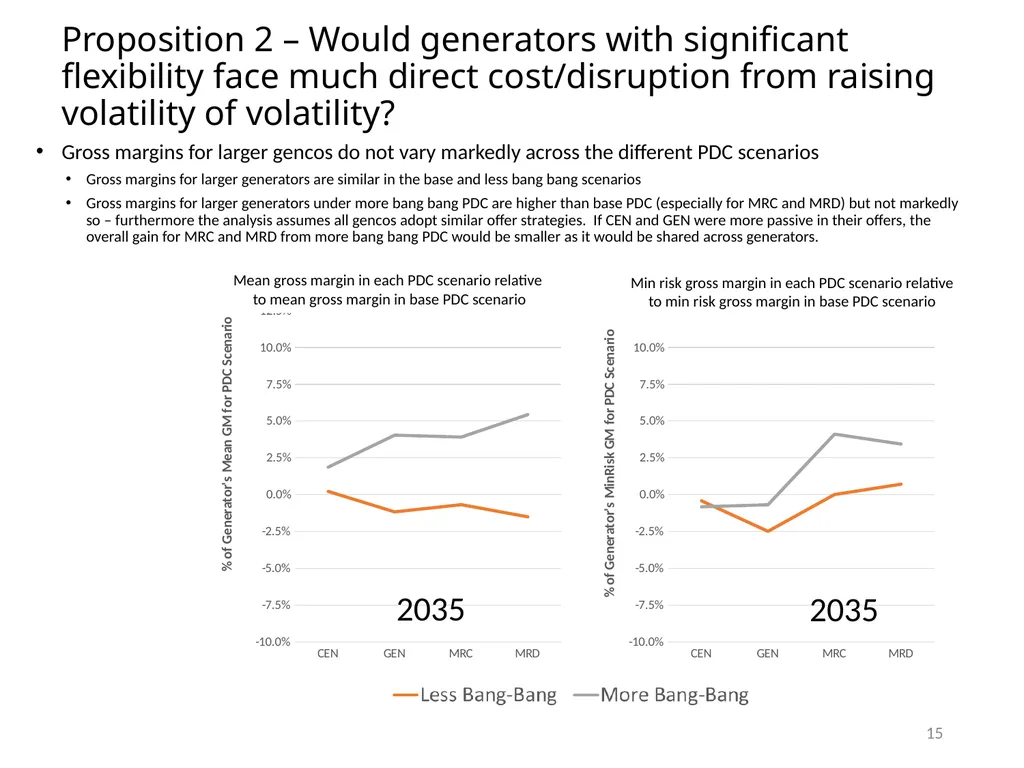
15 Mean gross margin in each PDC scenario relative
to mean gross margin in base PDC scenario Min risk gross margin in each PDC scenario relative
to min risk gross margin in base PDC scenario 2035 2035 Gross margins for larger gencos do not vary markedly across the different PDC scenarios
Gross margins for larger generators are similar in the base and less bang bang scenarios
Gross margins for larger generators under more bang bang PDC are higher than base PDC (especially for MRC and MRD) but not markedly so – furthermore the analysis assumes all gencos adopt similar offer strategies. If CEN and GEN were more passive in their offers, the overall gain for MRC and MRD from more bang bang PDC would be smaller as it would be shared across generators. Proposition 2 – Would generators with significant flexibility face much direct cost/disruption from raising volatility of volatility?<br>
to mean gross margin in base PDC scenario Min risk gross margin in each PDC scenario relative
to min risk gross margin in base PDC scenario 2035 2035 Gross margins for larger gencos do not vary markedly across the different PDC scenarios
Gross margins for larger generators are similar in the base and less bang bang scenarios
Gross margins for larger generators under more bang bang PDC are higher than base PDC (especially for MRC and MRD) but not markedly so – furthermore the analysis assumes all gencos adopt similar offer strategies. If CEN and GEN were more passive in their offers, the overall gain for MRC and MRD from more bang bang PDC would be smaller as it would be shared across generators. Proposition 2 – Would generators with significant flexibility face much direct cost/disruption from raising volatility of volatility?<br>
16
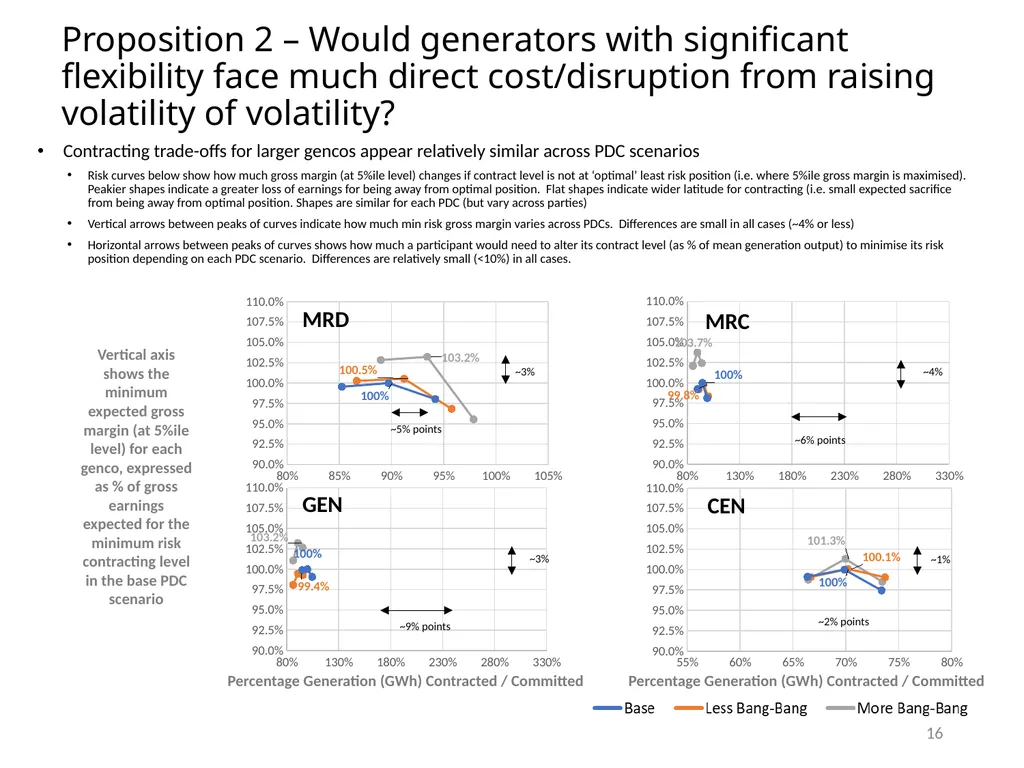
16 Proposition 2 – Would generators with significant flexibility face much direct cost/disruption from raising volatility of volatility? GEN Percentage Generation (GWh) Contracted / Committed CEN MRC MRD Percentage Generation (GWh) Contracted / Committed Contracting trade-offs for larger gencos appear relatively similar across PDC scenarios
Risk curves below show how much gross margin (at 5%ile level) changes if contract level is not at ‘optimal’ least risk position (i.e. where 5%ile gross margin is maximised). Peakier shapes indicate a greater loss of earnings for being away from optimal position. Flat shapes indicate wider latitude for contracting (i.e. small expected sacrifice from being away from optimal position. Shapes are similar for each PDC (but vary across parties)
Vertical arrows between peaks of curves indicate how much min risk gross margin varies across PDCs. Differences are small in all cases (~4% or less)
Horizontal arrows between peaks of curves shows how much a participant would need to alter its contract level (as % of mean generation output) to minimise its risk position depending on each PDC scenario. Differences are relatively small (<10%) in all cases. Vertical axis shows the minimum expected gross margin (at 5%ile level) for each genco, expressed as % of gross earnings expected for the minimum risk contracting level in the base PDC scenario ~5% points ~6% points ~9% points ~2% points ~3% ~3% ~4% ~1%<br>
Risk curves below show how much gross margin (at 5%ile level) changes if contract level is not at ‘optimal’ least risk position (i.e. where 5%ile gross margin is maximised). Peakier shapes indicate a greater loss of earnings for being away from optimal position. Flat shapes indicate wider latitude for contracting (i.e. small expected sacrifice from being away from optimal position. Shapes are similar for each PDC (but vary across parties)
Vertical arrows between peaks of curves indicate how much min risk gross margin varies across PDCs. Differences are small in all cases (~4% or less)
Horizontal arrows between peaks of curves shows how much a participant would need to alter its contract level (as % of mean generation output) to minimise its risk position depending on each PDC scenario. Differences are relatively small (<10%) in all cases. Vertical axis shows the minimum expected gross margin (at 5%ile level) for each genco, expressed as % of gross earnings expected for the minimum risk contracting level in the base PDC scenario ~5% points ~6% points ~9% points ~2% points ~3% ~3% ~4% ~1%<br>
17
17 2035 Simulated historical Cashflow at risk (expected reduction in mean gross margin at 5% risk level) Cashflow at risk (expected reduction in mean gross margin at 5% risk level) Mean gross margin
relative to base PDC Mean gross margin
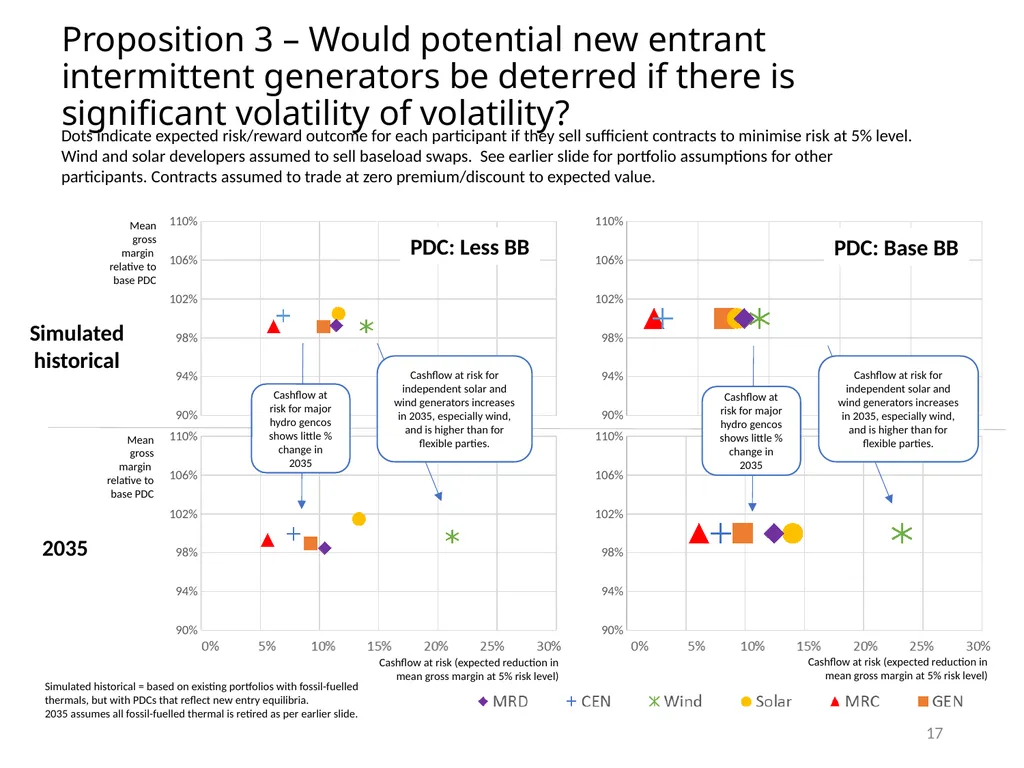
relative to base PDC Dots indicate expected risk/reward outcome for each participant if they sell sufficient contracts to minimise risk at 5% level. Wind and solar developers assumed to sell baseload swaps. See earlier slide for portfolio assumptions for other participants. Contracts assumed to trade at zero premium/discount to expected value. Cashflow at risk for major hydro gencos shows little % change in 2035 Cashflow at risk for independent solar and wind generators increases in 2035, especially wind, and is higher than for flexible parties. Cashflow at risk for major hydro gencos shows little % change in 2035 PDC: Less BB PDC: Base BB Proposition 3 – Would potential new entrant intermittent generators be deterred if there is significant volatility of volatility? Cashflow at risk for independent solar and wind generators increases in 2035, especially wind, and is higher than for flexible parties. Simulated historical = based on existing portfolios with fossil-fuelled thermals, but with PDCs that reflect new entry equilibria.
2035 assumes all fossil-fuelled thermal is retired as per earlier slide.<br>
relative to base PDC Mean gross margin
relative to base PDC Dots indicate expected risk/reward outcome for each participant if they sell sufficient contracts to minimise risk at 5% level. Wind and solar developers assumed to sell baseload swaps. See earlier slide for portfolio assumptions for other participants. Contracts assumed to trade at zero premium/discount to expected value. Cashflow at risk for major hydro gencos shows little % change in 2035 Cashflow at risk for independent solar and wind generators increases in 2035, especially wind, and is higher than for flexible parties. Cashflow at risk for major hydro gencos shows little % change in 2035 PDC: Less BB PDC: Base BB Proposition 3 – Would potential new entrant intermittent generators be deterred if there is significant volatility of volatility? Cashflow at risk for independent solar and wind generators increases in 2035, especially wind, and is higher than for flexible parties. Simulated historical = based on existing portfolios with fossil-fuelled thermals, but with PDCs that reflect new entry equilibria.
2035 assumes all fossil-fuelled thermal is retired as per earlier slide.<br>
18
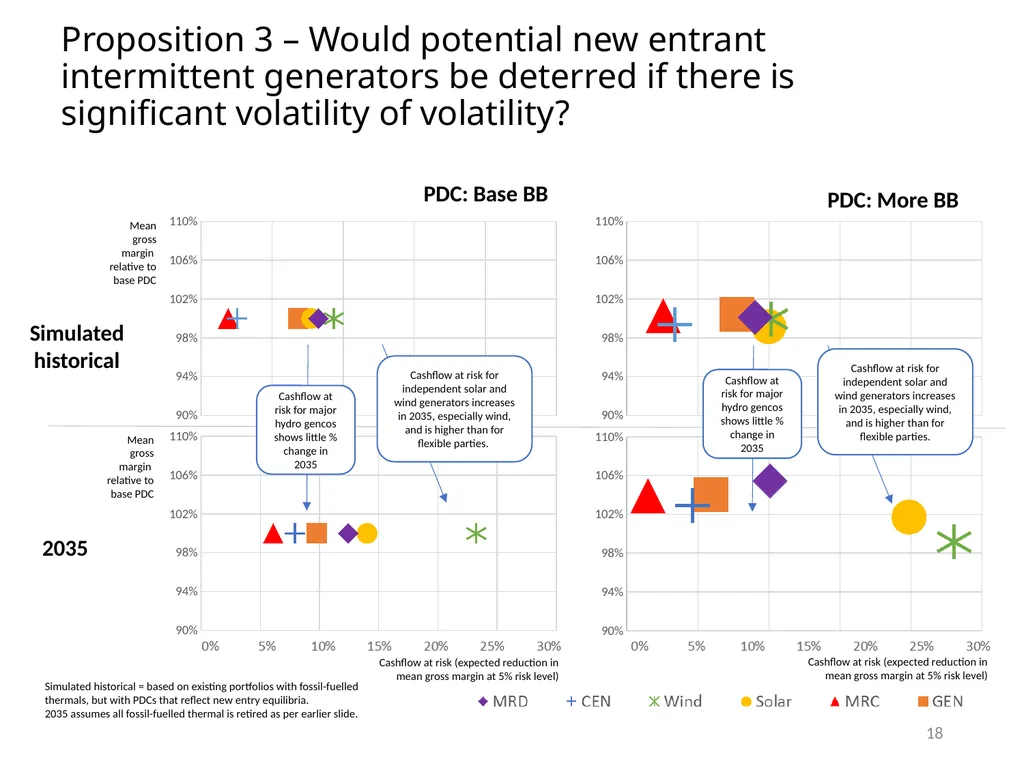
18 2035 Simulated historical Cashflow at risk (expected reduction in mean gross margin at 5% risk level) Cashflow at risk (expected reduction in mean gross margin at 5% risk level) Mean gross margin
relative to base PDC Mean gross margin
relative to base PDC PDC: Base BB PDC: More BB Cashflow at risk for major hydro gencos shows little % change in 2035 Proposition 3 – Would potential new entrant intermittent generators be deterred if there is significant volatility of volatility? Cashflow at risk for major hydro gencos shows little % change in 2035 Cashflow at risk for independent solar and wind generators increases in 2035, especially wind, and is higher than for flexible parties. Cashflow at risk for independent solar and wind generators increases in 2035, especially wind, and is higher than for flexible parties. Simulated historical = based on existing portfolios with fossil-fuelled thermals, but with PDCs that reflect new entry equilibria.
2035 assumes all fossil-fuelled thermal is retired as per earlier slide.<br>
relative to base PDC Mean gross margin
relative to base PDC PDC: Base BB PDC: More BB Cashflow at risk for major hydro gencos shows little % change in 2035 Proposition 3 – Would potential new entrant intermittent generators be deterred if there is significant volatility of volatility? Cashflow at risk for major hydro gencos shows little % change in 2035 Cashflow at risk for independent solar and wind generators increases in 2035, especially wind, and is higher than for flexible parties. Cashflow at risk for independent solar and wind generators increases in 2035, especially wind, and is higher than for flexible parties. Simulated historical = based on existing portfolios with fossil-fuelled thermals, but with PDCs that reflect new entry equilibria.
2035 assumes all fossil-fuelled thermal is retired as per earlier slide.<br>
19
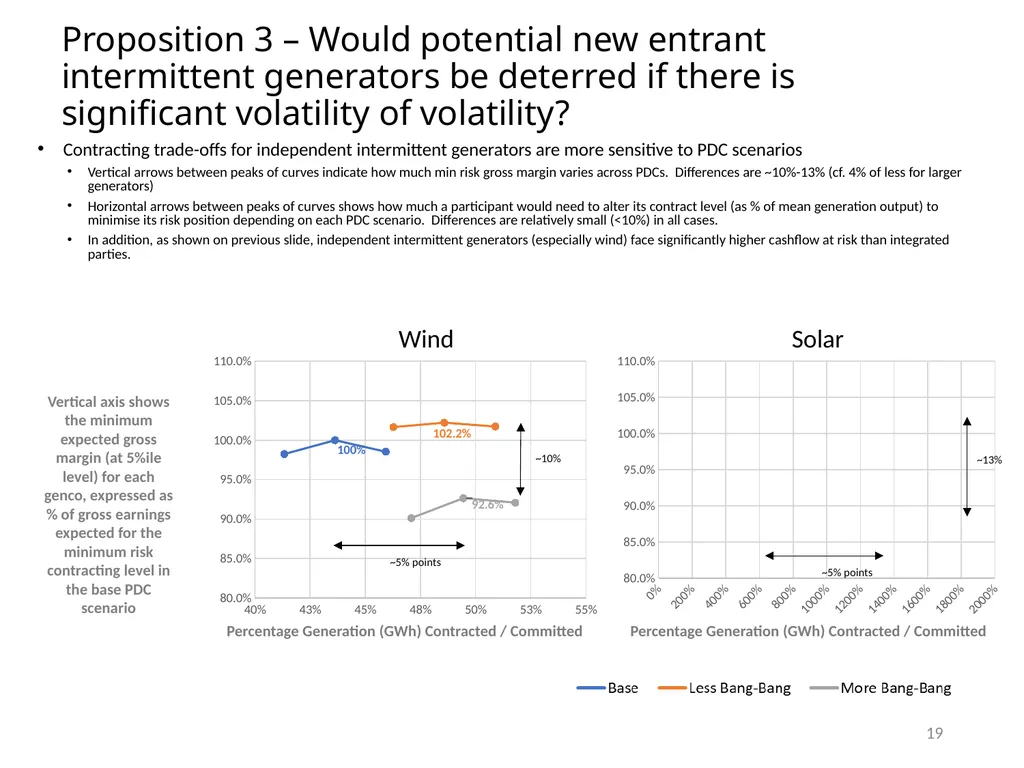
19 Proposition 3 – Would potential new entrant intermittent generators be deterred if there is significant volatility of volatility? Percentage Generation (GWh) Contracted / Committed Percentage Generation (GWh) Contracted / Committed Wind Solar Vertical axis shows the minimum expected gross margin (at 5%ile level) for each genco, expressed as % of gross earnings expected for the minimum risk contracting level in the base PDC scenario ~5% points Contracting trade-offs for independent intermittent generators are more sensitive to PDC scenarios
Vertical arrows between peaks of curves indicate how much min risk gross margin varies across PDCs. Differences are ~10%-13% (cf. 4% of less for larger generators)
Horizontal arrows between peaks of curves shows how much a participant would need to alter its contract level (as % of mean generation output) to minimise its risk position depending on each PDC scenario. Differences are relatively small (<10%) in all cases.
In addition, as shown on previous slide, independent intermittent generators (especially wind) face significantly higher cashflow at risk than integrated parties. ~10% ~13% ~5% points<br>
Vertical arrows between peaks of curves indicate how much min risk gross margin varies across PDCs. Differences are ~10%-13% (cf. 4% of less for larger generators)
Horizontal arrows between peaks of curves shows how much a participant would need to alter its contract level (as % of mean generation output) to minimise its risk position depending on each PDC scenario. Differences are relatively small (<10%) in all cases.
In addition, as shown on previous slide, independent intermittent generators (especially wind) face significantly higher cashflow at risk than integrated parties. ~10% ~13% ~5% points<br>
20
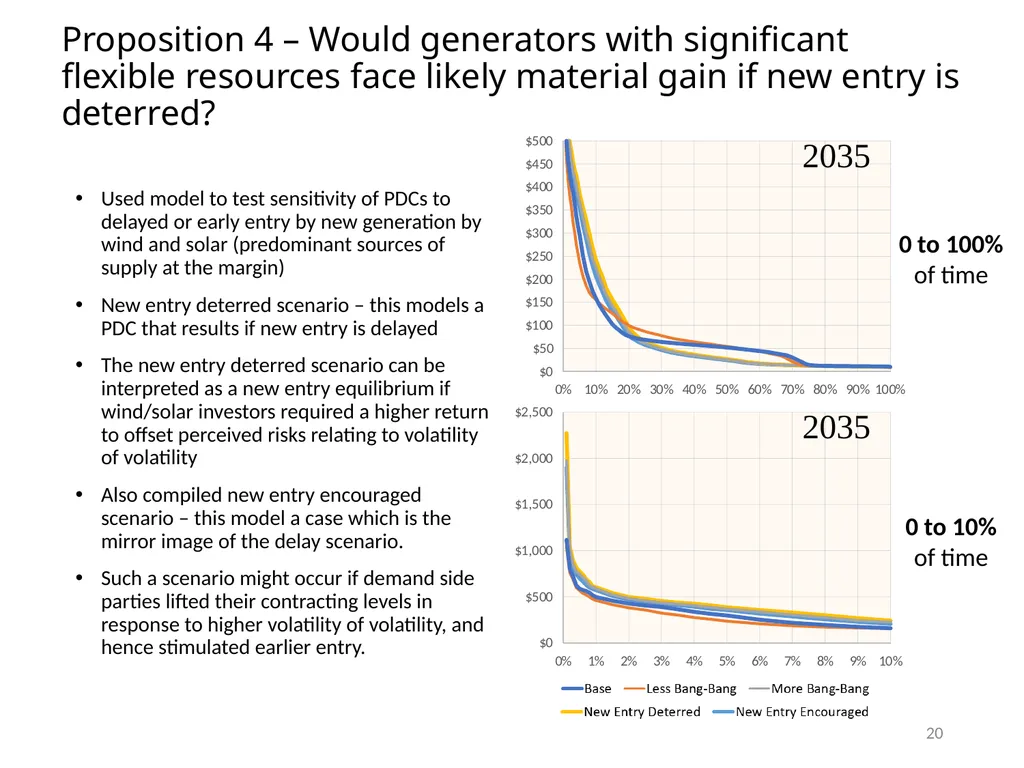
20 Used model to test sensitivity of PDCs to delayed or early entry by new generation by wind and solar (predominant sources of supply at the margin)
New entry deterred scenario – this models a PDC that results if new entry is delayed
The new entry deterred scenario can be interpreted as a new entry equilibrium if wind/solar investors required a higher return to offset perceived risks relating to volatility of volatility
Also compiled new entry encouraged scenario – this model a case which is the mirror image of the delay scenario.
Such a scenario might occur if demand side parties lifted their contracting levels in response to higher volatility of volatility, and hence stimulated earlier entry. Proposition 4 – Would generators with significant flexible resources face likely material gain if new entry is deterred? 0 to 100% of time 0 to 10% of time<br>
New entry deterred scenario – this models a PDC that results if new entry is delayed
The new entry deterred scenario can be interpreted as a new entry equilibrium if wind/solar investors required a higher return to offset perceived risks relating to volatility of volatility
Also compiled new entry encouraged scenario – this model a case which is the mirror image of the delay scenario.
Such a scenario might occur if demand side parties lifted their contracting levels in response to higher volatility of volatility, and hence stimulated earlier entry. Proposition 4 – Would generators with significant flexible resources face likely material gain if new entry is deterred? 0 to 100% of time 0 to 10% of time<br>
21
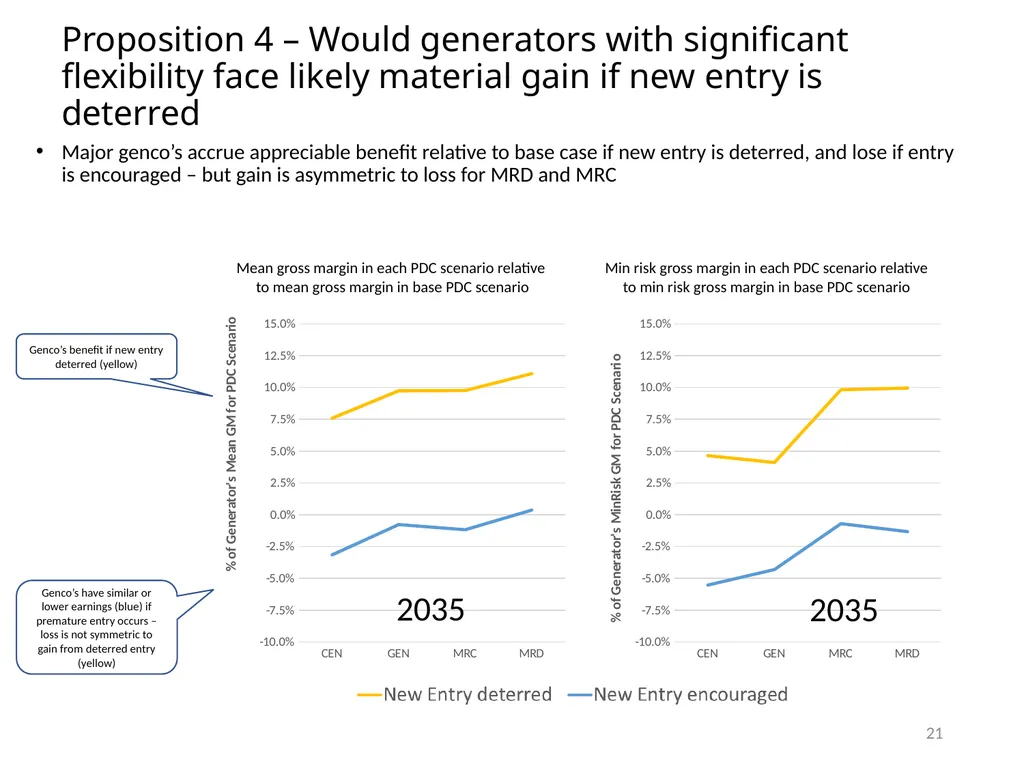
21 Genco’s benefit if new entry deterred (yellow) Genco’s have similar or lower earnings (blue) if premature entry occurs –loss is not symmetric to gain from deterred entry (yellow) Mean gross margin in each PDC scenario relative
to mean gross margin in base PDC scenario Min risk gross margin in each PDC scenario relative
to min risk gross margin in base PDC scenario 2035 2035 Major genco’s accrue appreciable benefit relative to base case if new entry is deterred, and lose if entry is encouraged – but gain is asymmetric to loss for MRD and MRC Proposition 4 – Would generators with significant flexibility face likely material gain if new entry is deterred<br>
to mean gross margin in base PDC scenario Min risk gross margin in each PDC scenario relative
to min risk gross margin in base PDC scenario 2035 2035 Major genco’s accrue appreciable benefit relative to base case if new entry is deterred, and lose if entry is encouraged – but gain is asymmetric to loss for MRD and MRC Proposition 4 – Would generators with significant flexibility face likely material gain if new entry is deterred<br>
22
What are the options to address potential concerns? 22<br>
23
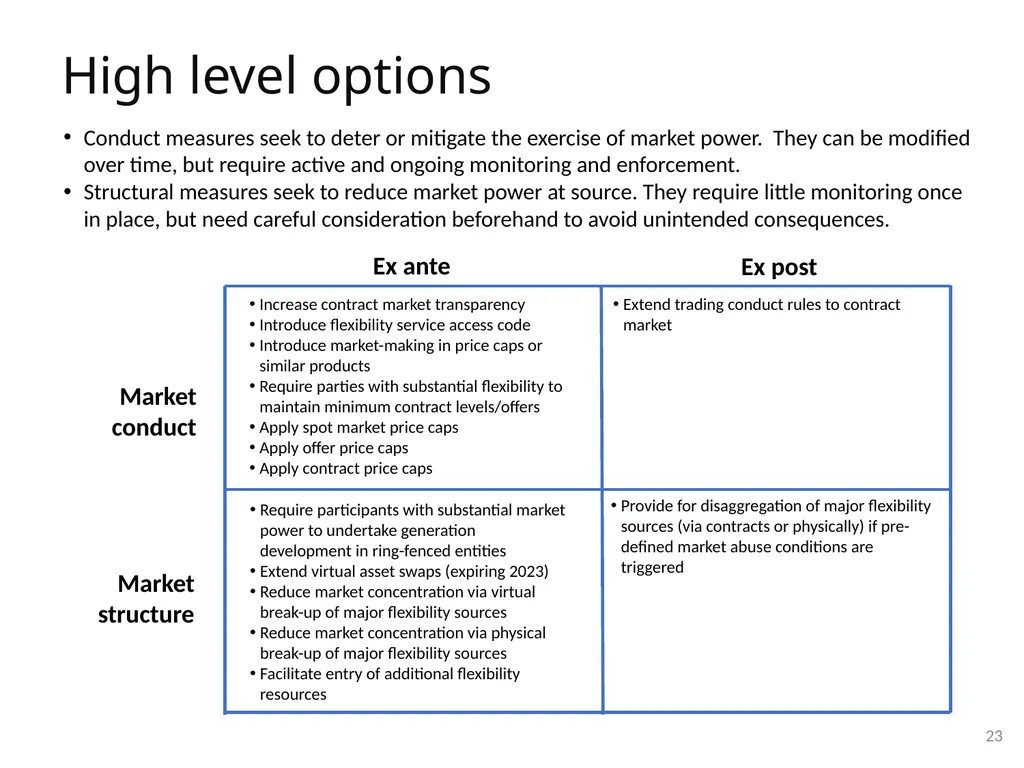
High level options 23 Market conduct Market
structure Ex ante Ex post Extend trading conduct rules to contract market Require participants with substantial market power to undertake generation development in ring-fenced entities
Extend virtual asset swaps (expiring 2023)
Reduce market concentration via virtual break-up of major flexibility sources
Reduce market concentration via physical break-up of major flexibility sources
Facilitate entry of additional flexibility resources Provide for disaggregation of major flexibility sources (via contracts or physically) if pre-defined market abuse conditions are triggered Increase contract market transparency
Introduce flexibility service access code
Introduce market-making in price caps or similar products
Require parties with substantial flexibility to maintain minimum contract levels/offers
Apply spot market price caps
Apply offer price caps
Apply contract price caps Conduct measures seek to deter or mitigate the exercise of market power. They can be modified over time, but require active and ongoing monitoring and enforcement.
Structural measures seek to reduce market power at source. They require little monitoring once in place, but need careful consideration beforehand to avoid unintended consequences.<br>
structure Ex ante Ex post Extend trading conduct rules to contract market Require participants with substantial market power to undertake generation development in ring-fenced entities
Extend virtual asset swaps (expiring 2023)
Reduce market concentration via virtual break-up of major flexibility sources
Reduce market concentration via physical break-up of major flexibility sources
Facilitate entry of additional flexibility resources Provide for disaggregation of major flexibility sources (via contracts or physically) if pre-defined market abuse conditions are triggered Increase contract market transparency
Introduce flexibility service access code
Introduce market-making in price caps or similar products
Require parties with substantial flexibility to maintain minimum contract levels/offers
Apply spot market price caps
Apply offer price caps
Apply contract price caps Conduct measures seek to deter or mitigate the exercise of market power. They can be modified over time, but require active and ongoing monitoring and enforcement.
Structural measures seek to reduce market power at source. They require little monitoring once in place, but need careful consideration beforehand to avoid unintended consequences.<br>
24
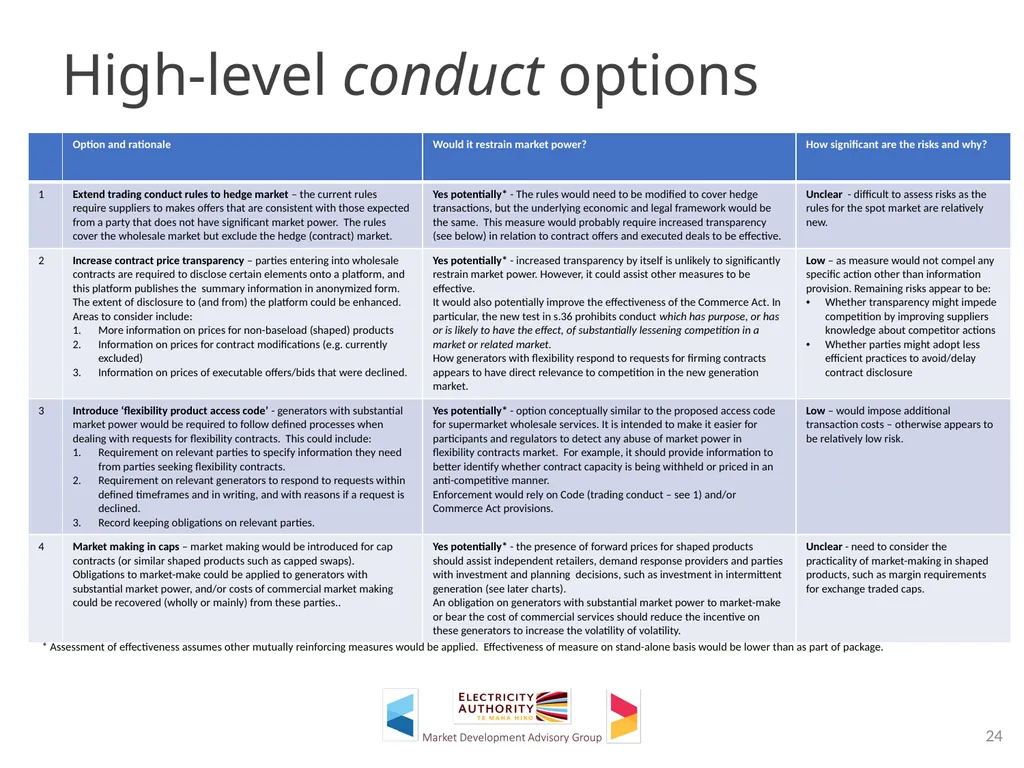
High-level conduct options 24 * Assessment of effectiveness assumes other mutually reinforcing measures would be applied. Effectiveness of measure on stand-alone basis would be lower than as part of package.<br>
25
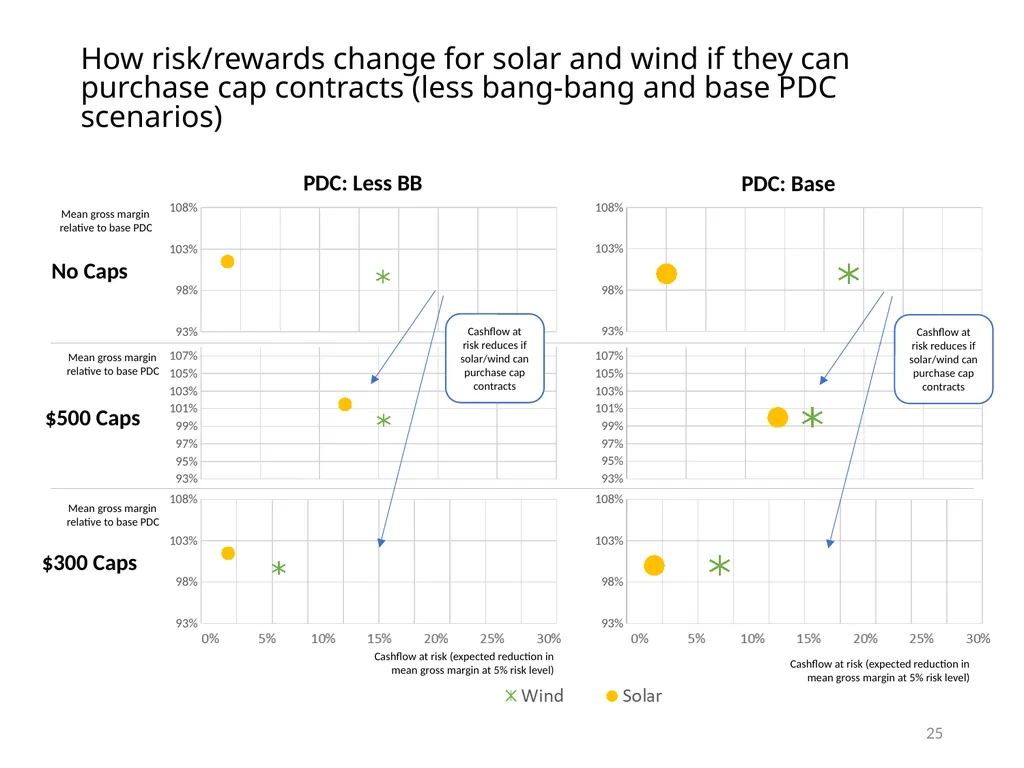
25 $500 Caps No Caps PDC: Base $300 Caps PDC: Less BB How risk/rewards change for solar and wind if they can purchase cap contracts (less bang-bang and base PDC scenarios) Cashflow at risk reduces if solar/wind can purchase cap contracts Cashflow at risk reduces if solar/wind can purchase cap contracts Cashflow at risk (expected reduction in mean gross margin at 5% risk level) Mean gross margin
relative to base PDC Cashflow at risk (expected reduction in mean gross margin at 5% risk level) Mean gross margin
relative to base PDC Mean gross margin
relative to base PDC<br>
relative to base PDC Cashflow at risk (expected reduction in mean gross margin at 5% risk level) Mean gross margin
relative to base PDC Mean gross margin
relative to base PDC<br>
26
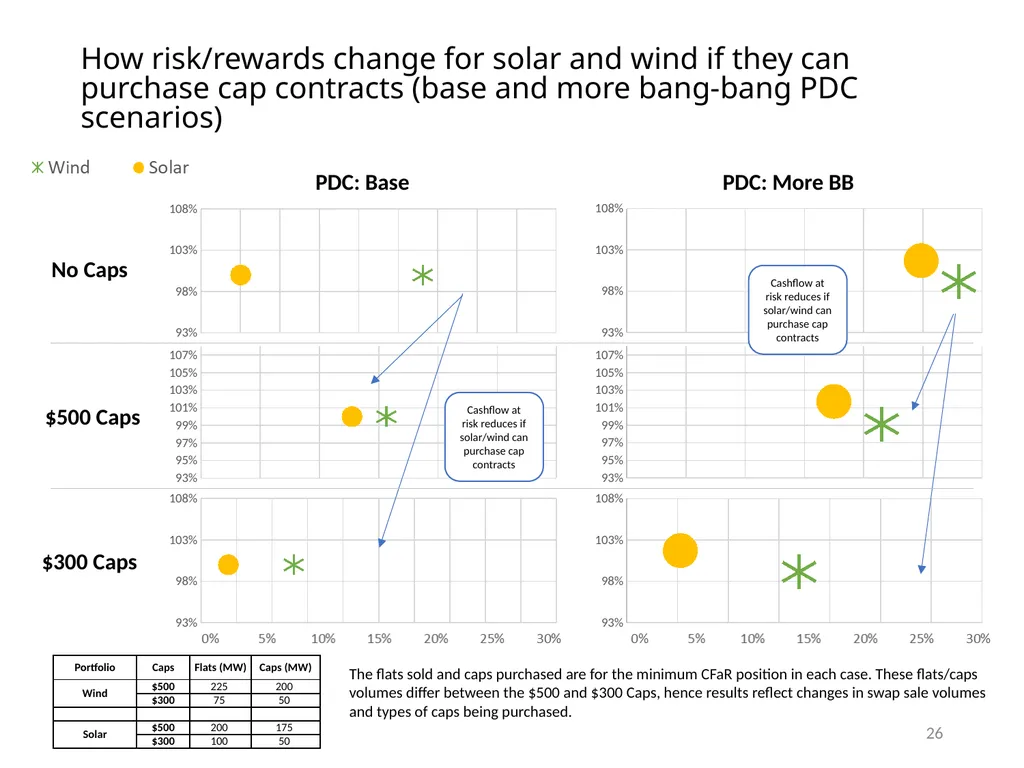
26 $500 Caps No Caps $300 Caps PDC: Base PDC: More BB The flats sold and caps purchased are for the minimum CFaR position in each case. These flats/caps volumes differ between the $500 and $300 Caps, hence results reflect changes in swap sale volumes and types of caps being purchased. Cashflow at risk reduces if solar/wind can purchase cap contracts Cashflow at risk reduces if solar/wind can purchase cap contracts How risk/rewards change for solar and wind if they can purchase cap contracts (base and more bang-bang PDC scenarios)<br>
27
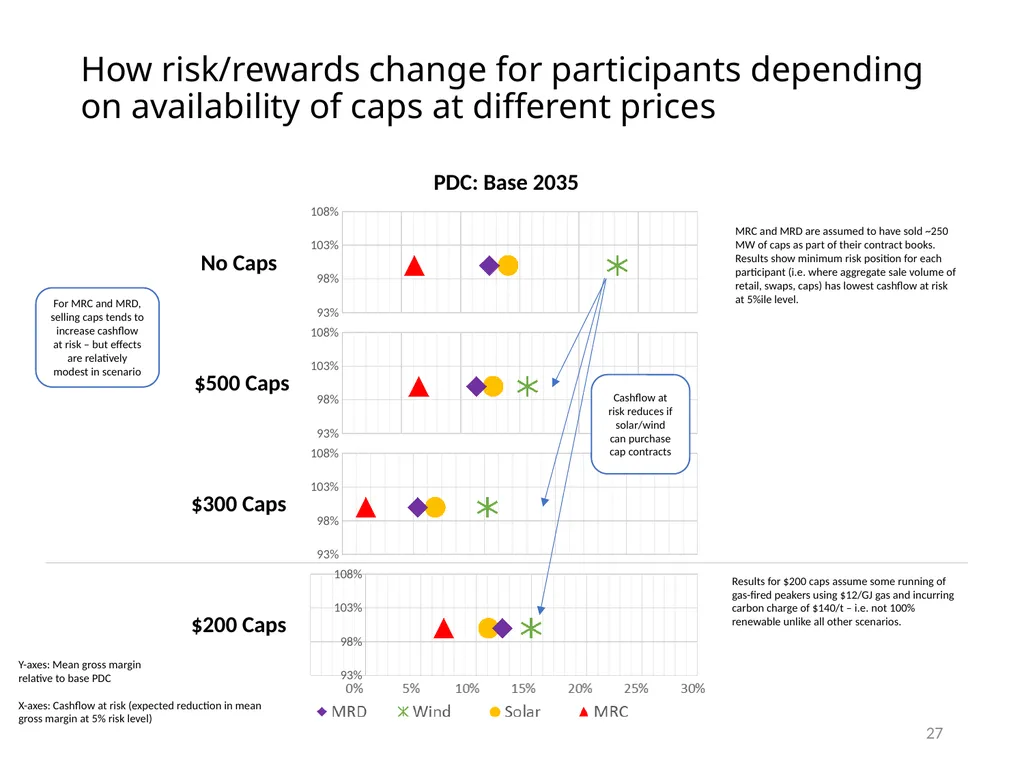
27 $500 Caps No Caps $300 Caps PDC: Base 2035 $200 Caps MRC and MRD are assumed to have sold ~250 MW of caps as part of their contract books. Results show minimum risk position for each participant (i.e. where aggregate sale volume of retail, swaps, caps) has lowest cashflow at risk at 5%ile level. How risk/rewards change for participants depending on availability of caps at different prices Results for $200 caps assume some running of gas-fired peakers using $12/GJ gas and incurring carbon charge of $140/t – i.e. not 100% renewable unlike all other scenarios. Cashflow at risk reduces if solar/wind can purchase cap contracts For MRC and MRD, selling caps tends to increase cashflow at risk – but effects are relatively modest in scenario X-axes: Cashflow at risk (expected reduction in mean gross margin at 5% risk level) Y-axes: Mean gross margin
relative to base PDC<br>
relative to base PDC<br>
28
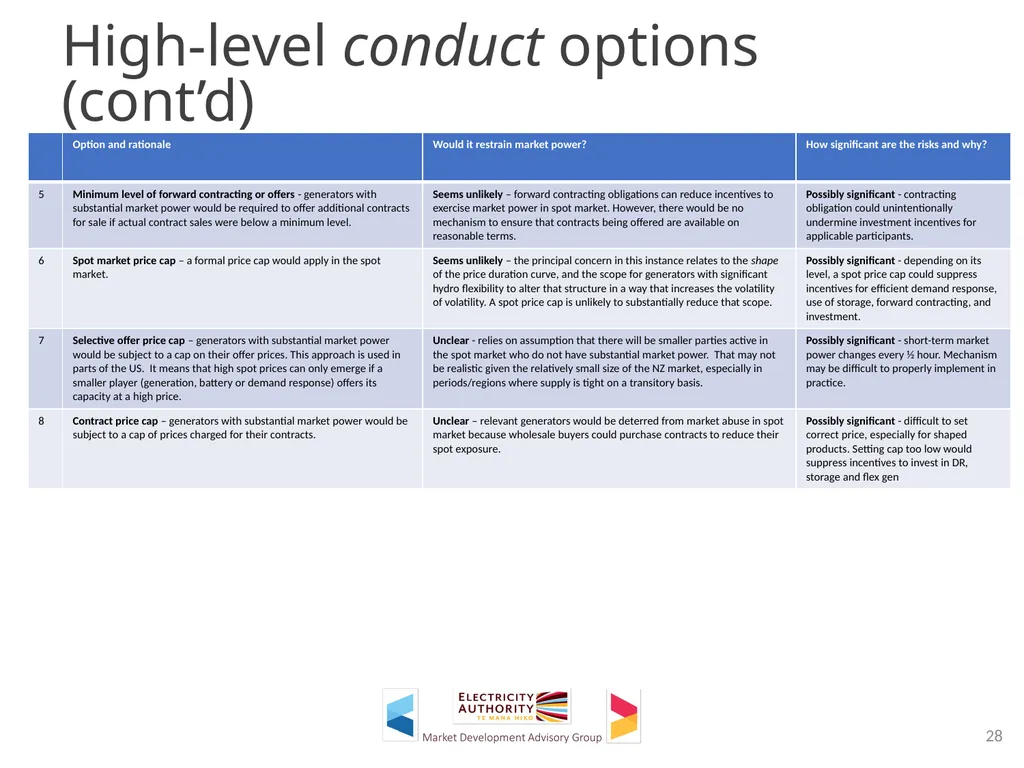
High-level conduct options (cont’d) 28<br>
29
High-level structural options 29<br>
30
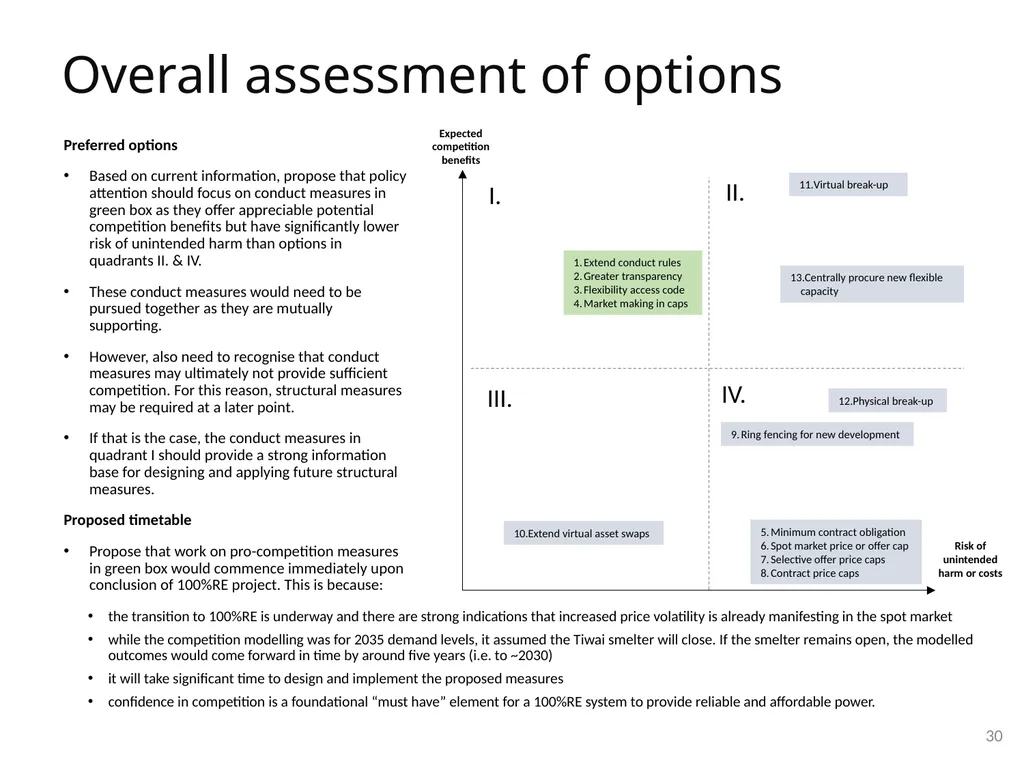
Overall assessment of options 30 Expected competition benefits Risk of unintended harm or costs Extend conduct rules
Greater transparency
Flexibility access code
Market making in caps Minimum contract obligation
Spot market price or offer cap
Selective offer price caps
Contract price caps Virtual break-up Physical break-up Centrally procure new flexible capacity Ring fencing for new development I. II. III. IV. Extend virtual asset swaps the transition to 100%RE is underway and there are strong indications that increased price volatility is already manifesting in the spot market
while the competition modelling was for 2035 demand levels, it assumed the Tiwai smelter will close. If the smelter remains open, the modelled outcomes would come forward in time by around five years (i.e. to ~2030)
it will take significant time to design and implement the proposed measures
confidence in competition is a foundational “must have” element for a 100%RE system to provide reliable and affordable power. Preferred options
Based on current information, propose that policy attention should focus on conduct measures in green box as they offer appreciable potential competition benefits but have significantly lower risk of unintended harm than options in quadrants II. & IV.
These conduct measures would need to be pursued together as they are mutually supporting.
However, also need to recognise that conduct measures may ultimately not provide sufficient competition. For this reason, structural measures may be required at a later point.
If that is the case, the conduct measures in quadrant I should provide a strong information base for designing and applying future structural measures.
Proposed timetable
Propose that work on pro-competition measures in green box would commence immediately upon conclusion of 100%RE project. This is because:<br>
Greater transparency
Flexibility access code
Market making in caps Minimum contract obligation
Spot market price or offer cap
Selective offer price caps
Contract price caps Virtual break-up Physical break-up Centrally procure new flexible capacity Ring fencing for new development I. II. III. IV. Extend virtual asset swaps the transition to 100%RE is underway and there are strong indications that increased price volatility is already manifesting in the spot market
while the competition modelling was for 2035 demand levels, it assumed the Tiwai smelter will close. If the smelter remains open, the modelled outcomes would come forward in time by around five years (i.e. to ~2030)
it will take significant time to design and implement the proposed measures
confidence in competition is a foundational “must have” element for a 100%RE system to provide reliable and affordable power. Preferred options
Based on current information, propose that policy attention should focus on conduct measures in green box as they offer appreciable potential competition benefits but have significantly lower risk of unintended harm than options in quadrants II. & IV.
These conduct measures would need to be pursued together as they are mutually supporting.
However, also need to recognise that conduct measures may ultimately not provide sufficient competition. For this reason, structural measures may be required at a later point.
If that is the case, the conduct measures in quadrant I should provide a strong information base for designing and applying future structural measures.
Proposed timetable
Propose that work on pro-competition measures in green box would commence immediately upon conclusion of 100%RE project. This is because:<br>