
Measurement Issues Arising from the Growth of
SB
Published · 18 slides · 0 views

1 / 1




Description
Measurement Issues Arising from the Growth of Globalization Susan Houseman Upjohn Institute for Employment Research Kenneth Ryder National Academy of Public Administration Presentation for the FESAC, December 17, 2010 Project Motivation
Related Topics
Share
Embed code
Download this presentation From Below
"Measurement Issues Arising from the Growth of" is the property of its rightful owner. Permission is granted to download and print the materials on this website for personal, non-commercial use only, and to display it on your personal computer provided you do not modify the materials and that you retain all copyright notices contained in the materials. By downloading content from our website, you accept the terms of this agreement.
Presentation Transcript
01
Measurement Issues Arising from the Growth of Globalization Susan Houseman
Upjohn Institute for Employment Research
Kenneth Ryder
National Academy of Public Administration
Presentation for the FESAC, December 17, 2010<br>
Upjohn Institute for Employment Research
Kenneth Ryder
National Academy of Public Administration
Presentation for the FESAC, December 17, 2010<br>
02
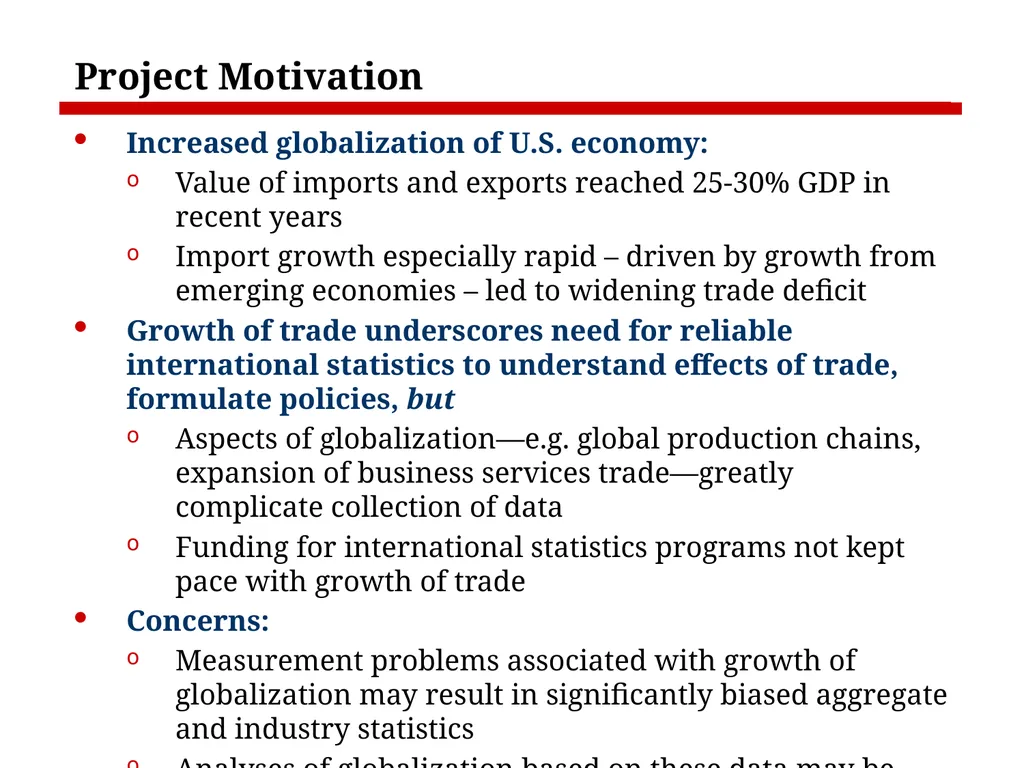
Project Motivation Increased globalization of U.S. economy:
Value of imports and exports reached 25-30% GDP in recent years
Import growth especially rapid – driven by growth from emerging economies – led to widening trade deficit
Growth of trade underscores need for reliable international statistics to understand effects of trade, formulate policies, but
Aspects of globalization—e.g. global production chains, expansion of business services trade—greatly complicate collection of data
Funding for international statistics programs not kept pace with growth of trade
Concerns:
Measurement problems associated with growth of globalization may result in significantly biased aggregate and industry statistics
Analyses of globalization based on these data may be biased
Critical data gaps limit ability to understand effects of globalization on U.S. workers and businesses<br>
Value of imports and exports reached 25-30% GDP in recent years
Import growth especially rapid – driven by growth from emerging economies – led to widening trade deficit
Growth of trade underscores need for reliable international statistics to understand effects of trade, formulate policies, but
Aspects of globalization—e.g. global production chains, expansion of business services trade—greatly complicate collection of data
Funding for international statistics programs not kept pace with growth of trade
Concerns:
Measurement problems associated with growth of globalization may result in significantly biased aggregate and industry statistics
Analyses of globalization based on these data may be biased
Critical data gaps limit ability to understand effects of globalization on U.S. workers and businesses<br>
03
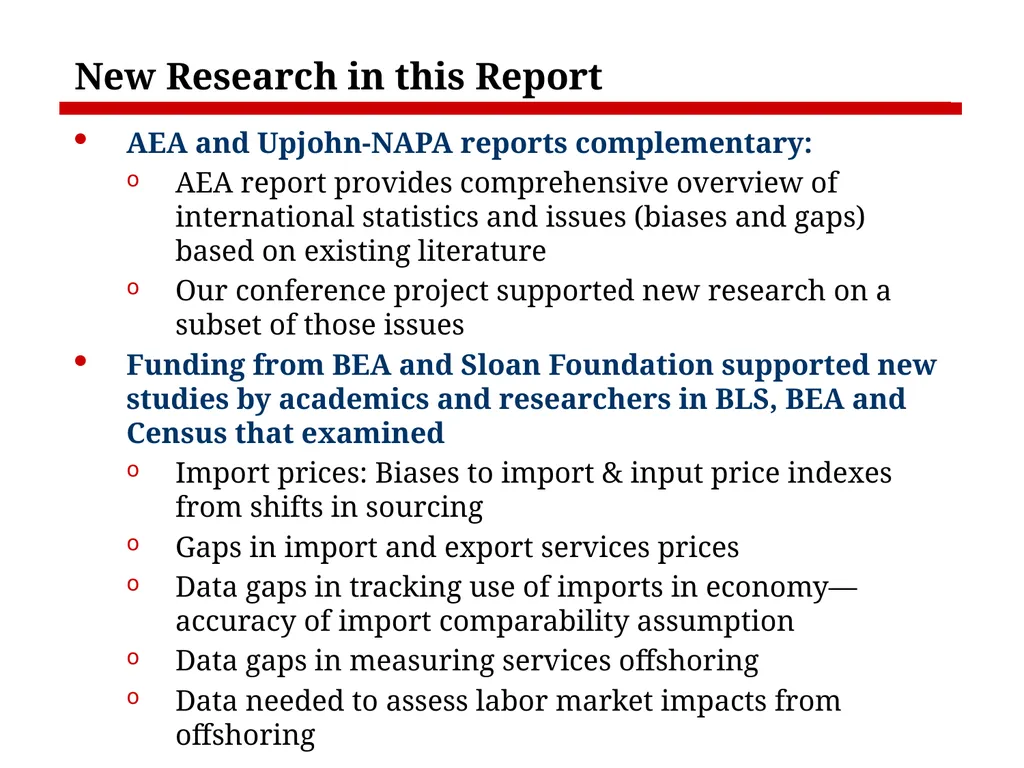
New Research in this Report AEA and Upjohn-NAPA reports complementary:
AEA report provides comprehensive overview of international statistics and issues (biases and gaps) based on existing literature
Our conference project supported new research on a subset of those issues
Funding from BEA and Sloan Foundation supported new studies by academics and researchers in BLS, BEA and Census that examined
Import prices: Biases to import & input price indexes from shifts in sourcing
Gaps in import and export services prices
Data gaps in tracking use of imports in economy—accuracy of import comparability assumption
Data gaps in measuring services offshoring
Data needed to assess labor market impacts from offshoring<br>
AEA report provides comprehensive overview of international statistics and issues (biases and gaps) based on existing literature
Our conference project supported new research on a subset of those issues
Funding from BEA and Sloan Foundation supported new studies by academics and researchers in BLS, BEA and Census that examined
Import prices: Biases to import & input price indexes from shifts in sourcing
Gaps in import and export services prices
Data gaps in tracking use of imports in economy—accuracy of import comparability assumption
Data gaps in measuring services offshoring
Data needed to assess labor market impacts from offshoring<br>
04
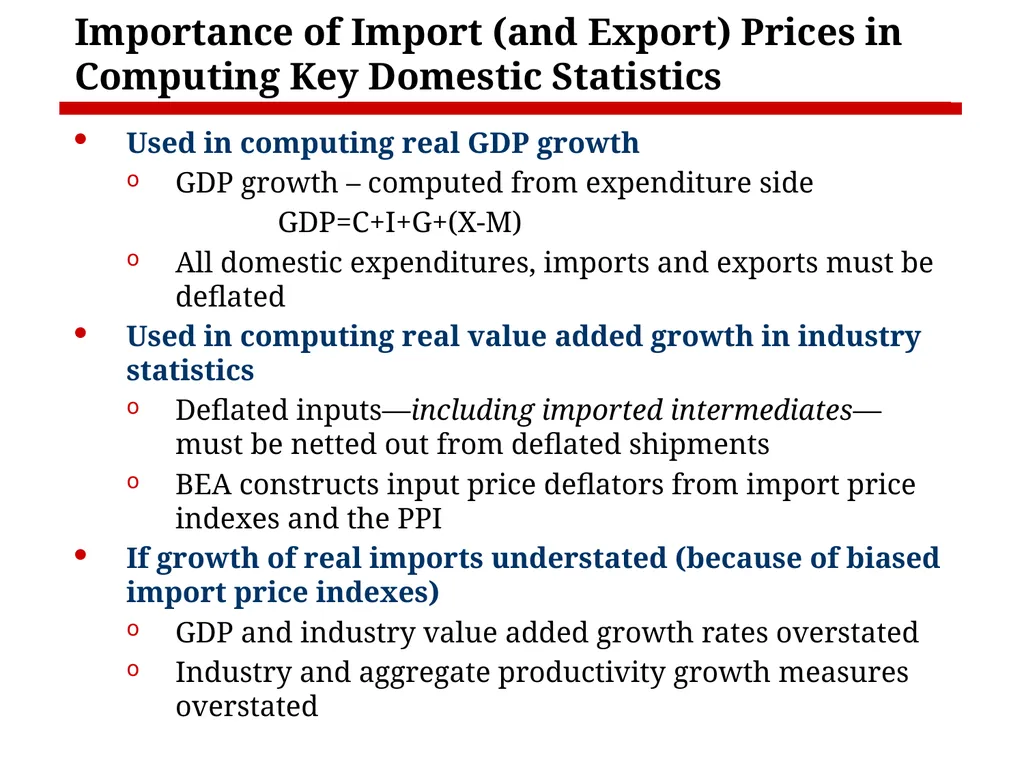
Importance of Import (and Export) Prices in Computing Key Domestic Statistics Used in computing real GDP growth
GDP growth – computed from expenditure side
GDP=C+I+G+(X-M)
All domestic expenditures, imports and exports must be deflated
Used in computing real value added growth in industry statistics
Deflated inputs—including imported intermediates—must be netted out from deflated shipments
BEA constructs input price deflators from import price indexes and the PPI
If growth of real imports understated (because of biased import price indexes)
GDP and industry value added growth rates overstated
Industry and aggregate productivity growth measures overstated<br>
GDP growth – computed from expenditure side
GDP=C+I+G+(X-M)
All domestic expenditures, imports and exports must be deflated
Used in computing real value added growth in industry statistics
Deflated inputs—including imported intermediates—must be netted out from deflated shipments
BEA constructs input price deflators from import price indexes and the PPI
If growth of real imports understated (because of biased import price indexes)
GDP and industry value added growth rates overstated
Industry and aggregate productivity growth measures overstated<br>
05
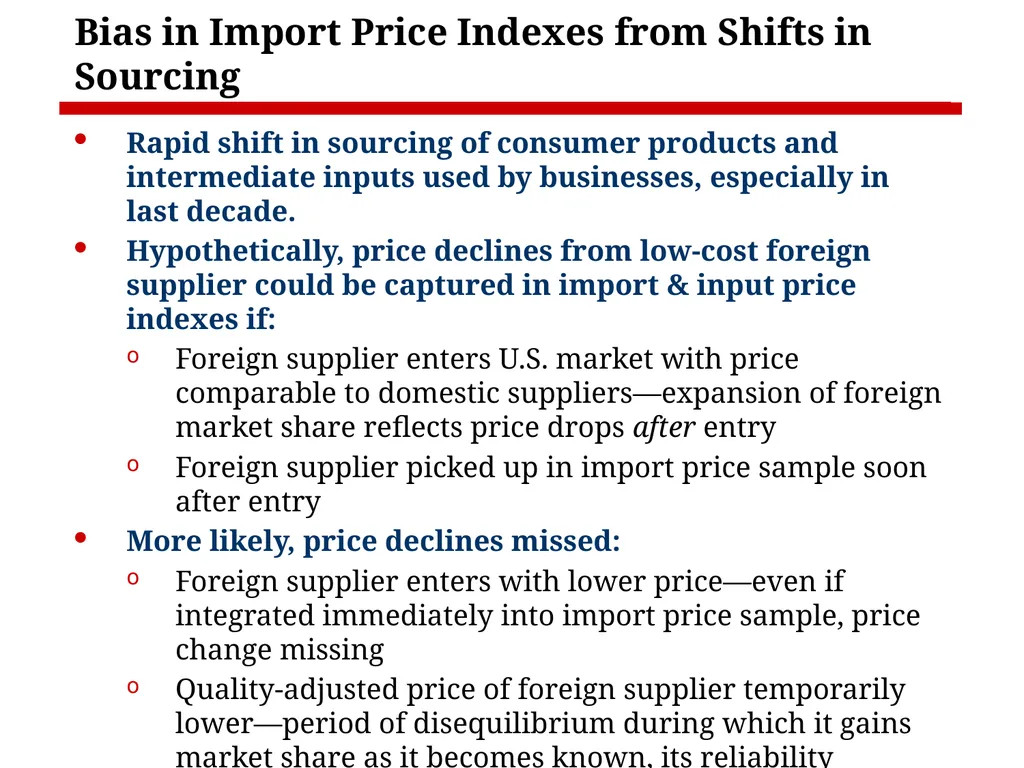
Bias in Import Price Indexes from Shifts in Sourcing Rapid shift in sourcing of consumer products and intermediate inputs used by businesses, especially in last decade.
Hypothetically, price declines from low-cost foreign supplier could be captured in import & input price indexes if:
Foreign supplier enters U.S. market with price comparable to domestic suppliers—expansion of foreign market share reflects price drops after entry
Foreign supplier picked up in import price sample soon after entry
More likely, price declines missed:
Foreign supplier enters with lower price—even if integrated immediately into import price sample, price change missing
Quality-adjusted price of foreign supplier temporarily lower—period of disequilibrium during which it gains market share as it becomes known, its reliability established, & purchasers’ contracts with domestic supplier expire
(Alterman; Diewert & Nakamura; Houseman, Kurz, Lengermann & Mandel; Reinsdorf & Yuskavage)<br>
Hypothetically, price declines from low-cost foreign supplier could be captured in import & input price indexes if:
Foreign supplier enters U.S. market with price comparable to domestic suppliers—expansion of foreign market share reflects price drops after entry
Foreign supplier picked up in import price sample soon after entry
More likely, price declines missed:
Foreign supplier enters with lower price—even if integrated immediately into import price sample, price change missing
Quality-adjusted price of foreign supplier temporarily lower—period of disequilibrium during which it gains market share as it becomes known, its reliability established, & purchasers’ contracts with domestic supplier expire
(Alterman; Diewert & Nakamura; Houseman, Kurz, Lengermann & Mandel; Reinsdorf & Yuskavage)<br>
06
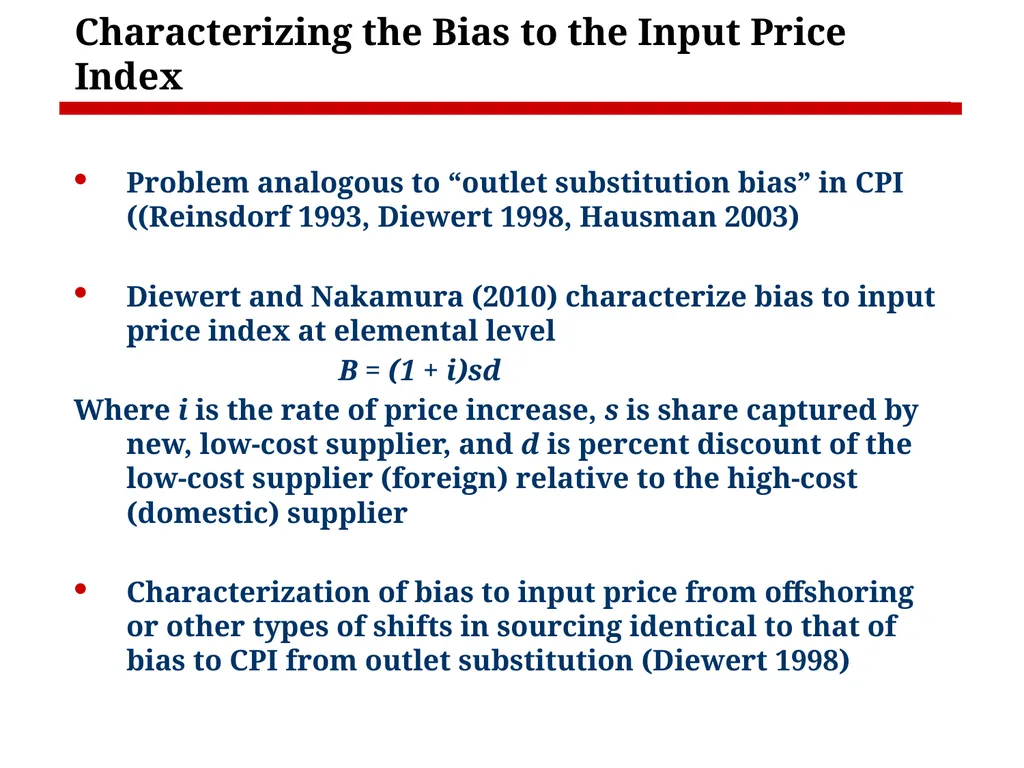
Characterizing the Bias to the Input Price Index Problem analogous to “outlet substitution bias” in CPI ((Reinsdorf 1993, Diewert 1998, Hausman 2003)
Diewert and Nakamura (2010) characterize bias to input price index at elemental level
B = (1 + i)sd
Where i is the rate of price increase, s is share captured by new, low-cost supplier, and d is percent discount of the low-cost supplier (foreign) relative to the high-cost (domestic) supplier
Characterization of bias to input price from offshoring or other types of shifts in sourcing identical to that of bias to CPI from outlet substitution (Diewert 1998)<br>
Diewert and Nakamura (2010) characterize bias to input price index at elemental level
B = (1 + i)sd
Where i is the rate of price increase, s is share captured by new, low-cost supplier, and d is percent discount of the low-cost supplier (foreign) relative to the high-cost (domestic) supplier
Characterization of bias to input price from offshoring or other types of shifts in sourcing identical to that of bias to CPI from outlet substitution (Diewert 1998)<br>
07
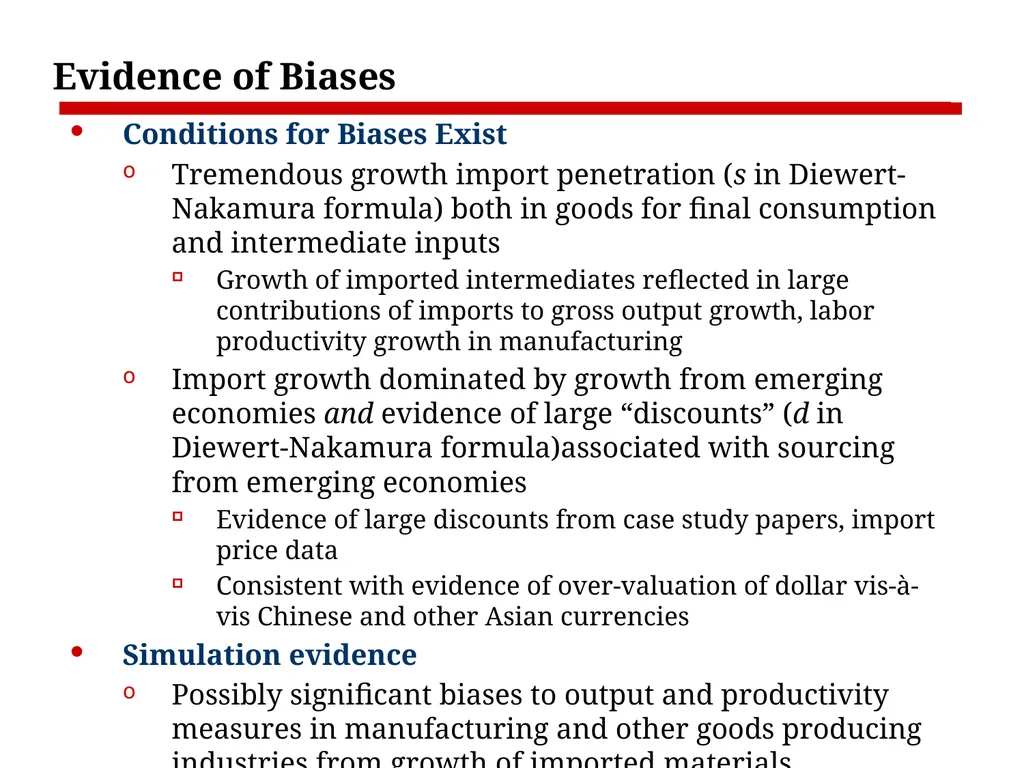
Evidence of Biases Conditions for Biases Exist
Tremendous growth import penetration (s in Diewert-Nakamura formula) both in goods for final consumption and intermediate inputs
Growth of imported intermediates reflected in large contributions of imports to gross output growth, labor productivity growth in manufacturing
Import growth dominated by growth from emerging economies and evidence of large “discounts” (d in Diewert-Nakamura formula)associated with sourcing from emerging economies
Evidence of large discounts from case study papers, import price data
Consistent with evidence of over-valuation of dollar vis-à-vis Chinese and other Asian currencies
Simulation evidence
Possibly significant biases to output and productivity measures in manufacturing and other goods producing industries from growth of imported materials intermediates
(Byrne, Kovak & Michaels; Eldridge & Harper; Houseman, Kurz, Lengermann & Mandel; Klier & Rubenstein; Strassner, Yuskavage & Lee)<br>
Tremendous growth import penetration (s in Diewert-Nakamura formula) both in goods for final consumption and intermediate inputs
Growth of imported intermediates reflected in large contributions of imports to gross output growth, labor productivity growth in manufacturing
Import growth dominated by growth from emerging economies and evidence of large “discounts” (d in Diewert-Nakamura formula)associated with sourcing from emerging economies
Evidence of large discounts from case study papers, import price data
Consistent with evidence of over-valuation of dollar vis-à-vis Chinese and other Asian currencies
Simulation evidence
Possibly significant biases to output and productivity measures in manufacturing and other goods producing industries from growth of imported materials intermediates
(Byrne, Kovak & Michaels; Eldridge & Harper; Houseman, Kurz, Lengermann & Mandel; Klier & Rubenstein; Strassner, Yuskavage & Lee)<br>
08
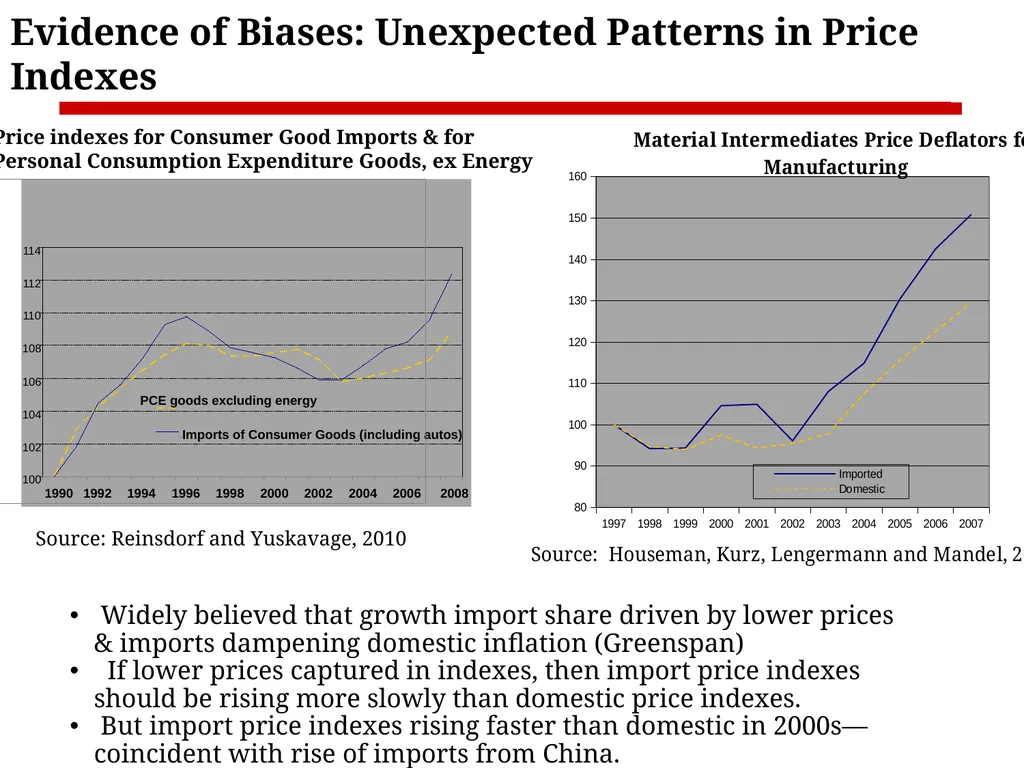
Evidence of Biases: Unexpected Patterns in Price Indexes Source: Reinsdorf and Yuskavage, 2010 Widely believed that growth import share driven by lower prices & imports dampening domestic inflation (Greenspan)
If lower prices captured in indexes, then import price indexes should be rising more slowly than domestic price indexes.
But import price indexes rising faster than domestic in 2000s—coincident with rise of imports from China. Price indexes for Consumer Good Imports & for
Personal Consumption Expenditure Goods, ex Energy<br>
If lower prices captured in indexes, then import price indexes should be rising more slowly than domestic price indexes.
But import price indexes rising faster than domestic in 2000s—coincident with rise of imports from China. Price indexes for Consumer Good Imports & for
Personal Consumption Expenditure Goods, ex Energy<br>
09
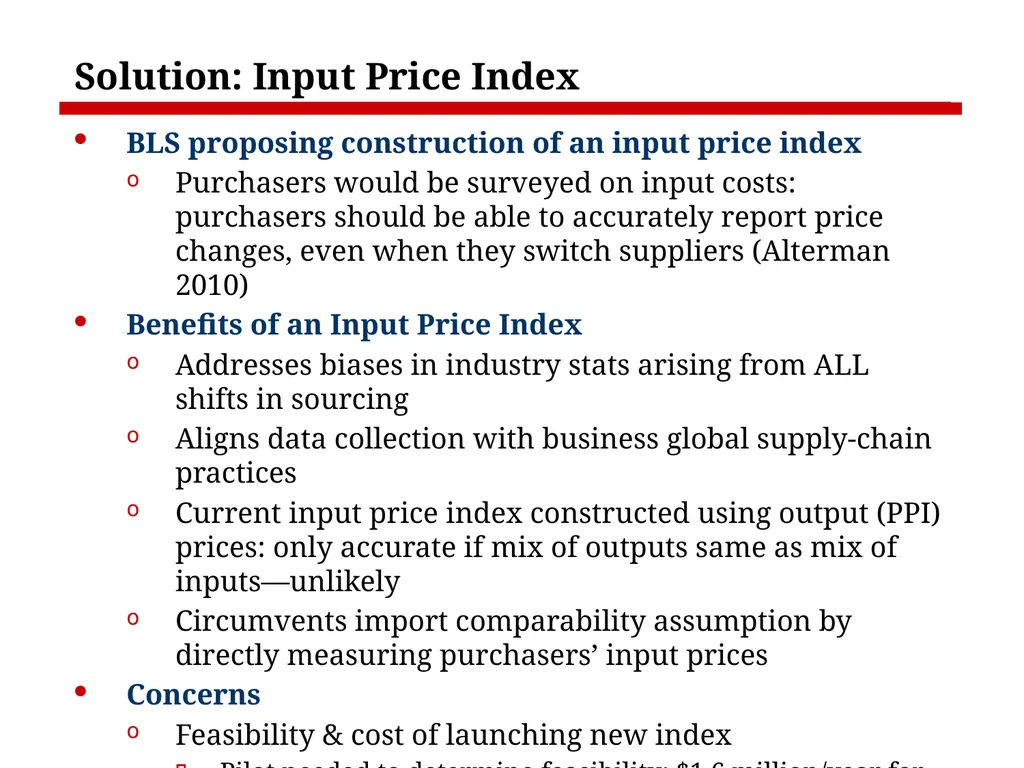
Solution: Input Price Index BLS proposing construction of an input price index
Purchasers would be surveyed on input costs: purchasers should be able to accurately report price changes, even when they switch suppliers (Alterman 2010)
Benefits of an Input Price Index
Addresses biases in industry stats arising from ALL shifts in sourcing
Aligns data collection with business global supply-chain practices
Current input price index constructed using output (PPI) prices: only accurate if mix of outputs same as mix of inputs—unlikely
Circumvents import comparability assumption by directly measuring purchasers’ input prices
Concerns
Feasibility & cost of launching new index
Pilot needed to determine feasibility: $1.6 million/year for 2-3 years
Any full implementation of input price index several years away
Would not directly address biases in GDP : research needed<br>
Purchasers would be surveyed on input costs: purchasers should be able to accurately report price changes, even when they switch suppliers (Alterman 2010)
Benefits of an Input Price Index
Addresses biases in industry stats arising from ALL shifts in sourcing
Aligns data collection with business global supply-chain practices
Current input price index constructed using output (PPI) prices: only accurate if mix of outputs same as mix of inputs—unlikely
Circumvents import comparability assumption by directly measuring purchasers’ input prices
Concerns
Feasibility & cost of launching new index
Pilot needed to determine feasibility: $1.6 million/year for 2-3 years
Any full implementation of input price index several years away
Would not directly address biases in GDP : research needed<br>
10
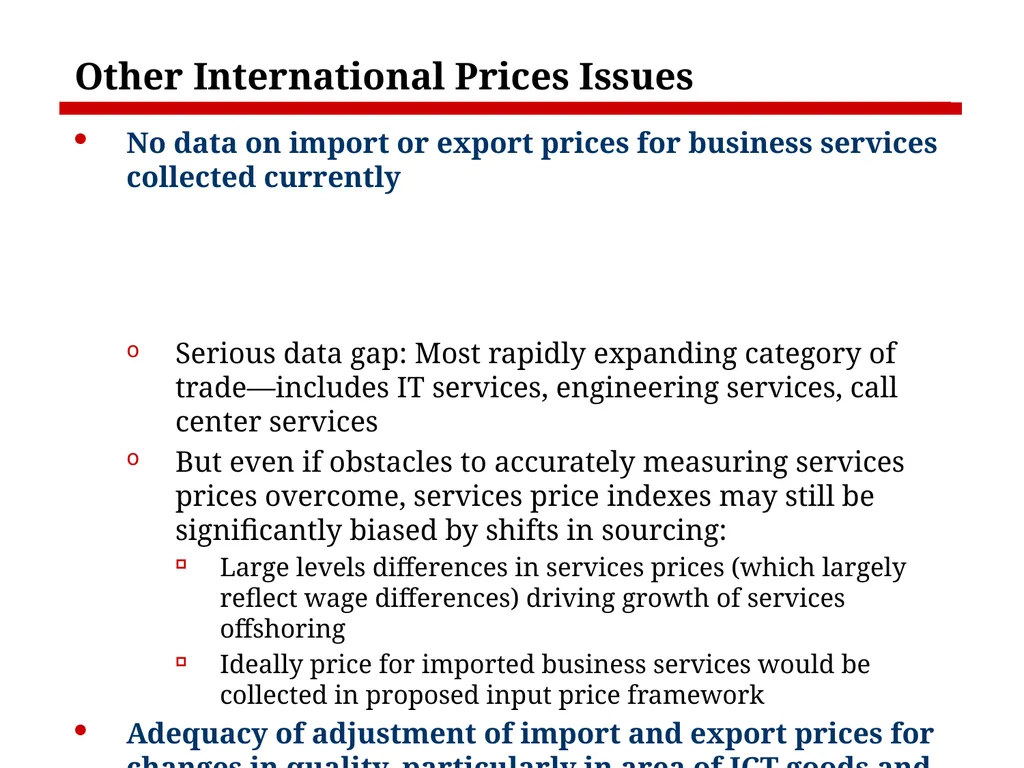
Other International Prices Issues No data on import or export prices for business services collected currently
Serious data gap: Most rapidly expanding category of trade—includes IT services, engineering services, call center services
But even if obstacles to accurately measuring services prices overcome, services price indexes may still be significantly biased by shifts in sourcing:
Large levels differences in services prices (which largely reflect wage differences) driving growth of services offshoring
Ideally price for imported business services would be collected in proposed input price framework
Adequacy of adjustment of import and export prices for changes in quality, particularly in area of ICT goods and services
Global integration of production of ICT goods & rapid growth ICT services trade make this a high priority
Inconsistent quality adjustment of domestic, import and export prices can result in significant biases<br>
Serious data gap: Most rapidly expanding category of trade—includes IT services, engineering services, call center services
But even if obstacles to accurately measuring services prices overcome, services price indexes may still be significantly biased by shifts in sourcing:
Large levels differences in services prices (which largely reflect wage differences) driving growth of services offshoring
Ideally price for imported business services would be collected in proposed input price framework
Adequacy of adjustment of import and export prices for changes in quality, particularly in area of ICT goods and services
Global integration of production of ICT goods & rapid growth ICT services trade make this a high priority
Inconsistent quality adjustment of domestic, import and export prices can result in significant biases<br>
11
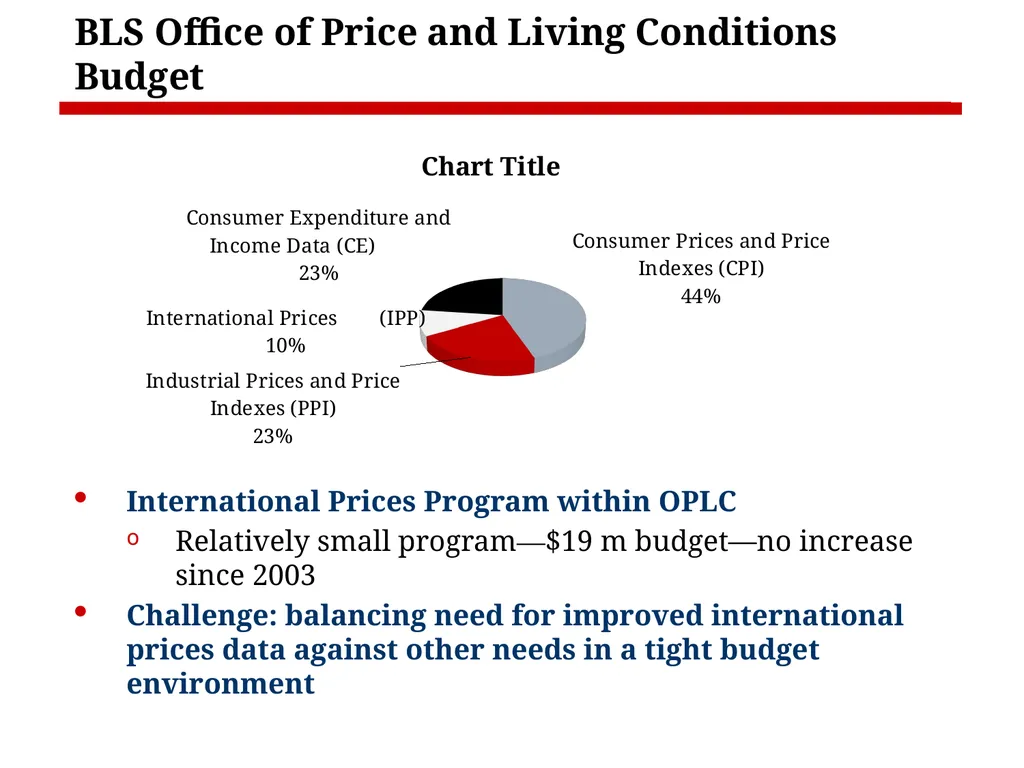
BLS Office of Price and Living Conditions Budget International Prices Program within OPLC
Relatively small program—$19 m budget—no increase since 2003
Challenge: balancing need for improved international prices data against other needs in a tight budget environment<br>
Relatively small program—$19 m budget—no increase since 2003
Challenge: balancing need for improved international prices data against other needs in a tight budget environment<br>
12
Other Measurement Issue:
Tracking Import Use in Economy Outsourcing and offshoring issues require data on firm or industry uses of intermediate goods and services, and the source of those inputs, especially if they are imported
Many prior studies have relied on publicly available input-output data to estimate outsourcing and offshoring at the industry level
Key input-output data limitation – Destination of imported intermediate goods and services not tracked directly
Consequently, BEA uses “import comparability assumption” – economy-wide import share for specific good or service assumed for all industries using that input
Inaccuracies in import comparability assumption potentially affect wide range of other analyses based on input-output data. E.g.:
Economic impact of state and local economic development policies (How much leakage overseas occurs?)
Employment impact of export growth (What is the import content of exports?)<br>
Many prior studies have relied on publicly available input-output data to estimate outsourcing and offshoring at the industry level
Key input-output data limitation – Destination of imported intermediate goods and services not tracked directly
Consequently, BEA uses “import comparability assumption” – economy-wide import share for specific good or service assumed for all industries using that input
Inaccuracies in import comparability assumption potentially affect wide range of other analyses based on input-output data. E.g.:
Economic impact of state and local economic development policies (How much leakage overseas occurs?)
Employment impact of export growth (What is the import content of exports?)<br>
13
Tracking Import Use in Economy:
Conference Research Findings Several papers identified limitations of assumption:
Strassner, Yuskavage, and Lee used MNC data to develop alternative measures of imported intermediate materials and found:
For manufacturing, MNC data indicated imported materials consistently higher than estimates using import comparability assumption
Notable differences in estimated import shares of intermediate commodities among specific manufacturing industries
Feenstra and Jensen linked firm-level production and import data from the Linked/Longitudinal Firm Trade Transaction Database [LFTTD] and found:
different import share estimates for those industry groups and specific intermediate commodities with high import values
conceptual issues with “firm level I-O” estimates may account for some of these differences<br>
Strassner, Yuskavage, and Lee used MNC data to develop alternative measures of imported intermediate materials and found:
For manufacturing, MNC data indicated imported materials consistently higher than estimates using import comparability assumption
Notable differences in estimated import shares of intermediate commodities among specific manufacturing industries
Feenstra and Jensen linked firm-level production and import data from the Linked/Longitudinal Firm Trade Transaction Database [LFTTD] and found:
different import share estimates for those industry groups and specific intermediate commodities with high import values
conceptual issues with “firm level I-O” estimates may account for some of these differences<br>
14
Tracking Import Use in Economy:
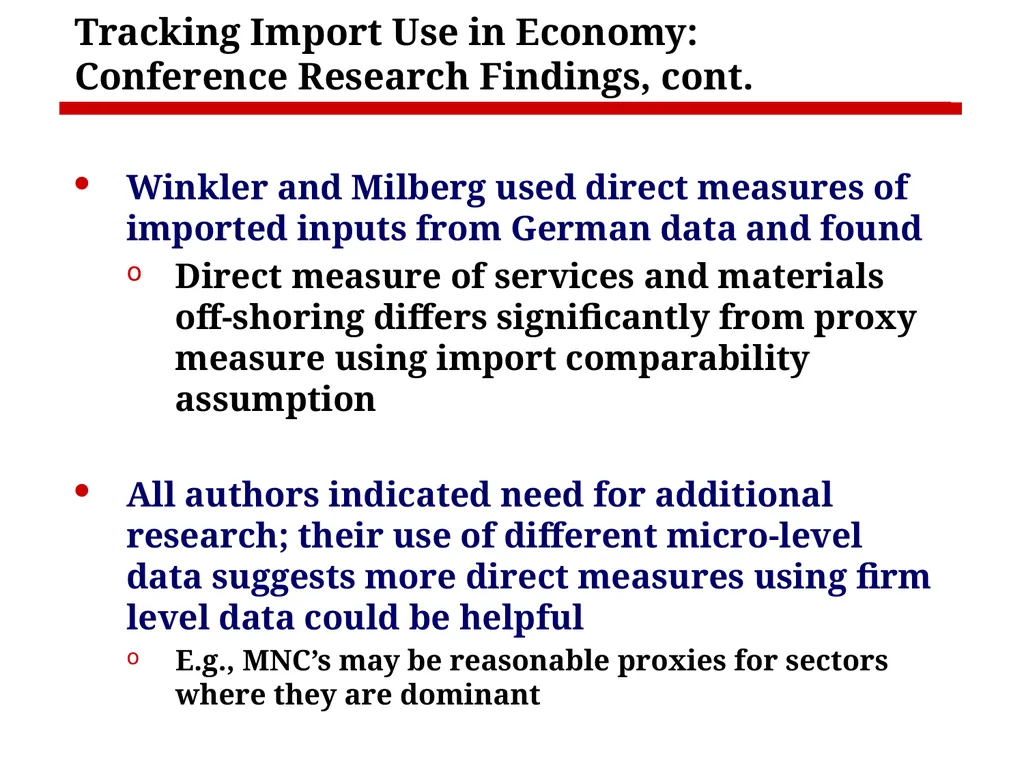
Conference Research Findings, cont. Winkler and Milberg used direct measures of imported inputs from German data and found
Direct measure of services and materials off-shoring differs significantly from proxy measure using import comparability assumption
All authors indicated need for additional research; their use of different micro-level data suggests more direct measures using firm level data could be helpful
E.g., MNC’s may be reasonable proxies for sectors where they are dominant<br>
Direct measure of services and materials off-shoring differs significantly from proxy measure using import comparability assumption
All authors indicated need for additional research; their use of different micro-level data suggests more direct measures using firm level data could be helpful
E.g., MNC’s may be reasonable proxies for sectors where they are dominant<br>
15
Other Measurement Issue:
Services Offshoring and Impacts on Workers To address new policy concerns raised by services offshoring, micro-level (firm) data needed
Analyses based on industry level input-output data may be inaccurate because of import comparability assumptions
Offshoring decisions are firm specific and NAPA study identified substantial variations in services offshoring among firms within selected industries
Jarmin, Krizan, and Tang used new 2007 Census of Business data, linked to other longitudinal Census business microdata and also found that vast majority of manufacturing firms did not outsource or offshore inputs and those that did were larger firms.
Focusing on large-firm data may capture vast majority of offshoring phenomenon
Surveys may miss smaller firm offshoring that occurs indirectly if domestic supplier of inputs offshores some activity<br>
Analyses based on industry level input-output data may be inaccurate because of import comparability assumptions
Offshoring decisions are firm specific and NAPA study identified substantial variations in services offshoring among firms within selected industries
Jarmin, Krizan, and Tang used new 2007 Census of Business data, linked to other longitudinal Census business microdata and also found that vast majority of manufacturing firms did not outsource or offshore inputs and those that did were larger firms.
Focusing on large-firm data may capture vast majority of offshoring phenomenon
Surveys may miss smaller firm offshoring that occurs indirectly if domestic supplier of inputs offshores some activity<br>
16
Other Measurement Issue:
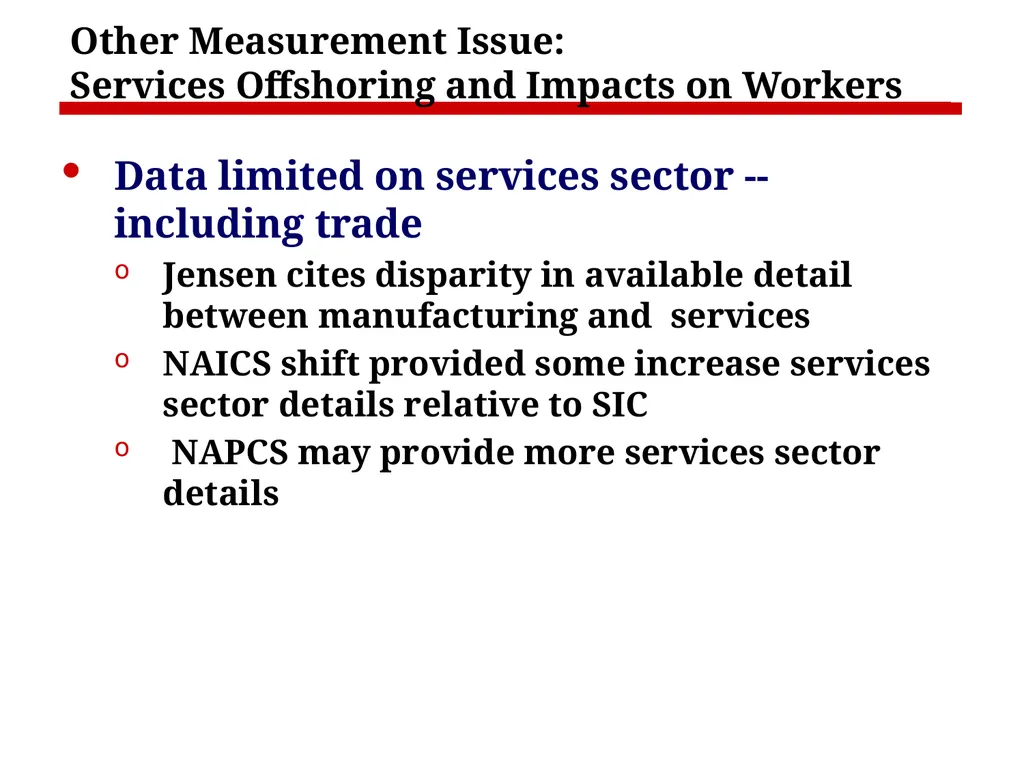
Services Offshoring and Impacts on Workers Data limited on services sector --including trade
Jensen cites disparity in available detail between manufacturing and services
NAICS shift provided some increase services sector details relative to SIC
NAPCS may provide more services sector details<br>
Jensen cites disparity in available detail between manufacturing and services
NAICS shift provided some increase services sector details relative to SIC
NAPCS may provide more services sector details<br>
17
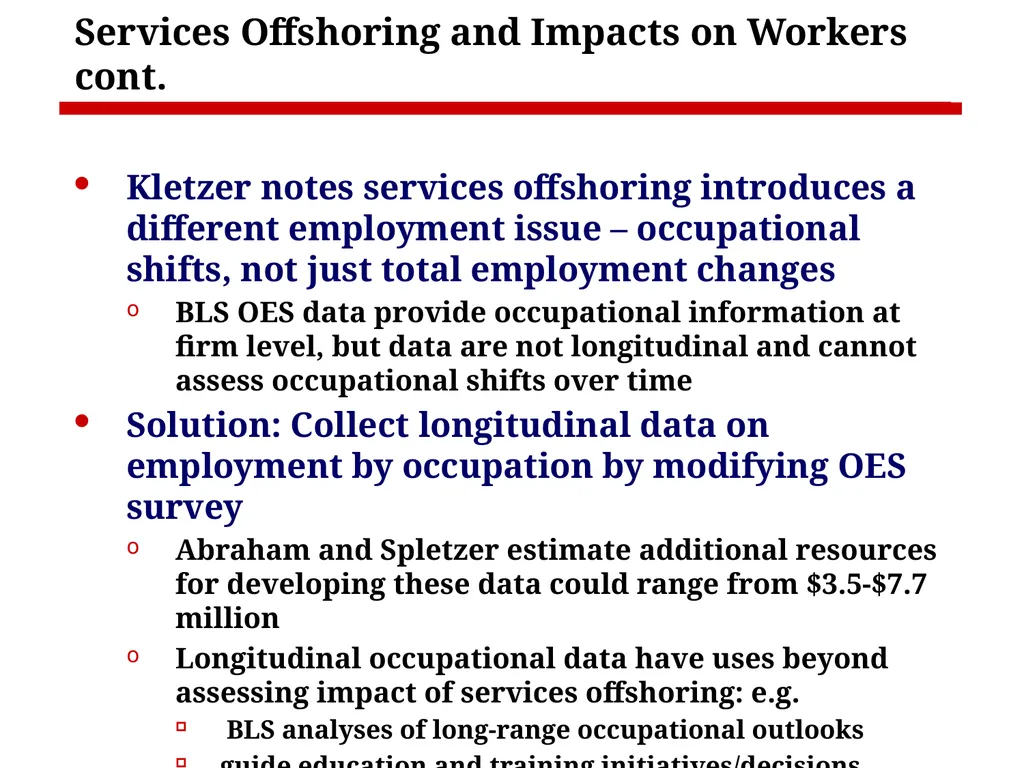
Services Offshoring and Impacts on Workers cont. Kletzer notes services offshoring introduces a different employment issue – occupational shifts, not just total employment changes
BLS OES data provide occupational information at firm level, but data are not longitudinal and cannot assess occupational shifts over time
Solution: Collect longitudinal data on employment by occupation by modifying OES survey
Abraham and Spletzer estimate additional resources for developing these data could range from $3.5-$7.7 million
Longitudinal occupational data have uses beyond assessing impact of services offshoring: e.g.
BLS analyses of long-range occupational outlooks
guide education and training initiatives/decisions<br>
BLS OES data provide occupational information at firm level, but data are not longitudinal and cannot assess occupational shifts over time
Solution: Collect longitudinal data on employment by occupation by modifying OES survey
Abraham and Spletzer estimate additional resources for developing these data could range from $3.5-$7.7 million
Longitudinal occupational data have uses beyond assessing impact of services offshoring: e.g.
BLS analyses of long-range occupational outlooks
guide education and training initiatives/decisions<br>
18
A first step: Address Data Limitations with more Efficient Use of Existing Micro-level Data Fiscal restraints mandate effective use of existing available data among all federal statistical agencies
Micro-level data critical for assessing a number of economic issues, particularly outsourcing activities and services offshoring
Improved data sharing and access to micro-level data requires amending Confidential Information Protection and Statistical Efficiency Act CIPSEA<br>
Micro-level data critical for assessing a number of economic issues, particularly outsourcing activities and services offshoring
Improved data sharing and access to micro-level data requires amending Confidential Information Protection and Statistical Efficiency Act CIPSEA<br>
19
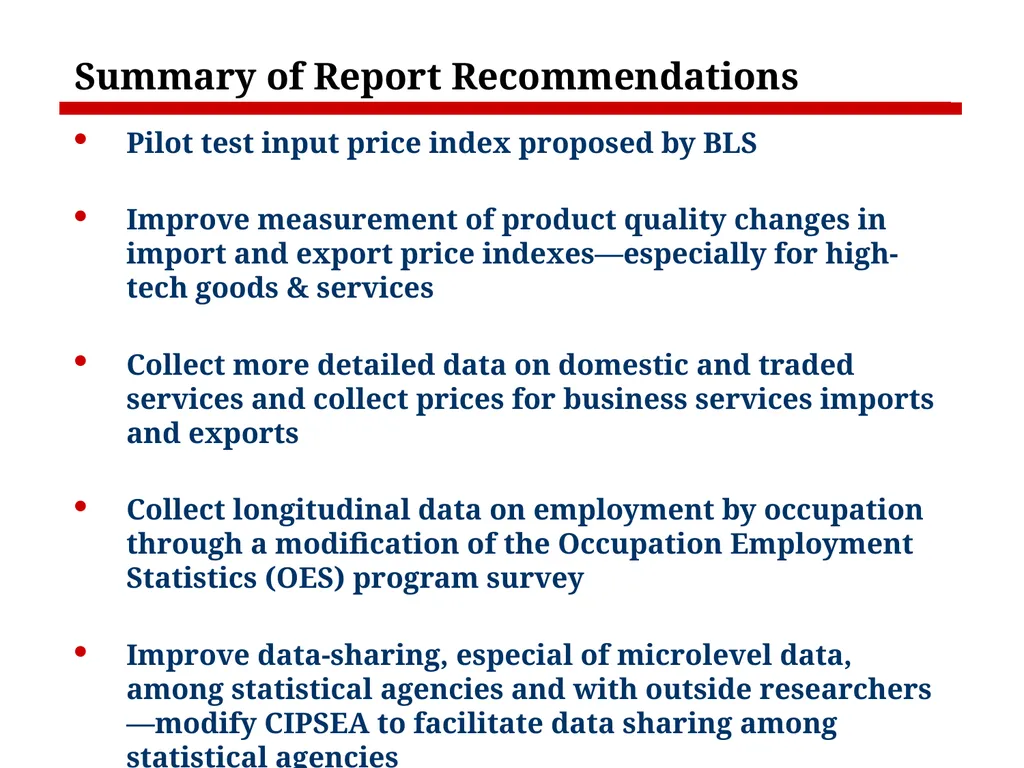
Summary of Report Recommendations Pilot test input price index proposed by BLS
Improve measurement of product quality changes in import and export price indexes—especially for high-tech goods & services
Collect more detailed data on domestic and traded services and collect prices for business services imports and exports
Collect longitudinal data on employment by occupation through a modification of the Occupation Employment Statistics (OES) program survey
Improve data-sharing, especial of microlevel data, among statistical agencies and with outside researchers—modify CIPSEA to facilitate data sharing among statistical agencies
http://bea.gov/papers/pdf/napa_bea_2010summary_final.pdf
http://bea.gov/papers/pdf/bea_2010_conference%20papers_final.pdf<br>
Improve measurement of product quality changes in import and export price indexes—especially for high-tech goods & services
Collect more detailed data on domestic and traded services and collect prices for business services imports and exports
Collect longitudinal data on employment by occupation through a modification of the Occupation Employment Statistics (OES) program survey
Improve data-sharing, especial of microlevel data, among statistical agencies and with outside researchers—modify CIPSEA to facilitate data sharing among statistical agencies
http://bea.gov/papers/pdf/napa_bea_2010summary_final.pdf
http://bea.gov/papers/pdf/bea_2010_conference%20papers_final.pdf<br>