@miniPCR fb.com/miniPCR @miniPCR Knockout! A
Description: miniPCR fb.comminiPCR miniPCR Knockout! A CRISPRCas Gene Targeting Lab PCR Genotyping Experiment Todays lab In the Knockout! Lab, you disabled the lacZ gene in bacteria using the CRISPRCas system You assayed a gene knockout using a
Related Topics
Download Presentation
"@miniPCR fb.com/miniPCR @miniPCR Knockout! A" is the property of its rightful owner. Permission is granted to download and print the materials on this website for personal, non-commercial use only, and to display it on your personal computer provided you do not modify the materials and that you retain all copyright notices contained in the materials. By downloading content from our website, you accept the terms of this agreement.
Presentation Transcript
slide1. @miniPCR fb.com/miniPCR @miniPCR Knockout! A CRISPR/Cas Gene Targeting Lab PCR Genotyping Experiment<br>
slide2. Today’s lab In the Knockout! Lab, you disabled the lacZ gene in bacteria using the CRISPR/Cas system
You assayed a gene knockout using a phenotypic screen
Today, you will confirm that you knocked out the lacZ gene using a molecular test<br>
slide3. Presentation outline Review of Knockout! Lab
Today’s lab: PCR molecular genotyping test<br>
slide4. Target for knock out: lacZ The lacZ gene encodes a protein called β-galactosidase
β-galactosidase breaks down lactose, but can also breakdown a chemical called X-gal
This produces a blue pigment<br>
slide5. Target for knockout: lacZ When you grow bacteria on agar plates that contain X-gal, β-galactosidase breaks down the X-gal and the colonies appear blue
This tells you the lacZ gene was functional<br>
slide6. Target for knock out: lacZ Bacteria can carry genes both on their chromosomes, and also on plasmids
The cells you used contained a plasmid called pLacZ that has the lacZ gene<br>
slide7. Introducing Cas9 to the bacteria While the CRISPR/Cas system is native to bacteria, not all bacteria use Cas9
The E. coli used in the Knockout! lab do not have Cas9
You introduced Cas9 by transforming the cells with a second plasmid<br>
slide8. Plasmids used for transformation pKO
cas9 gene
lacZ guide RNA
2. pCtrl
cas9 gene
random guide RNA<br>
slide9. Experimental reaction: Transform cells with pKO <Click to play> pLacZ cut,
lacZ gene
disabled<br>
slide10. Control reaction: Transform cells with pCtrl <Click to play> pLacZ not cut<br>
slide11. Experimental reaction Control reaction pLacZ cut,
lacZ gene
disabled<br>
slide12. Summary Experimental reaction
Transform with pKO
Cas9 should cut and disable the lacZ gene You used a phenotypic screen to infer whether the lacZ gene had been cut. Now you will test the DNA to confirm your results! Control reaction
Transform with pCtrl
Cas9 should not cut the lacZ gene<br>
slide13. Presentation outline Review of Knockout! Lab
Today’s lab: PCR molecular genotyping test<br>
slide14. Genotyping to confirm results at the molecular level Genotyping is a type of genetic test to determine an organism’s genotype for one or more specific regions of the genome
You will perform two steps to genotype your transformed bacteria
Use PCR to make many copies of the lacZ gene. If the bacteria contain the lacZ sequence it will be amplified, but if lacZ was knocked out with CRISPR/Cas, the sequence won’t be present.
Visualize your PCR products using gel electrophoresis to determine if the lacZ gene was present or absent<br>
slide15. Lab overview<br>
slide16. The Polymerase Chain Reaction Find and replicate a specific DNA target © 2019 by Amplyus LLC<br>
slide17. Template DNA to be amplified
Pair of DNA primers
DNA polymerase
dNTPs
Buffer to maintain pH and provide Mg2+ PCR background:What goes in a reaction PCR Master Mix Taq<br>
slide18. 1) 94 °C
Denaturation 2) 57 °C
Annealing 3) 72 °C
Extension Primer 1 dNTPs Taq polymerase Primer 2 PCR background:3 steps to copy DNA<br>
slide19. PCR background:Exponential amplification<br>
slide20. The Knockout! Primer Mix that you will use contains two pairs of primers
Scientists call this a multiplexed PCR because you are amplifying multiple targets in the same reaction Primers used today<br>
slide21. Primers used today: lacZ primers Amplify a ~750 bp region of lacZ gene
Serves to verify the successful knockout of the lacZ gene
After the lacZ gene is cut by Cas9, the pLacZ plasmid degrades
In cells where the lacZ gene was knocked out by Cas9, PCR will not amplify the lacZ band<br>
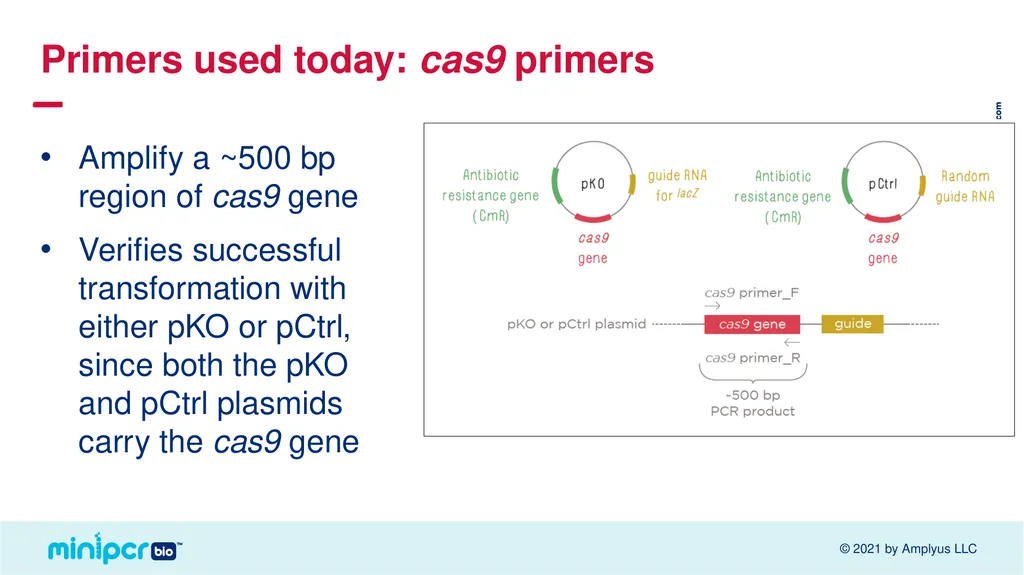
slide22. Primers used today: cas9 primers Amplify a ~500 bp region of cas9 gene
Verifies successful transformation with either pKO or pCtrl, since both the pKO and pCtrl plasmids carry the cas9 gene<br>
slide23. Predict your PCR results<br>
slide24. Prepare bacterial samples Use a toothpick to pick up one small blue colony
Gently glide the toothpick along the surface of the agar—you don’t want to scrape agar onto the toothpick
Immerse the toothpick in the water in the tube labeled “B”.
Allow it to soak for a few seconds; then, swirl the toothpick in the water.
Remove the toothpick and dispose of it as instructed by your teacher.<br>
slide25. Prepare bacterial samples Use a toothpick to pick up one small white colony
Gently glide the toothpick along the surface of the agar—you don’t want to scrape agar onto the toothpick
Immerse the toothpick in the water in the tube labeled “W”.
Allow it to soak for a few seconds; then, swirl the toothpick in the water.
Remove the toothpick and dispose of it as instructed by your teacher.<br>
slide26. Add PCR reagent to each PCR tube Prepare PCR samples<br>
slide27. PCR protocol Program your thermocycler according to the protocol below: Initial Denaturation 94°C, 30 sec
Denaturation 94°C , 15 sec
Annealing 57°C , 15 sec
Extension 72°C , 20 sec
Number of Cycles 30
Final Extension 72°C , 30 sec<br>
slide28. The miniPCR®
app<br>
slide29. See basic program and status information<br>
slide30. Observe temperature information in real time.<br>
slide31. View animations of molecular processes as they happen.<br>
slide32. Graph of the estimated number of DNA copies made let’s you follow the progress of the reaction<br>
slide33. Your tubes now contain amplified DNA.
But they don’t look any different than when we started!
To visualize the DNA, we will use agarose gel electrophoresis. Visualizing the DNA from your PCR<br>
slide34. Lab overview<br>
slide35. Background: Agarose gel electrophoresis Gel electrophoresis separates molecules based on size.
An electrical field pulls negatively charged DNA molecules through microscopic pores in the gel
Small DNA segments move more quickly than large ones, as they can easily move through the pores of the gel Magnified image of an agarose electrophoresis gel<br>
slide36. Background: Agarose gel electrophoresis + DNA is negatively charged and migrates toward the positive pole of the electrical field. Over time, small DNA segments travel further than large ones.<br>
slide37. Background: Agarose gel electrophoresis Ladder Sample 1 Sample 2 Sample 3 At the end of an electrophoresis run, you’ll see bands: groups of DNA segments of the same size<br>
slide38. Lane 1: 10 μl Fast DNA Ladder 1
Lane 2: 15 μl lacZ control PCR product
Lane 3: 15 μl cas9 control PCR product
Lane 4: 15 μl blue colony PCR product
Lane 5: 15 μl white colony PCR product Loading your gel<br>
slide39. Expected results This a multiplex PCR with 2 sets of primers:
lacZ primers amplify ~750 bp
cas9 primers amplify ~500 bp Base
Pairs 1200<br>
slide40. Other potential results PCR products only present in control samples Explanation:
Problem with DNA extraction from bacteria
The most common issue is the presence of too much DNA
Repeat the experiment and try not to pick up too much bacteria<br>
slide41. Other potential results lacZ band at ~750 bp in white colony sample
If the bacterial colony was white, does that mean the lacZ gene was disabled?! Explanation:
There are numerous copies of the pLacZ plasmid in each bacterium and the CRISPR/Cas system is not 100% efficient
Because PCR is so sensitive, it is possible that trace amounts of the PLacZ plasmid may be detected<br>
slide42. Other potential results lacZ band at ~750 bp absent in blue colony sample
If the bacterial colony was blue, does that mean the lacZ gene is present?! Explanation:
In a multiplex PCR, the smaller product is amplified preferentially
This could lead to amplification of the smaller cas9 PCR product while the larger lacZ PCR product is not copied at high enough levels to be detectable<br>

slide2. Today’s lab In the Knockout! Lab, you disabled the lacZ gene in bacteria using the CRISPR/Cas system
You assayed a gene knockout using a phenotypic screen
Today, you will confirm that you knocked out the lacZ gene using a molecular test<br>
slide3. Presentation outline Review of Knockout! Lab
Today’s lab: PCR molecular genotyping test<br>
slide4. Target for knock out: lacZ The lacZ gene encodes a protein called β-galactosidase
β-galactosidase breaks down lactose, but can also breakdown a chemical called X-gal
This produces a blue pigment<br>
slide5. Target for knockout: lacZ When you grow bacteria on agar plates that contain X-gal, β-galactosidase breaks down the X-gal and the colonies appear blue
This tells you the lacZ gene was functional<br>
slide6. Target for knock out: lacZ Bacteria can carry genes both on their chromosomes, and also on plasmids
The cells you used contained a plasmid called pLacZ that has the lacZ gene<br>
slide7. Introducing Cas9 to the bacteria While the CRISPR/Cas system is native to bacteria, not all bacteria use Cas9
The E. coli used in the Knockout! lab do not have Cas9
You introduced Cas9 by transforming the cells with a second plasmid<br>
slide8. Plasmids used for transformation pKO
cas9 gene
lacZ guide RNA
2. pCtrl
cas9 gene
random guide RNA<br>
slide9. Experimental reaction: Transform cells with pKO <Click to play> pLacZ cut,
lacZ gene
disabled<br>
slide10. Control reaction: Transform cells with pCtrl <Click to play> pLacZ not cut<br>
slide11. Experimental reaction Control reaction pLacZ cut,
lacZ gene
disabled<br>
slide12. Summary Experimental reaction
Transform with pKO
Cas9 should cut and disable the lacZ gene You used a phenotypic screen to infer whether the lacZ gene had been cut. Now you will test the DNA to confirm your results! Control reaction
Transform with pCtrl
Cas9 should not cut the lacZ gene<br>
slide13. Presentation outline Review of Knockout! Lab
Today’s lab: PCR molecular genotyping test<br>
slide14. Genotyping to confirm results at the molecular level Genotyping is a type of genetic test to determine an organism’s genotype for one or more specific regions of the genome
You will perform two steps to genotype your transformed bacteria
Use PCR to make many copies of the lacZ gene. If the bacteria contain the lacZ sequence it will be amplified, but if lacZ was knocked out with CRISPR/Cas, the sequence won’t be present.
Visualize your PCR products using gel electrophoresis to determine if the lacZ gene was present or absent<br>
slide15. Lab overview<br>
slide16. The Polymerase Chain Reaction Find and replicate a specific DNA target © 2019 by Amplyus LLC<br>
slide17. Template DNA to be amplified
Pair of DNA primers
DNA polymerase
dNTPs
Buffer to maintain pH and provide Mg2+ PCR background:What goes in a reaction PCR Master Mix Taq<br>
slide18. 1) 94 °C
Denaturation 2) 57 °C
Annealing 3) 72 °C
Extension Primer 1 dNTPs Taq polymerase Primer 2 PCR background:3 steps to copy DNA<br>
slide19. PCR background:Exponential amplification<br>
slide20. The Knockout! Primer Mix that you will use contains two pairs of primers
Scientists call this a multiplexed PCR because you are amplifying multiple targets in the same reaction Primers used today<br>
slide21. Primers used today: lacZ primers Amplify a ~750 bp region of lacZ gene
Serves to verify the successful knockout of the lacZ gene
After the lacZ gene is cut by Cas9, the pLacZ plasmid degrades
In cells where the lacZ gene was knocked out by Cas9, PCR will not amplify the lacZ band<br>
slide22. Primers used today: cas9 primers Amplify a ~500 bp region of cas9 gene
Verifies successful transformation with either pKO or pCtrl, since both the pKO and pCtrl plasmids carry the cas9 gene<br>
slide23. Predict your PCR results<br>
slide24. Prepare bacterial samples Use a toothpick to pick up one small blue colony
Gently glide the toothpick along the surface of the agar—you don’t want to scrape agar onto the toothpick
Immerse the toothpick in the water in the tube labeled “B”.
Allow it to soak for a few seconds; then, swirl the toothpick in the water.
Remove the toothpick and dispose of it as instructed by your teacher.<br>
slide25. Prepare bacterial samples Use a toothpick to pick up one small white colony
Gently glide the toothpick along the surface of the agar—you don’t want to scrape agar onto the toothpick
Immerse the toothpick in the water in the tube labeled “W”.
Allow it to soak for a few seconds; then, swirl the toothpick in the water.
Remove the toothpick and dispose of it as instructed by your teacher.<br>
slide26. Add PCR reagent to each PCR tube Prepare PCR samples<br>
slide27. PCR protocol Program your thermocycler according to the protocol below: Initial Denaturation 94°C, 30 sec
Denaturation 94°C , 15 sec
Annealing 57°C , 15 sec
Extension 72°C , 20 sec
Number of Cycles 30
Final Extension 72°C , 30 sec<br>
slide28. The miniPCR®
app<br>
slide29. See basic program and status information<br>
slide30. Observe temperature information in real time.<br>
slide31. View animations of molecular processes as they happen.<br>
slide32. Graph of the estimated number of DNA copies made let’s you follow the progress of the reaction<br>
slide33. Your tubes now contain amplified DNA.
But they don’t look any different than when we started!
To visualize the DNA, we will use agarose gel electrophoresis. Visualizing the DNA from your PCR<br>
slide34. Lab overview<br>
slide35. Background: Agarose gel electrophoresis Gel electrophoresis separates molecules based on size.
An electrical field pulls negatively charged DNA molecules through microscopic pores in the gel
Small DNA segments move more quickly than large ones, as they can easily move through the pores of the gel Magnified image of an agarose electrophoresis gel<br>
slide36. Background: Agarose gel electrophoresis + DNA is negatively charged and migrates toward the positive pole of the electrical field. Over time, small DNA segments travel further than large ones.<br>
slide37. Background: Agarose gel electrophoresis Ladder Sample 1 Sample 2 Sample 3 At the end of an electrophoresis run, you’ll see bands: groups of DNA segments of the same size<br>
slide38. Lane 1: 10 μl Fast DNA Ladder 1
Lane 2: 15 μl lacZ control PCR product
Lane 3: 15 μl cas9 control PCR product
Lane 4: 15 μl blue colony PCR product
Lane 5: 15 μl white colony PCR product Loading your gel<br>
slide39. Expected results This a multiplex PCR with 2 sets of primers:
lacZ primers amplify ~750 bp
cas9 primers amplify ~500 bp Base
Pairs 1200<br>
slide40. Other potential results PCR products only present in control samples Explanation:
Problem with DNA extraction from bacteria
The most common issue is the presence of too much DNA
Repeat the experiment and try not to pick up too much bacteria<br>
slide41. Other potential results lacZ band at ~750 bp in white colony sample
If the bacterial colony was white, does that mean the lacZ gene was disabled?! Explanation:
There are numerous copies of the pLacZ plasmid in each bacterium and the CRISPR/Cas system is not 100% efficient
Because PCR is so sensitive, it is possible that trace amounts of the PLacZ plasmid may be detected<br>
slide42. Other potential results lacZ band at ~750 bp absent in blue colony sample
If the bacterial colony was blue, does that mean the lacZ gene is present?! Explanation:
In a multiplex PCR, the smaller product is amplified preferentially
This could lead to amplification of the smaller cas9 PCR product while the larger lacZ PCR product is not copied at high enough levels to be detectable<br>