Model Trees for Identifying Exceptional Players in the NHL and NBA Drafts School of Computing Science Simon Fraser University Vancouver, Canada Yejia Liu, Oliver Schulte and Chao Li Problem Formulation: Drafting Prospects Drafting:
"Model Trees for Identifying Exceptional Players in" is the property of its rightful owner. Permission is granted to
download and print the materials on this website for personal, non-commercial use only, and to display it
on your personal computer provided you do not modify the materials and that you retain all copyright
notices contained in the materials. By downloading content from our website, you accept the terms of this
agreement.
Presentation Transcript
01
Model Trees for Identifying Exceptional Players in the NHL and NBA Drafts School of Computing Science
Simon Fraser University
Vancouver, Canada Yejia Liu, Oliver Schulte and Chao Li<br>
02
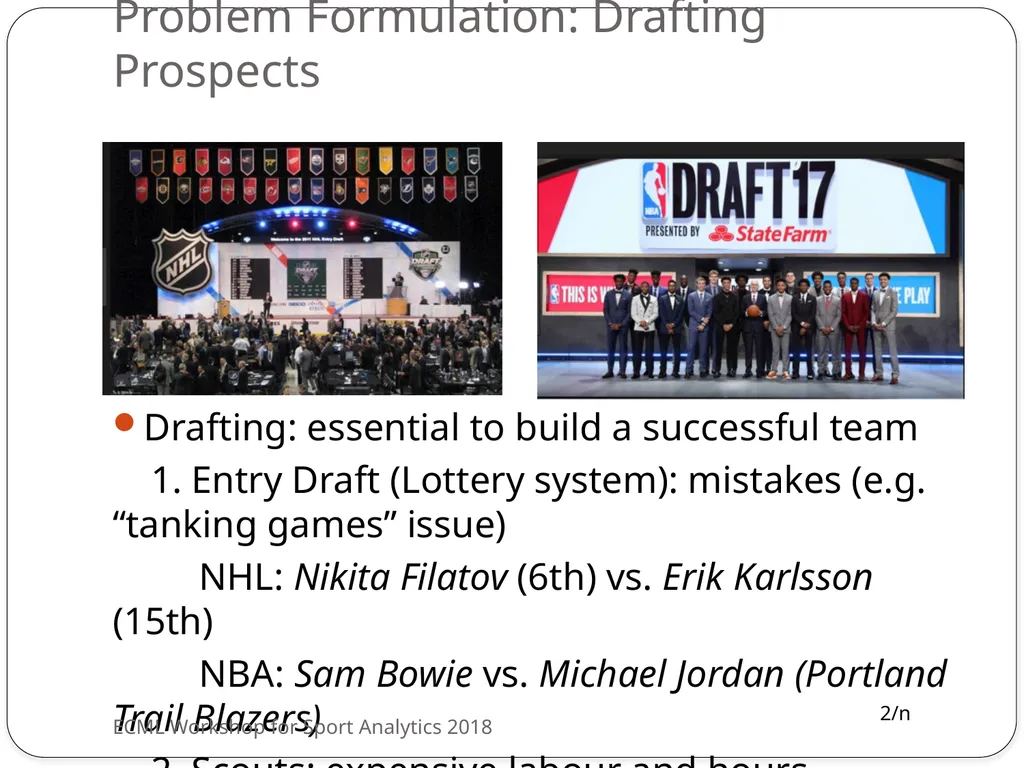
Problem Formulation: Drafting Prospects Drafting: essential to build a successful team
1. Entry Draft (Lottery system): mistakes (e.g. “tanking games” issue)
NHL: Nikita Filatov (6th) vs. Erik Karlsson (15th)
NBA: Sam Bowie vs. Michael Jordan (Portland Trail Blazers)
2. Scouts: expensive labour and hours ECML Workshop for Sport Analytics 2018<br>
03
Previous Models Regression-based approaches
Generalized additive model by Schuckers using season-by-season data of NHL draft
Linear regression model by Greene, using predraft + rookie years stats for NBA
Similarity-based approaches
Prospect Cohort Sucess Model (scoring rate, height and age)
PECOTA system in baseball
Lutz, D - “A cluster analysis of NBA players” Schuckers, M. & Statistical Sports Consulting, L. L. C. (2016), 'Draft by Numbers: Using Data and Analytics to Improve National Hockey League (NHL) Player Selection', MIT Sloan Sports Analytics Conference. Greene, A. (2015), 'The Success of NBA Draft Picks: Can College Career Predict NBA Winners', Master's thesis, St.Cloud State University. Lutz, D. (2012) A cluster analysis of NBA players. In: MIT Sloan Sports Analytics Conference<br>
04
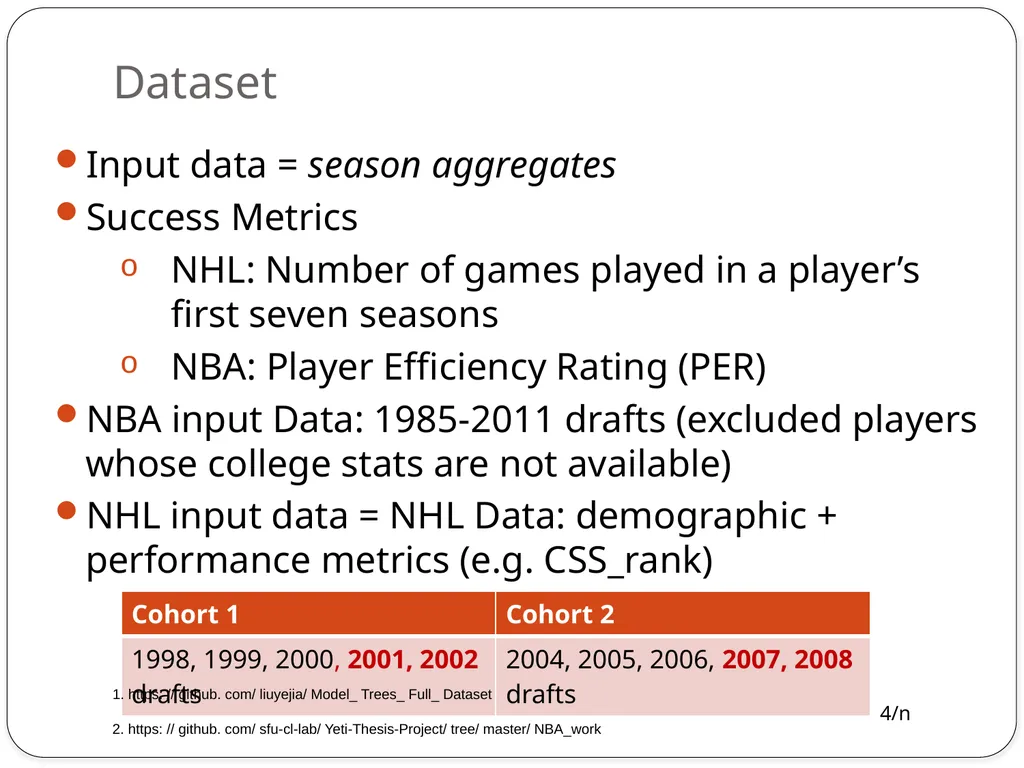
Dataset Input data = season aggregates
Success Metrics
NHL: Number of games played in a player’s first seven seasons
NBA: Player Efficiency Rating (PER)
NBA input Data: 1985-2011 drafts (excluded players whose college stats are not available)
NHL input data = NHL Data: demographic + performance metrics (e.g. CSS_rank) 1. https: // github. com/ liuyejia/ Model_ Trees_ Full_ Dataset 2. https: // github. com/ sfu-cl-lab/ Yeti-Thesis-Project/ tree/ master/ NBA_work<br>
05
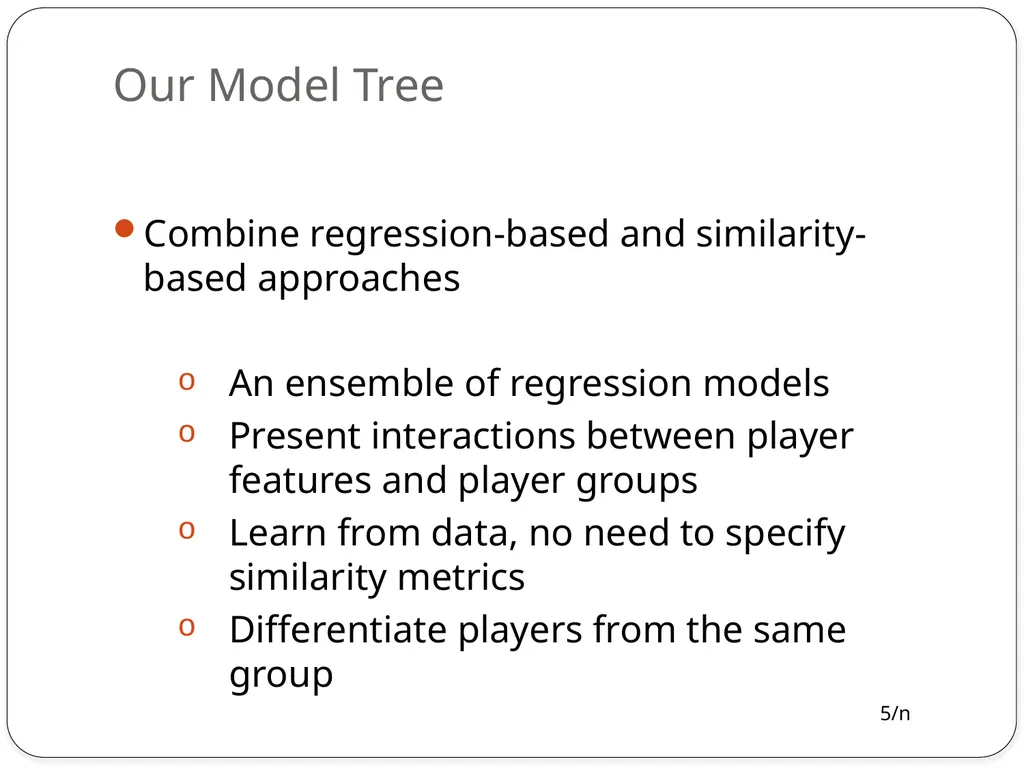
Our Model Tree Combine regression-based and similarity-based approaches
An ensemble of regression models
Present interactions between player features and player groups
Learn from data, no need to specify similarity metrics
Differentiate players from the same group<br>
06
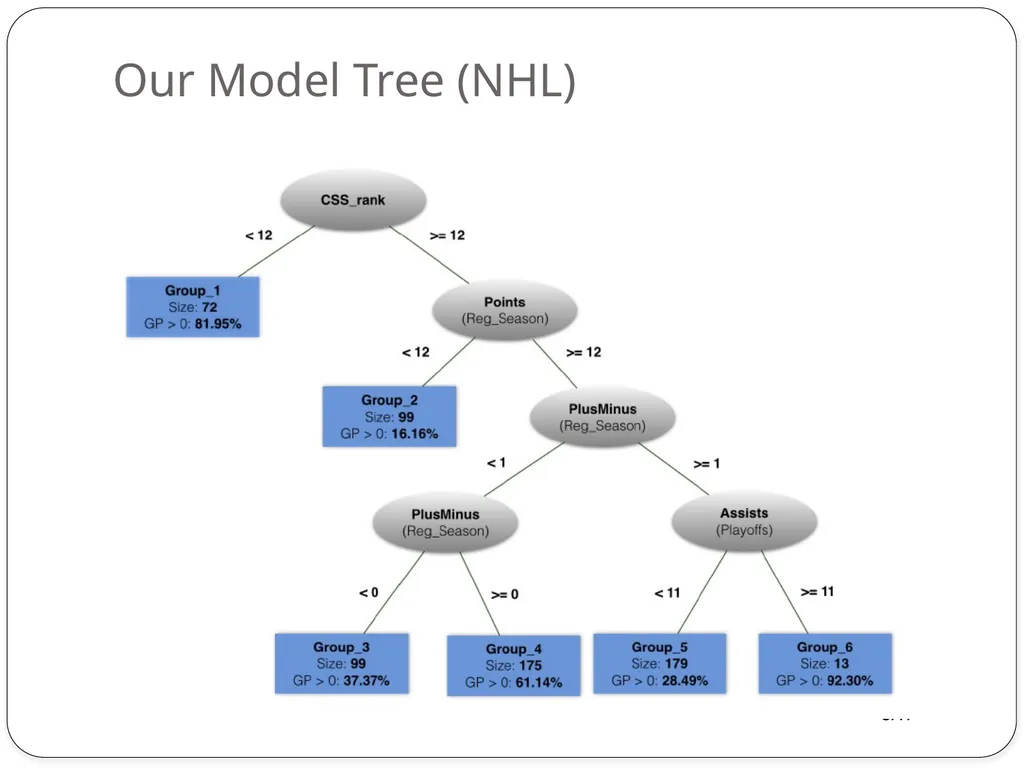
Our Model Tree (NHL)<br>
07
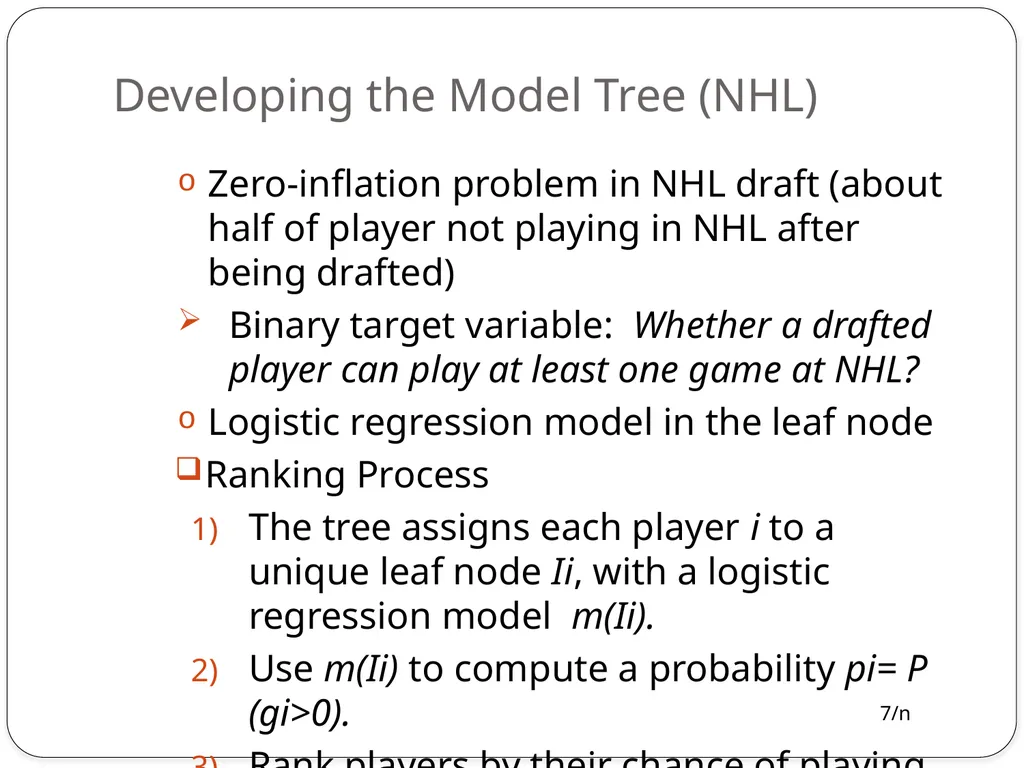
Developing the Model Tree (NHL) Zero-inflation problem in NHL draft (about half of player not playing in NHL after being drafted)
Binary target variable: Whether a drafted player can play at least one game at NHL?
Logistic regression model in the leaf node
Ranking Process
The tree assigns each player i to a unique leaf node Ii, with a logistic regression model m(Ii).
Use m(Ii) to compute a probability pi= P (gi>0).
Rank players by their chance of playing an NHL game<br>
08
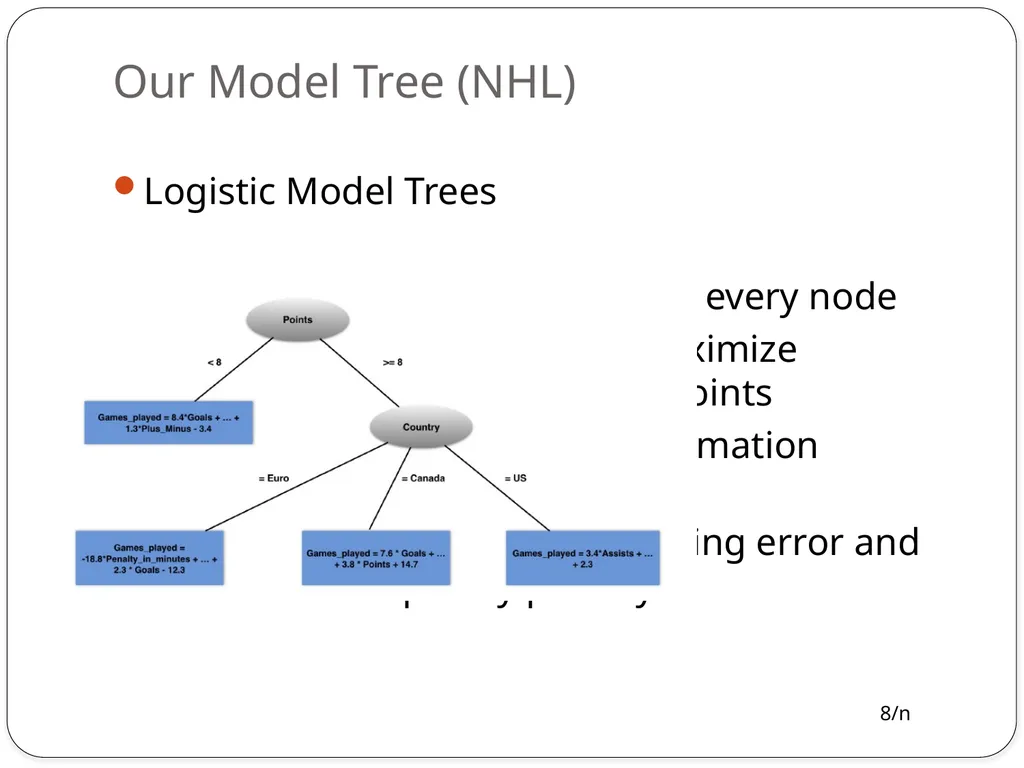
Our Model Tree (NHL) Logistic Model Trees
Logistic regression model in every node
LogitBoost algorithm to maximize likelihood of training data points
Tree splitting based on information entropy, similar to C4.5
Tree pruning based on training error and model complexity penalty<br>
09
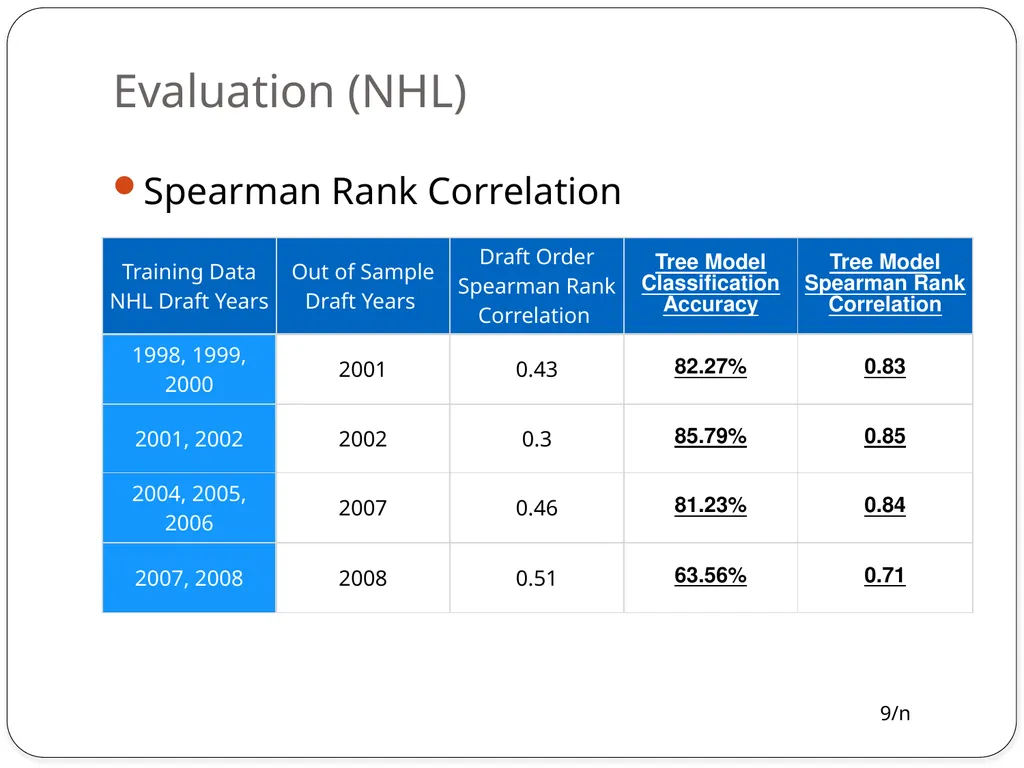
Evaluation (NHL) Spearman Rank Correlation<br>
10
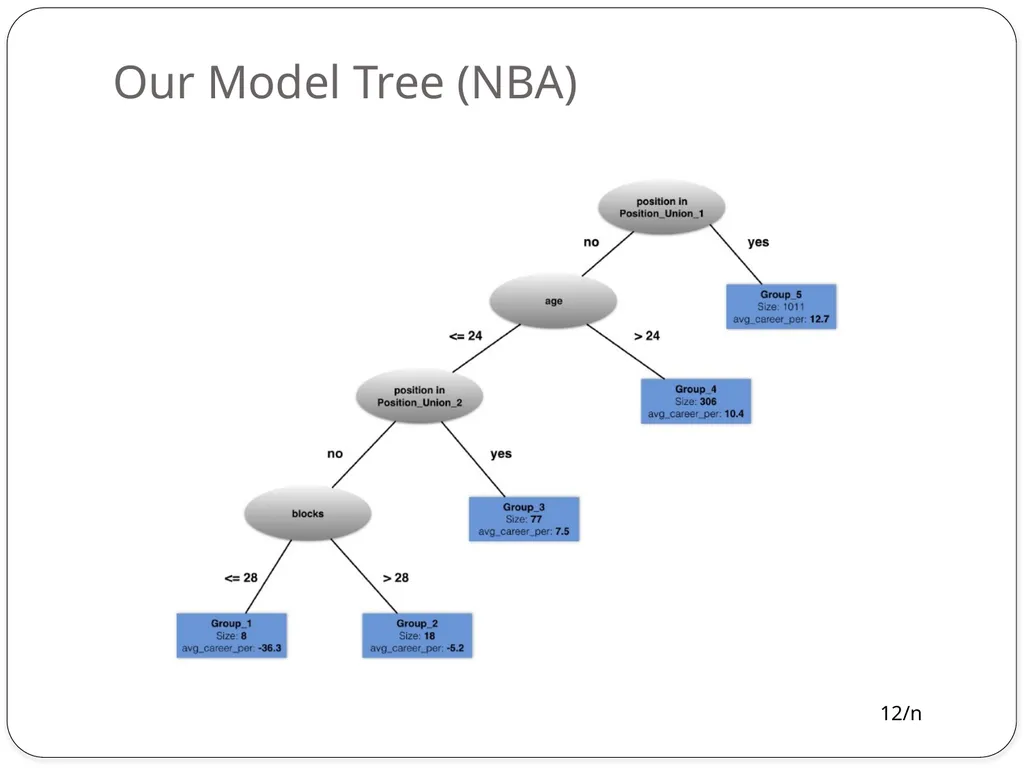
Our Model Tree (NBA) No zero-inflation problem in NBA draft, over 80% drafted players appear in NBA
Build a tree whose leaves contain a linear regression model.
Continuous Target Variable: Predict career PER of a drafted player
Process:
The tree assigns each player i to a unique leaf node Ii, with a linear regression model m(Ii).
Use m(Ii) to compute predicted career PER.
Rank players by predicted career PER<br>
11
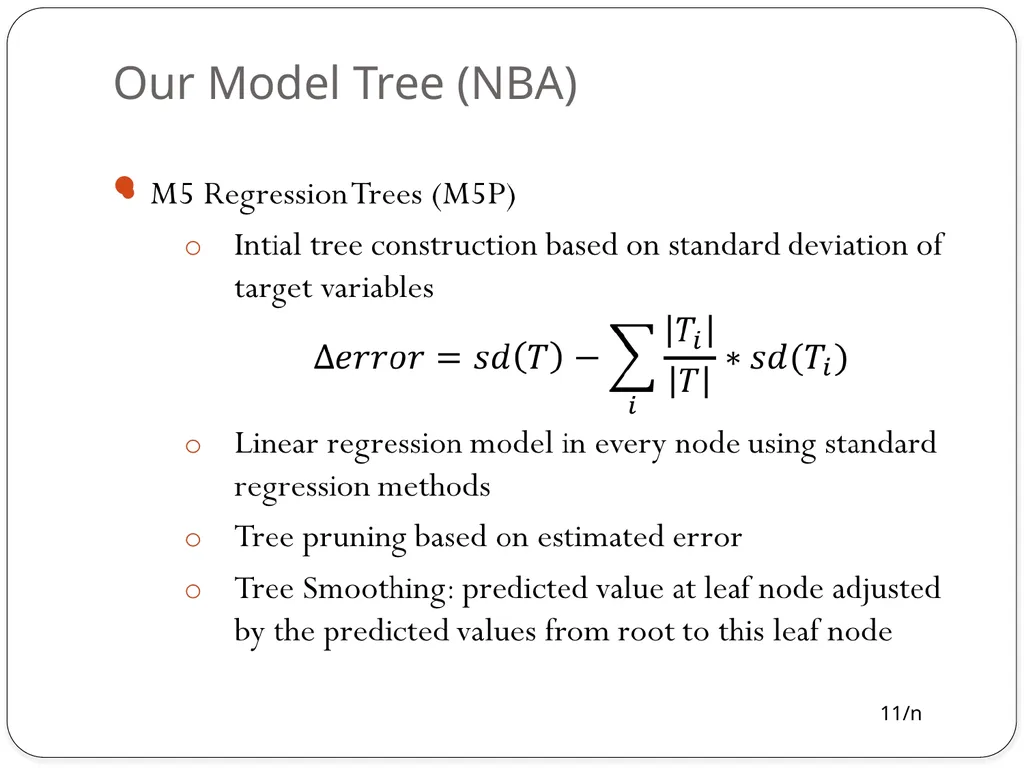
Our Model Tree (NBA)<br>
12
Our Model Tree (NBA)<br>
13
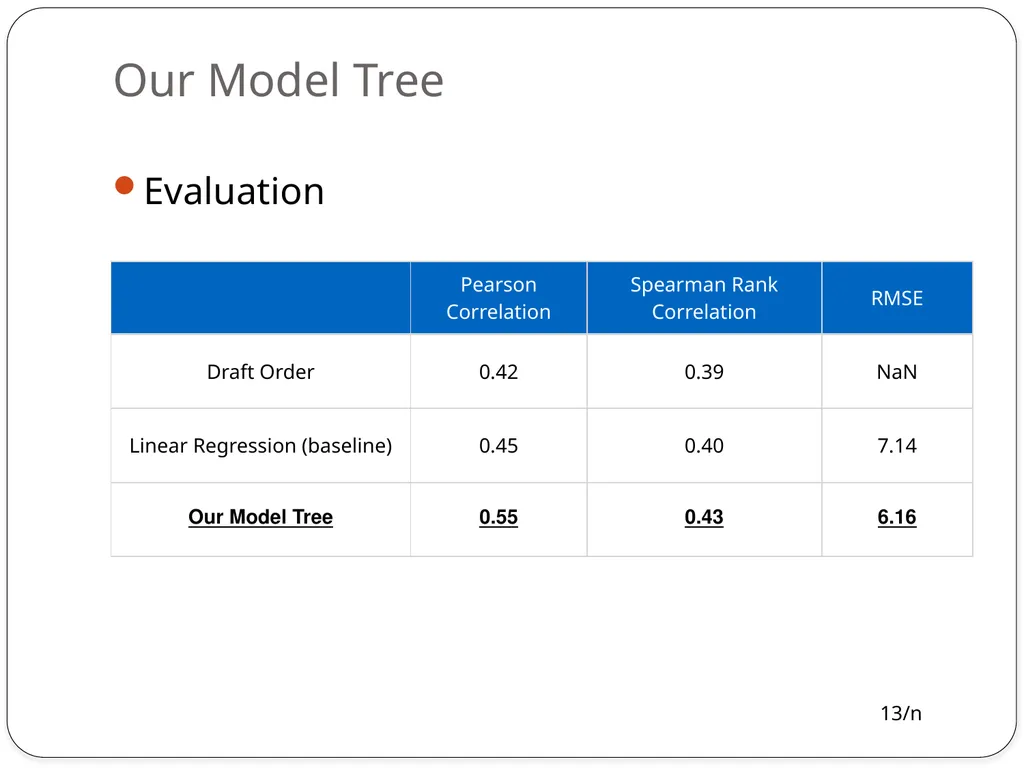
Our Model Tree Evaluation<br>
14
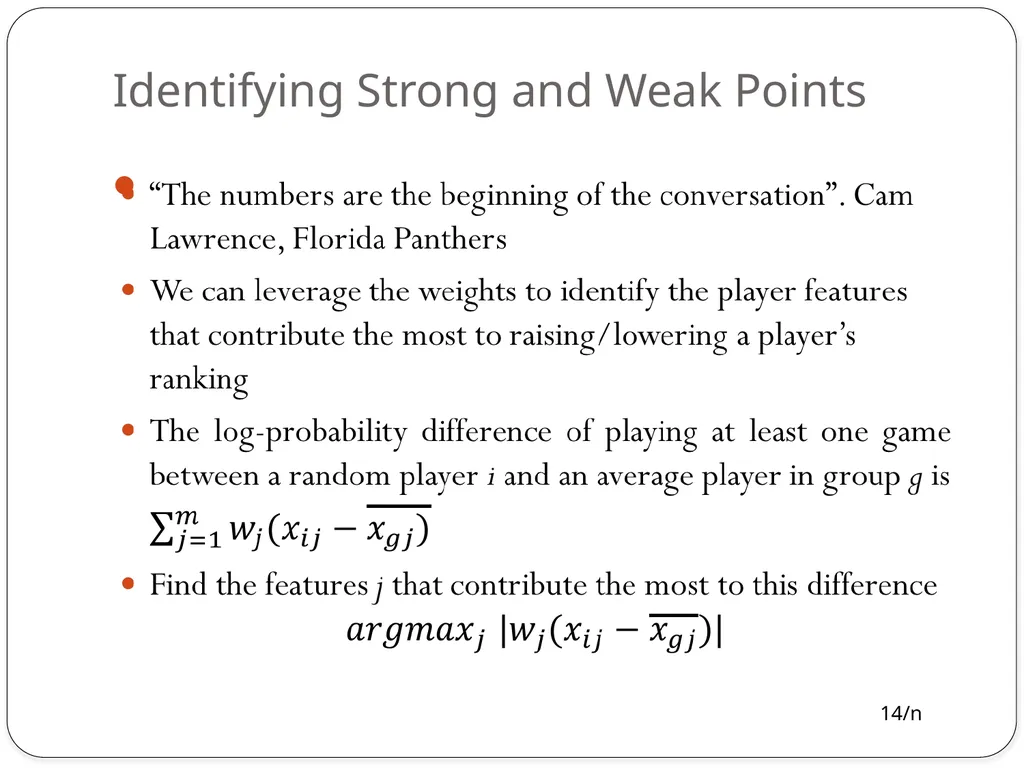
Identifying Strong and Weak Points<br>
15
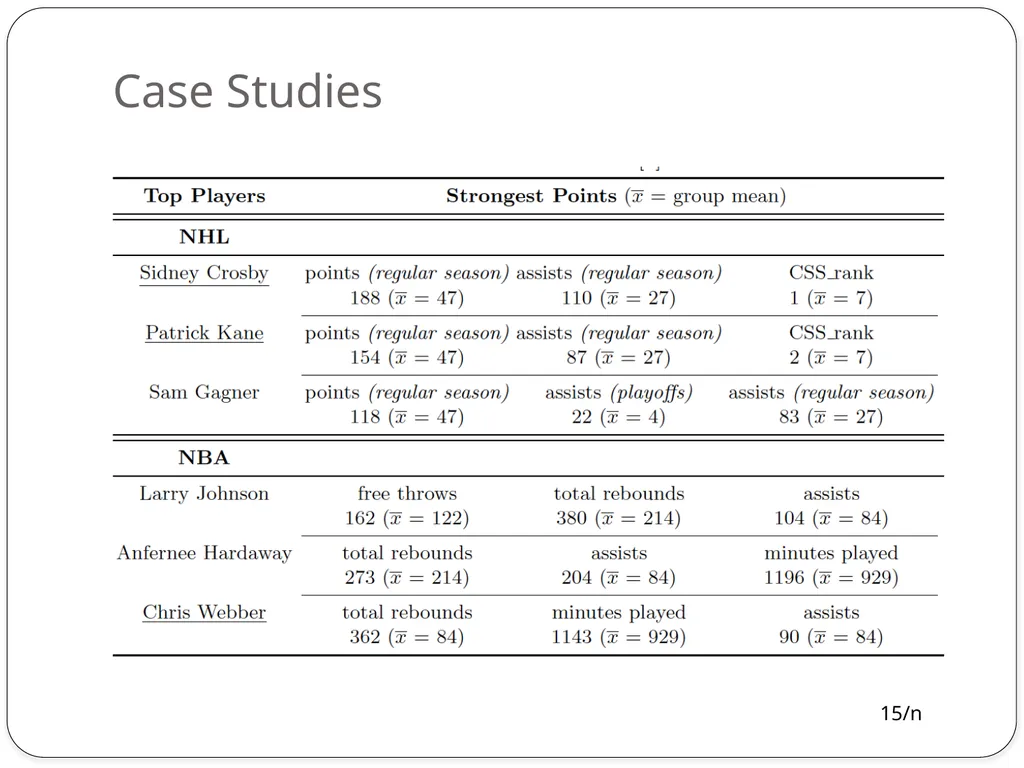
Case Studies<br>
16
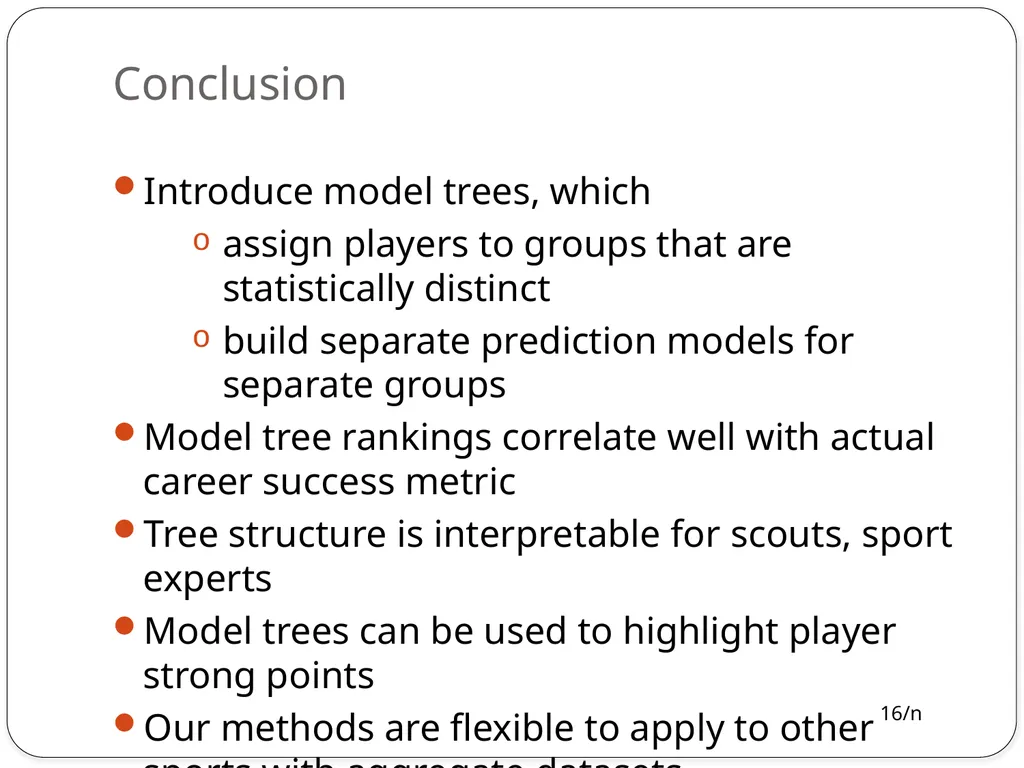
Conclusion Introduce model trees, which
assign players to groups that are statistically distinct
build separate prediction models for separate groups
Model tree rankings correlate well with actual career success metric
Tree structure is interpretable for scouts, sport experts
Model trees can be used to highlight player strong points
Our methods are flexible to apply to other sports with aggregate datasets<br>