
MODULE 4: Root cause analysis and Strategic Levels

Description: MODULE 4: Root cause analysis and Strategic Levels of Intervention What We Have Learned From Practice Outcomes of Module 4 Adults will have deepened understanding of root cause analysis and its applications in their school and district.
Related Topics
Download Presentation
"MODULE 4: Root cause analysis and Strategic Levels" is the property of its rightful owner. Permission is granted to download and print the materials on this website for personal, non-commercial use only, and to display it on your personal computer provided you do not modify the materials and that you retain all copyright notices contained in the materials. By downloading content from our website, you accept the terms of this agreement.
Presentation Transcript
slide1. MODULE 4: Root cause analysis
and Strategic Levels of Intervention What We Have Learned From Practice<br>
slide2. Outcomes of Module 4 Adults will have deepened understanding of “root cause analysis” and its applications in their school and district.
Adults will practice using strategic levels of intervention to:
Diagnose individual and group patterns regarding dropping out and staying “on track.”
Identify next steps for individual, group and whole school improvement.<br>
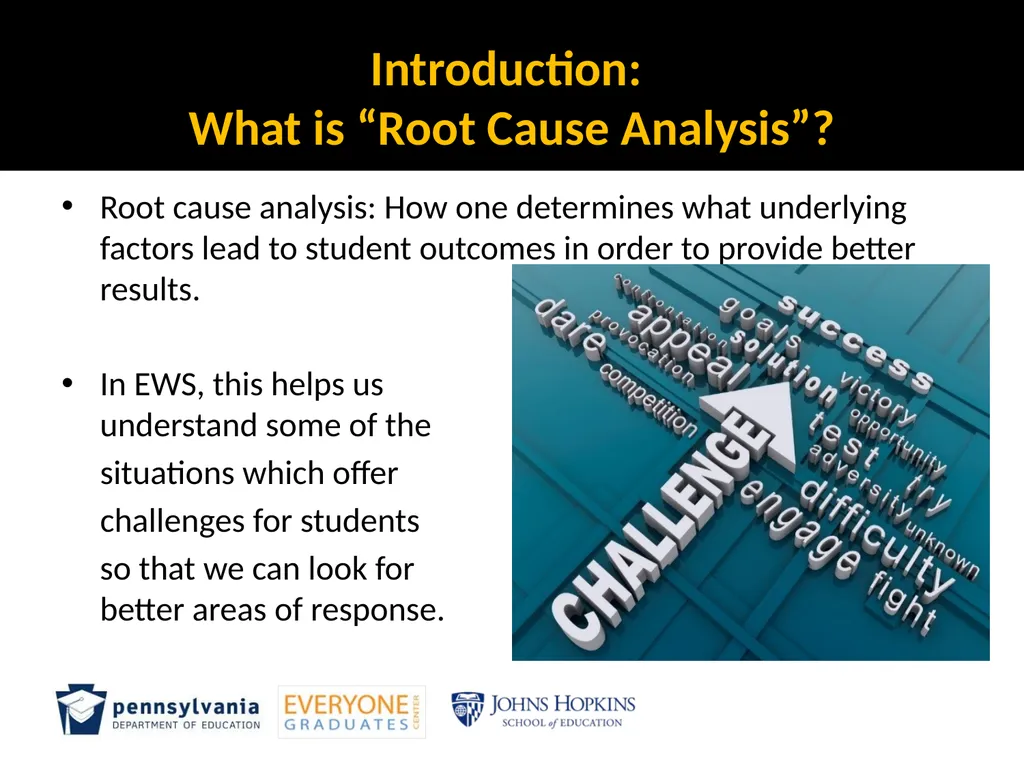
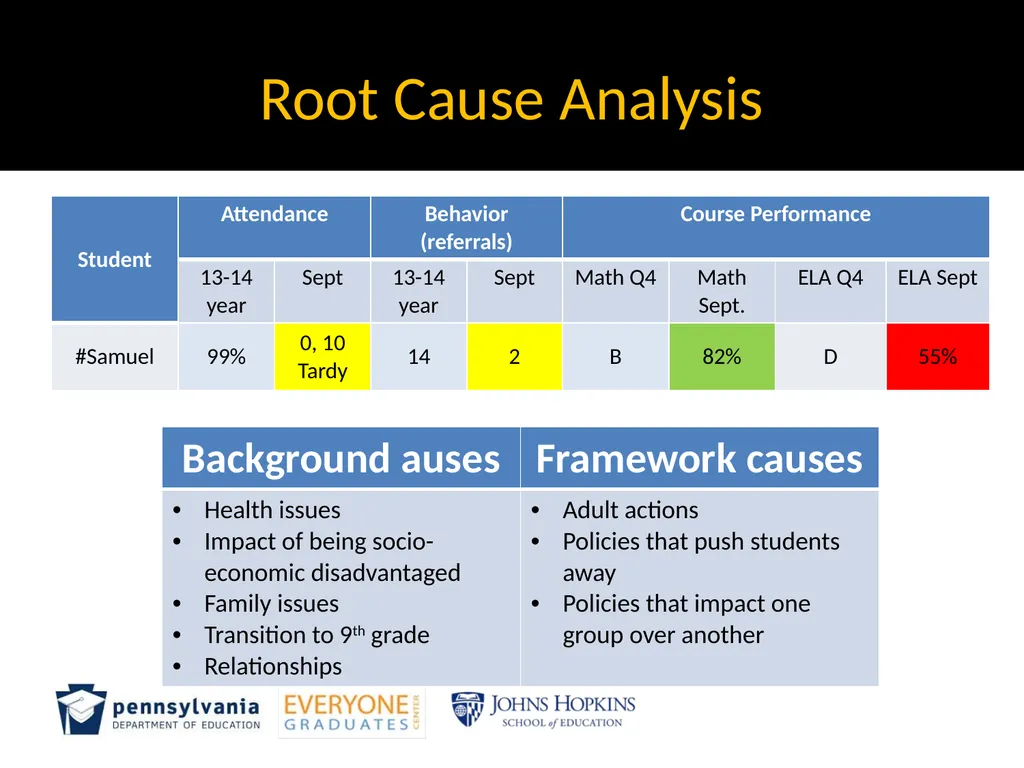
slide3. Introduction: What is “Root Cause Analysis”? Root cause analysis: How one determines what underlying factors lead to student outcomes in order to provide better results.
In EWS, this helps us understand some of the
situations which offer
challenges for students
so that we can look for better areas of response.<br>
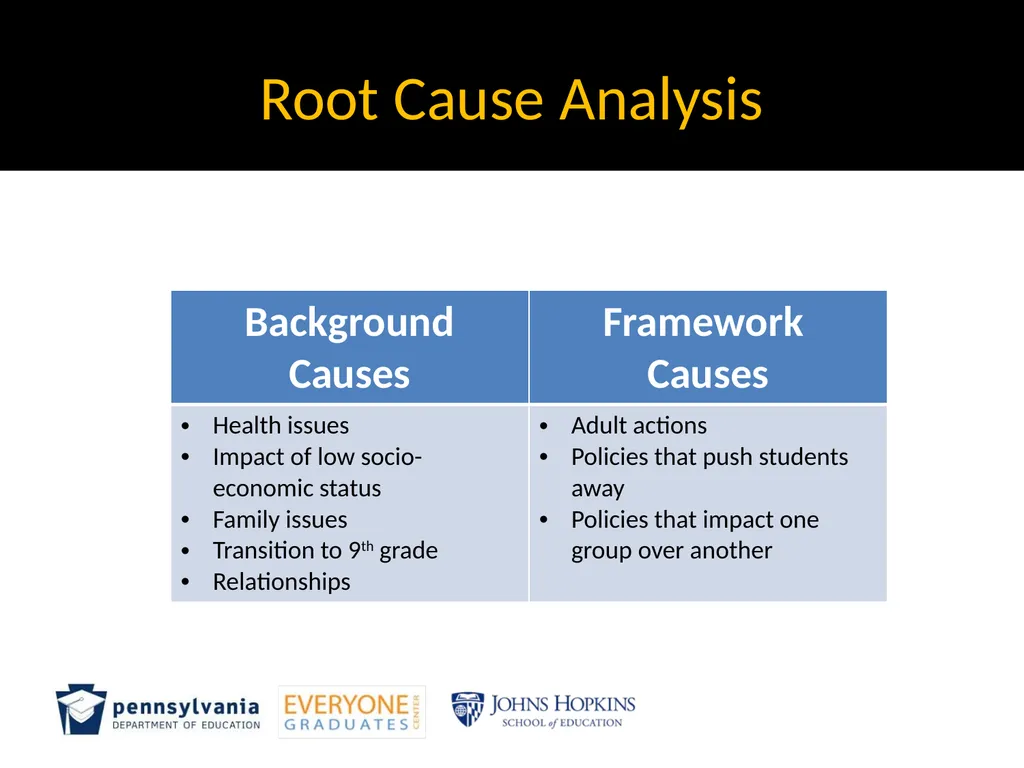
slide4. Root Cause Analysis<br>
slide5. Background: The impact of external factors<br>
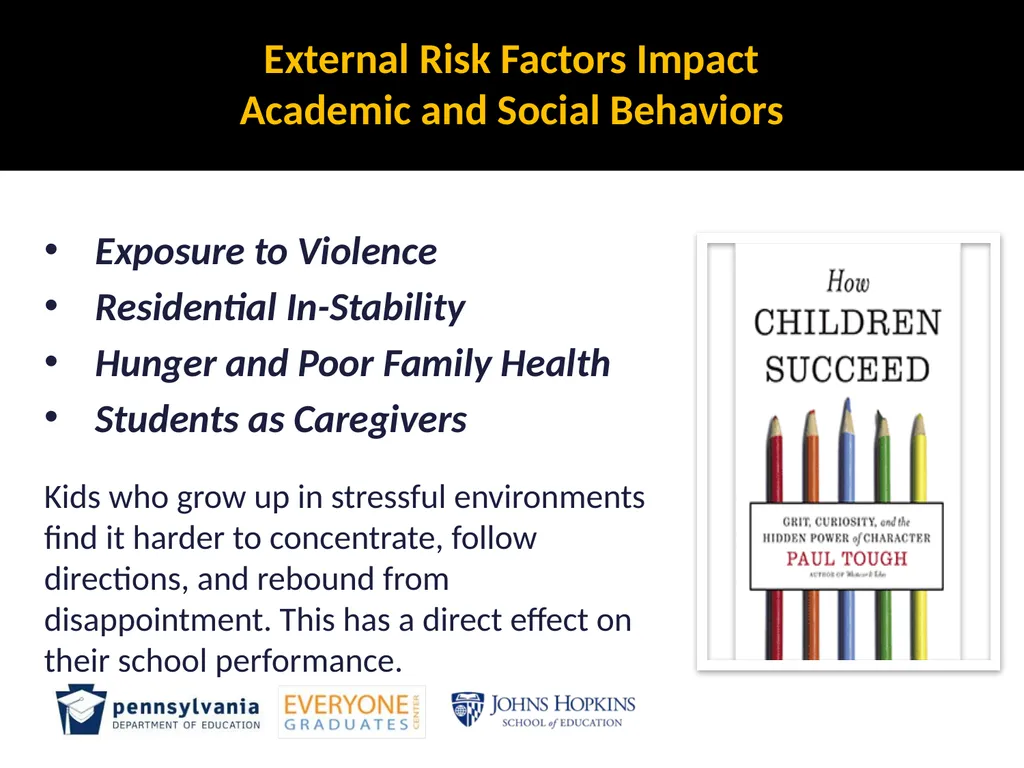
slide6. External Risk Factors Impact Academic and Social Behaviors Kids who grow up in stressful environments find it harder to concentrate, follow directions, and rebound from disappointment. This has a direct effect on their school performance. Exposure to Violence
Residential In-Stability
Hunger and Poor Family Health
Students as Caregivers<br>
slide7. Early Adolescence Brings its Own Set of Challenges For Students? Flight, fight and withdrawal
Some students stop attending school regularly. – Flight
Some students start acting out and being disruptive in class. – Fight
Some students just stop trying and start failing courses. – Withdrawal<br>
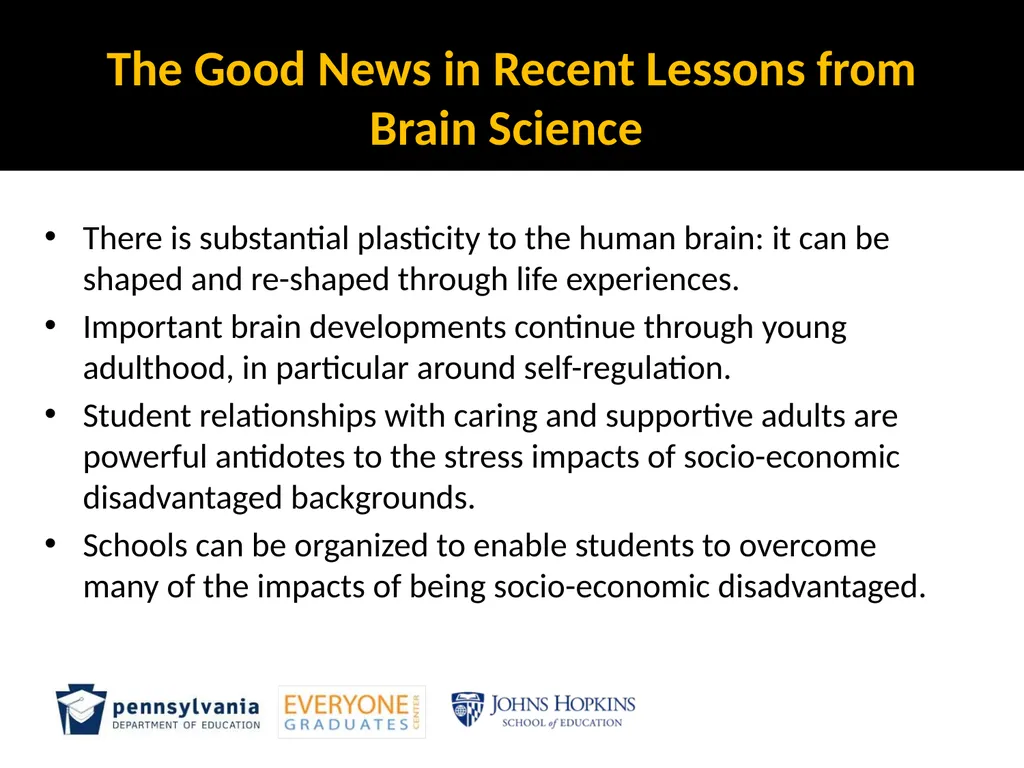
slide8. The Good News in Recent Lessons from Brain Science There is substantial plasticity to the human brain: it can be shaped and re-shaped through life experiences.
Important brain developments continue through young adulthood, in particular around self-regulation.
Student relationships with caring and supportive adults are powerful antidotes to the stress impacts of socio-economic disadvantaged backgrounds.
Schools can be organized to enable students to overcome many of the impacts of being socio-economic disadvantaged.<br>
slide9. Framework: The impact of Policies and structures<br>
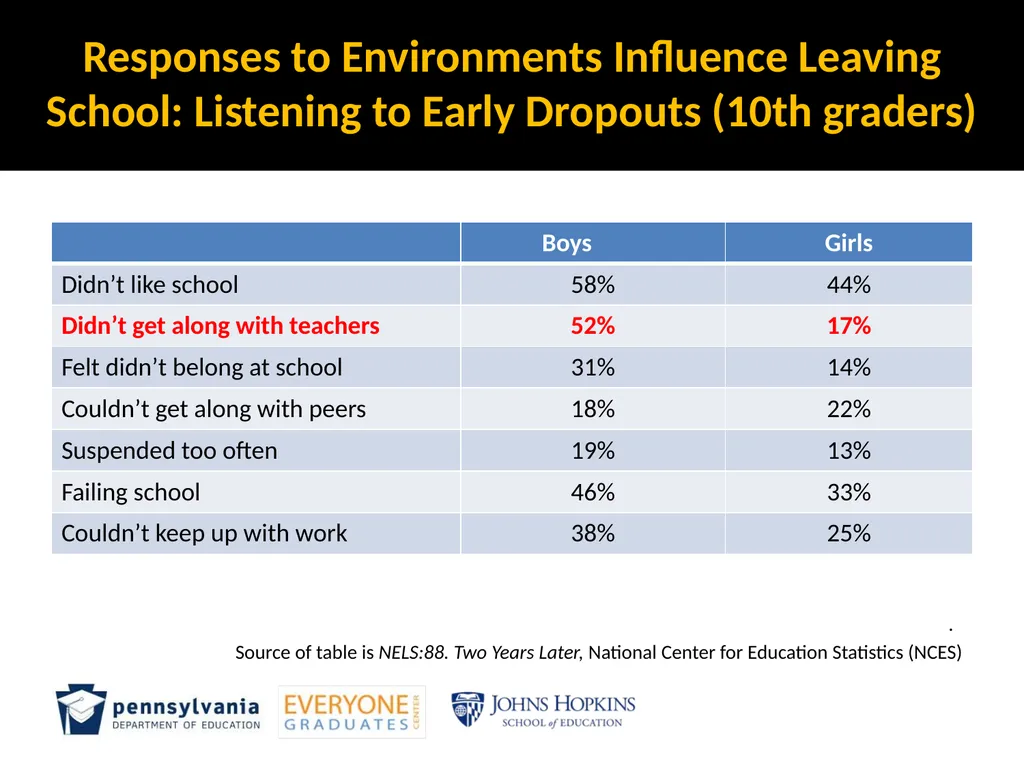
slide10. Responses to Environments Influence Leaving School: Listening to Early Dropouts (10th graders) .
Source of table is NELS:88. Two Years Later, National Center for Education Statistics (NCES)<br>
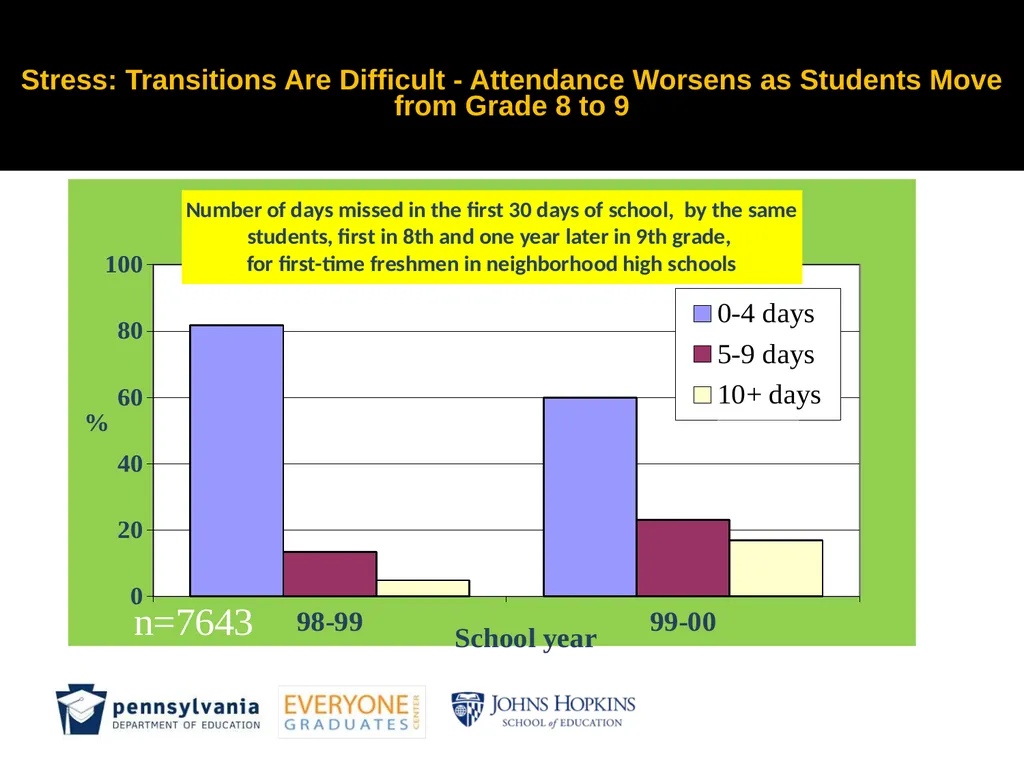
slide11. Stress: Transitions Are Difficult - Attendance Worsens as Students Move from Grade 8 to 9<br>
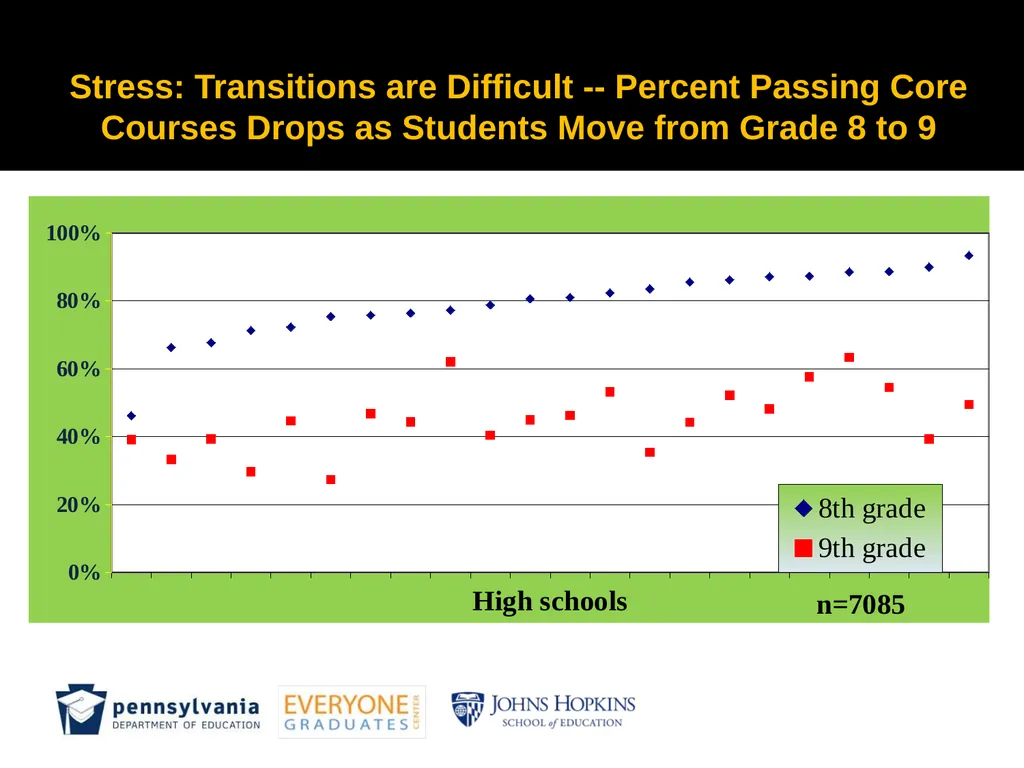
slide12. Stress: Transitions are Difficult -- Percent Passing Core Courses Drops as Students Move from Grade 8 to 9<br>
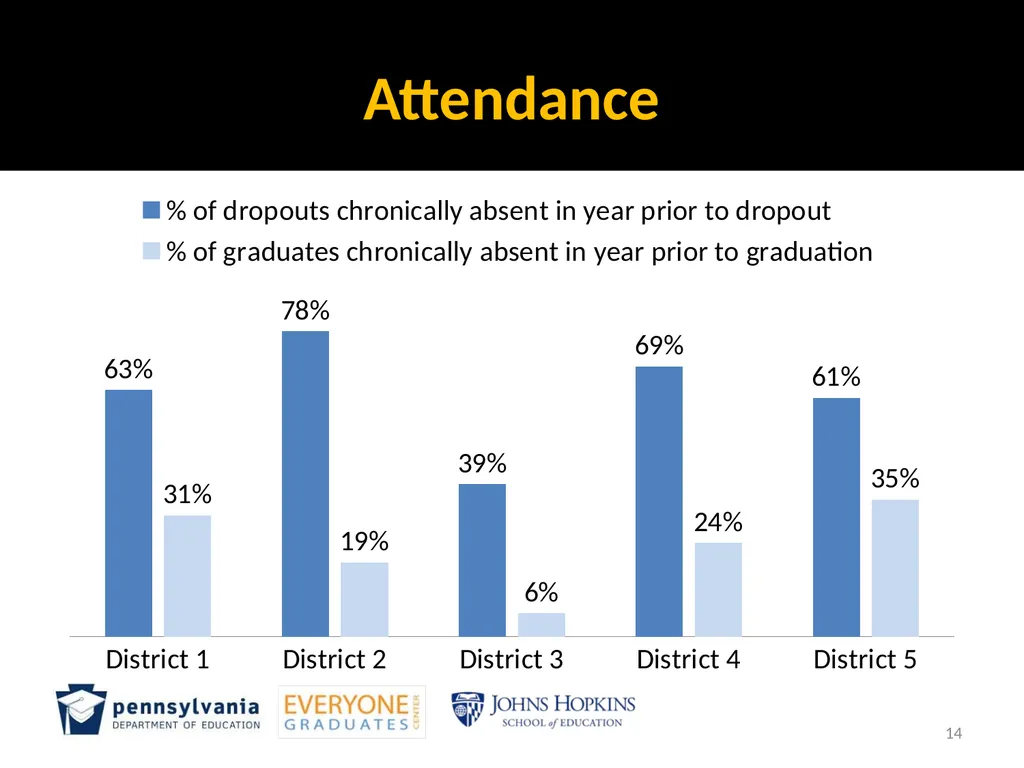
slide13. Same Patterns, Different Numbers The following three slides are included to illustrate the fact that while different districts often educate different sub-groups of students – or may educate similar students differently, or may have different policies and practices that influence how students are treated – there are similar patterns in outcomes although the absolute numbers and percentages vary.
Note the patterns for the different indicators.
Reflect on what you might see if you compared your district with others in the state. (This data is derived from a study of five Colorado districts).<br>
slide14. Attendance 14<br>
slide15. Achievement Differences There are over 50 million school children in America today, only 81 percent of whom on average, graduate from high school, with far fewer well-prepared for college.
There are vast differences in high school graduation rates among states – with state graduation rates ranging from 69 percent to 90 percent (2012-2013).
For African American students, Hispanic students, students with disabilities, and low-income students graduation rates are on average 10 to 20 percentage points lower than those for white and Asian students, and also surprisingly variable by state.
There are “achievement gaps” that are just as variable by state.<br>
slide16. Do Students Vary Much by State? The percent of students identified as in need of special services for students with disabilities ranges from 9 to nearly 18 percent by state. Do students really vary that much?
High school graduation rates, by state, for students with disabilities, range from the mid-20’s to the high 70’s. Do students really vary that much?<br>
slide17. Why Does Students’ Performance Vary So Much by State? The differences between subgroups vary greatly by state. In some states there is almost no difference, in others, there are up to 40 percentage point differences.
Is it that the students differ so much or that adult policies and practices vary?
Check out Building a Grad Nation: Annual Report 2014, and the soon to be published Building a Grad Nation: Annual Report 2015. Read the tables and reflect on the differences among students in different states.<br>
slide18. An Example -- Discipline Disparities In Georgia, males make up 2/3 of the population subject to OSS (out-of-school-suspension).
African-American students are three times as likely to receive OSS as others.
Students eligible for free- or reduced-price lunch are twice as likely to receive OSS, and special education students, 1.5 times as likely.
There are multiple discipline designations in Georgia through state code; multiple interpretations of policy and implementations in practice are possible at the local level.
Georgia is a “local control” state and teachers and administrators are strongly supported in local interpretations of state code.<br>
slide19. More About Discipline Disparities Georgia’s results are not unique.
The US Department of Education’s Office of Civil Rights reports that across the country, black students are disciplined at far higher rates than white or Asian students, especially for minor discipline infractions for which teachers and administrators have discretion. In some states the same is true for Hispanic students. Multiple state studies show this as well – Texas, Virginia and Florida, to name a few.<br>
slide20. Student Voice When students talk with adults who listen, individually, in focus groups, and through the media, when students write for others, and when they are surveyed, they share many startling observations about subjects as varied as instruction, school climate and adult interactions with students in school and out.
Check out the EGC/PDE website under resources for suggested reading and see the next slide.<br>
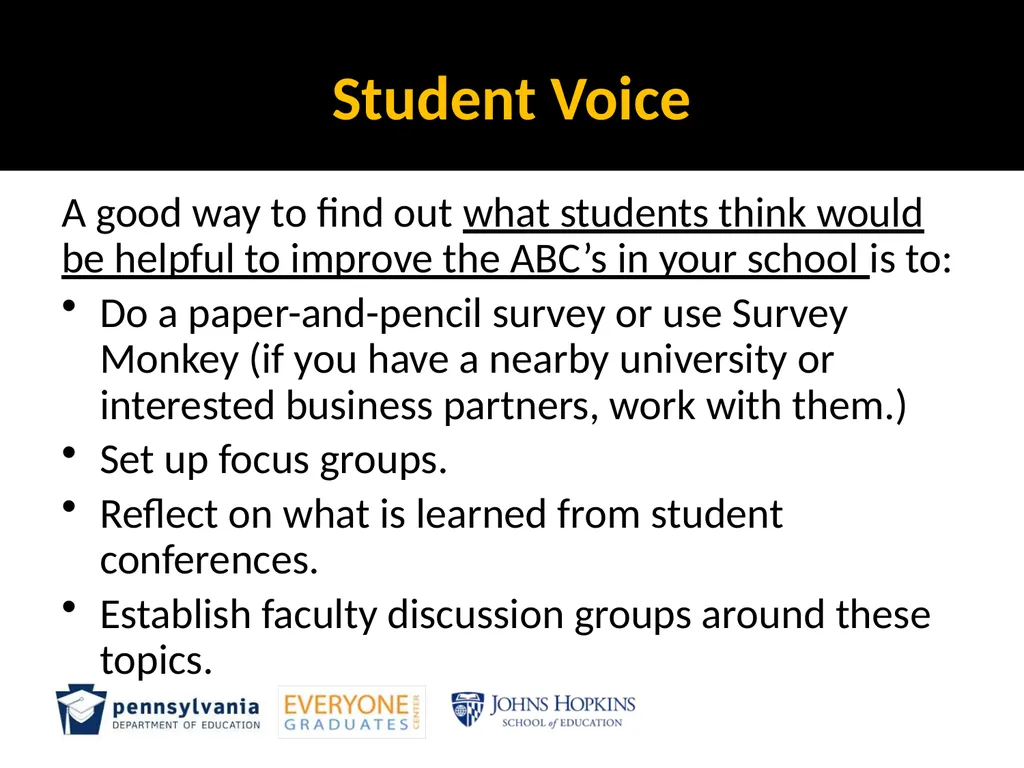
slide21. Student Voice A good way to find out what students think would be helpful to improve the ABC’s in your school is to:
Do a paper-and-pencil survey or use Survey Monkey (if you have a nearby university or interested business partners, work with them.)
Set up focus groups.
Reflect on what is learned from student conferences.
Establish faculty discussion groups around these topics.<br>
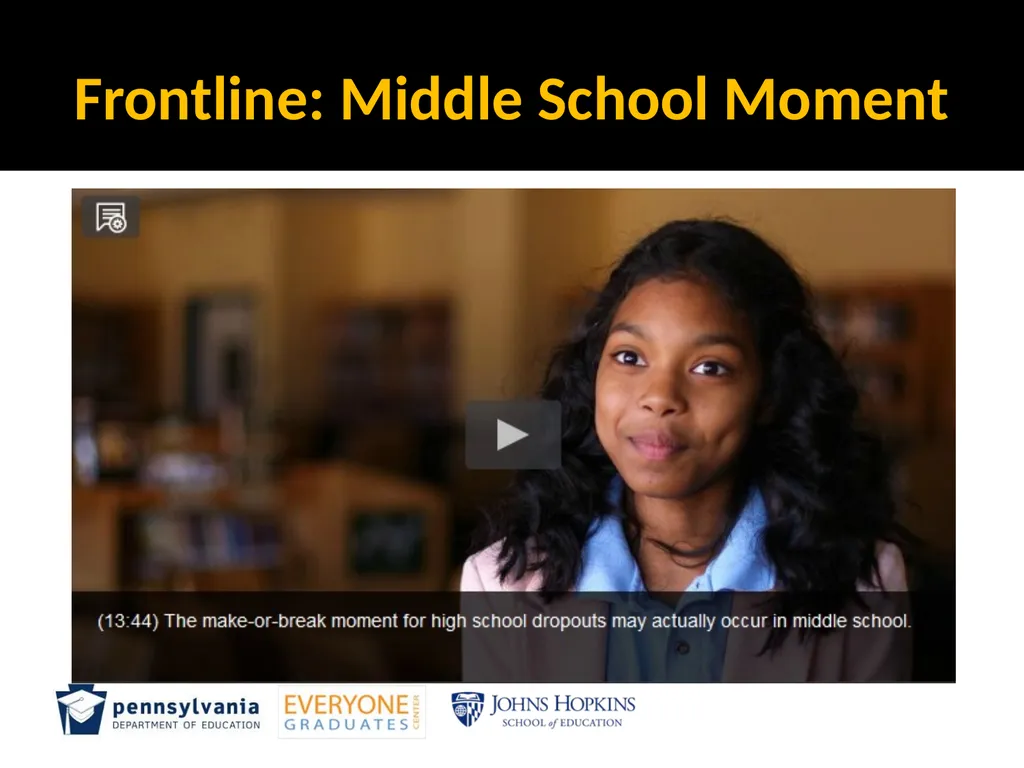
slide22. Student Voice In the video clip that follows, we hear directly from a middle school student interviewed by PBS “Frontline” regarding her experiences, needs, goals and dreams.
Watch it and discuss it with your colleagues.
Check out other PBS/CPB video clips on this and related subjects. Video clips can be used to inspire discussion among adults, but also with students, and parents.<br>
slide23. Frontline: Middle School Moment<br>
slide24. Root Cause Analysis<br>
slide25. Strategic levels of Intervention<br>
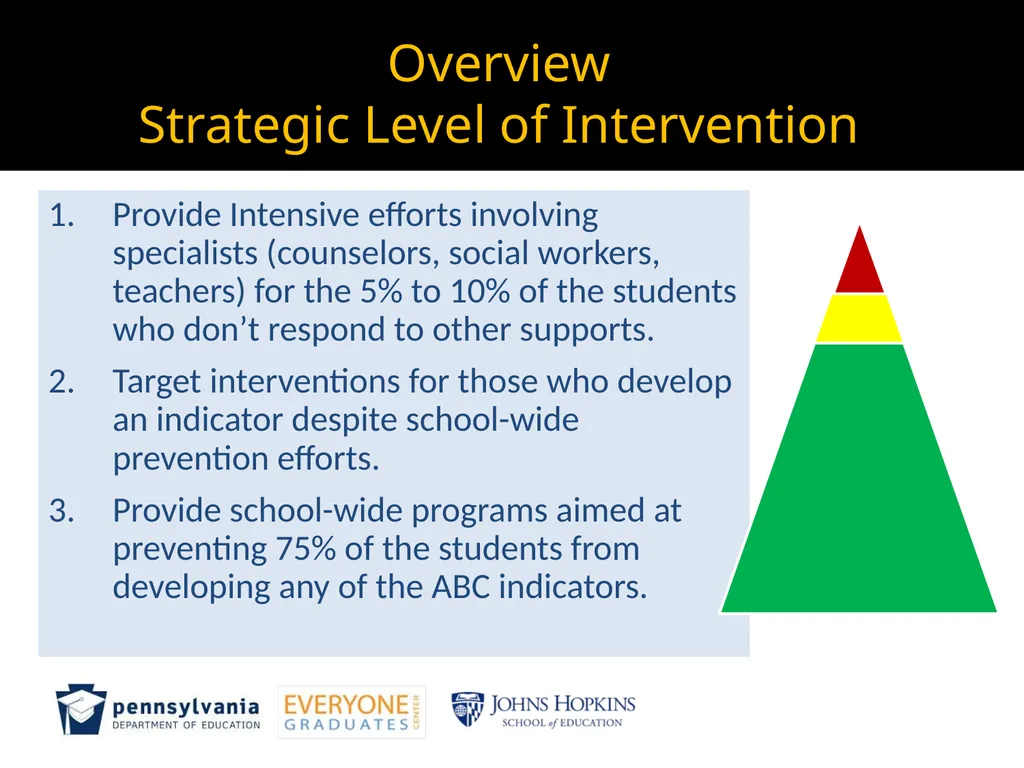
slide26. Overview Strategic Level of Intervention Provide Intensive efforts involving specialists (counselors, social workers, teachers) for the 5% to 10% of the students who don’t respond to other supports.
Target interventions for those who develop an indicator despite school-wide prevention efforts.
Provide school-wide programs aimed at preventing 75% of the students from developing any of the ABC indicators.<br>
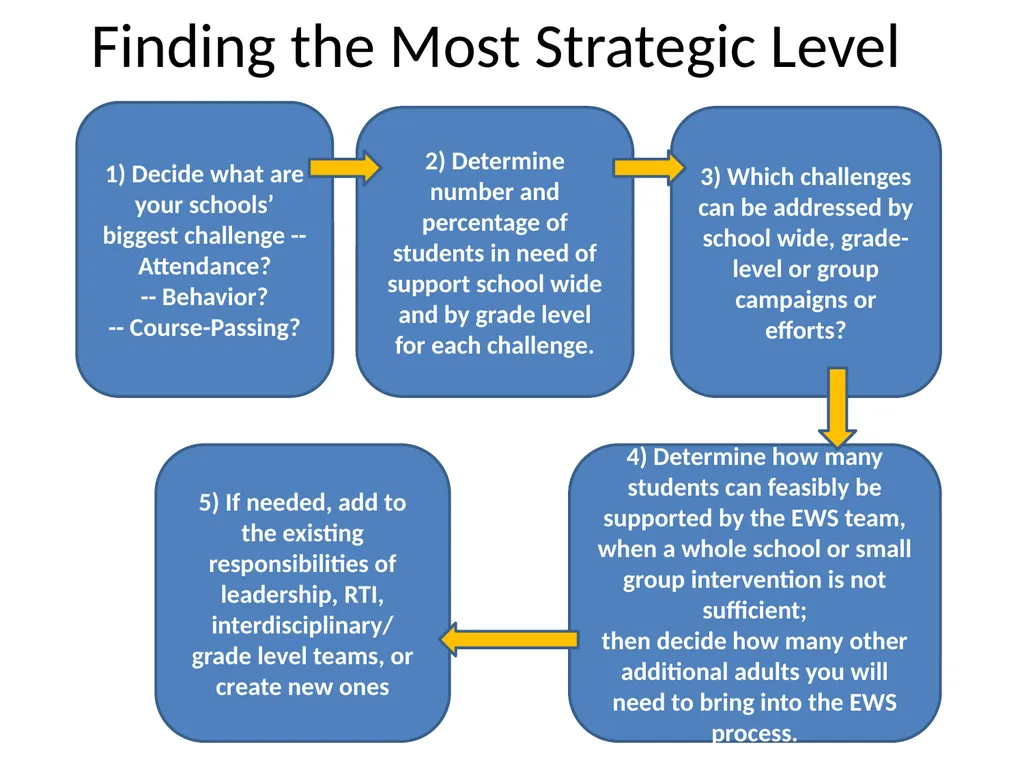
slide27. 2) Determine number and percentage of students in need of support school wide and by grade level for each challenge. 1) Decide what are your schools’ biggest challenge -- Attendance?
-- Behavior?
-- Course-Passing? 4) Determine how many students can feasibly be supported by the EWS team, when a whole school or small group intervention is not sufficient;
then decide how many other additional adults you will need to bring into the EWS process. 5) If needed, add to the existing responsibilities of leadership, RTI, interdisciplinary/ grade level teams, or create new ones 3) Which challenges can be addressed by school wide, grade-level or group campaigns or efforts? Finding the Most Strategic Level<br>
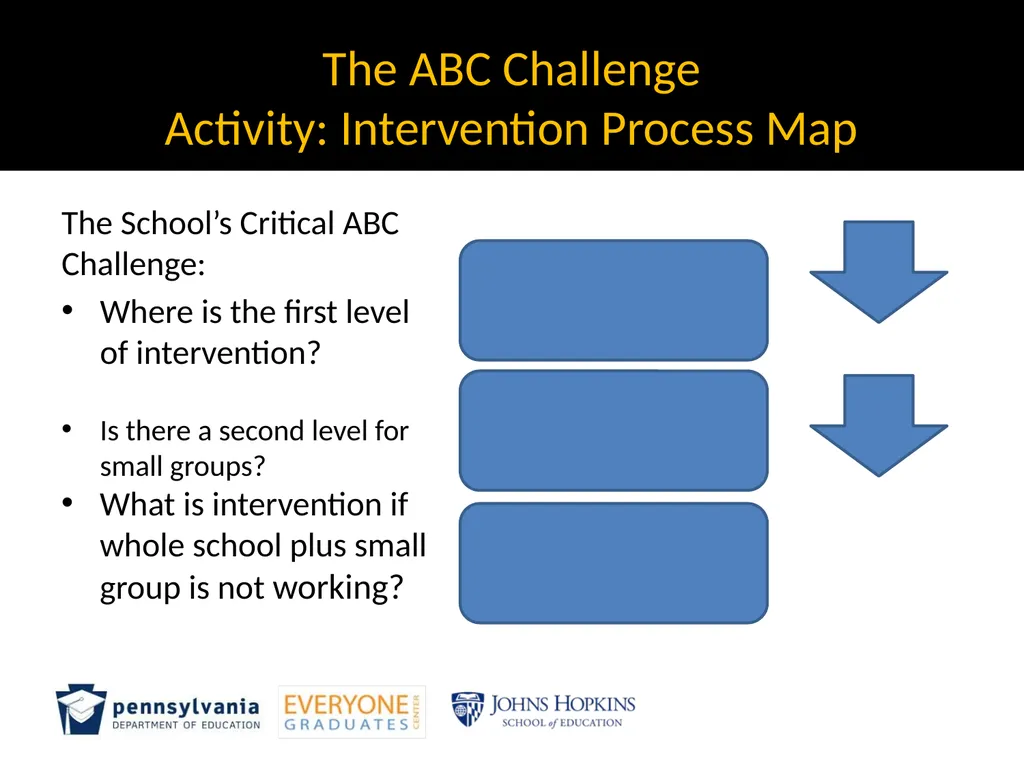
slide28. The ABC Challenge Activity: Intervention Process Map Is there a second level for small groups? The School’s Critical ABC Challenge:
Where is the first level of intervention? What is intervention if whole school plus small group is not working?<br>
slide29. Solving ABC Challenges at Most Strategic Level Why are some courses failed more often than others?
Look for underlying causes that could be addressed across students.
PE may be the cause of many students’ failure because they don’t like to dress out, the gym is far from their other class locations, or they perceive that bullying takes place.
Math may be failed by many because they don’t have the pre-requisite background.
A particular teacher may have unreasonable expectations, not know how to manage a classroom, fail to give enough grades or fail to report grades in a timely fashion.<br>
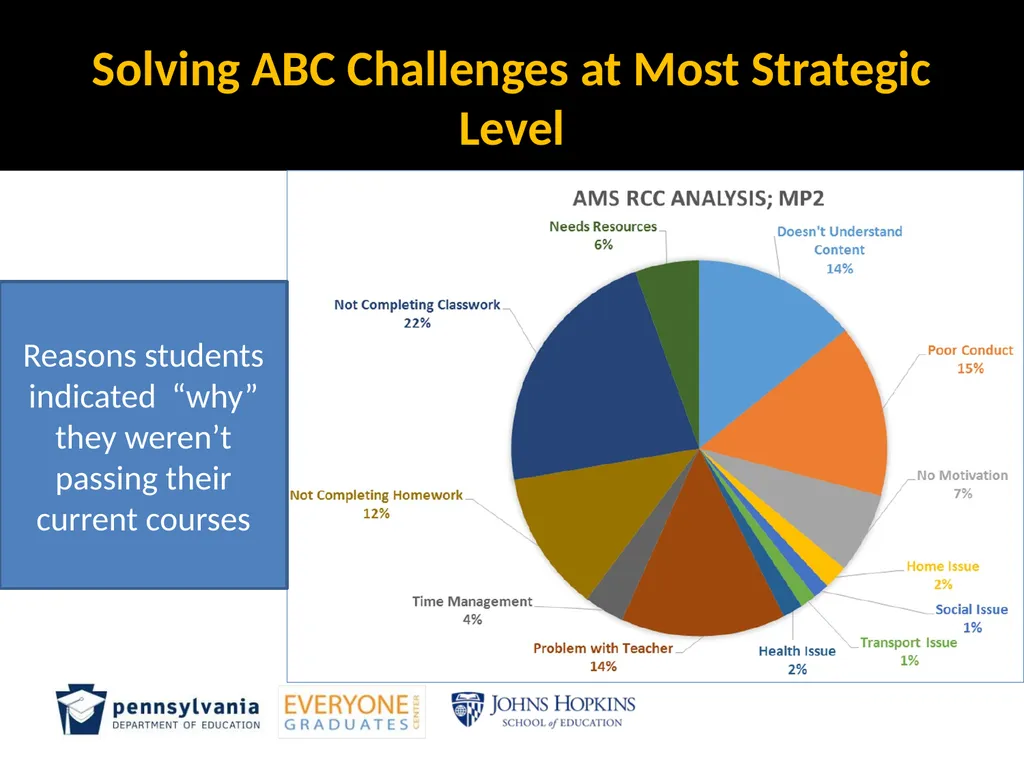
slide30. Solving ABC Challenges at Most Strategic Level Reasons students indicated “why” they weren’t passing their current courses<br>
slide31. Finding the Most Strategic Level of Intervention Attendance examples:
Strong attendance at the beginning of the semester and then starts dropping.
About 30 students have really serious attendance problems.
Potential Responses:
An overall school attendance plan
A school-wide or grade-level attendance campaign is initiated.
Incentives for the “most improved” are awarded and publicized.<br>
slide32. Most Strategic Interventions: Whole School Research shows that development of executive function, self- and time-management skills are critical elements for 6th to 9th graders undergoing the transition from childhood to young adulthood and many times are lacking for students.<br>
slide33. Teaching Student Skills at Whole School or Grade Wide Levels Existing or new setting for teaching these skills:
Advisory or dedicated course
Skills taught as a part of each content’s lesson plan
Initiatives:
Grade level assemblies for review
Recognition events for students
School-wide expectations for each area of the skills<br>
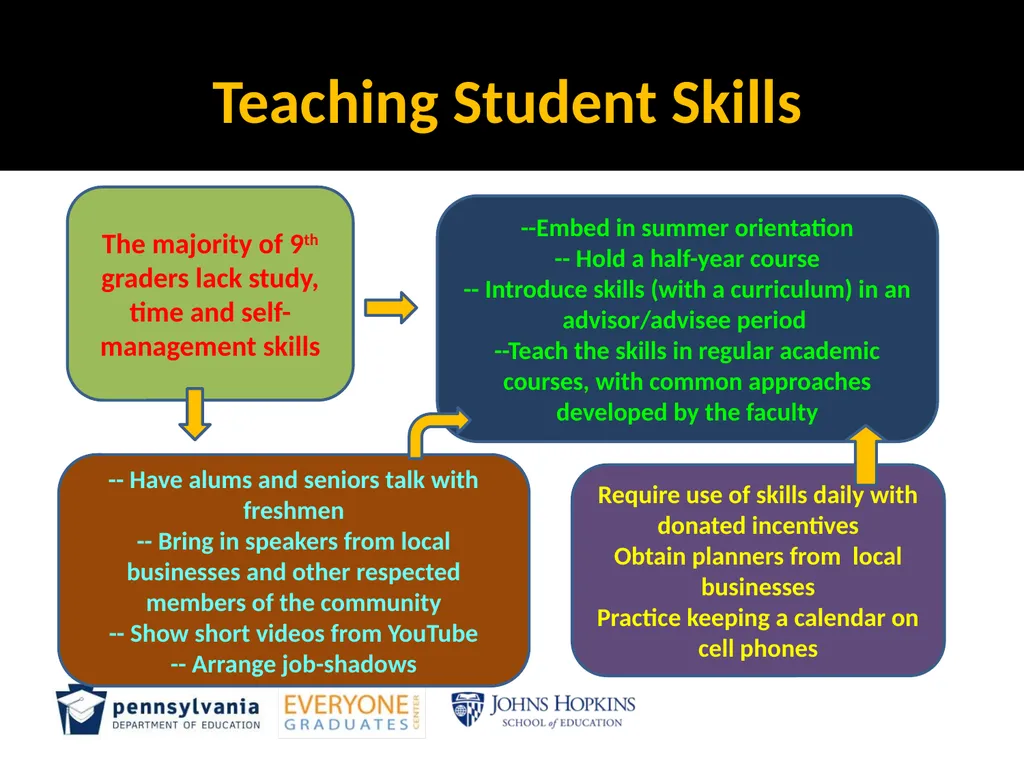
slide34. Teaching Student Skills The majority of 9th graders lack study, time and self-management skills --Embed in summer orientation
-- Hold a half-year course
-- Introduce skills (with a curriculum) in an advisor/advisee period
--Teach the skills in regular academic courses, with common approaches developed by the faculty -- Have alums and seniors talk with freshmen
-- Bring in speakers from local businesses and other respected members of the community
-- Show short videos from YouTube
-- Arrange job-shadows Require use of skills daily with donated incentives
Obtain planners from local businesses
Practice keeping a calendar on cell phones<br>
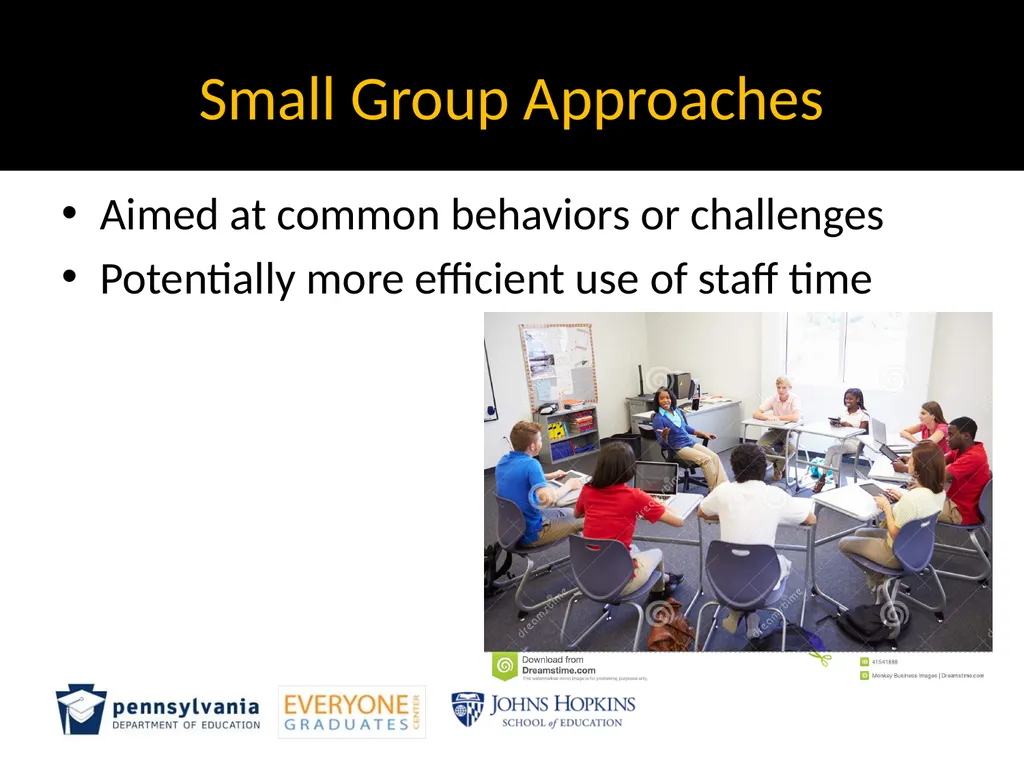
slide35. Small Group Approaches Aimed at common behaviors or challenges
Potentially more efficient use of staff time<br>
slide36. Small Group Approaches for Behavior Are there students in your school who share very specific behavioral challenges (about-to-be or young mothers, foster and homeless children, children with anger management problems)?
Is there someone on staff who has the expertise and time to convene a weekly small group meeting for these students, or could external community assistance be utilized?<br>
slide37. Activity: Solving a Scenario Working individually, with a colleague or with your team, consider the scenarios.
Pick a scenario (one is of an individual student, one is of an emerging group pattern, one is of a school-wide challenge, and one is of a district-wide challenge).
What is going on?
What resources can be brought to bear to solve this challenge? Who can help?<br>
slide2. Outcomes of Module 4 Adults will have deepened understanding of “root cause analysis” and its applications in their school and district.
Adults will practice using strategic levels of intervention to:
Diagnose individual and group patterns regarding dropping out and staying “on track.”
Identify next steps for individual, group and whole school improvement.<br>
slide3. Introduction: What is “Root Cause Analysis”? Root cause analysis: How one determines what underlying factors lead to student outcomes in order to provide better results.
In EWS, this helps us understand some of the
situations which offer
challenges for students
so that we can look for better areas of response.<br>
slide4. Root Cause Analysis<br>
slide5. Background: The impact of external factors<br>
slide6. External Risk Factors Impact Academic and Social Behaviors Kids who grow up in stressful environments find it harder to concentrate, follow directions, and rebound from disappointment. This has a direct effect on their school performance. Exposure to Violence
Residential In-Stability
Hunger and Poor Family Health
Students as Caregivers<br>
slide7. Early Adolescence Brings its Own Set of Challenges For Students? Flight, fight and withdrawal
Some students stop attending school regularly. – Flight
Some students start acting out and being disruptive in class. – Fight
Some students just stop trying and start failing courses. – Withdrawal<br>
slide8. The Good News in Recent Lessons from Brain Science There is substantial plasticity to the human brain: it can be shaped and re-shaped through life experiences.
Important brain developments continue through young adulthood, in particular around self-regulation.
Student relationships with caring and supportive adults are powerful antidotes to the stress impacts of socio-economic disadvantaged backgrounds.
Schools can be organized to enable students to overcome many of the impacts of being socio-economic disadvantaged.<br>
slide9. Framework: The impact of Policies and structures<br>
slide10. Responses to Environments Influence Leaving School: Listening to Early Dropouts (10th graders) .
Source of table is NELS:88. Two Years Later, National Center for Education Statistics (NCES)<br>
slide11. Stress: Transitions Are Difficult - Attendance Worsens as Students Move from Grade 8 to 9<br>
slide12. Stress: Transitions are Difficult -- Percent Passing Core Courses Drops as Students Move from Grade 8 to 9<br>
slide13. Same Patterns, Different Numbers The following three slides are included to illustrate the fact that while different districts often educate different sub-groups of students – or may educate similar students differently, or may have different policies and practices that influence how students are treated – there are similar patterns in outcomes although the absolute numbers and percentages vary.
Note the patterns for the different indicators.
Reflect on what you might see if you compared your district with others in the state. (This data is derived from a study of five Colorado districts).<br>
slide14. Attendance 14<br>
slide15. Achievement Differences There are over 50 million school children in America today, only 81 percent of whom on average, graduate from high school, with far fewer well-prepared for college.
There are vast differences in high school graduation rates among states – with state graduation rates ranging from 69 percent to 90 percent (2012-2013).
For African American students, Hispanic students, students with disabilities, and low-income students graduation rates are on average 10 to 20 percentage points lower than those for white and Asian students, and also surprisingly variable by state.
There are “achievement gaps” that are just as variable by state.<br>
slide16. Do Students Vary Much by State? The percent of students identified as in need of special services for students with disabilities ranges from 9 to nearly 18 percent by state. Do students really vary that much?
High school graduation rates, by state, for students with disabilities, range from the mid-20’s to the high 70’s. Do students really vary that much?<br>
slide17. Why Does Students’ Performance Vary So Much by State? The differences between subgroups vary greatly by state. In some states there is almost no difference, in others, there are up to 40 percentage point differences.
Is it that the students differ so much or that adult policies and practices vary?
Check out Building a Grad Nation: Annual Report 2014, and the soon to be published Building a Grad Nation: Annual Report 2015. Read the tables and reflect on the differences among students in different states.<br>
slide18. An Example -- Discipline Disparities In Georgia, males make up 2/3 of the population subject to OSS (out-of-school-suspension).
African-American students are three times as likely to receive OSS as others.
Students eligible for free- or reduced-price lunch are twice as likely to receive OSS, and special education students, 1.5 times as likely.
There are multiple discipline designations in Georgia through state code; multiple interpretations of policy and implementations in practice are possible at the local level.
Georgia is a “local control” state and teachers and administrators are strongly supported in local interpretations of state code.<br>
slide19. More About Discipline Disparities Georgia’s results are not unique.
The US Department of Education’s Office of Civil Rights reports that across the country, black students are disciplined at far higher rates than white or Asian students, especially for minor discipline infractions for which teachers and administrators have discretion. In some states the same is true for Hispanic students. Multiple state studies show this as well – Texas, Virginia and Florida, to name a few.<br>
slide20. Student Voice When students talk with adults who listen, individually, in focus groups, and through the media, when students write for others, and when they are surveyed, they share many startling observations about subjects as varied as instruction, school climate and adult interactions with students in school and out.
Check out the EGC/PDE website under resources for suggested reading and see the next slide.<br>
slide21. Student Voice A good way to find out what students think would be helpful to improve the ABC’s in your school is to:
Do a paper-and-pencil survey or use Survey Monkey (if you have a nearby university or interested business partners, work with them.)
Set up focus groups.
Reflect on what is learned from student conferences.
Establish faculty discussion groups around these topics.<br>
slide22. Student Voice In the video clip that follows, we hear directly from a middle school student interviewed by PBS “Frontline” regarding her experiences, needs, goals and dreams.
Watch it and discuss it with your colleagues.
Check out other PBS/CPB video clips on this and related subjects. Video clips can be used to inspire discussion among adults, but also with students, and parents.<br>
slide23. Frontline: Middle School Moment<br>
slide24. Root Cause Analysis<br>
slide25. Strategic levels of Intervention<br>
slide26. Overview Strategic Level of Intervention Provide Intensive efforts involving specialists (counselors, social workers, teachers) for the 5% to 10% of the students who don’t respond to other supports.
Target interventions for those who develop an indicator despite school-wide prevention efforts.
Provide school-wide programs aimed at preventing 75% of the students from developing any of the ABC indicators.<br>
slide27. 2) Determine number and percentage of students in need of support school wide and by grade level for each challenge. 1) Decide what are your schools’ biggest challenge -- Attendance?
-- Behavior?
-- Course-Passing? 4) Determine how many students can feasibly be supported by the EWS team, when a whole school or small group intervention is not sufficient;
then decide how many other additional adults you will need to bring into the EWS process. 5) If needed, add to the existing responsibilities of leadership, RTI, interdisciplinary/ grade level teams, or create new ones 3) Which challenges can be addressed by school wide, grade-level or group campaigns or efforts? Finding the Most Strategic Level<br>
slide28. The ABC Challenge Activity: Intervention Process Map Is there a second level for small groups? The School’s Critical ABC Challenge:
Where is the first level of intervention? What is intervention if whole school plus small group is not working?<br>
slide29. Solving ABC Challenges at Most Strategic Level Why are some courses failed more often than others?
Look for underlying causes that could be addressed across students.
PE may be the cause of many students’ failure because they don’t like to dress out, the gym is far from their other class locations, or they perceive that bullying takes place.
Math may be failed by many because they don’t have the pre-requisite background.
A particular teacher may have unreasonable expectations, not know how to manage a classroom, fail to give enough grades or fail to report grades in a timely fashion.<br>
slide30. Solving ABC Challenges at Most Strategic Level Reasons students indicated “why” they weren’t passing their current courses<br>
slide31. Finding the Most Strategic Level of Intervention Attendance examples:
Strong attendance at the beginning of the semester and then starts dropping.
About 30 students have really serious attendance problems.
Potential Responses:
An overall school attendance plan
A school-wide or grade-level attendance campaign is initiated.
Incentives for the “most improved” are awarded and publicized.<br>
slide32. Most Strategic Interventions: Whole School Research shows that development of executive function, self- and time-management skills are critical elements for 6th to 9th graders undergoing the transition from childhood to young adulthood and many times are lacking for students.<br>
slide33. Teaching Student Skills at Whole School or Grade Wide Levels Existing or new setting for teaching these skills:
Advisory or dedicated course
Skills taught as a part of each content’s lesson plan
Initiatives:
Grade level assemblies for review
Recognition events for students
School-wide expectations for each area of the skills<br>
slide34. Teaching Student Skills The majority of 9th graders lack study, time and self-management skills --Embed in summer orientation
-- Hold a half-year course
-- Introduce skills (with a curriculum) in an advisor/advisee period
--Teach the skills in regular academic courses, with common approaches developed by the faculty -- Have alums and seniors talk with freshmen
-- Bring in speakers from local businesses and other respected members of the community
-- Show short videos from YouTube
-- Arrange job-shadows Require use of skills daily with donated incentives
Obtain planners from local businesses
Practice keeping a calendar on cell phones<br>
slide35. Small Group Approaches Aimed at common behaviors or challenges
Potentially more efficient use of staff time<br>
slide36. Small Group Approaches for Behavior Are there students in your school who share very specific behavioral challenges (about-to-be or young mothers, foster and homeless children, children with anger management problems)?
Is there someone on staff who has the expertise and time to convene a weekly small group meeting for these students, or could external community assistance be utilized?<br>
slide37. Activity: Solving a Scenario Working individually, with a colleague or with your team, consider the scenarios.
Pick a scenario (one is of an individual student, one is of an emerging group pattern, one is of a school-wide challenge, and one is of a district-wide challenge).
What is going on?
What resources can be brought to bear to solve this challenge? Who can help?<br>