
Monitoring and evaluation framework, clinical
YM
Published · 40 slides · 0 views
1 / 1

Description
Monitoring and evaluation framework, clinical governance and key health indicators in planning Abongile Tanga Bhekithemba Mazibuko Nothando Magwaza PRESENTATION OUTLINE Monitoring and evaluation Definitions Types of monitoring and
Related Topics
Share
Embed code
Download this presentation From Below
"Monitoring and evaluation framework, clinical" is the property of its rightful owner. Permission is granted to download and print the materials on this website for personal, non-commercial use only, and to display it on your personal computer provided you do not modify the materials and that you retain all copyright notices contained in the materials. By downloading content from our website, you accept the terms of this agreement.
Presentation Transcript
01
Monitoring and evaluation framework, clinical governance and key health indicators in planning Abongile Tanga
Bhekithemba Mazibuko
Nothando Magwaza<br>
Bhekithemba Mazibuko
Nothando Magwaza<br>
02
PRESENTATION OUTLINE Monitoring and evaluation
Definitions
Types of monitoring and evaluations
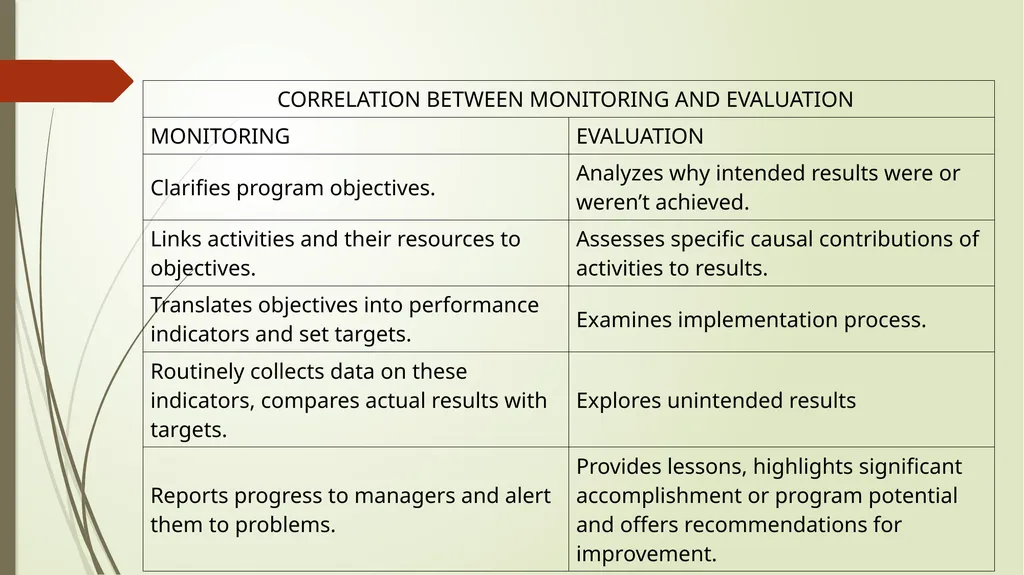
Correlation between monitoring and evaluation
Clinical Governance
Definition
Need for clinical governance
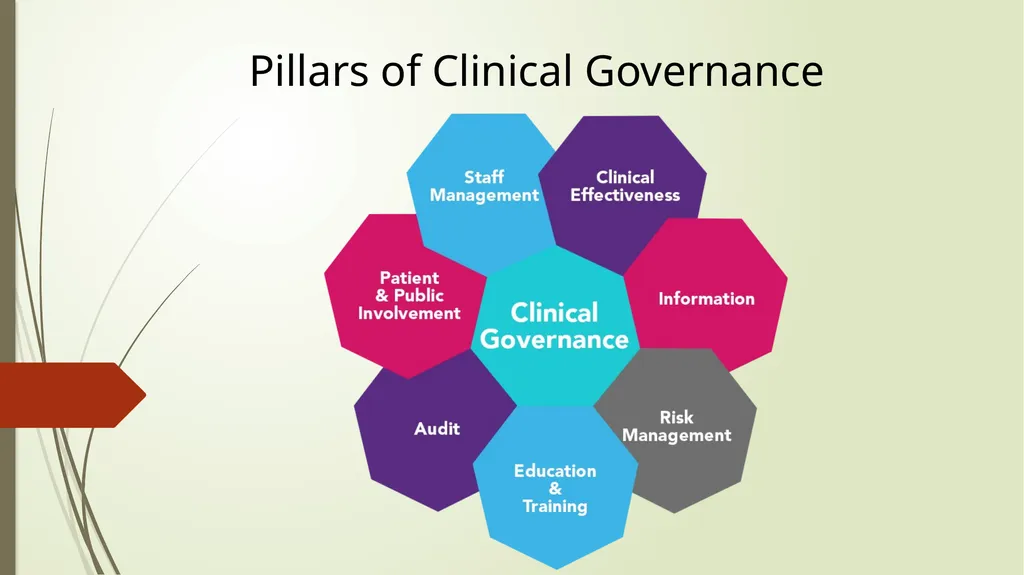
7 pillars of clinical governance
Health Indicators
Definition
Characteristics of indicators
Classification of indicators<br>
Definitions
Types of monitoring and evaluations
Correlation between monitoring and evaluation
Clinical Governance
Definition
Need for clinical governance
7 pillars of clinical governance
Health Indicators
Definition
Characteristics of indicators
Classification of indicators<br>
03
Monitoring and Evaluation is a regular, systematic collection and analysis of information to track progress of a project, programme or service. While monitoring seeks to explain “what” is happening, an evaluation attempts to explain “why” it’s happening, and to learn and share important lessons.<br>
04
Monitoring<br>
05
Monitoring is a continuous process of collecting and analysing data on information to compare how well a project; program or policy is performing against expected results.<br>
06
TYPES OF MONITORING PERFORMANCE
Compliance
Quality
Frontline monitoring<br>
Compliance
Quality
Frontline monitoring<br>
07
Evaluation<br>
08
Evaluation is a process which attempts to determine, as systematically and objectively as possible, the relevance, effectiveness, efficiency and impact of activities in the light of specified objectives.<br>
09
Evaluation may focus on different aspects of service or program: Inputs
Activities
Outputs
Outcomes<br>
Activities
Outputs
Outcomes<br>
10
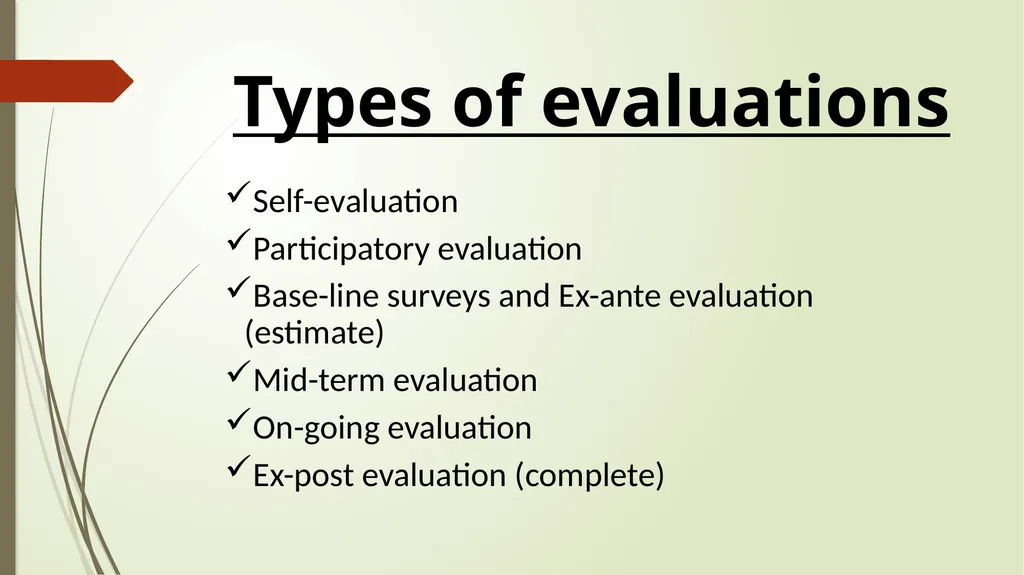
Types of evaluations Self-evaluation
Participatory evaluation
Base-line surveys and Ex-ante evaluation (estimate)
Mid-term evaluation
On-going evaluation
Ex-post evaluation (complete)<br>
Participatory evaluation
Base-line surveys and Ex-ante evaluation (estimate)
Mid-term evaluation
On-going evaluation
Ex-post evaluation (complete)<br>
11
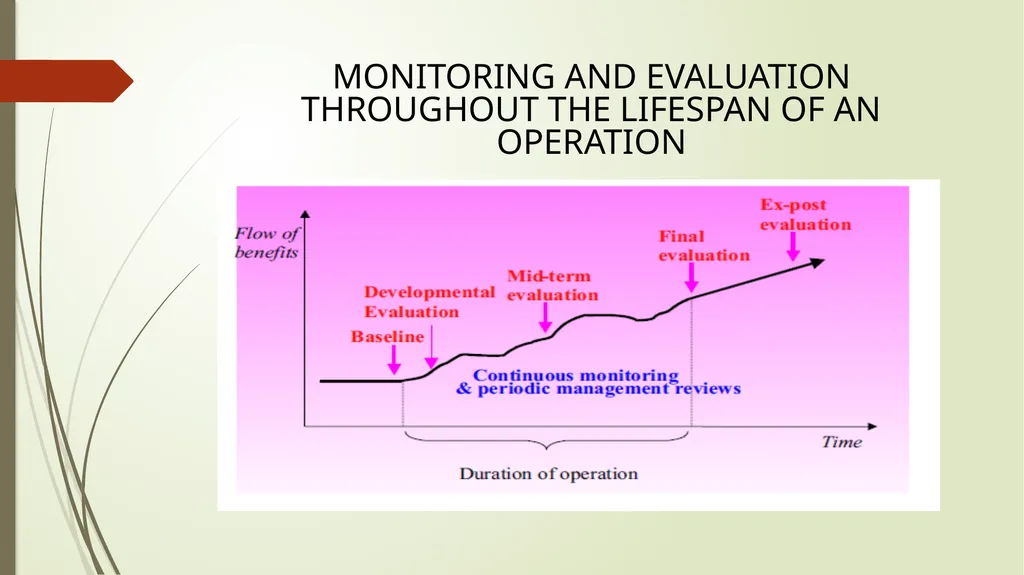
MONITORING AND EVALUATION THROUGHOUT THE LIFESPAN OF AN OPERATION<br>
12
CLINICAL
GOVERNANCE<br>
13
“Clinical governance is a framework that helps managers and clinicians (such as nurses, doctors, physiotherapists) to improve the quality of their services and safeguard standards of care, continuously, thoughtfully and in a coordinated fashion, by creating an environment in which excellence in clinical care will flourish.”<br>
14
CLINICAL GOVERNANCE Umbrella term for term for everything that helps to maintain and improve high standards of patient care.
In order for this to work,
Every member of the health facility staff recognizing their role in providing high quality of care.
Patient care needs to be improved using whatever method is the most suitable – by
Identifying aspects of care that need improvement.
making plans to improve them,
And, monitoring the success.
Learning from experience
Not only identifying the wrong
Identify good practice and what works well.<br>
In order for this to work,
Every member of the health facility staff recognizing their role in providing high quality of care.
Patient care needs to be improved using whatever method is the most suitable – by
Identifying aspects of care that need improvement.
making plans to improve them,
And, monitoring the success.
Learning from experience
Not only identifying the wrong
Identify good practice and what works well.<br>
15
Puts patient experience at the heart of clinical care.
Accountability
Developing true partnership involving
Managers
Clinical staff
Patients
Need for clinical governance?
To reduce the inappropriate variation in health care
To minimize risks
To maintain high quality care<br>
Accountability
Developing true partnership involving
Managers
Clinical staff
Patients
Need for clinical governance?
To reduce the inappropriate variation in health care
To minimize risks
To maintain high quality care<br>
16
Pillars of Clinical Governance<br>
17
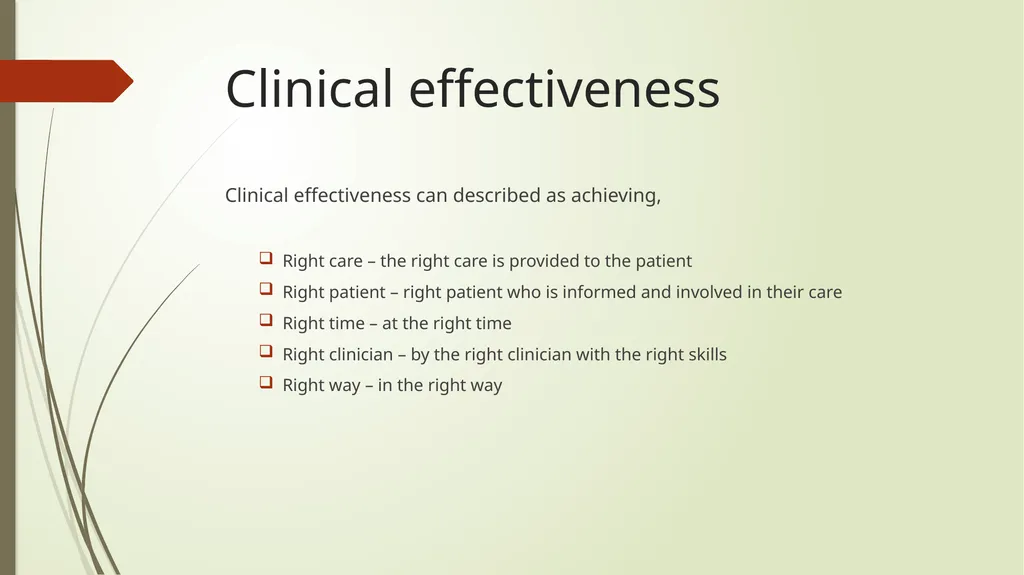
Clinical effectiveness Clinical effectiveness can described as achieving,
Right care – the right care is provided to the patient
Right patient – right patient who is informed and involved in their care
Right time – at the right time
Right clinician – by the right clinician with the right skills
Right way – in the right way<br>
Right care – the right care is provided to the patient
Right patient – right patient who is informed and involved in their care
Right time – at the right time
Right clinician – by the right clinician with the right skills
Right way – in the right way<br>
18
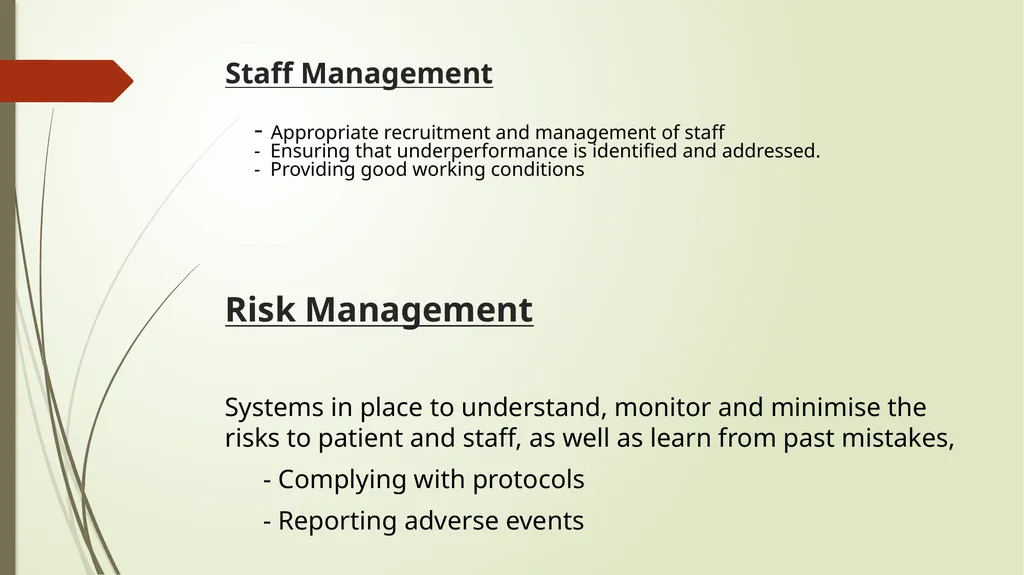
Staff Management
- Appropriate recruitment and management of staff
- Ensuring that underperformance is identified and addressed.
- Providing good working conditions Risk Management
Systems in place to understand, monitor and minimise the risks to patient and staff, as well as learn from past mistakes,
- Complying with protocols
- Reporting adverse events<br>
Systems in place to understand, monitor and minimise the risks to patient and staff, as well as learn from past mistakes,
- Complying with protocols
- Reporting adverse events<br>
19
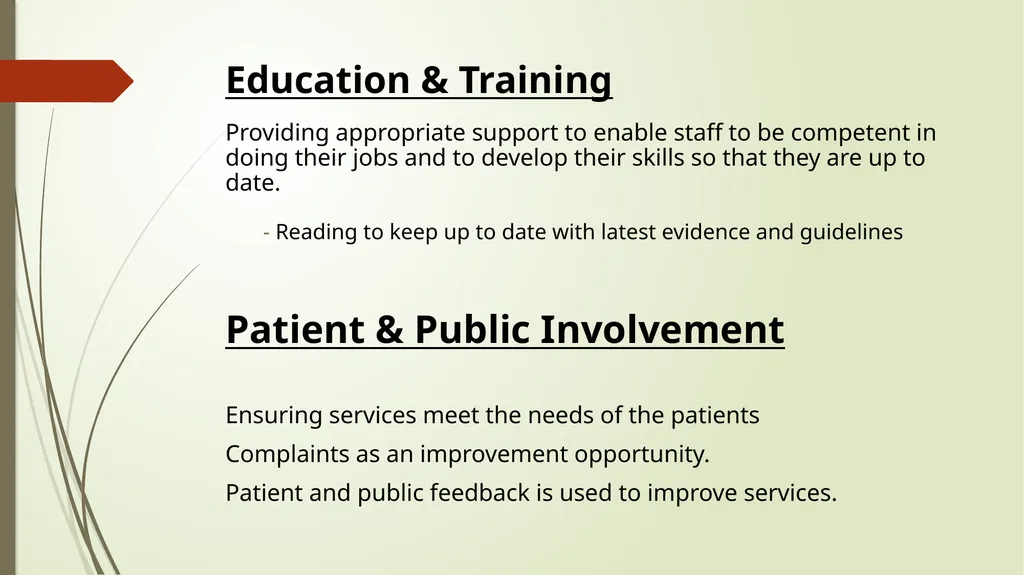
Education & Training
Providing appropriate support to enable staff to be competent in doing their jobs and to develop their skills so that they are up to date.
- Reading to keep up to date with latest evidence and guidelines Patient & Public Involvement
Ensuring services meet the needs of the patients
Complaints as an improvement opportunity.
Patient and public feedback is used to improve services.<br>
Ensuring services meet the needs of the patients
Complaints as an improvement opportunity.
Patient and public feedback is used to improve services.<br>
20
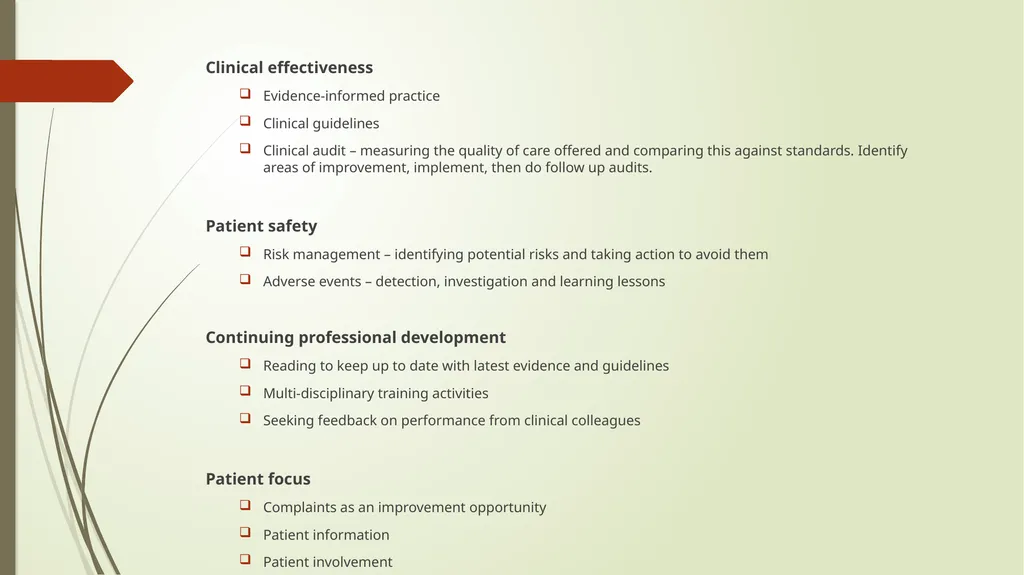
Clinical effectiveness
Evidence-informed practice
Clinical guidelines
Clinical audit – measuring the quality of care offered and comparing this against standards. Identify areas of improvement, implement, then do follow up audits.
Patient safety
Risk management – identifying potential risks and taking action to avoid them
Adverse events – detection, investigation and learning lessons
Continuing professional development
Reading to keep up to date with latest evidence and guidelines
Multi-disciplinary training activities
Seeking feedback on performance from clinical colleagues
Patient focus
Complaints as an improvement opportunity
Patient information
Patient involvement<br>
Evidence-informed practice
Clinical guidelines
Clinical audit – measuring the quality of care offered and comparing this against standards. Identify areas of improvement, implement, then do follow up audits.
Patient safety
Risk management – identifying potential risks and taking action to avoid them
Adverse events – detection, investigation and learning lessons
Continuing professional development
Reading to keep up to date with latest evidence and guidelines
Multi-disciplinary training activities
Seeking feedback on performance from clinical colleagues
Patient focus
Complaints as an improvement opportunity
Patient information
Patient involvement<br>
21
Health Indicators<br>
22
Definition: Health Indicator is a variable, susceptible to direct measurement, that reflects the state of health of persons in a community.
Indicators help to measure the extent to which the objectives and targets of a programme are being attained.<br>
Indicators help to measure the extent to which the objectives and targets of a programme are being attained.<br>
23
Characteristics Valid - they should actually measure what they are supposed to measure.
Objective - the definition must be precise and easy to understand about what is to be measured.
Reliable - the results should be the same when measured by different people in similar circumstances.
Accessible – the data should be collected easily, on timely basis at reasonable cost.
Sensitive - they should be sensitive to changes in the situation concerned.
Specific - they should reflect changes only in the situation concerned.
Feasible - they should have the ability to obtain data when needed
Useful – the data should have utility for decision-making and learning
Relevant - they should contribute to the understanding of the phenomenon of interest.<br>
Objective - the definition must be precise and easy to understand about what is to be measured.
Reliable - the results should be the same when measured by different people in similar circumstances.
Accessible – the data should be collected easily, on timely basis at reasonable cost.
Sensitive - they should be sensitive to changes in the situation concerned.
Specific - they should reflect changes only in the situation concerned.
Feasible - they should have the ability to obtain data when needed
Useful – the data should have utility for decision-making and learning
Relevant - they should contribute to the understanding of the phenomenon of interest.<br>
24
Questions that may help determine indicators: How will I know if the objective has been accomplished?
What would be considered effective?
What would be a success?
What change is expected?<br>
What would be considered effective?
What would be a success?
What change is expected?<br>
25
Uses of Health Indicators Measurement of the health of the community.
Description of the health of the community.
Comparison of the health of different communities.
Identification of health needs and prioritizing them.
Concurrent and terminal evaluation of health services.
Planning and allocation of health resources.
Measurement of health successes.<br>
Description of the health of the community.
Comparison of the health of different communities.
Identification of health needs and prioritizing them.
Concurrent and terminal evaluation of health services.
Planning and allocation of health resources.
Measurement of health successes.<br>
26
Classification of health indicators Mortality Indicators
Morbidity Indicators
Disability Rates
Nutritional Status or Nutritional Indicators
Health Care Delivery Indicators
Utilization Rates
Indicators of Social And Mental Health
Environmental Indicators
Socio-economic Indicators
Health Policy Indicators
Indicators of Quality of Life
Other Indicators<br>
Morbidity Indicators
Disability Rates
Nutritional Status or Nutritional Indicators
Health Care Delivery Indicators
Utilization Rates
Indicators of Social And Mental Health
Environmental Indicators
Socio-economic Indicators
Health Policy Indicators
Indicators of Quality of Life
Other Indicators<br>
27
Mortality indicator Crude Death Rate is considered a fair indicator of the comparative health of the people.
It is defined as the number of deaths per 1000 population per year in a given community, usually the mid-year population
The usefulness is restricted because it is influenced by the age-sex composition of the population, socioeconomic and socio-cultural environment of the communities.<br>
It is defined as the number of deaths per 1000 population per year in a given community, usually the mid-year population
The usefulness is restricted because it is influenced by the age-sex composition of the population, socioeconomic and socio-cultural environment of the communities.<br>
28
Mortality indicators Expectation of life is the average number of years that will be lived by those born alive into a population if the current age specific mortality rates persist.
It is a statistical abstraction based on existing age- specific death rates.
Estimated for both sexes separately.
Good indicator of socioeconomic development<br>
It is a statistical abstraction based on existing age- specific death rates.
Estimated for both sexes separately.
Good indicator of socioeconomic development<br>
29
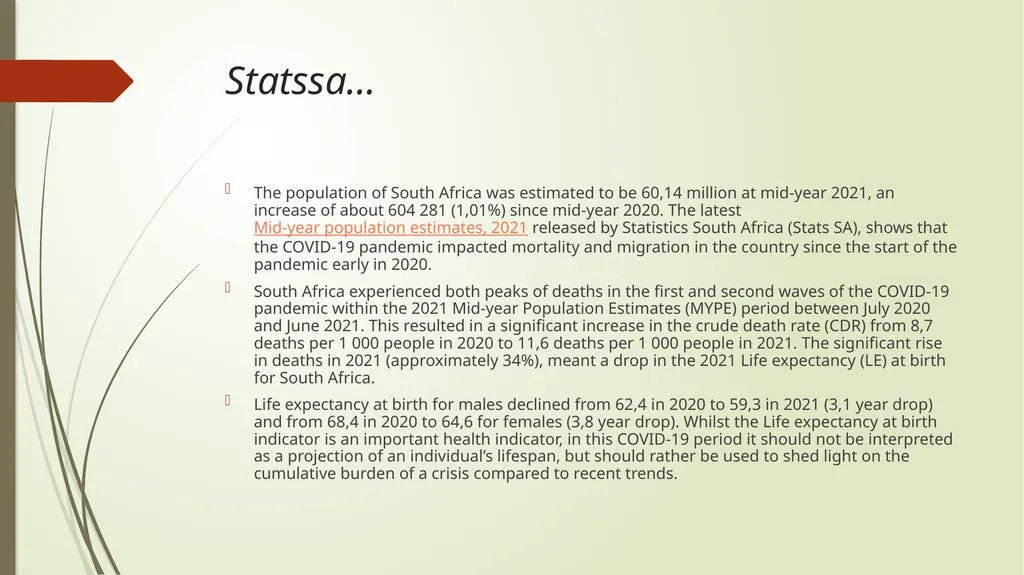
Statssa… The population of South Africa was estimated to be 60,14 million at mid-year 2021, an increase of about 604 281 (1,01%) since mid-year 2020. The latest Mid-year population estimates, 2021 released by Statistics South Africa (Stats SA), shows that the COVID-19 pandemic impacted mortality and migration in the country since the start of the pandemic early in 2020.
South Africa experienced both peaks of deaths in the first and second waves of the COVID-19 pandemic within the 2021 Mid-year Population Estimates (MYPE) period between July 2020 and June 2021. This resulted in a significant increase in the crude death rate (CDR) from 8,7 deaths per 1 000 people in 2020 to 11,6 deaths per 1 000 people in 2021. The significant rise in deaths in 2021 (approximately 34%), meant a drop in the 2021 Life expectancy (LE) at birth for South Africa.
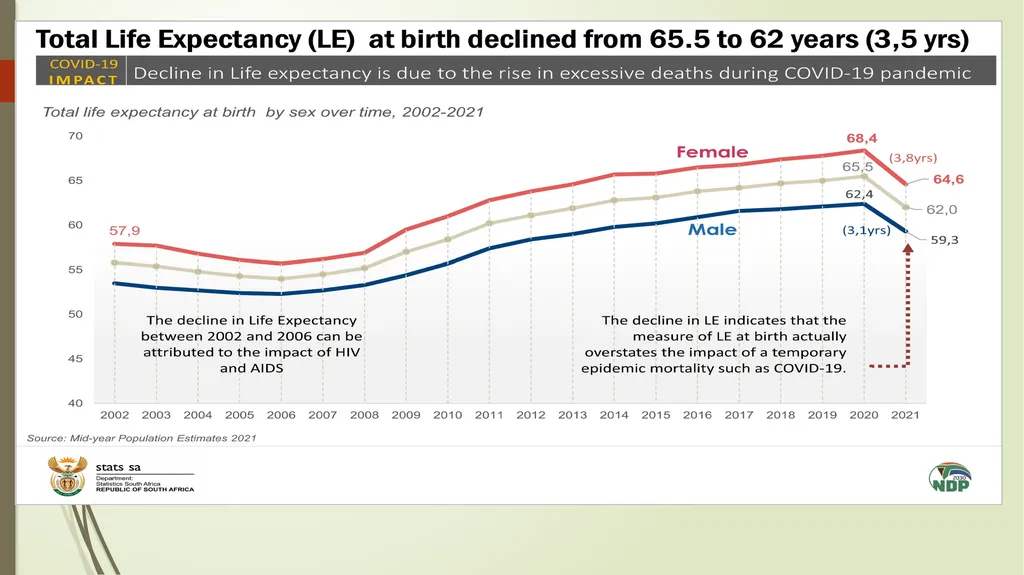
Life expectancy at birth for males declined from 62,4 in 2020 to 59,3 in 2021 (3,1 year drop) and from 68,4 in 2020 to 64,6 for females (3,8 year drop). Whilst the Life expectancy at birth indicator is an important health indicator, in this COVID-19 period it should not be interpreted as a projection of an individual’s lifespan, but should rather be used to shed light on the cumulative burden of a crisis compared to recent trends.<br>
South Africa experienced both peaks of deaths in the first and second waves of the COVID-19 pandemic within the 2021 Mid-year Population Estimates (MYPE) period between July 2020 and June 2021. This resulted in a significant increase in the crude death rate (CDR) from 8,7 deaths per 1 000 people in 2020 to 11,6 deaths per 1 000 people in 2021. The significant rise in deaths in 2021 (approximately 34%), meant a drop in the 2021 Life expectancy (LE) at birth for South Africa.
Life expectancy at birth for males declined from 62,4 in 2020 to 59,3 in 2021 (3,1 year drop) and from 68,4 in 2020 to 64,6 for females (3,8 year drop). Whilst the Life expectancy at birth indicator is an important health indicator, in this COVID-19 period it should not be interpreted as a projection of an individual’s lifespan, but should rather be used to shed light on the cumulative burden of a crisis compared to recent trends.<br>
30
Mortality indicators Infant mortality rate
The ratio of deaths under 1yr of age in a given year to the total number of live births in the same year, usually expressed as a rate per 1000 live births
Indicator of health status of not only infants but also whole population & socioeconomic conditions
Sensitive indicator of availability, utilization &effectiveness of health care, particularly perinatal and postnatal care.
In 2019 IMR was at about 27.5 deaths per 1000 live births.<br>
The ratio of deaths under 1yr of age in a given year to the total number of live births in the same year, usually expressed as a rate per 1000 live births
Indicator of health status of not only infants but also whole population & socioeconomic conditions
Sensitive indicator of availability, utilization &effectiveness of health care, particularly perinatal and postnatal care.
In 2019 IMR was at about 27.5 deaths per 1000 live births.<br>
31
Mortality indicators Under-5 Mortality rate-Defined as no. of deaths occurring in the under-5 age group per 1000 live births.
Reflects both infant and child mortality
Child mortality rate
The number of deaths at ages 1-4yrs in a given year, per 1000 children in that age group at the mid-point of the year.
Correlates with inadequate MCH services, malnutrition, low immunization coverage and environmental factors
Other indicators are:
Perinatal mortality rate, Neonatal mortality rate, Stillbirth rate, etc.
Correlates with inadequate antenatal care and perinatal care.<br>
Reflects both infant and child mortality
Child mortality rate
The number of deaths at ages 1-4yrs in a given year, per 1000 children in that age group at the mid-point of the year.
Correlates with inadequate MCH services, malnutrition, low immunization coverage and environmental factors
Other indicators are:
Perinatal mortality rate, Neonatal mortality rate, Stillbirth rate, etc.
Correlates with inadequate antenatal care and perinatal care.<br>
32
Mortality indicators Maternal Mortality Ratio
Ratio of number of deaths arising during pregnancy or puerperal period per 100000 live births
Accounts for the greatest number of deaths among women of reproductive age in developing countries.
Disease Specific Death Rate is mortality rate which is computed for specific diseases.
Proportional Mortality Rate is the proportion of all deaths attributed to the specific disease<br>
Ratio of number of deaths arising during pregnancy or puerperal period per 100000 live births
Accounts for the greatest number of deaths among women of reproductive age in developing countries.
Disease Specific Death Rate is mortality rate which is computed for specific diseases.
Proportional Mortality Rate is the proportion of all deaths attributed to the specific disease<br>
33
Morbidity indicators Morbidity Indicators reveal the burden of ill health in a community, but do not measure the subclinical or inapparent disease states
1. Incidence and Prevalence
Incidence - The number of new events or new cases of a disease in a defined population, within a specified period of time.
Prevalence - The total number of all individuals who have an attribute or disease at a particular time divided by population at risk of having attribute or disease at this point of time.
Reflects the chronicity of the disease.<br>
1. Incidence and Prevalence
Incidence - The number of new events or new cases of a disease in a defined population, within a specified period of time.
Prevalence - The total number of all individuals who have an attribute or disease at a particular time divided by population at risk of having attribute or disease at this point of time.
Reflects the chronicity of the disease.<br>
34
Morbidity indicators 2. Notification rates is calculated from the reporting to public authorities of certain diseases e.g. yellow fever , poliomyelitis
- They provide information regarding geographic clustering of infections, quality of reporting system etc.
3. Attendance rates at OPDs and at health centers.
4. Admission,Re-admissionanddischarge rates.
5. Duration of stay in hospital.
6. Spells of sickness or absence from work or school.
- reflects economical loss to the community
7. Hospital data constitute a basic and primary source of information about diseases prevalent in the community.<br>
- They provide information regarding geographic clustering of infections, quality of reporting system etc.
3. Attendance rates at OPDs and at health centers.
4. Admission,Re-admissionanddischarge rates.
5. Duration of stay in hospital.
6. Spells of sickness or absence from work or school.
- reflects economical loss to the community
7. Hospital data constitute a basic and primary source of information about diseases prevalent in the community.<br>
35
Nutritional status indicators Nutritional Status is a positive health indicator. Newborns are measured for their
Birth weight
Length
Head circumference
They reflect the maternal nutrition status
Anthropometric measurements of pre-school children
Weight – measures acute malnutrition
Height–measureschronicmalnutrition
Mid-arm circumference - measures chronic malnutrition<br>
Birth weight
Length
Head circumference
They reflect the maternal nutrition status
Anthropometric measurements of pre-school children
Weight – measures acute malnutrition
Height–measureschronicmalnutrition
Mid-arm circumference - measures chronic malnutrition<br>
36
Nutritional status indicators Underweight: weight for age < –2 standard deviations (SD) of the WHO Child Growth Standards median
Stunting: height for age < –2 SD of the WHO Child Growth Standards median
Wasting: weight for height < –2 SD of the WHO Child Growth Standards median
Overweight: weight for height > +2 SD of the WHO Child Growth Standards median<br>
Stunting: height for age < –2 SD of the WHO Child Growth Standards median
Wasting: weight for height < –2 SD of the WHO Child Growth Standards median
Overweight: weight for height > +2 SD of the WHO Child Growth Standards median<br>
37
Nutritional status indicators Growth Monitoring of children is done by measuring weight-for-age, height-for-age, weight-for- height, head & chest circumference and mid-arm circumference.
In adults Underweight, Obesity and Anemia are generally considered reliable nutritional indicators.<br>
In adults Underweight, Obesity and Anemia are generally considered reliable nutritional indicators.<br>