04
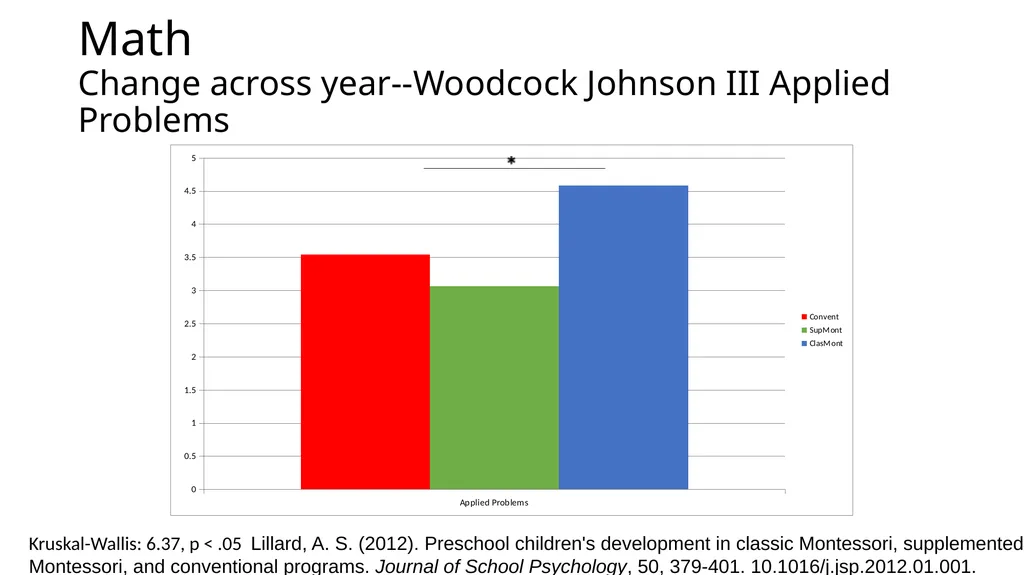
Math�Change across year--Woodcock Johnson III Applied Problems Kruskal-Wallis: 6.37, p < .05 Lillard, A. S. (2012). Preschool children's development in classic Montessori, supplemented Montessori, and conventional programs. Journal of School Psychology, 50, 379-401. 10.1016/j.jsp.2012.01.001.<br>
05
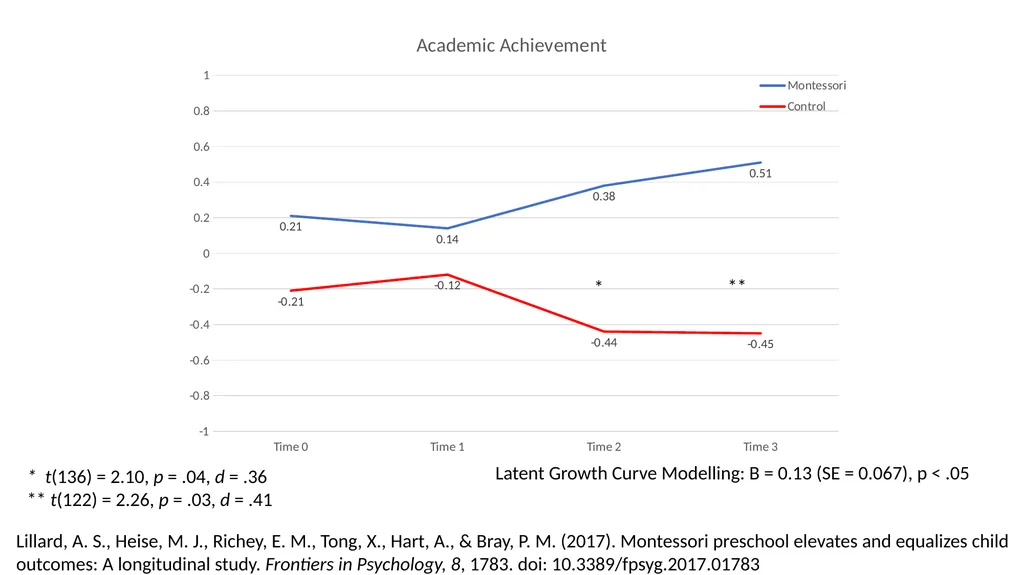
* ** * t(136) = 2.10, p = .04, d = .36
** t(122) = 2.26, p = .03, d = .41 Latent Growth Curve Modelling: B = 0.13 (SE = 0.067), p < .05 Lillard, A. S., Heise, M. J., Richey, E. M., Tong, X., Hart, A., & Bray, P. M. (2017). Montessori preschool elevates and equalizes child outcomes: A longitudinal study. Frontiers in Psychology, 8, 1783. doi: 10.3389/fpsyg.2017.01783<br>
06
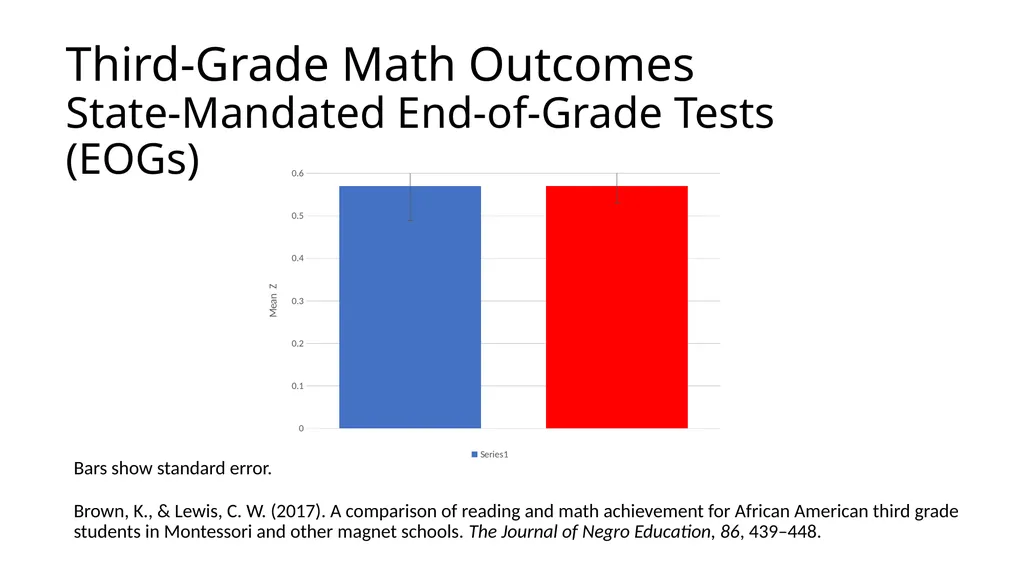
Third-Grade Math Outcomes
State-Mandated End-of-Grade Tests (EOGs) Bars show standard error.
Brown, K., & Lewis, C. W. (2017). A comparison of reading and math achievement for African American third grade students in Montessori and other magnet schools. The Journal of Negro Education, 86, 439–448.<br>
07
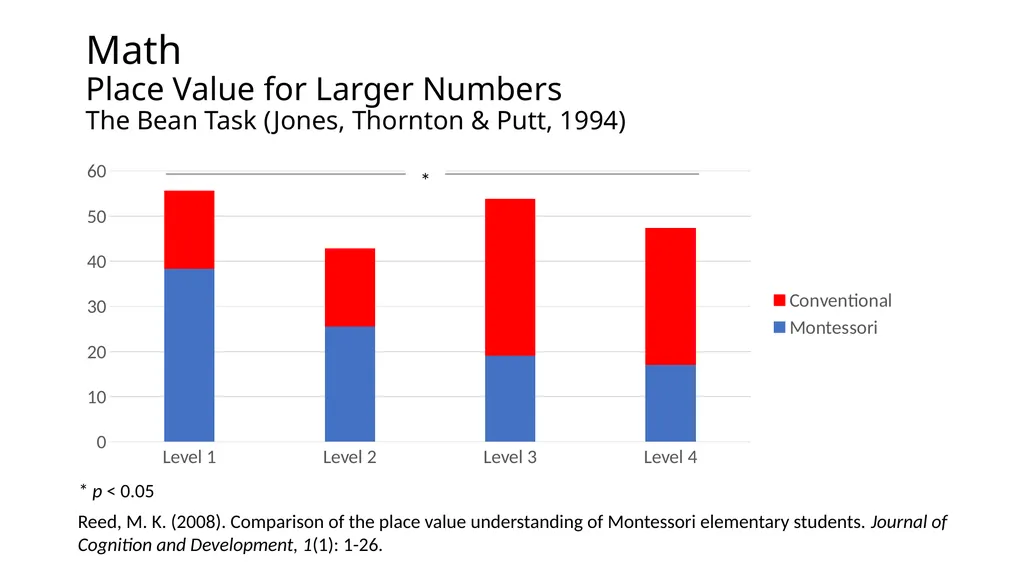
Math�Place Value for Larger Numbers�The Bean Task (Jones, Thornton & Putt, 1994) * p < 0.05 Reed, M. K. (2008). Comparison of the place value understanding of Montessori elementary students. Journal of Cognition and Development, 1(1): 1-26. *<br>
08
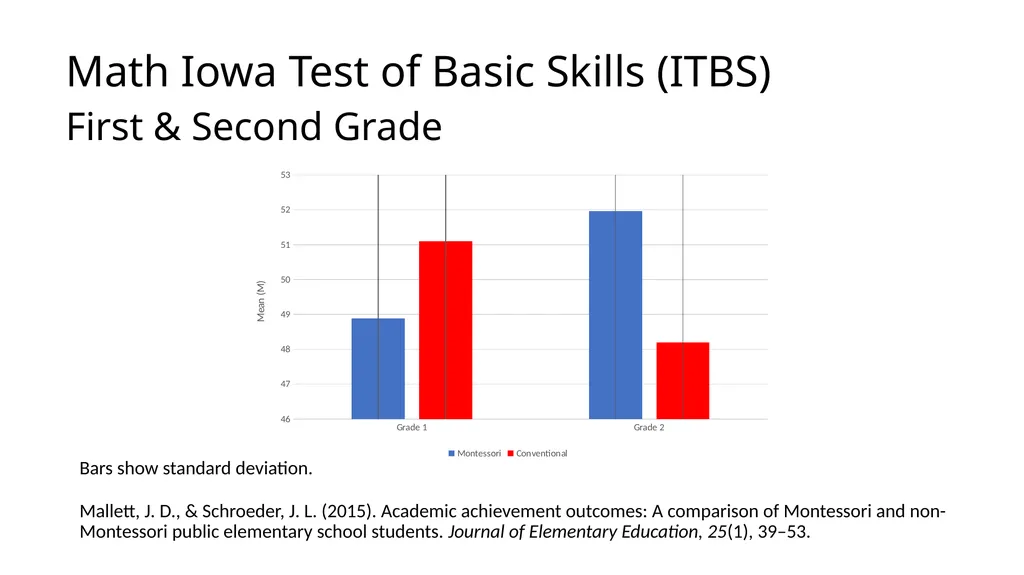
Math Iowa Test of Basic Skills (ITBS)
First & Second Grade Bars show standard deviation.
Mallett, J. D., & Schroeder, J. L. (2015). Academic achievement outcomes: A comparison of Montessori and non-Montessori public elementary school students. Journal of Elementary Education, 25(1), 39–53.<br>
09
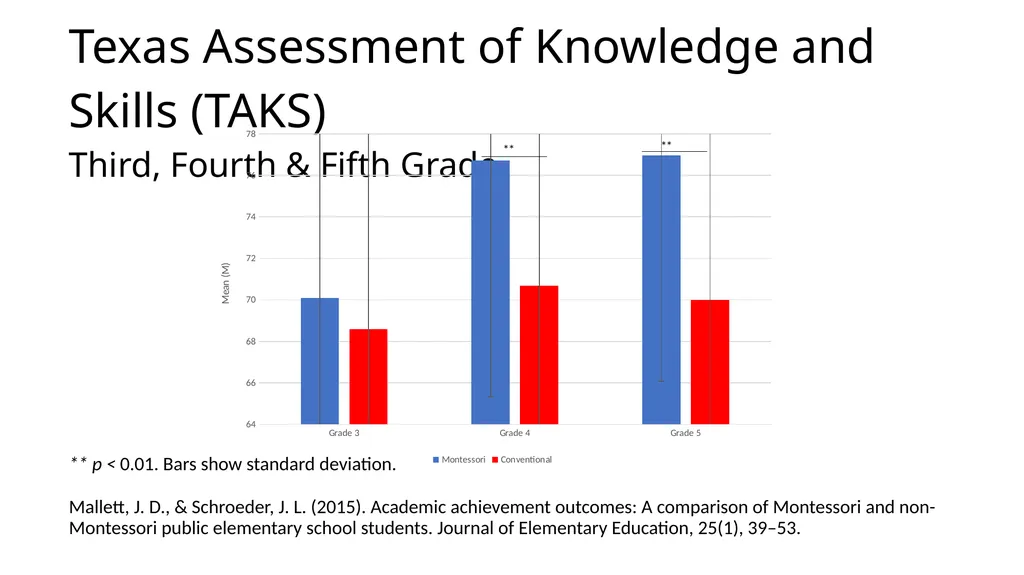
Texas Assessment of Knowledge and Skills (TAKS)
Third, Fourth & Fifth Grade ** p < 0.01. Bars show standard deviation.
Mallett, J. D., & Schroeder, J. L. (2015). Academic achievement outcomes: A comparison of Montessori and non-Montessori public elementary school students. Journal of Elementary Education, 25(1), 39–53.<br>
10
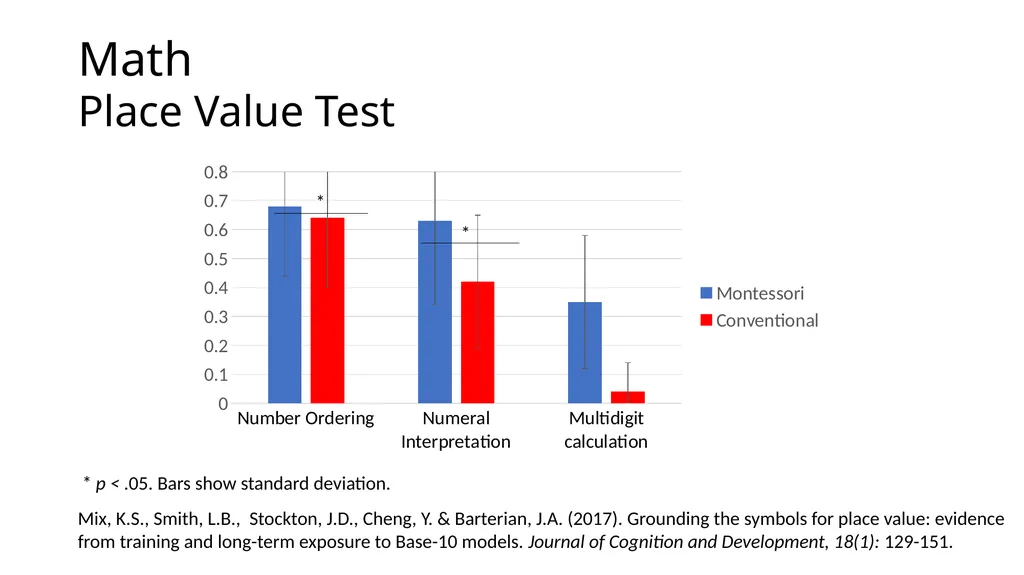
Math�Place Value Test * p < .05. Bars show standard deviation. Mix, K.S., Smith, L.B., Stockton, J.D., Cheng, Y. & Barterian, J.A. (2017). Grounding the symbols for place value: evidence from training and long-term exposure to Base-10 models. Journal of Cognition and Development, 18(1): 129-151. * *<br>
11
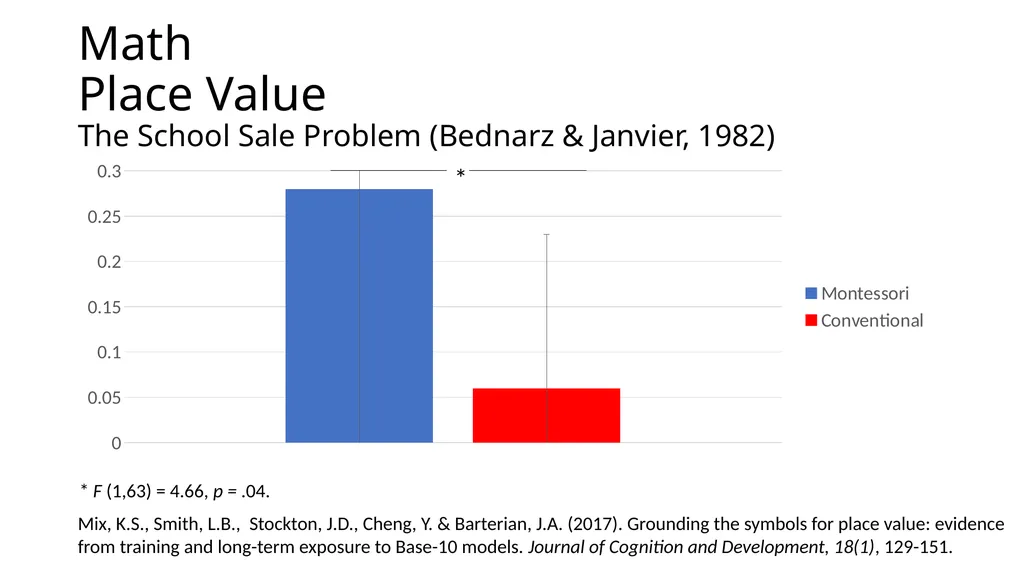
Math �Place Value�The School Sale Problem (Bednarz & Janvier, 1982) * F (1,63) = 4.66, p = .04. Mix, K.S., Smith, L.B., Stockton, J.D., Cheng, Y. & Barterian, J.A. (2017). Grounding the symbols for place value: evidence from training and long-term exposure to Base-10 models. Journal of Cognition and Development, 18(1), 129-151. *<br>
12
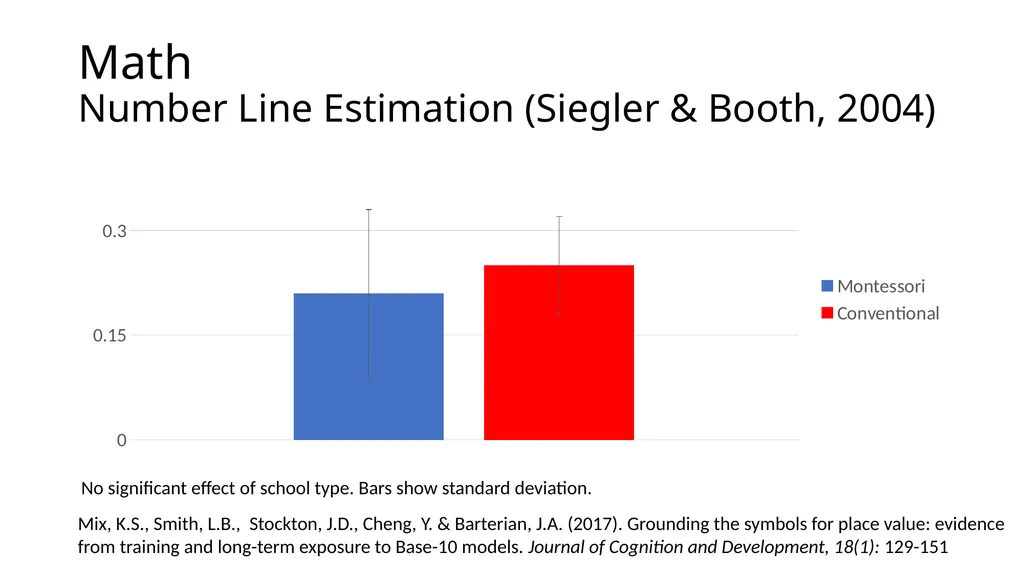
Math�Number Line Estimation (Siegler & Booth, 2004) No significant effect of school type. Bars show standard deviation. Mix, K.S., Smith, L.B., Stockton, J.D., Cheng, Y. & Barterian, J.A. (2017). Grounding the symbols for place value: evidence from training and long-term exposure to Base-10 models. Journal of Cognition and Development, 18(1): 129-151<br>
13
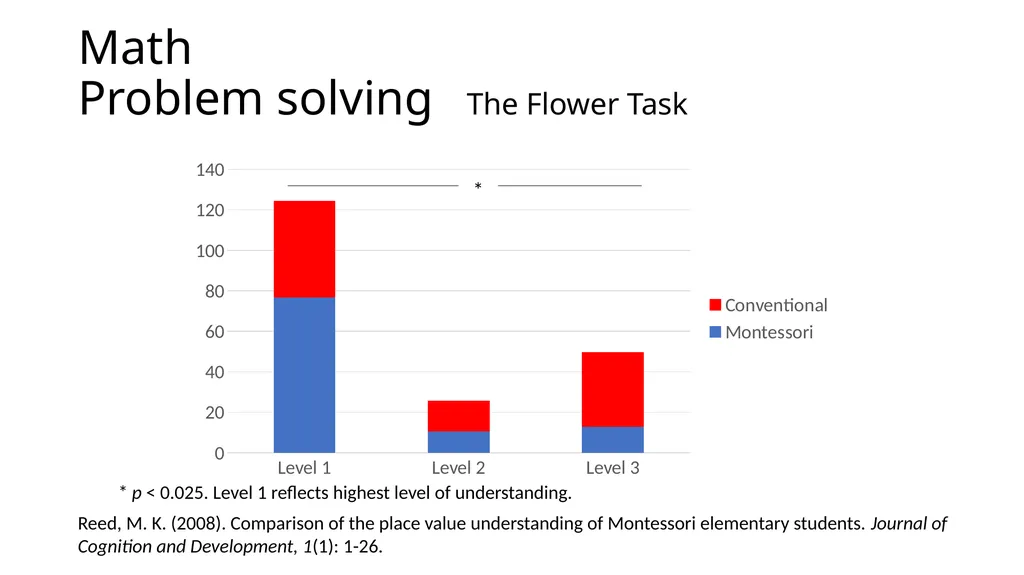
Math�Problem solving The Flower Task * * p < 0.025. Level 1 reflects highest level of understanding. Reed, M. K. (2008). Comparison of the place value understanding of Montessori elementary students. Journal of Cognition and Development, 1(1): 1-26.<br>
14
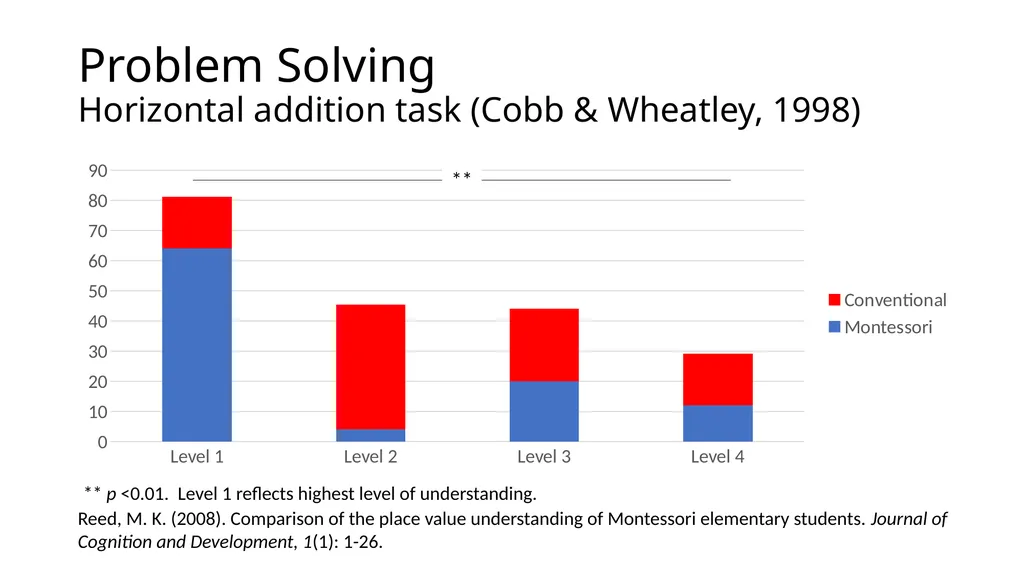
Problem Solving�Horizontal addition task (Cobb & Wheatley, 1998) ** p <0.01. Level 1 reflects highest level of understanding. Reed, M. K. (2008). Comparison of the place value understanding of Montessori elementary students. Journal of Cognition and Development, 1(1): 1-26. **<br>
15
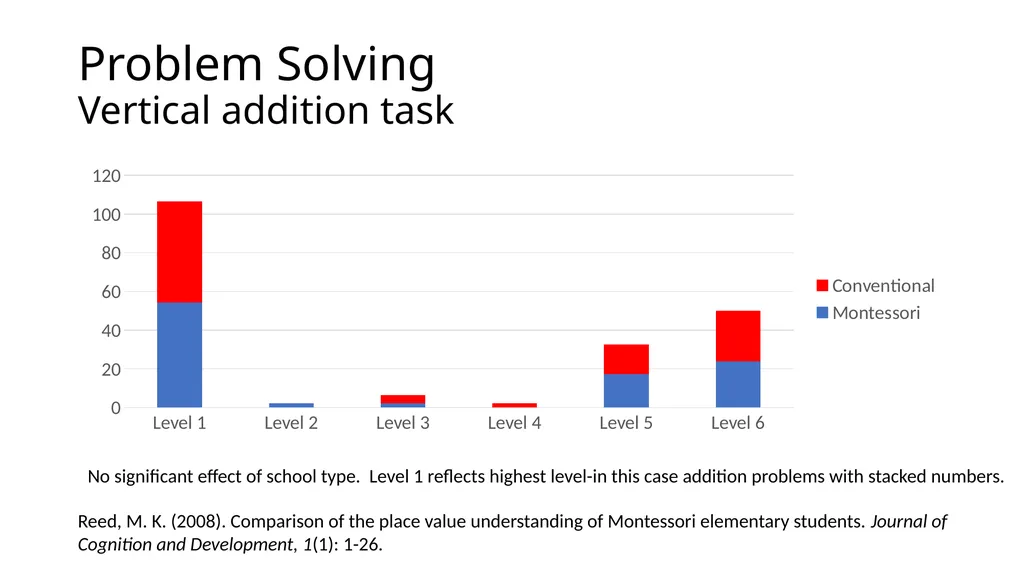
Problem Solving�Vertical addition task Reed, M. K. (2008). Comparison of the place value understanding of Montessori elementary students. Journal of Cognition and Development, 1(1): 1-26. No significant effect of school type. Level 1 reflects highest level-in this case addition problems with stacked numbers.<br>