
MPUMALANGA ECONOMY – PERFORMANCE, CHALLENGES AND




Description: MPUMALANGA ECONOMY PERFORMANCE, CHALLENGES AND POLICY RESPONSE SELECT COMMITTEE ON FINANCE 17 JUNE 2015 CAPE TOWN 1 PURPOSE OF PRESENTATION The purpose of this short presentation is to inform the Committee about the Mpumalanga economy in
Related Topics
Download Presentation
"MPUMALANGA ECONOMY – PERFORMANCE, CHALLENGES AND" is the property of its rightful owner. Permission is granted to download and print the materials on this website for personal, non-commercial use only, and to display it on your personal computer provided you do not modify the materials and that you retain all copyright notices contained in the materials. By downloading content from our website, you accept the terms of this agreement.
Presentation Transcript
slide1. MPUMALANGA ECONOMY – PERFORMANCE, CHALLENGES AND POLICY RESPONSE
SELECT COMMITTEE ON FINANCE
17 JUNE 2015
CAPE TOWN 1<br>
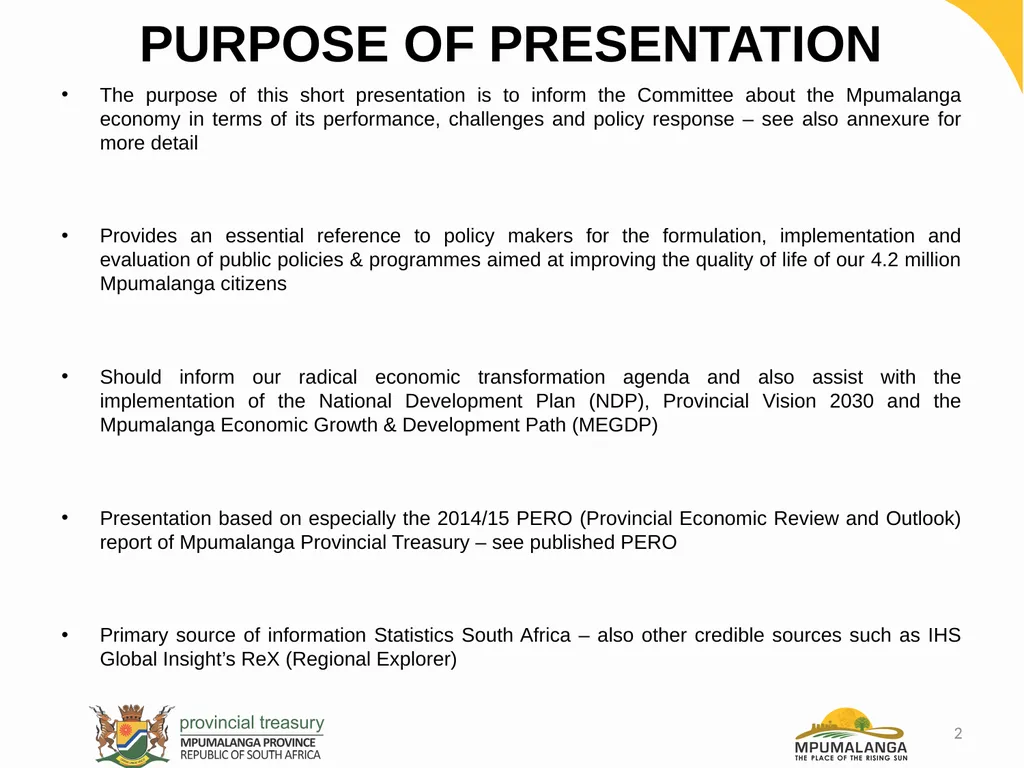
slide2. PURPOSE OF PRESENTATION The purpose of this short presentation is to inform the Committee about the Mpumalanga economy in terms of its performance, challenges and policy response – see also annexure for more detail
Provides an essential reference to policy makers for the formulation, implementation and evaluation of public policies & programmes aimed at improving the quality of life of our 4.2 million Mpumalanga citizens
Should inform our radical economic transformation agenda and also assist with the implementation of the National Development Plan (NDP), Provincial Vision 2030 and the Mpumalanga Economic Growth & Development Path (MEGDP)
Presentation based on especially the 2014/15 PERO (Provincial Economic Review and Outlook) report of Mpumalanga Provincial Treasury – see published PERO
Primary source of information Statistics South Africa – also other credible sources such as IHS Global Insight’s ReX (Regional Explorer) 2<br>
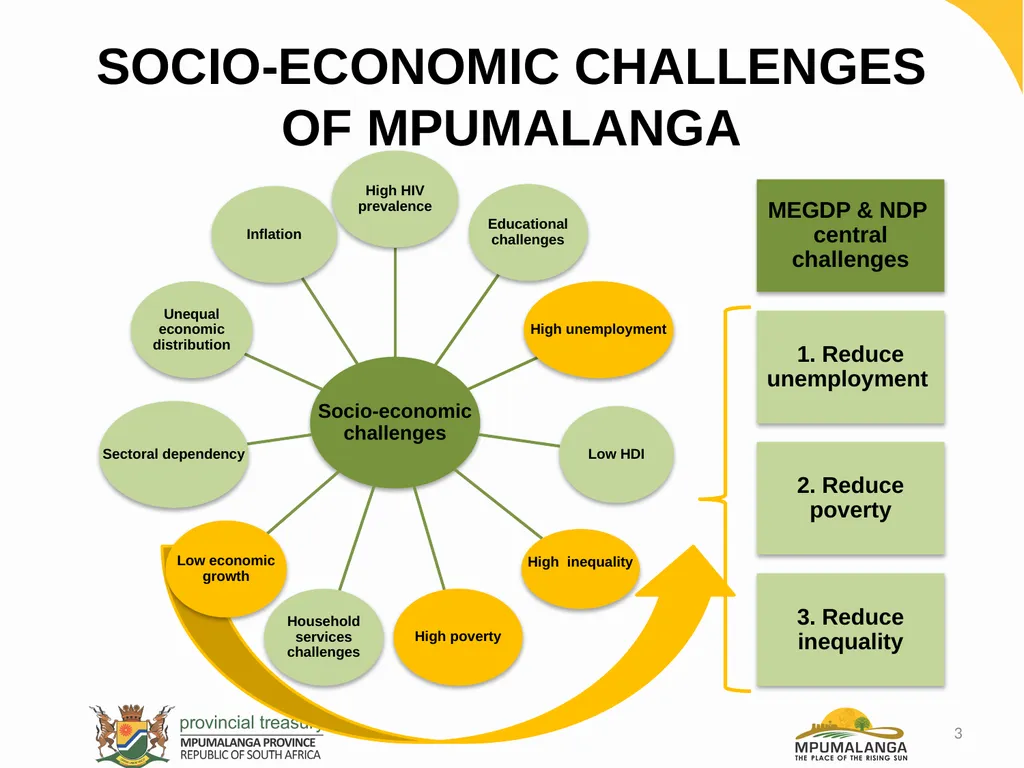
slide3. SOCIO-ECONOMIC CHALLENGES OF MPUMALANGA 3<br>
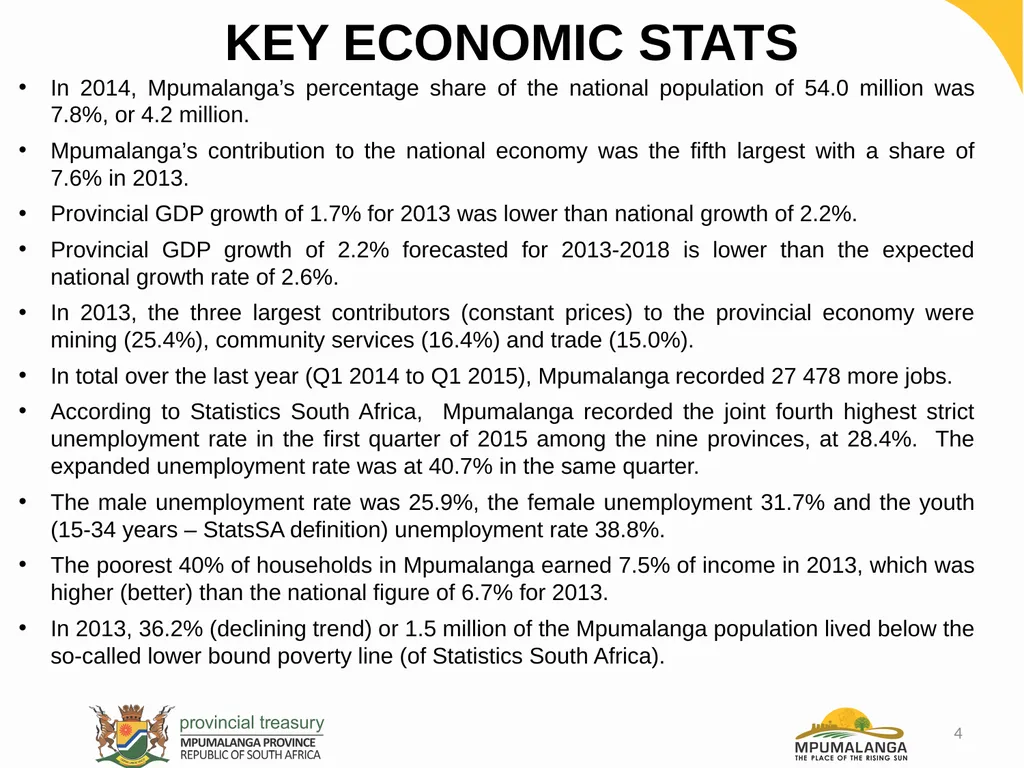
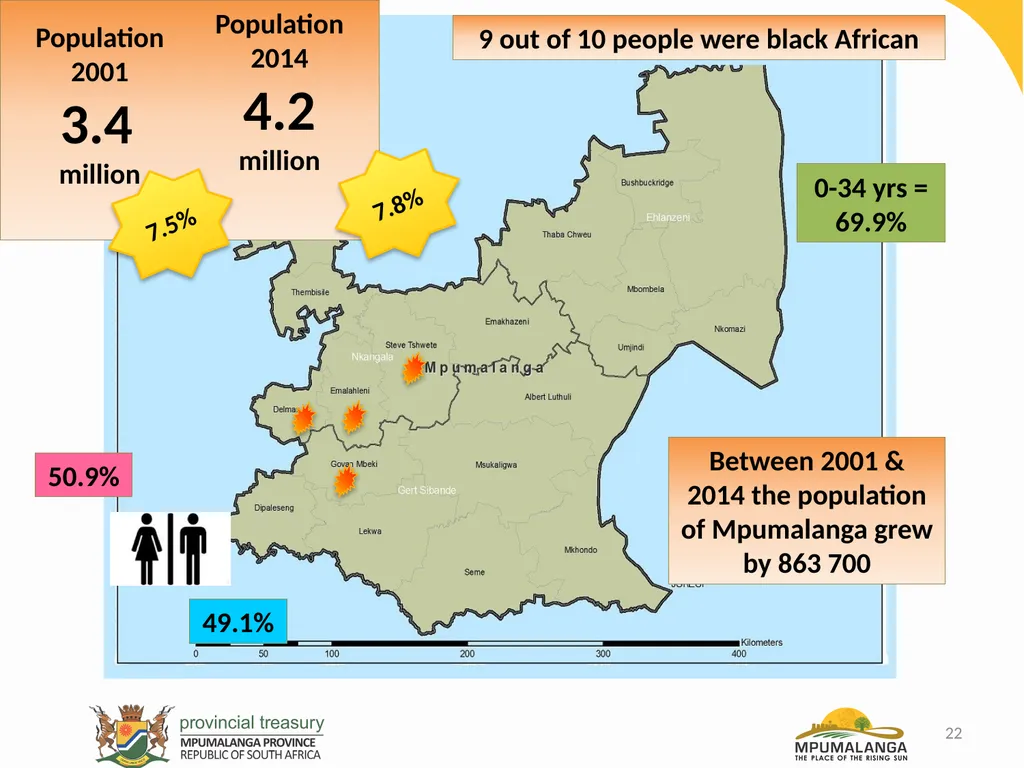
slide4. In 2014, Mpumalanga’s percentage share of the national population of 54.0 million was 7.8%, or 4.2 million.
Mpumalanga’s contribution to the national economy was the fifth largest with a share of 7.6% in 2013.
Provincial GDP growth of 1.7% for 2013 was lower than national growth of 2.2%.
Provincial GDP growth of 2.2% forecasted for 2013-2018 is lower than the expected national growth rate of 2.6%.
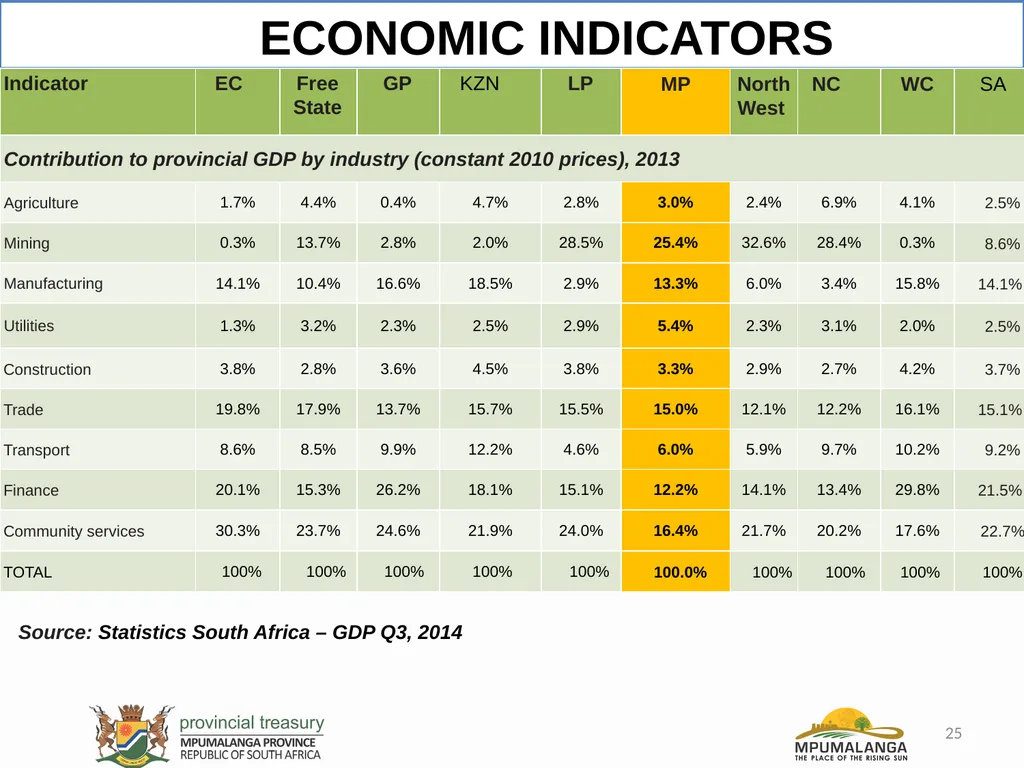
In 2013, the three largest contributors (constant prices) to the provincial economy were mining (25.4%), community services (16.4%) and trade (15.0%).
In total over the last year (Q1 2014 to Q1 2015), Mpumalanga recorded 27 478 more jobs.
According to Statistics South Africa, Mpumalanga recorded the joint fourth highest strict unemployment rate in the first quarter of 2015 among the nine provinces, at 28.4%. The expanded unemployment rate was at 40.7% in the same quarter.
The male unemployment rate was 25.9%, the female unemployment 31.7% and the youth (15-34 years – StatsSA definition) unemployment rate 38.8%.
The poorest 40% of households in Mpumalanga earned 7.5% of income in 2013, which was higher (better) than the national figure of 6.7% for 2013.
In 2013, 36.2% (declining trend) or 1.5 million of the Mpumalanga population lived below the so-called lower bound poverty line (of Statistics South Africa). KEY ECONOMIC STATS 4<br>
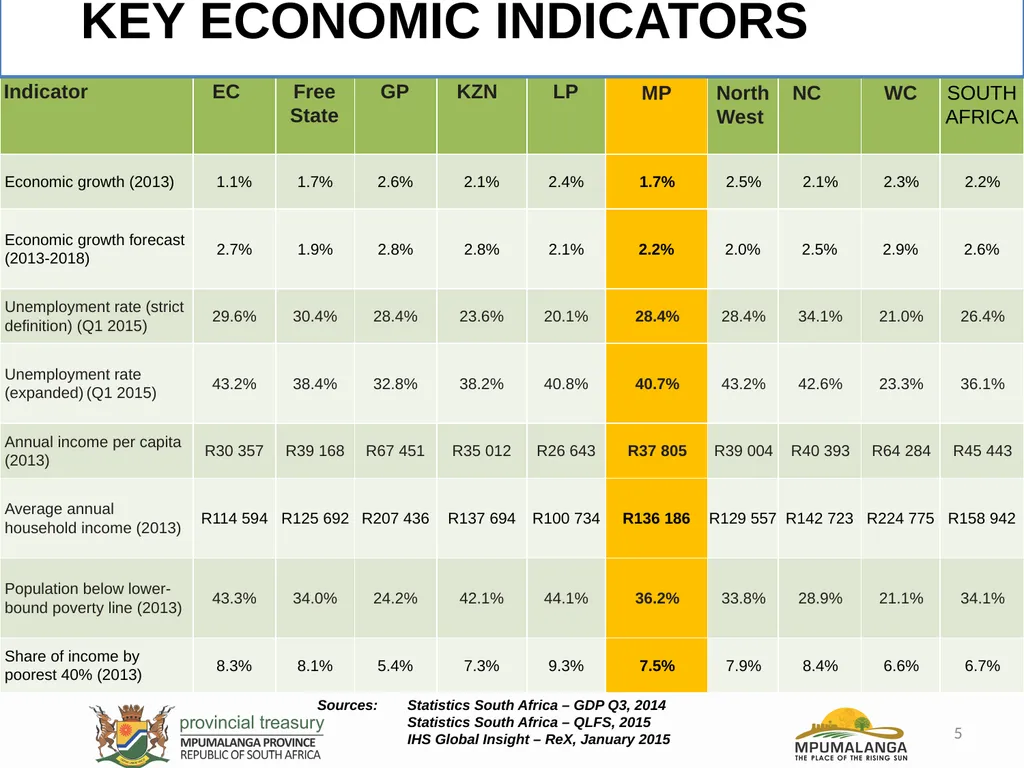
slide5. KEY ECONOMIC INDICATORS Sources: Statistics South Africa – GDP Q3, 2014
Statistics South Africa – QLFS, 2015
IHS Global Insight – ReX, January 2015 5<br>
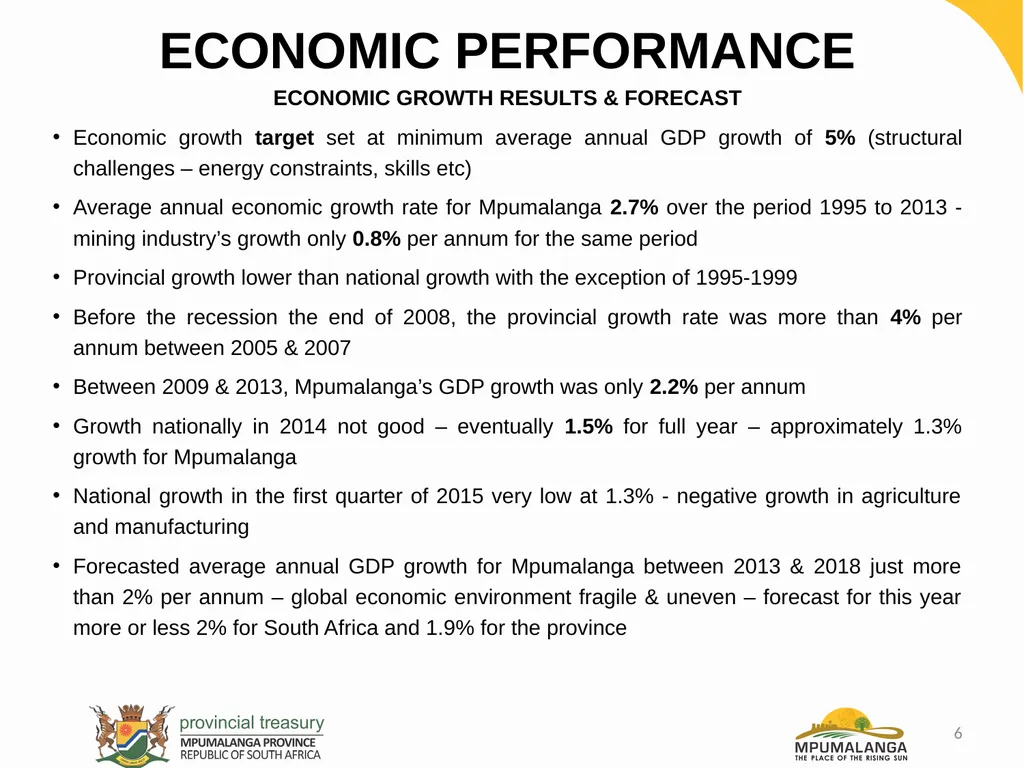
slide6. ECONOMIC PERFORMANCE ECONOMIC GROWTH RESULTS & FORECAST
Economic growth target set at minimum average annual GDP growth of 5% (structural challenges – energy constraints, skills etc)
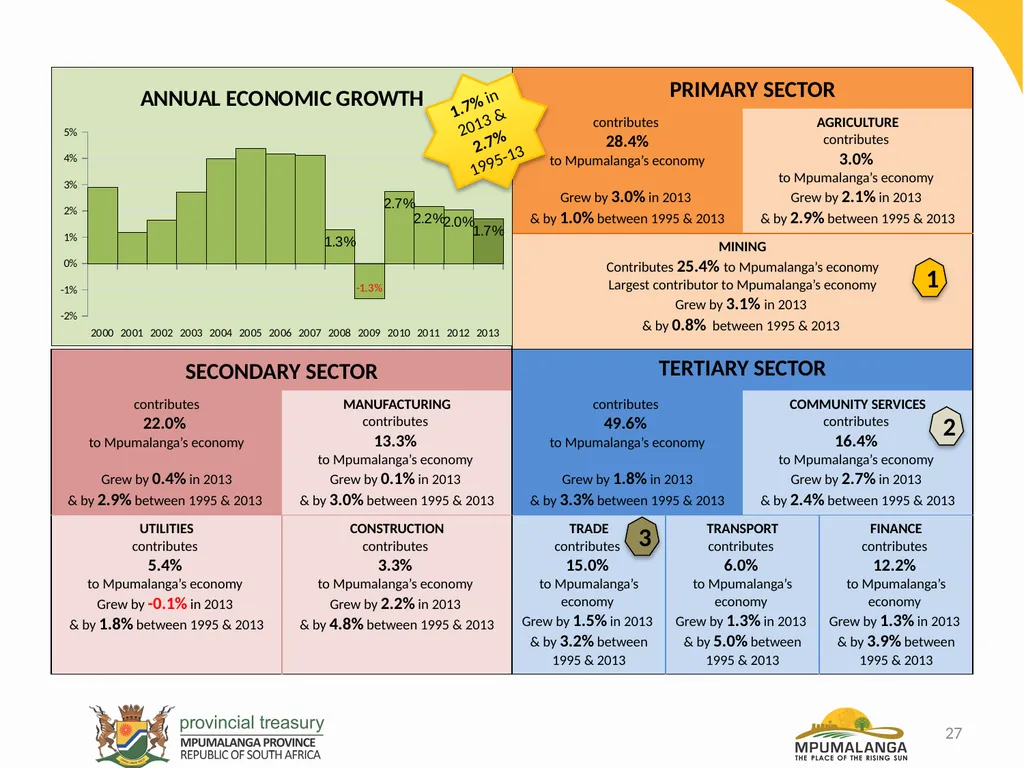
Average annual economic growth rate for Mpumalanga 2.7% over the period 1995 to 2013 - mining industry’s growth only 0.8% per annum for the same period
Provincial growth lower than national growth with the exception of 1995-1999
Before the recession the end of 2008, the provincial growth rate was more than 4% per annum between 2005 & 2007
Between 2009 & 2013, Mpumalanga’s GDP growth was only 2.2% per annum
Growth nationally in 2014 not good – eventually 1.5% for full year – approximately 1.3% growth for Mpumalanga
National growth in the first quarter of 2015 very low at 1.3% - negative growth in agriculture and manufacturing
Forecasted average annual GDP growth for Mpumalanga between 2013 & 2018 just more than 2% per annum – global economic environment fragile & uneven – forecast for this year more or less 2% for South Africa and 1.9% for the province 6<br>
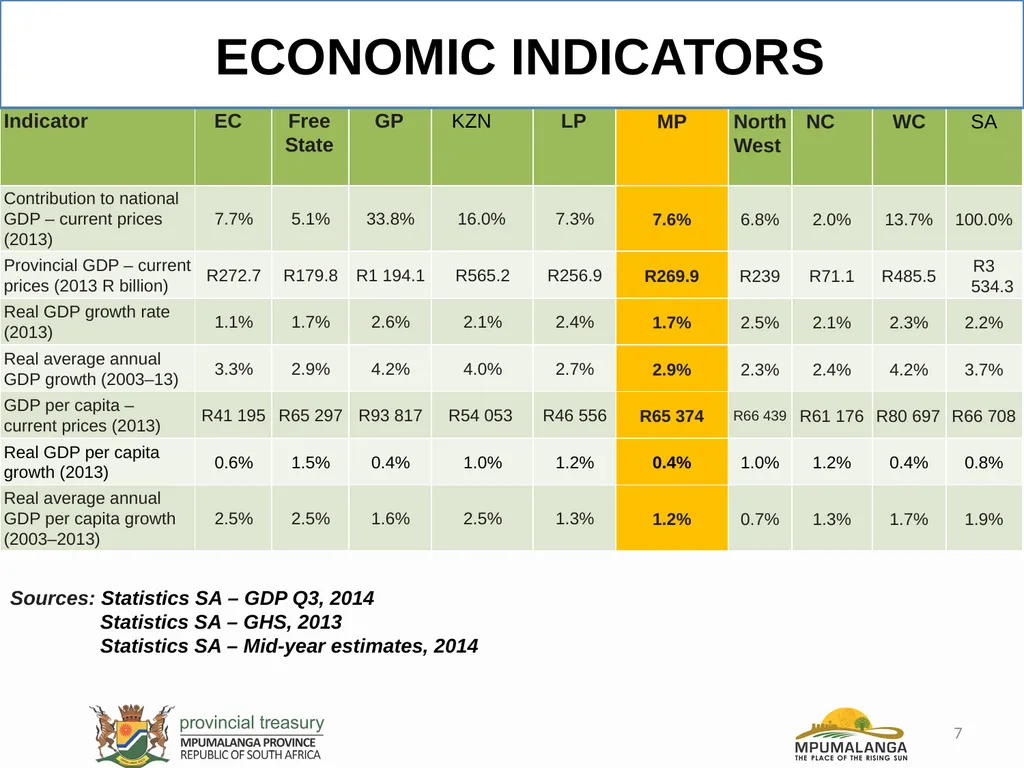
slide7. ECONOMIC INDICATORS Sources: Statistics SA – GDP Q3, 2014
Statistics SA – GHS, 2013
Statistics SA – Mid-year estimates, 2014 7<br>
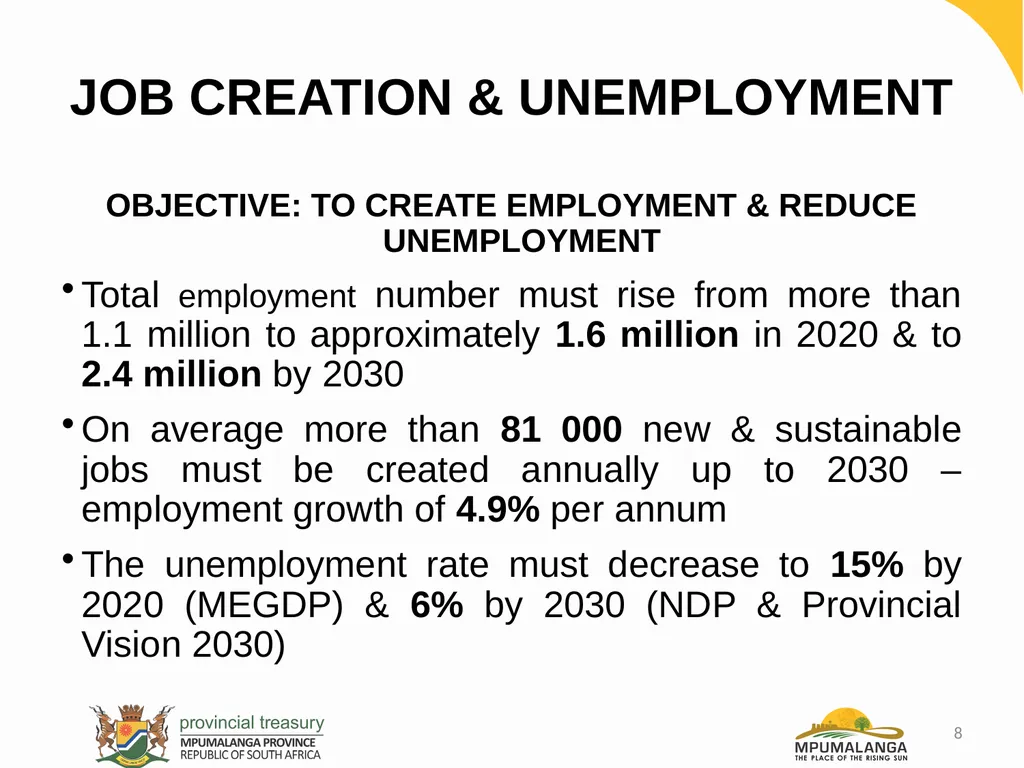
slide8. JOB CREATION & UNEMPLOYMENT OBJECTIVE: TO CREATE EMPLOYMENT & REDUCE UNEMPLOYMENT
Total employment number must rise from more than 1.1 million to approximately 1.6 million in 2020 & to 2.4 million by 2030
On average more than 81 000 new & sustainable jobs must be created annually up to 2030 – employment growth of 4.9% per annum
The unemployment rate must decrease to 15% by 2020 (MEGDP) & 6% by 2030 (NDP & Provincial Vision 2030) 8<br>
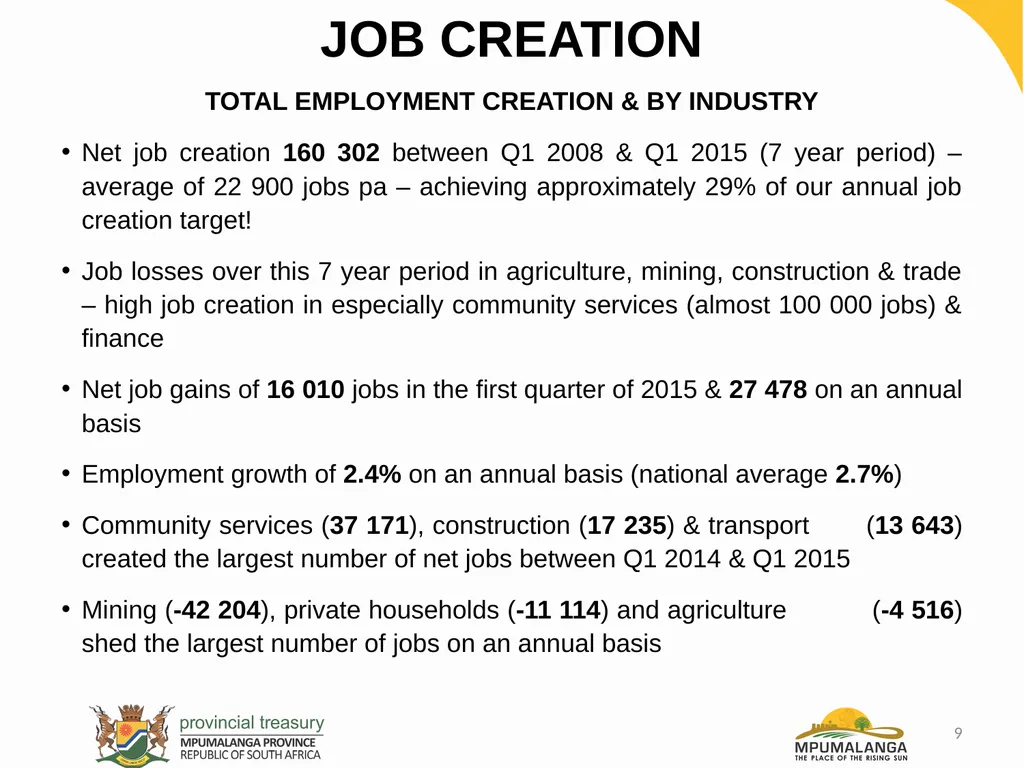
slide9. JOB CREATION TOTAL EMPLOYMENT CREATION & BY INDUSTRY
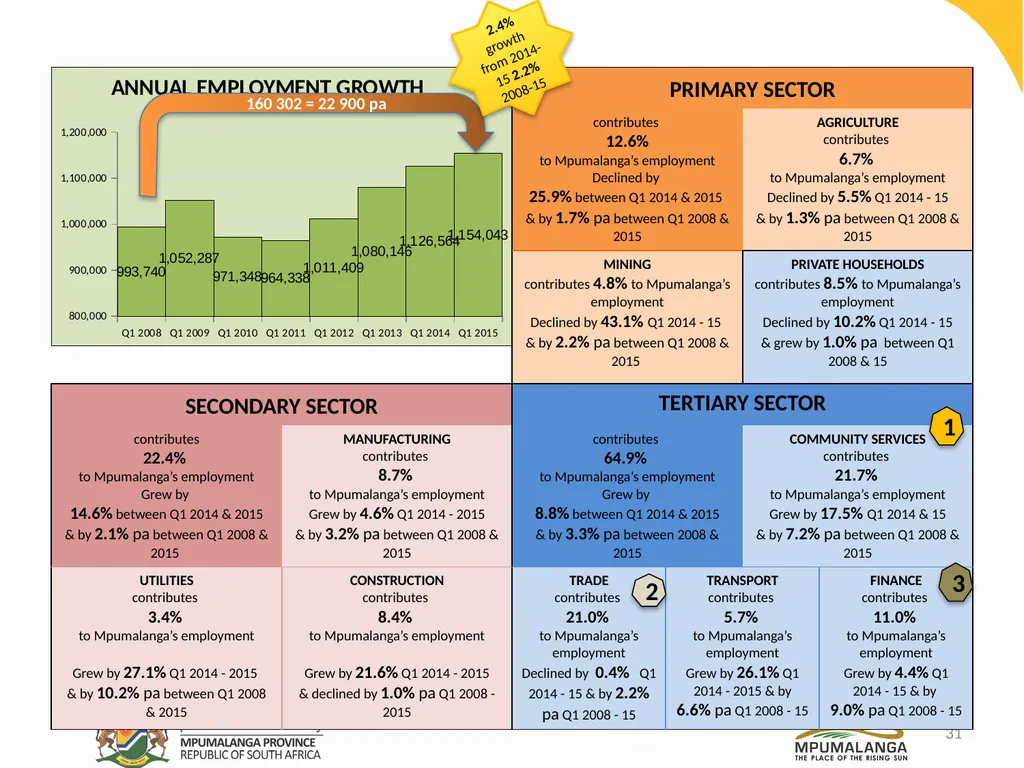
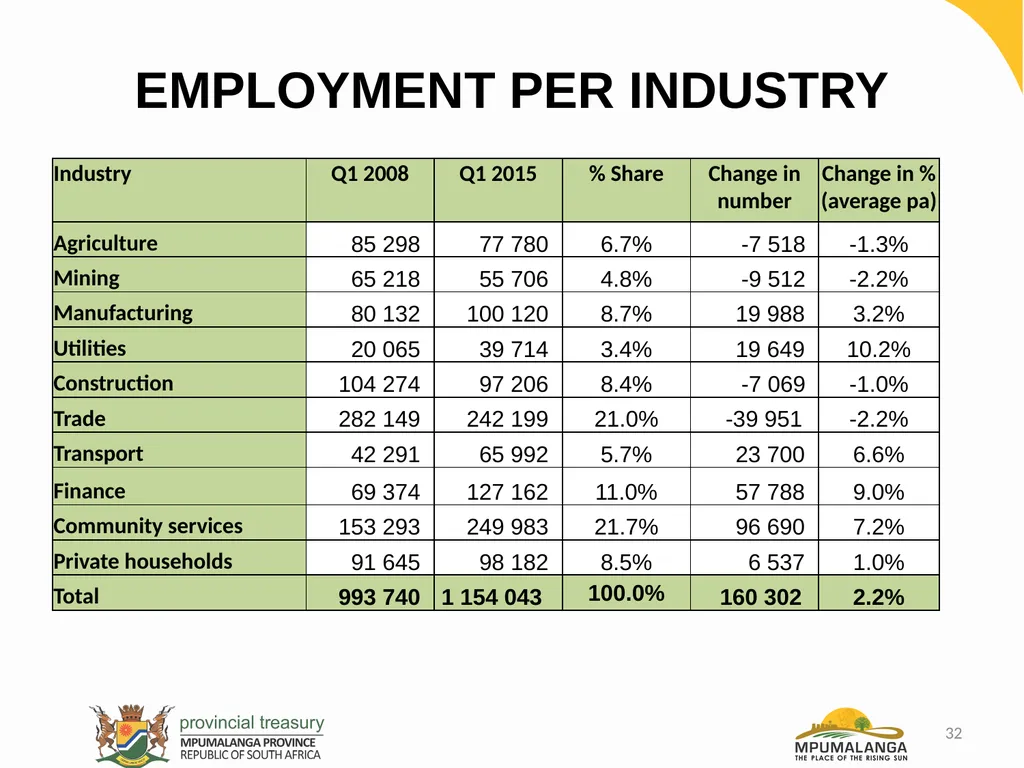
Net job creation 160 302 between Q1 2008 & Q1 2015 (7 year period) – average of 22 900 jobs pa – achieving approximately 29% of our annual job creation target!
Job losses over this 7 year period in agriculture, mining, construction & trade – high job creation in especially community services (almost 100 000 jobs) & finance
Net job gains of 16 010 jobs in the first quarter of 2015 & 27 478 on an annual basis
Employment growth of 2.4% on an annual basis (national average 2.7%)
Community services (37 171), construction (17 235) & transport (13 643) created the largest number of net jobs between Q1 2014 & Q1 2015
Mining (-42 204), private households (-11 114) and agriculture (-4 516) shed the largest number of jobs on an annual basis 9<br>
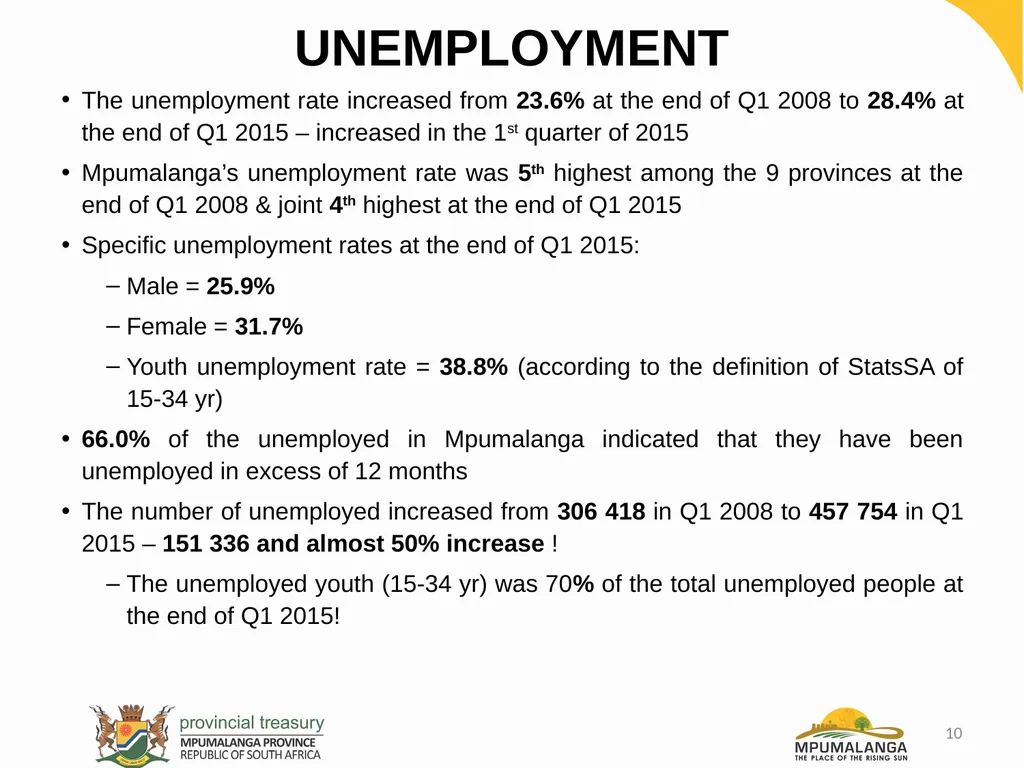
slide10. UNEMPLOYMENT The unemployment rate increased from 23.6% at the end of Q1 2008 to 28.4% at the end of Q1 2015 – increased in the 1st quarter of 2015
Mpumalanga’s unemployment rate was 5th highest among the 9 provinces at the end of Q1 2008 & joint 4th highest at the end of Q1 2015
Specific unemployment rates at the end of Q1 2015:
Male = 25.9%
Female = 31.7%
Youth unemployment rate = 38.8% (according to the definition of StatsSA of 15-34 yr)
66.0% of the unemployed in Mpumalanga indicated that they have been unemployed in excess of 12 months
The number of unemployed increased from 306 418 in Q1 2008 to 457 754 in Q1 2015 – 151 336 and almost 50% increase !
The unemployed youth (15-34 yr) was 70% of the total unemployed people at the end of Q1 2015! 10<br>
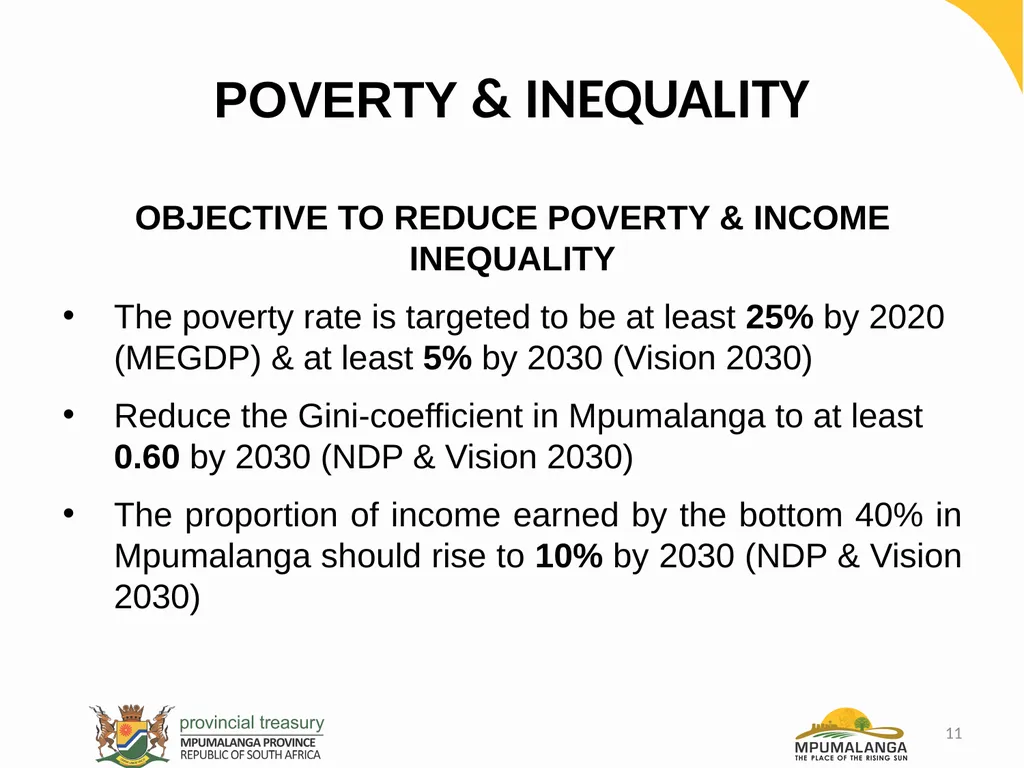
slide11. POVERTY & INEQUALITY OBJECTIVE TO REDUCE POVERTY & INCOME INEQUALITY
The poverty rate is targeted to be at least 25% by 2020 (MEGDP) & at least 5% by 2030 (Vision 2030)
Reduce the Gini-coefficient in Mpumalanga to at least 0.60 by 2030 (NDP & Vision 2030)
The proportion of income earned by the bottom 40% in Mpumalanga should rise to 10% by 2030 (NDP & Vision 2030) 11<br>
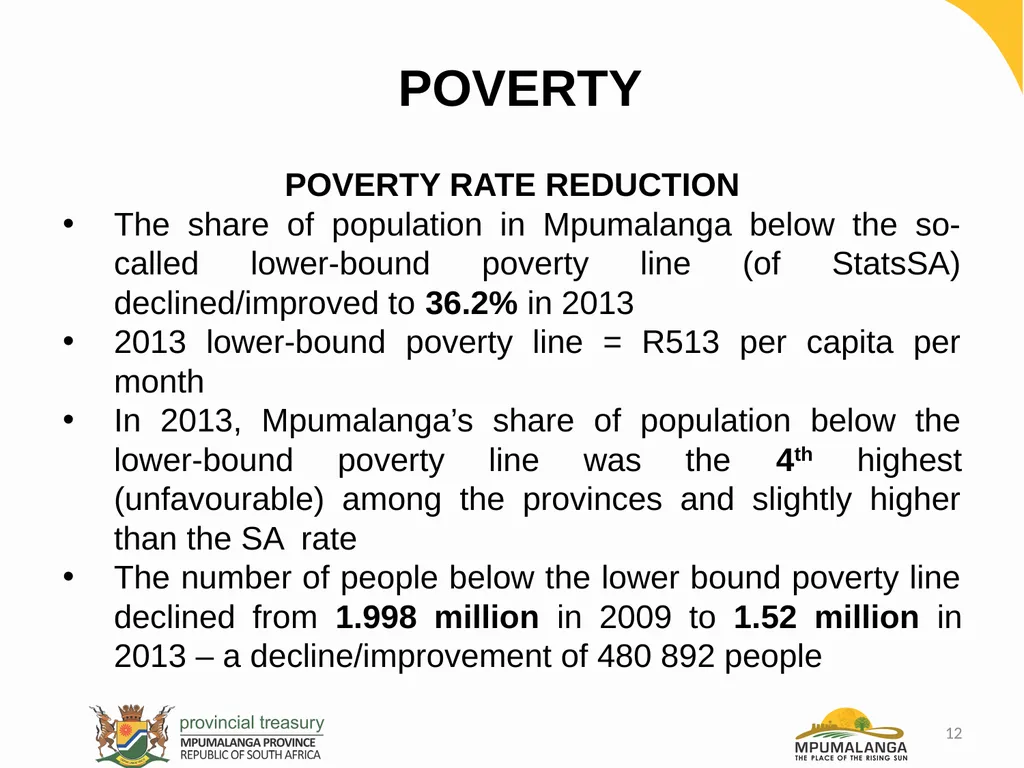
slide12. POVERTY POVERTY RATE REDUCTION
The share of population in Mpumalanga below the so-called lower-bound poverty line (of StatsSA) declined/improved to 36.2% in 2013
2013 lower-bound poverty line = R513 per capita per month
In 2013, Mpumalanga’s share of population below the lower-bound poverty line was the 4th highest (unfavourable) among the provinces and slightly higher than the SA rate
The number of people below the lower bound poverty line declined from 1.998 million in 2009 to 1.52 million in 2013 – a decline/improvement of 480 892 people 12<br>
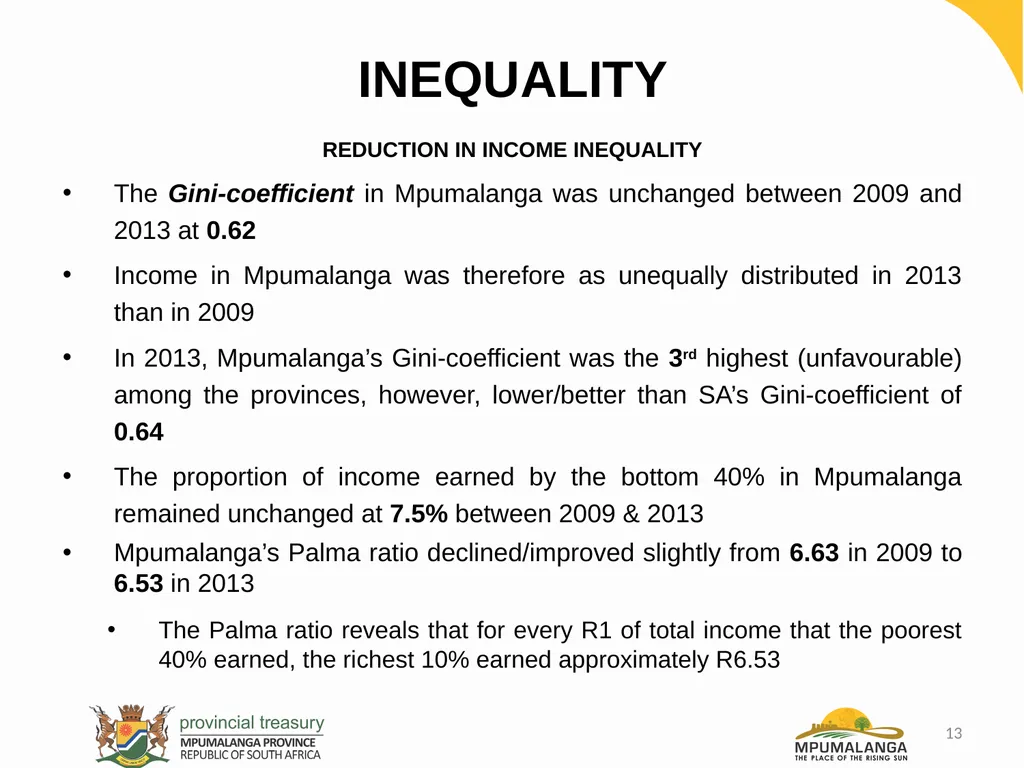
slide13. INEQUALITY REDUCTION IN INCOME INEQUALITY
The Gini-coefficient in Mpumalanga was unchanged between 2009 and 2013 at 0.62
Income in Mpumalanga was therefore as unequally distributed in 2013 than in 2009
In 2013, Mpumalanga’s Gini-coefficient was the 3rd highest (unfavourable) among the provinces, however, lower/better than SA’s Gini-coefficient of 0.64
The proportion of income earned by the bottom 40% in Mpumalanga remained unchanged at 7.5% between 2009 & 2013
Mpumalanga’s Palma ratio declined/improved slightly from 6.63 in 2009 to 6.53 in 2013
The Palma ratio reveals that for every R1 of total income that the poorest 40% earned, the richest 10% earned approximately R6.53 13<br>
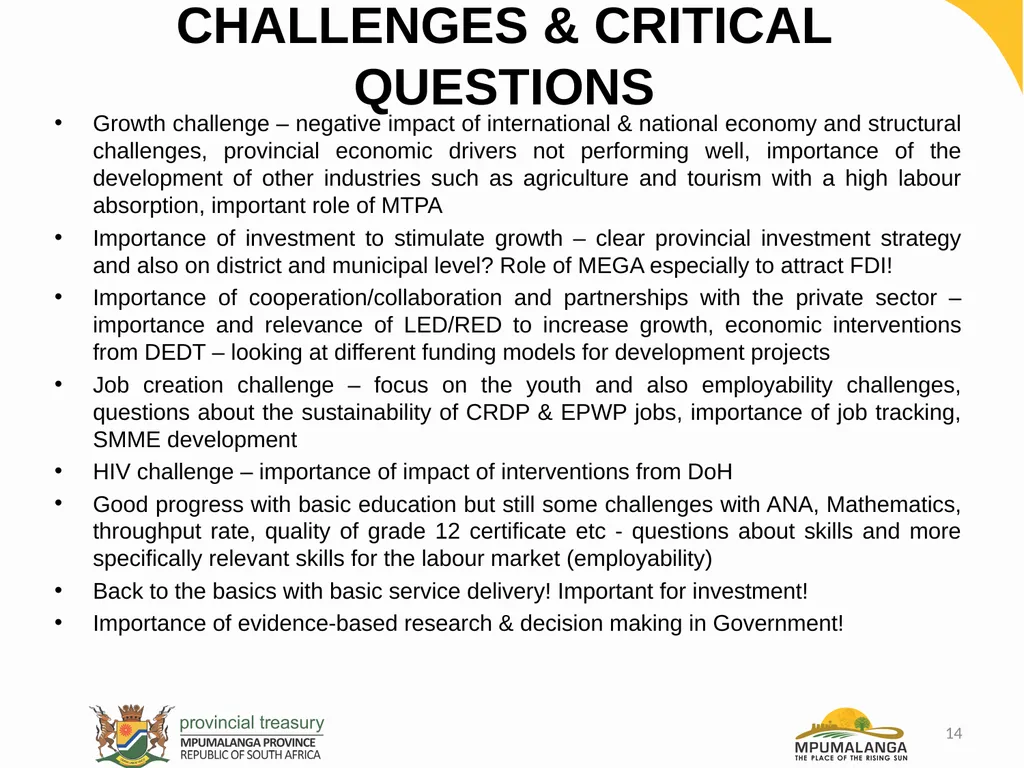
slide14. CHALLENGES & CRITICAL QUESTIONS Growth challenge – negative impact of international & national economy and structural challenges, provincial economic drivers not performing well, importance of the development of other industries such as agriculture and tourism with a high labour absorption, important role of MTPA
Importance of investment to stimulate growth – clear provincial investment strategy and also on district and municipal level? Role of MEGA especially to attract FDI!
Importance of cooperation/collaboration and partnerships with the private sector – importance and relevance of LED/RED to increase growth, economic interventions from DEDT – looking at different funding models for development projects
Job creation challenge – focus on the youth and also employability challenges, questions about the sustainability of CRDP & EPWP jobs, importance of job tracking, SMME development
HIV challenge – importance of impact of interventions from DoH
Good progress with basic education but still some challenges with ANA, Mathematics, throughput rate, quality of grade 12 certificate etc - questions about skills and more specifically relevant skills for the labour market (employability)
Back to the basics with basic service delivery! Important for investment!
Importance of evidence-based research & decision making in Government! 14<br>
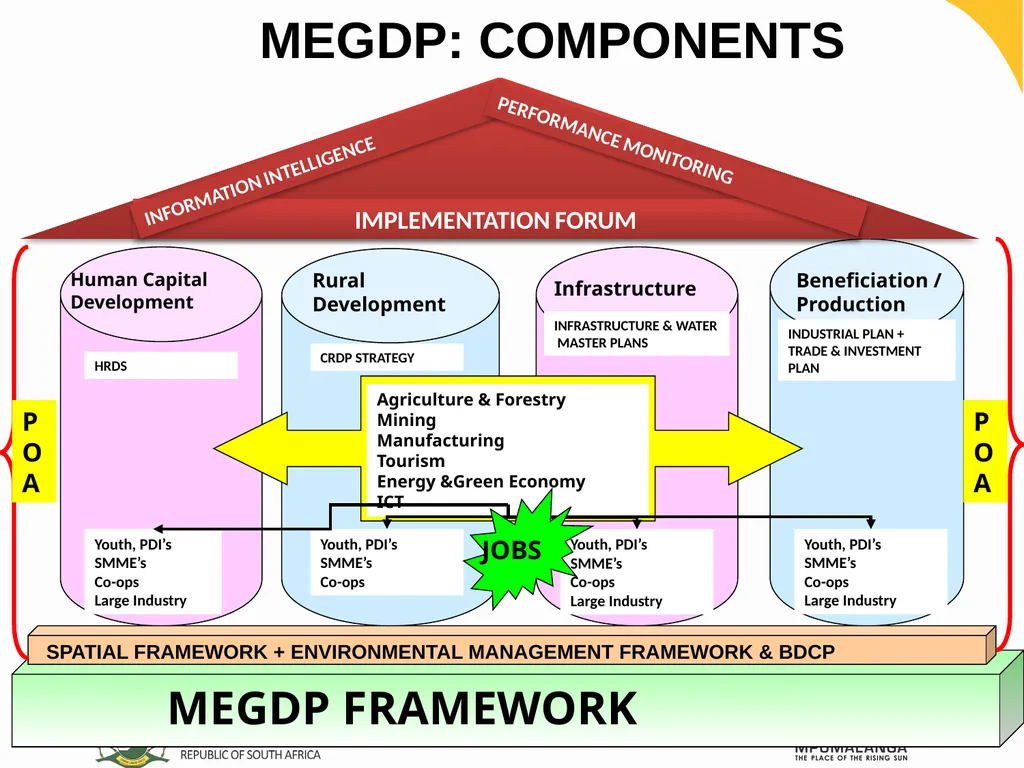
slide15. 15 15 15 Human Capital Development Rural Development Infrastructure Beneficiation /Production HRDS CRDP STRATEGY INFRASTRUCTURE & WATER MASTER PLANS INDUSTRIAL PLAN + TRADE & INVESTMENT PLAN Youth, PDI’s
SMME’s
Co-ops
Large Industry Youth, PDI’s
SMME’s
Co-ops Youth, PDI’s
SMME’s
Co-ops
Large Industry Youth, PDI’s
SMME’s
Co-ops
Large Industry MEGDP: COMPONENTS 15<br>
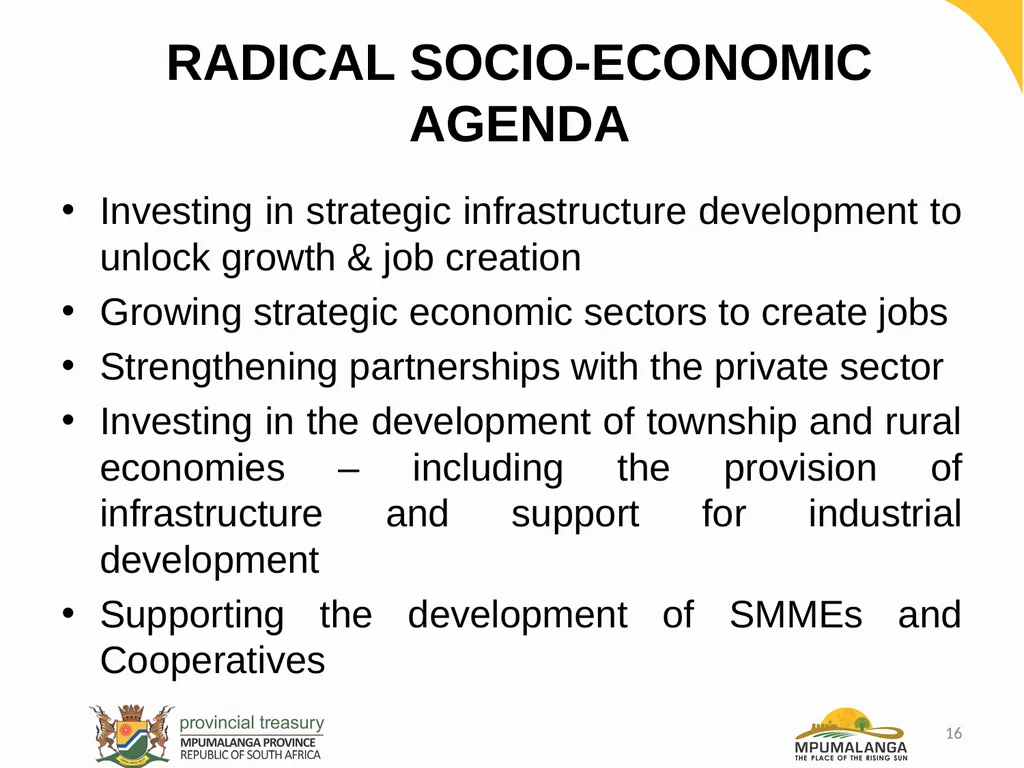
slide16. RADICAL SOCIO-ECONOMIC AGENDA Investing in strategic infrastructure development to unlock growth & job creation
Growing strategic economic sectors to create jobs
Strengthening partnerships with the private sector
Investing in the development of township and rural economies – including the provision of infrastructure and support for industrial development
Supporting the development of SMMEs and Cooperatives 16<br>
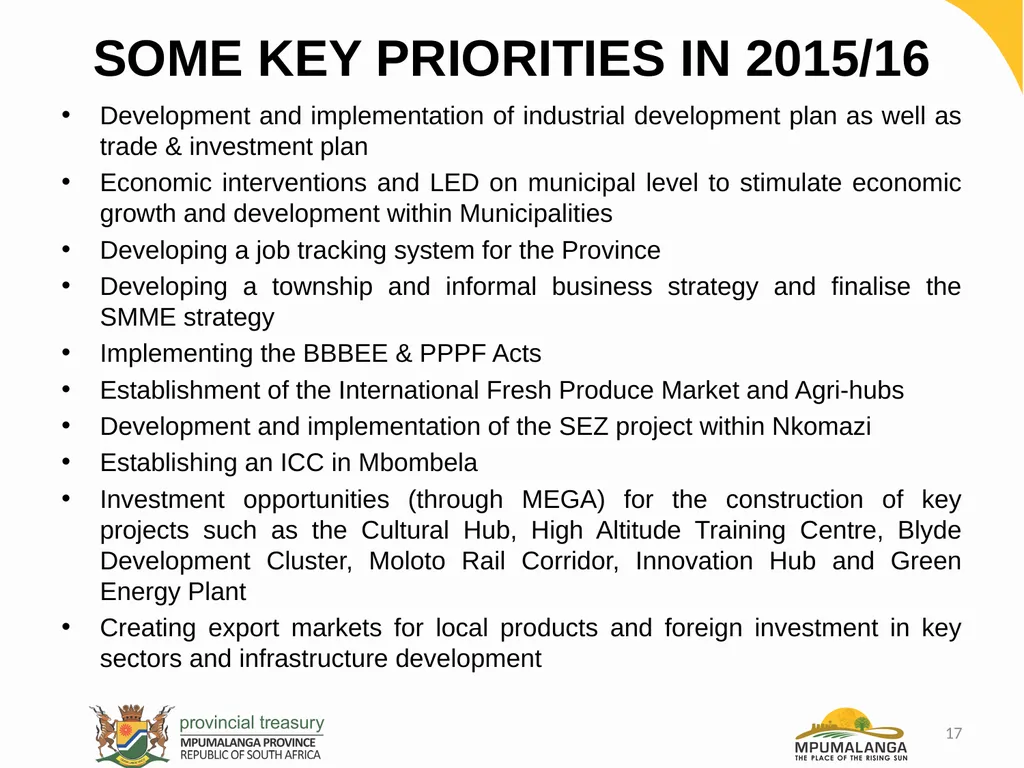
slide17. SOME KEY PRIORITIES IN 2015/16 Development and implementation of industrial development plan as well as trade & investment plan
Economic interventions and LED on municipal level to stimulate economic growth and development within Municipalities
Developing a job tracking system for the Province
Developing a township and informal business strategy and finalise the SMME strategy
Implementing the BBBEE & PPPF Acts
Establishment of the International Fresh Produce Market and Agri-hubs
Development and implementation of the SEZ project within Nkomazi
Establishing an ICC in Mbombela
Investment opportunities (through MEGA) for the construction of key projects such as the Cultural Hub, High Altitude Training Centre, Blyde Development Cluster, Moloto Rail Corridor, Innovation Hub and Green Energy Plant
Creating export markets for local products and foreign investment in key sectors and infrastructure development 17<br>
slide18. Thank you 18<br>
slide19. ANNEXURE 19<br>
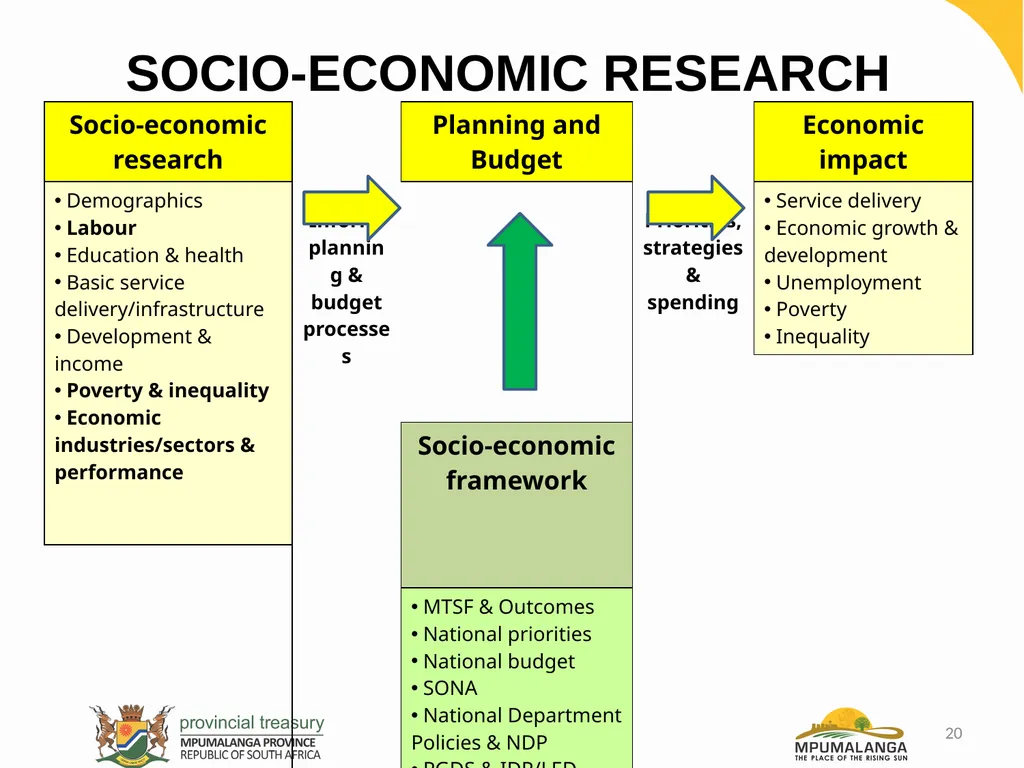
slide20. SOCIO-ECONOMIC RESEARCH 20<br>
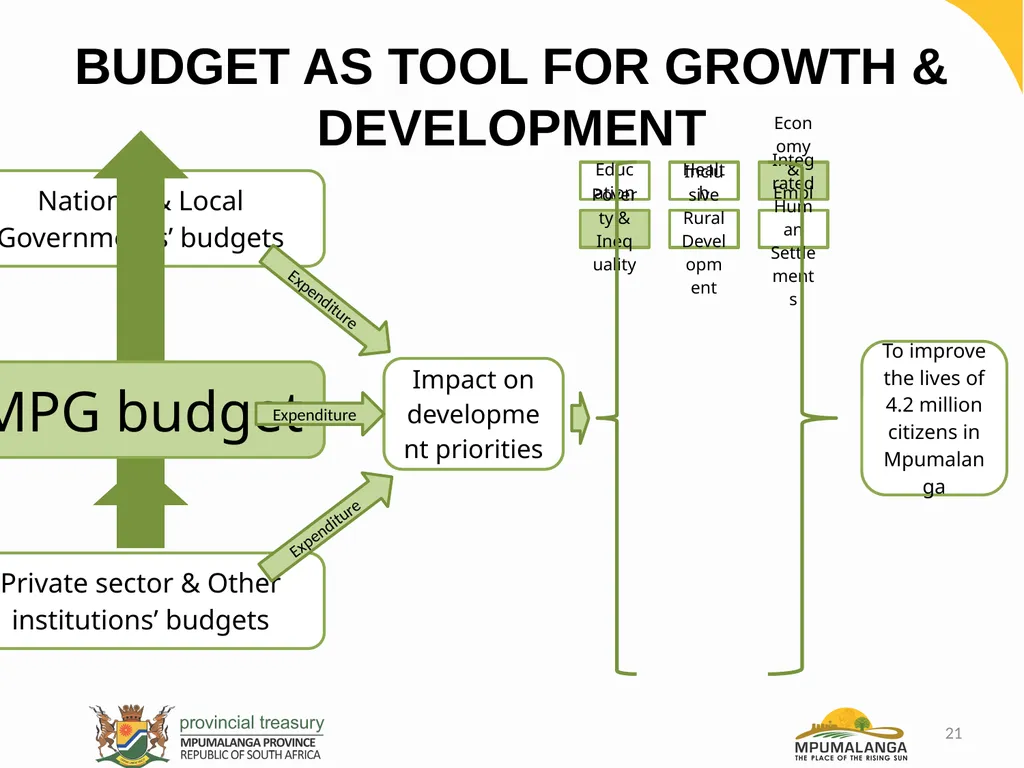
slide21. BUDGET AS TOOL FOR GROWTH & DEVELOPMENT Expenditure Expenditure Expenditure 21<br>
slide22. 22 Population 2001
3.4
million
Population
2014
4.2
million Between 2001 & 2014 the population of Mpumalanga grew by 863 700 9 out of 10 people were black African 0-34 yrs = 69.9% 7.8% 7.5%<br>
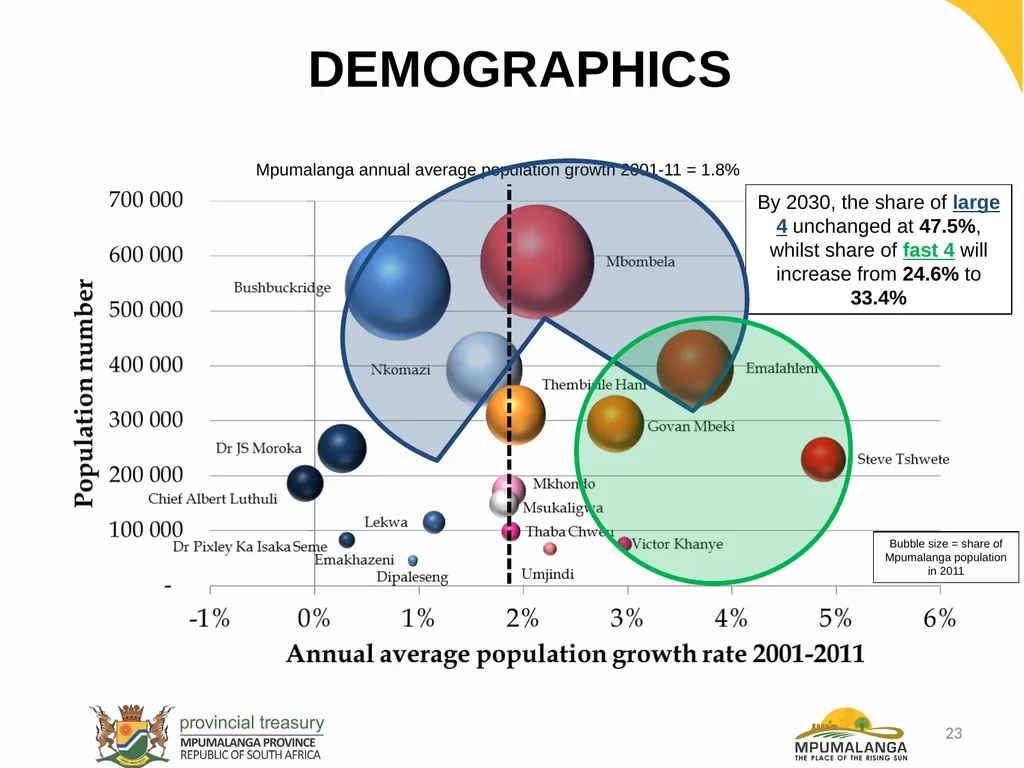
slide23. DEMOGRAPHICS Mpumalanga annual average population growth 2001-11 = 1.8% Bubble size = share of Mpumalanga population in 2011 By 2030, the share of large 4 unchanged at 47.5%, whilst share of fast 4 will increase from 24.6% to 33.4% 23<br>
slide24. ECONOMIC PERFORMANCE INDUSTRY GROWTH & CONTRIBUTION
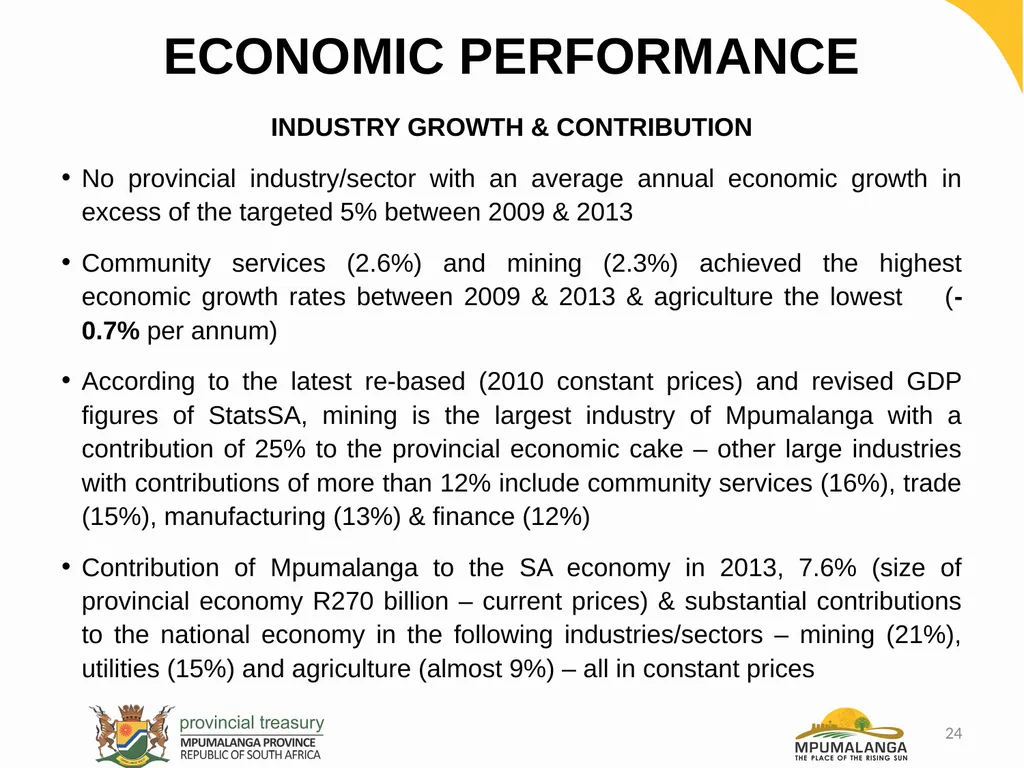
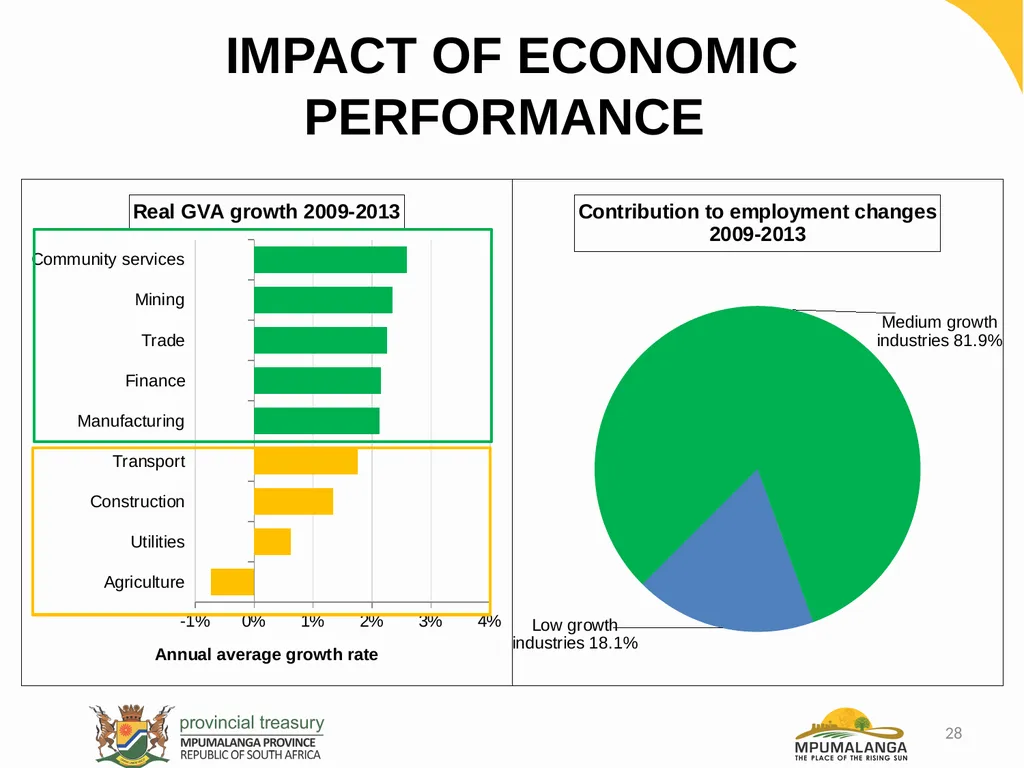
No provincial industry/sector with an average annual economic growth in excess of the targeted 5% between 2009 & 2013
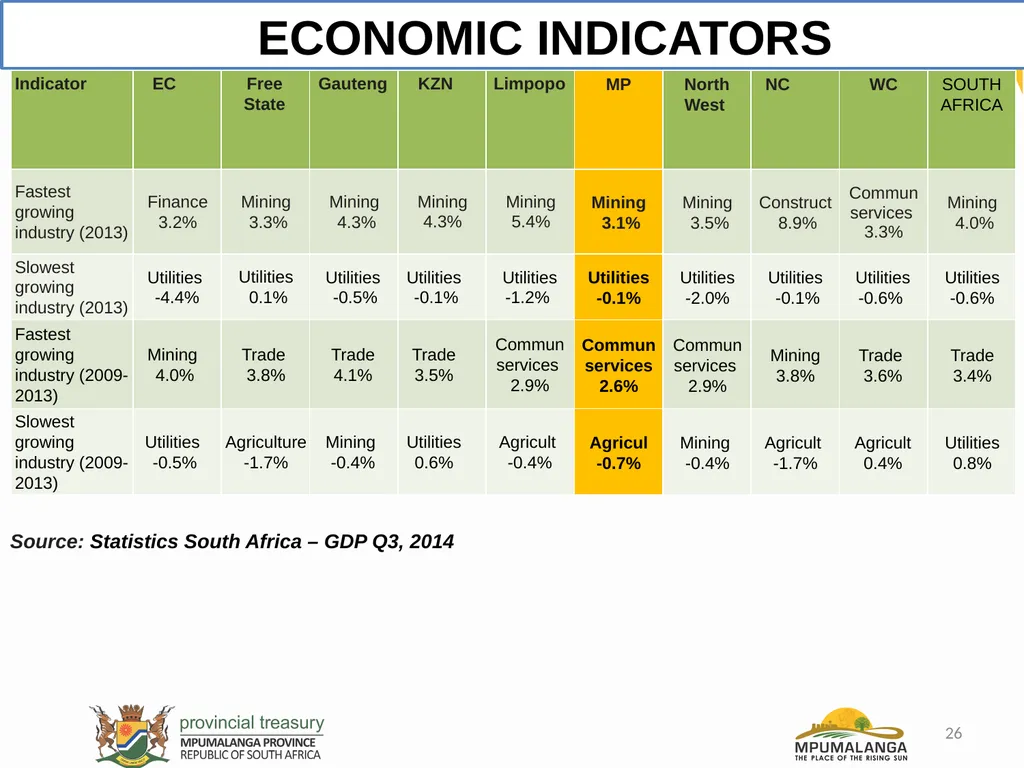
Community services (2.6%) and mining (2.3%) achieved the highest economic growth rates between 2009 & 2013 & agriculture the lowest (-0.7% per annum)
According to the latest re-based (2010 constant prices) and revised GDP figures of StatsSA, mining is the largest industry of Mpumalanga with a contribution of 25% to the provincial economic cake – other large industries with contributions of more than 12% include community services (16%), trade (15%), manufacturing (13%) & finance (12%)
Contribution of Mpumalanga to the SA economy in 2013, 7.6% (size of provincial economy R270 billion – current prices) & substantial contributions to the national economy in the following industries/sectors – mining (21%), utilities (15%) and agriculture (almost 9%) – all in constant prices 24<br>
slide25. ECONOMIC INDICATORS Source: Statistics South Africa – GDP Q3, 2014 25<br>
slide26. ECONOMIC INDICATORS Source: Statistics South Africa – GDP Q3, 2014 26<br>
slide27. 27 1 2 3 1.7% in 2013 & 2.7% 1995-13<br>
slide28. IMPACT OF ECONOMIC PERFORMANCE 28<br>
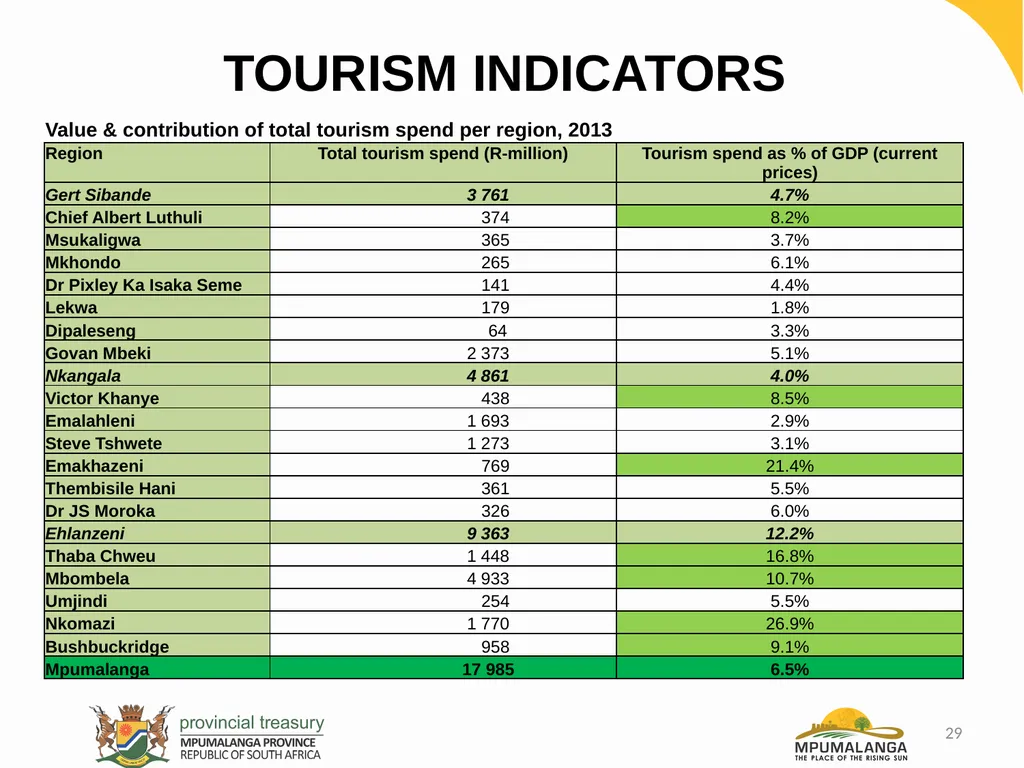
slide29. TOURISM INDICATORS 29<br>
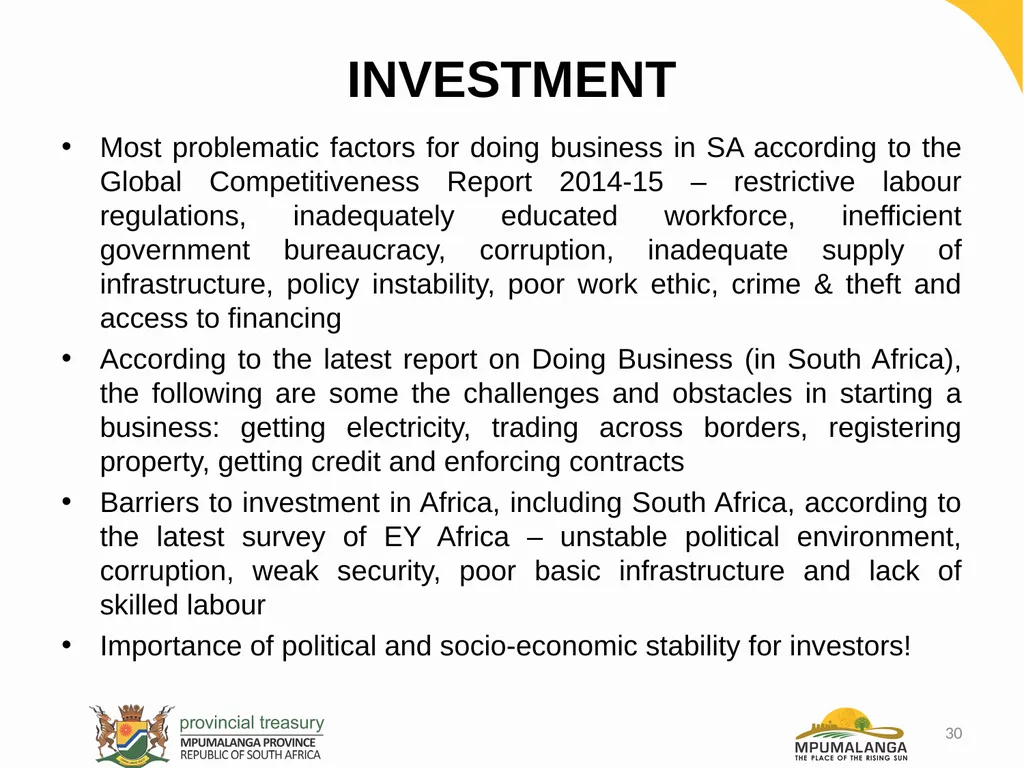
slide30. INVESTMENT Most problematic factors for doing business in SA according to the Global Competitiveness Report 2014-15 – restrictive labour regulations, inadequately educated workforce, inefficient government bureaucracy, corruption, inadequate supply of infrastructure, policy instability, poor work ethic, crime & theft and access to financing
According to the latest report on Doing Business (in South Africa), the following are some the challenges and obstacles in starting a business: getting electricity, trading across borders, registering property, getting credit and enforcing contracts
Barriers to investment in Africa, including South Africa, according to the latest survey of EY Africa – unstable political environment, corruption, weak security, poor basic infrastructure and lack of skilled labour
Importance of political and socio-economic stability for investors! 30<br>
slide31. 31 1 2 3 160 302 = 22 900 pa 2.4% growth from 2014-15 2.2% 2008-15<br>
slide32. EMPLOYMENT PER INDUSTRY 32<br>
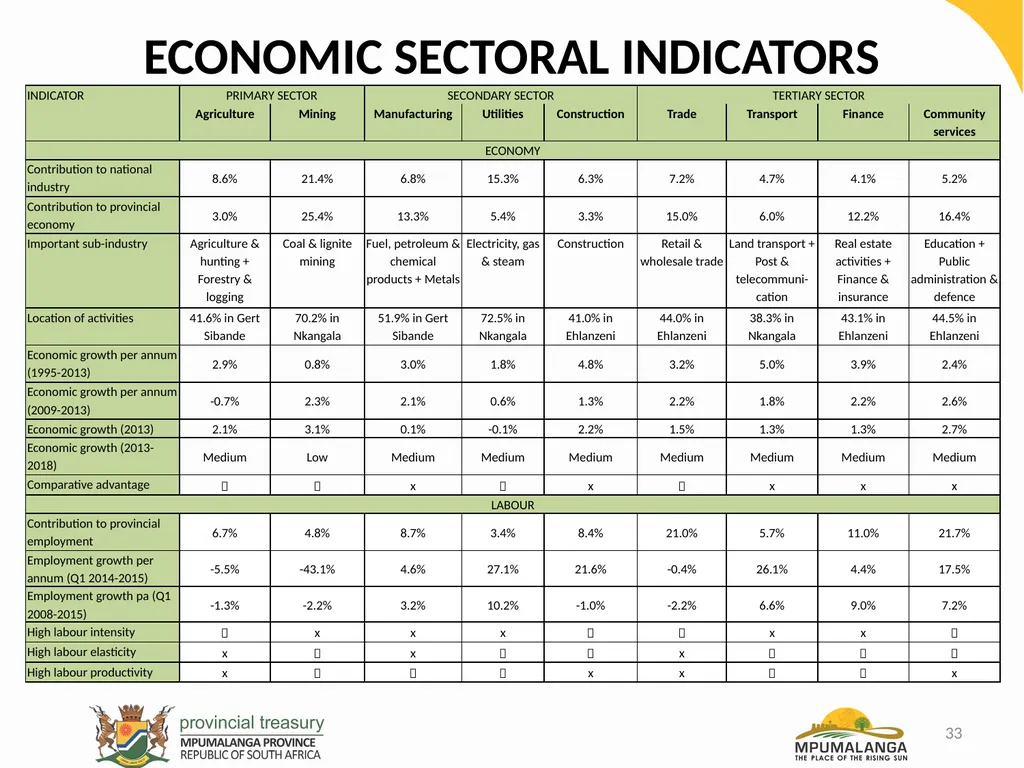
slide33. ECONOMIC SECTORAL INDICATORS 33<br>
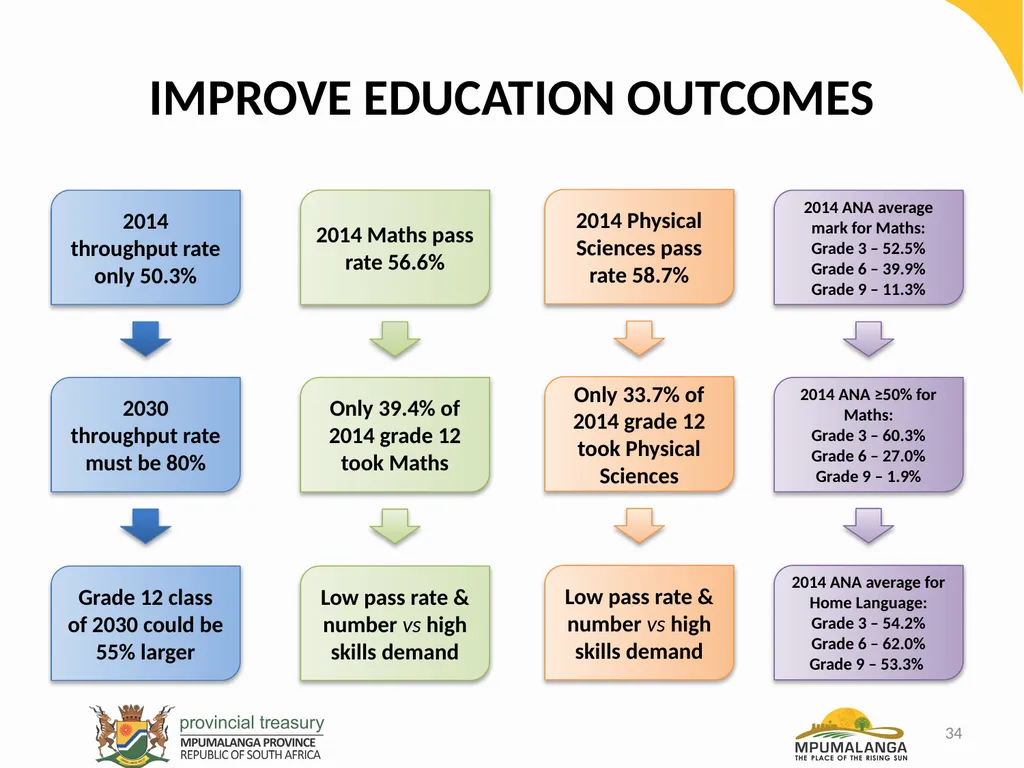
slide34. IMPROVE EDUCATION OUTCOMES 34<br>
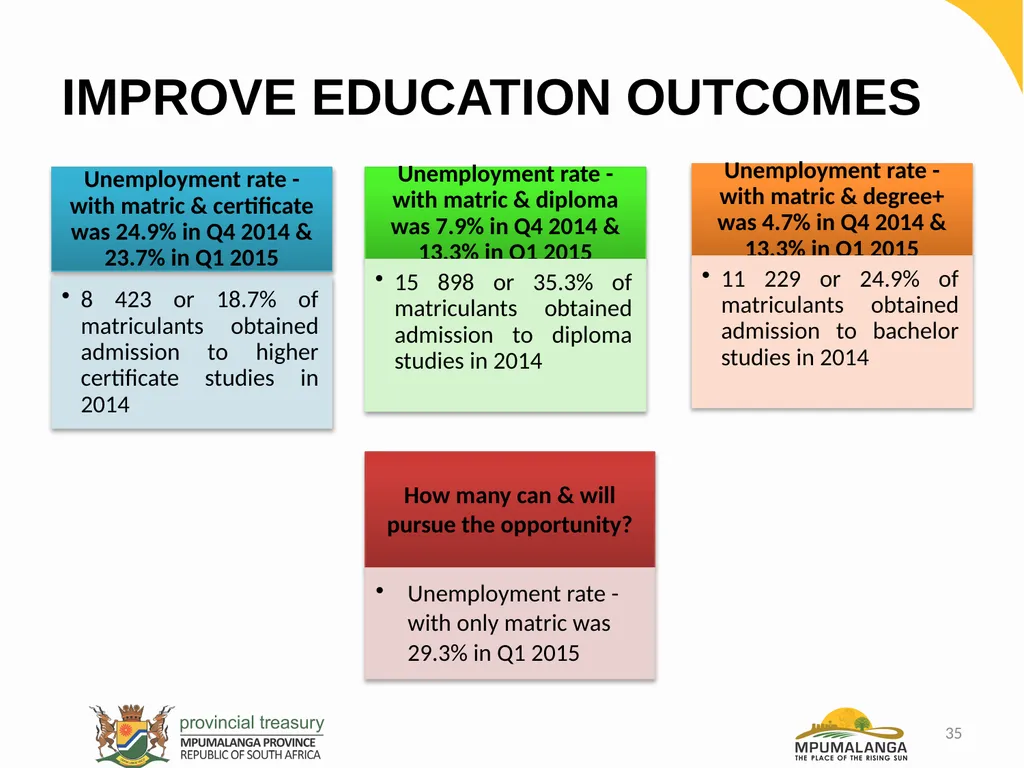
slide35. IMPROVE EDUCATION OUTCOMES Unemployment rate - with matric & certificate was 24.9% in Q4 2014 & 23.7% in Q1 2015 8 423 or 18.7% of matriculants obtained admission to higher certificate studies in 2014 35<br>
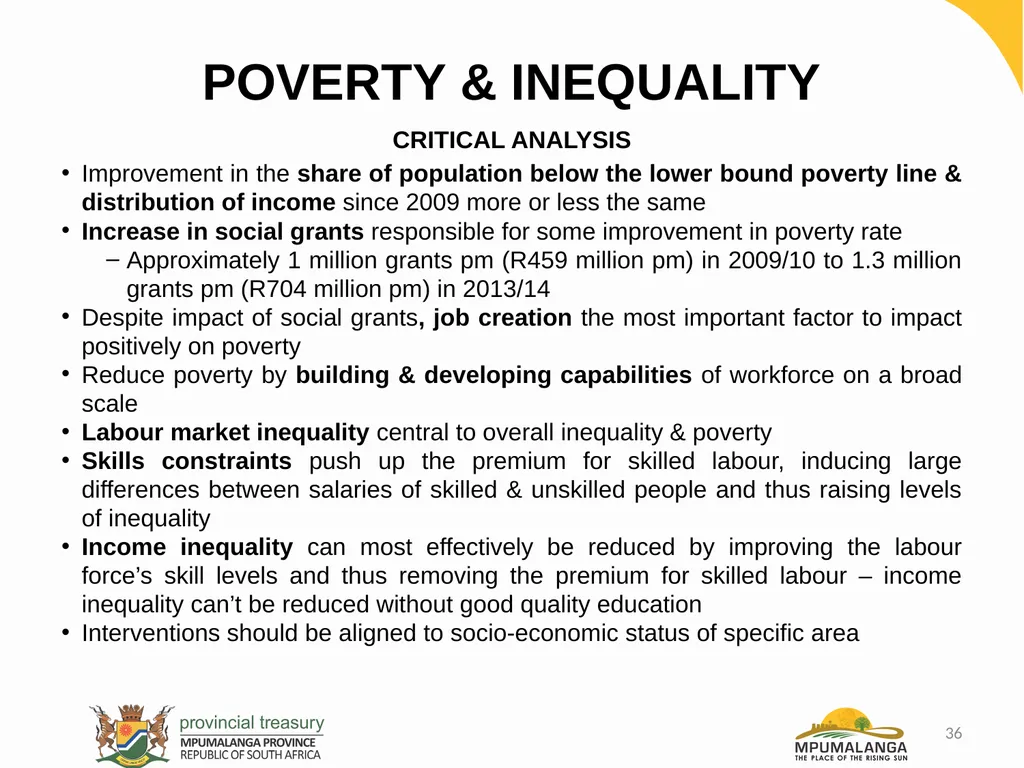
slide36. POVERTY & INEQUALITY CRITICAL ANALYSIS
Improvement in the share of population below the lower bound poverty line & distribution of income since 2009 more or less the same
Increase in social grants responsible for some improvement in poverty rate
Approximately 1 million grants pm (R459 million pm) in 2009/10 to 1.3 million grants pm (R704 million pm) in 2013/14
Despite impact of social grants, job creation the most important factor to impact positively on poverty
Reduce poverty by building & developing capabilities of workforce on a broad scale
Labour market inequality central to overall inequality & poverty
Skills constraints push up the premium for skilled labour, inducing large differences between salaries of skilled & unskilled people and thus raising levels of inequality
Income inequality can most effectively be reduced by improving the labour force’s skill levels and thus removing the premium for skilled labour – income inequality can’t be reduced without good quality education
Interventions should be aligned to socio-economic status of specific area 36<br>
slide37. POLICY RESPONSE 37<br>
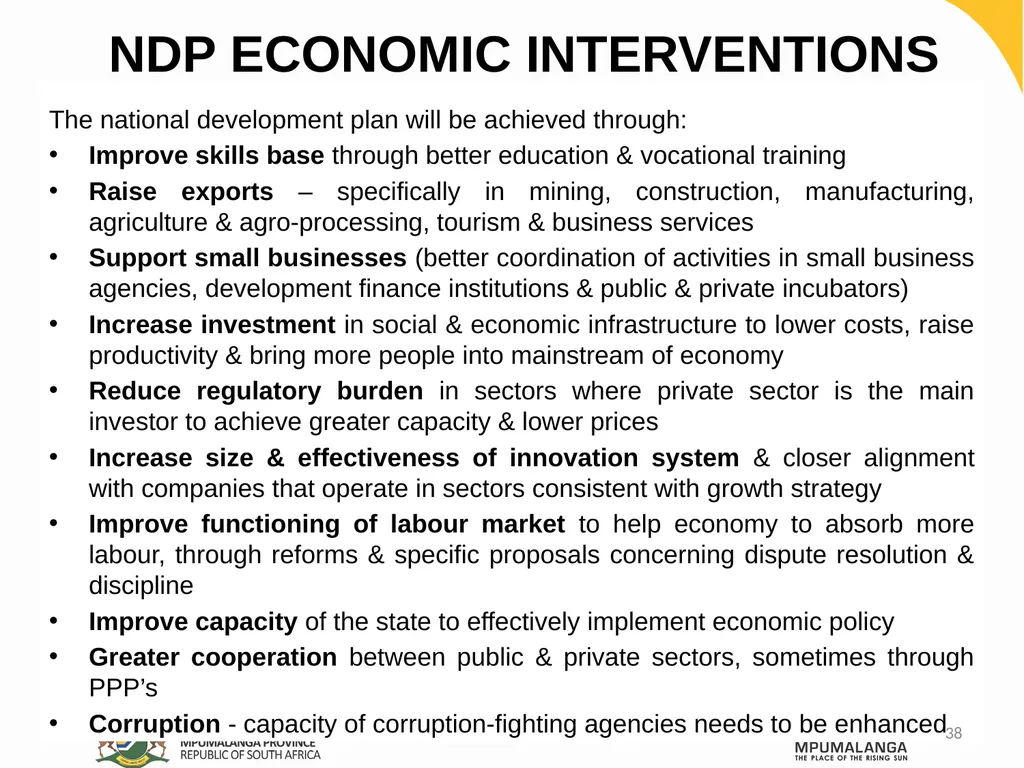
slide38. The national development plan will be achieved through:
Improve skills base through better education & vocational training
Raise exports – specifically in mining, construction, manufacturing, agriculture & agro-processing, tourism & business services
Support small businesses (better coordination of activities in small business agencies, development finance institutions & public & private incubators)
Increase investment in social & economic infrastructure to lower costs, raise productivity & bring more people into mainstream of economy
Reduce regulatory burden in sectors where private sector is the main investor to achieve greater capacity & lower prices
Increase size & effectiveness of innovation system & closer alignment with companies that operate in sectors consistent with growth strategy
Improve functioning of labour market to help economy to absorb more labour, through reforms & specific proposals concerning dispute resolution & discipline
Improve capacity of the state to effectively implement economic policy
Greater cooperation between public & private sectors, sometimes through PPP’s
Corruption - capacity of corruption-fighting agencies needs to be enhanced NDP ECONOMIC INTERVENTIONS 38<br>
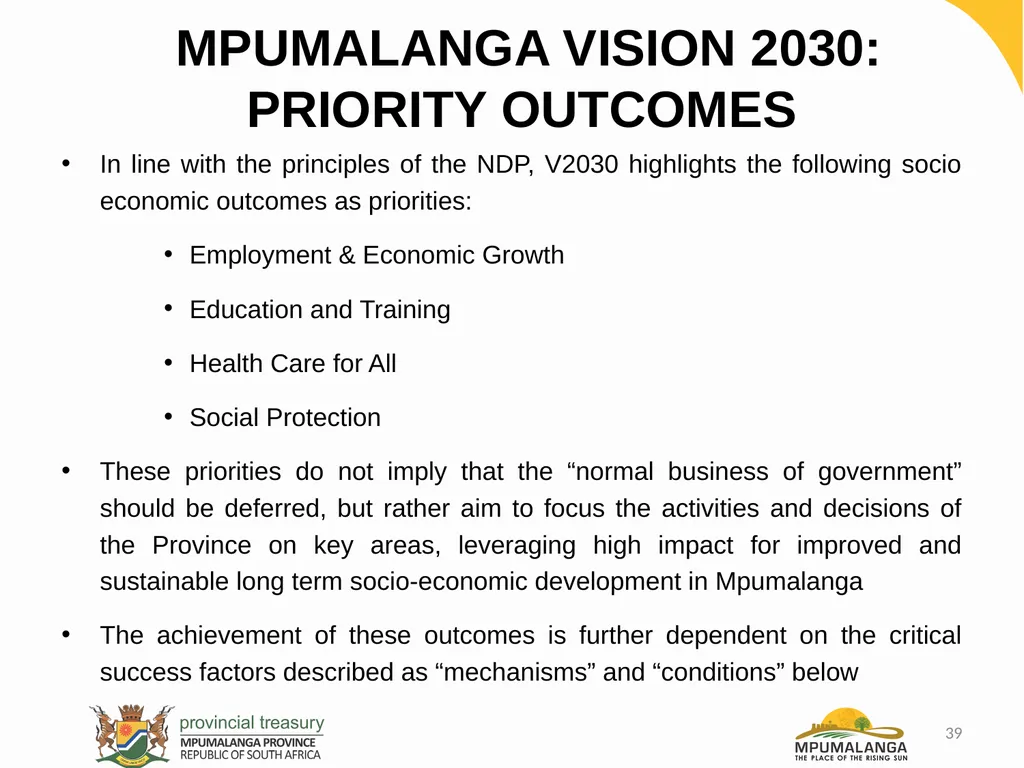
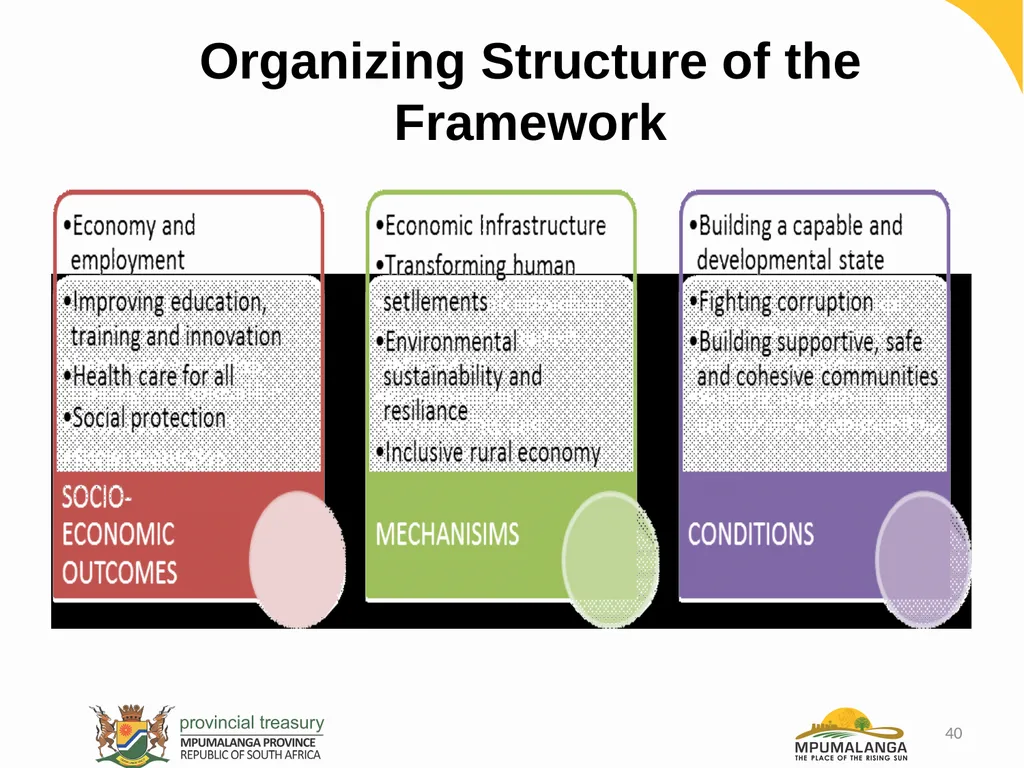
slide39. MPUMALANGA VISION 2030: PRIORITY OUTCOMES In line with the principles of the NDP, V2030 highlights the following socio economic outcomes as priorities:
Employment & Economic Growth
Education and Training
Health Care for All
Social Protection
These priorities do not imply that the “normal business of government” should be deferred, but rather aim to focus the activities and decisions of the Province on key areas, leveraging high impact for improved and sustainable long term socio-economic development in Mpumalanga
The achievement of these outcomes is further dependent on the critical success factors described as “mechanisms” and “conditions” below 39<br>
slide40. Organizing Structure of the Framework 40<br>
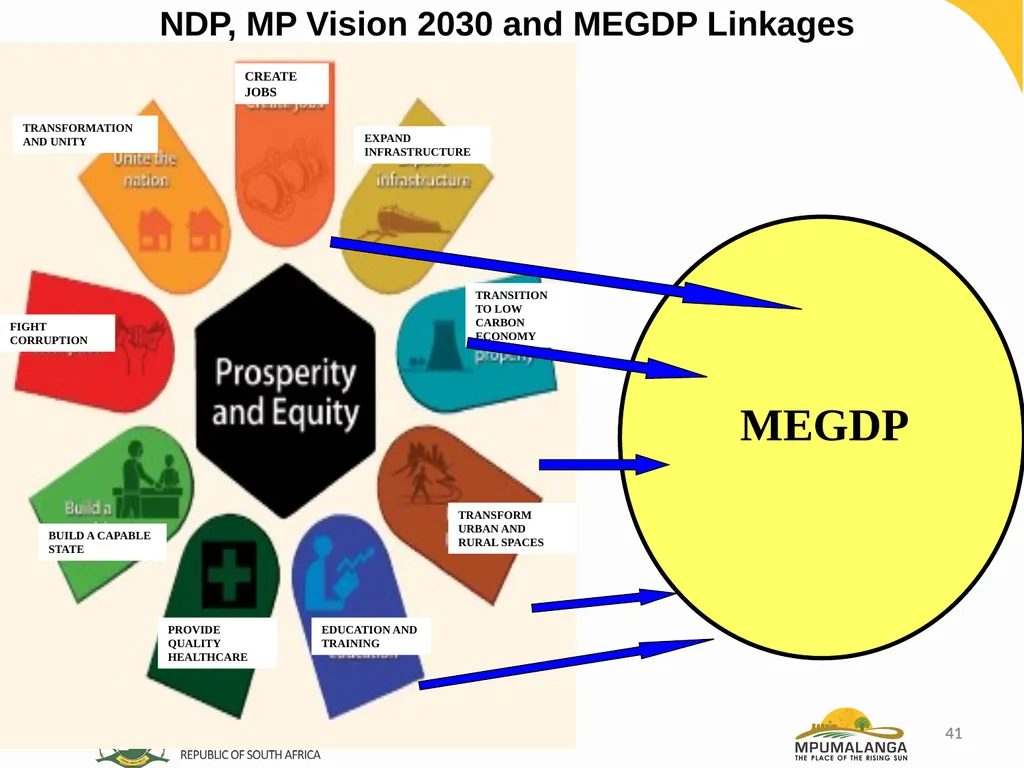
slide41. 41 NDP, MP Vision 2030 and MEGDP Linkages 41<br>
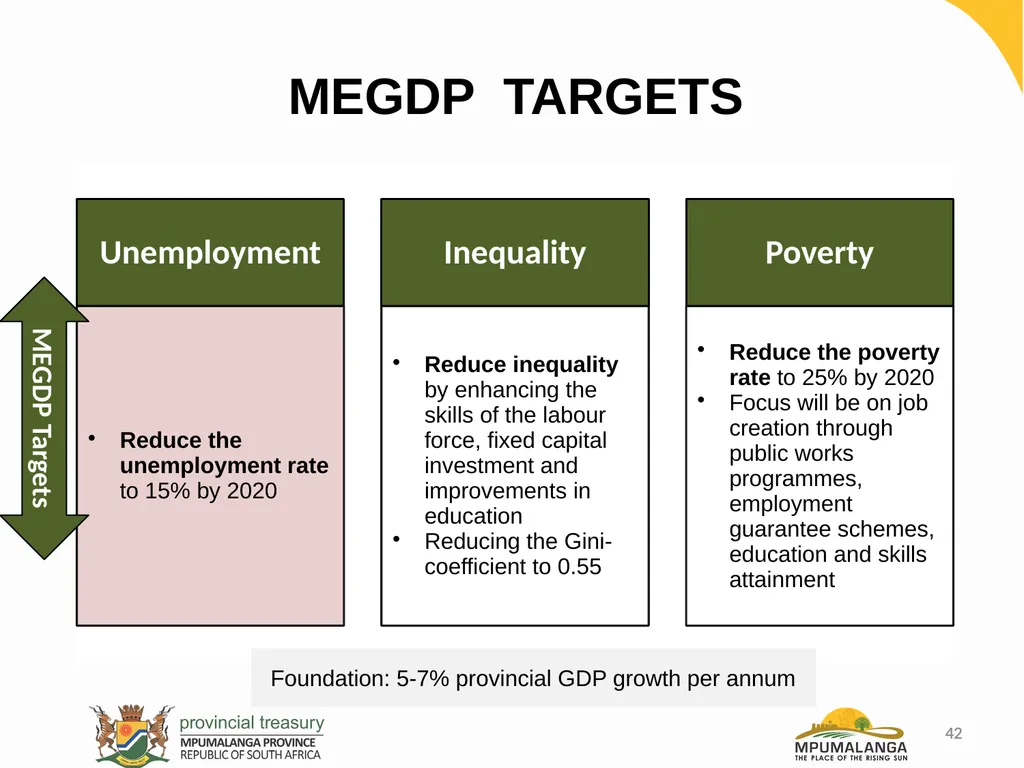
slide42. 42 MEGDP TARGETS MEGDP Targets Foundation: 5-7% provincial GDP growth per annum 42<br>
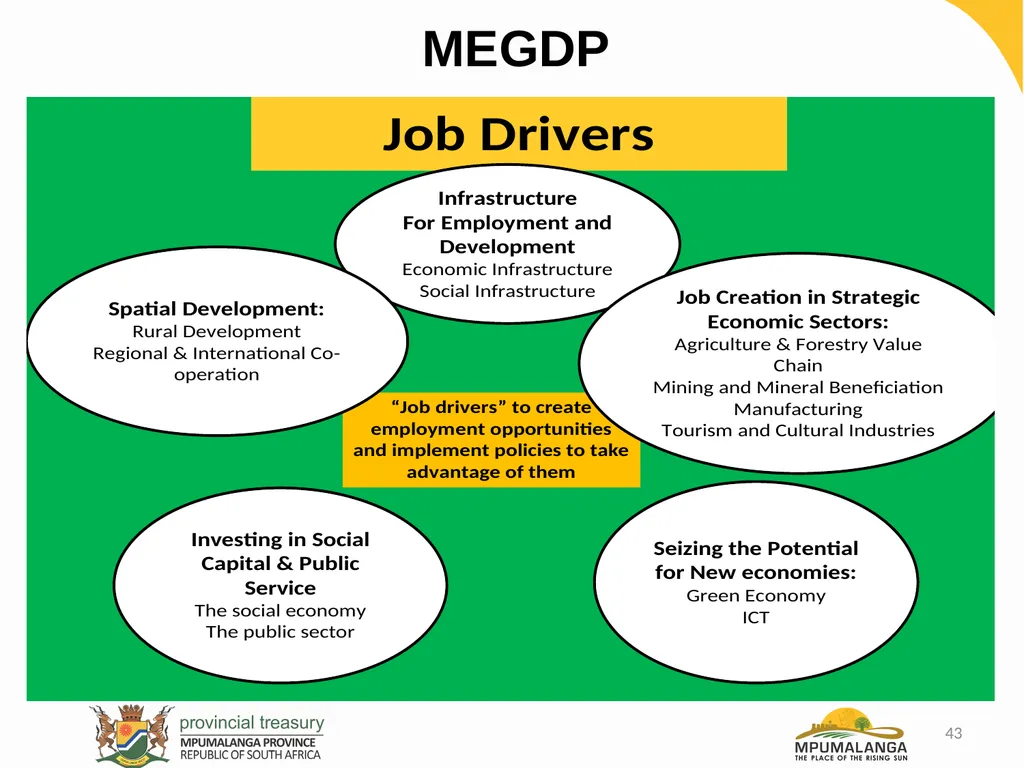
slide43. MEGDP 43<br>
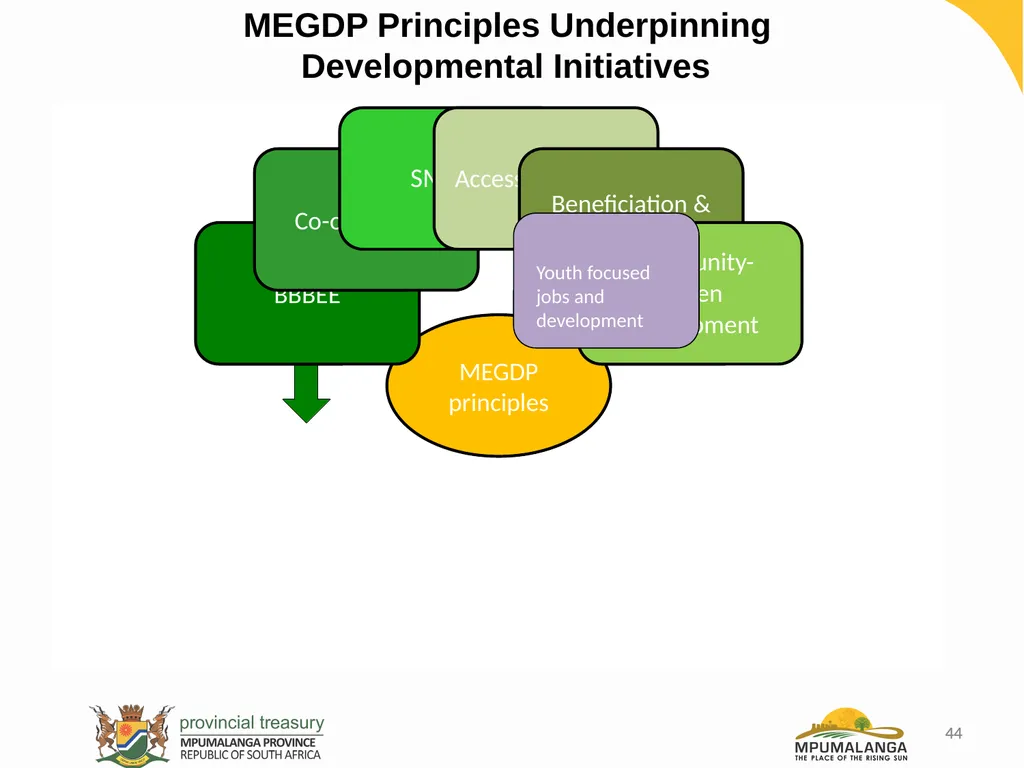
slide44. 44 MEGDP Principles Underpinning
Developmental Initiatives 44<br>
slide2. PURPOSE OF PRESENTATION The purpose of this short presentation is to inform the Committee about the Mpumalanga economy in terms of its performance, challenges and policy response – see also annexure for more detail
Provides an essential reference to policy makers for the formulation, implementation and evaluation of public policies & programmes aimed at improving the quality of life of our 4.2 million Mpumalanga citizens
Should inform our radical economic transformation agenda and also assist with the implementation of the National Development Plan (NDP), Provincial Vision 2030 and the Mpumalanga Economic Growth & Development Path (MEGDP)
Presentation based on especially the 2014/15 PERO (Provincial Economic Review and Outlook) report of Mpumalanga Provincial Treasury – see published PERO
Primary source of information Statistics South Africa – also other credible sources such as IHS Global Insight’s ReX (Regional Explorer) 2<br>
slide3. SOCIO-ECONOMIC CHALLENGES OF MPUMALANGA 3<br>
slide4. In 2014, Mpumalanga’s percentage share of the national population of 54.0 million was 7.8%, or 4.2 million.
Mpumalanga’s contribution to the national economy was the fifth largest with a share of 7.6% in 2013.
Provincial GDP growth of 1.7% for 2013 was lower than national growth of 2.2%.
Provincial GDP growth of 2.2% forecasted for 2013-2018 is lower than the expected national growth rate of 2.6%.
In 2013, the three largest contributors (constant prices) to the provincial economy were mining (25.4%), community services (16.4%) and trade (15.0%).
In total over the last year (Q1 2014 to Q1 2015), Mpumalanga recorded 27 478 more jobs.
According to Statistics South Africa, Mpumalanga recorded the joint fourth highest strict unemployment rate in the first quarter of 2015 among the nine provinces, at 28.4%. The expanded unemployment rate was at 40.7% in the same quarter.
The male unemployment rate was 25.9%, the female unemployment 31.7% and the youth (15-34 years – StatsSA definition) unemployment rate 38.8%.
The poorest 40% of households in Mpumalanga earned 7.5% of income in 2013, which was higher (better) than the national figure of 6.7% for 2013.
In 2013, 36.2% (declining trend) or 1.5 million of the Mpumalanga population lived below the so-called lower bound poverty line (of Statistics South Africa). KEY ECONOMIC STATS 4<br>
slide5. KEY ECONOMIC INDICATORS Sources: Statistics South Africa – GDP Q3, 2014
Statistics South Africa – QLFS, 2015
IHS Global Insight – ReX, January 2015 5<br>
slide6. ECONOMIC PERFORMANCE ECONOMIC GROWTH RESULTS & FORECAST
Economic growth target set at minimum average annual GDP growth of 5% (structural challenges – energy constraints, skills etc)
Average annual economic growth rate for Mpumalanga 2.7% over the period 1995 to 2013 - mining industry’s growth only 0.8% per annum for the same period
Provincial growth lower than national growth with the exception of 1995-1999
Before the recession the end of 2008, the provincial growth rate was more than 4% per annum between 2005 & 2007
Between 2009 & 2013, Mpumalanga’s GDP growth was only 2.2% per annum
Growth nationally in 2014 not good – eventually 1.5% for full year – approximately 1.3% growth for Mpumalanga
National growth in the first quarter of 2015 very low at 1.3% - negative growth in agriculture and manufacturing
Forecasted average annual GDP growth for Mpumalanga between 2013 & 2018 just more than 2% per annum – global economic environment fragile & uneven – forecast for this year more or less 2% for South Africa and 1.9% for the province 6<br>
slide7. ECONOMIC INDICATORS Sources: Statistics SA – GDP Q3, 2014
Statistics SA – GHS, 2013
Statistics SA – Mid-year estimates, 2014 7<br>
slide8. JOB CREATION & UNEMPLOYMENT OBJECTIVE: TO CREATE EMPLOYMENT & REDUCE UNEMPLOYMENT
Total employment number must rise from more than 1.1 million to approximately 1.6 million in 2020 & to 2.4 million by 2030
On average more than 81 000 new & sustainable jobs must be created annually up to 2030 – employment growth of 4.9% per annum
The unemployment rate must decrease to 15% by 2020 (MEGDP) & 6% by 2030 (NDP & Provincial Vision 2030) 8<br>
slide9. JOB CREATION TOTAL EMPLOYMENT CREATION & BY INDUSTRY
Net job creation 160 302 between Q1 2008 & Q1 2015 (7 year period) – average of 22 900 jobs pa – achieving approximately 29% of our annual job creation target!
Job losses over this 7 year period in agriculture, mining, construction & trade – high job creation in especially community services (almost 100 000 jobs) & finance
Net job gains of 16 010 jobs in the first quarter of 2015 & 27 478 on an annual basis
Employment growth of 2.4% on an annual basis (national average 2.7%)
Community services (37 171), construction (17 235) & transport (13 643) created the largest number of net jobs between Q1 2014 & Q1 2015
Mining (-42 204), private households (-11 114) and agriculture (-4 516) shed the largest number of jobs on an annual basis 9<br>
slide10. UNEMPLOYMENT The unemployment rate increased from 23.6% at the end of Q1 2008 to 28.4% at the end of Q1 2015 – increased in the 1st quarter of 2015
Mpumalanga’s unemployment rate was 5th highest among the 9 provinces at the end of Q1 2008 & joint 4th highest at the end of Q1 2015
Specific unemployment rates at the end of Q1 2015:
Male = 25.9%
Female = 31.7%
Youth unemployment rate = 38.8% (according to the definition of StatsSA of 15-34 yr)
66.0% of the unemployed in Mpumalanga indicated that they have been unemployed in excess of 12 months
The number of unemployed increased from 306 418 in Q1 2008 to 457 754 in Q1 2015 – 151 336 and almost 50% increase !
The unemployed youth (15-34 yr) was 70% of the total unemployed people at the end of Q1 2015! 10<br>
slide11. POVERTY & INEQUALITY OBJECTIVE TO REDUCE POVERTY & INCOME INEQUALITY
The poverty rate is targeted to be at least 25% by 2020 (MEGDP) & at least 5% by 2030 (Vision 2030)
Reduce the Gini-coefficient in Mpumalanga to at least 0.60 by 2030 (NDP & Vision 2030)
The proportion of income earned by the bottom 40% in Mpumalanga should rise to 10% by 2030 (NDP & Vision 2030) 11<br>
slide12. POVERTY POVERTY RATE REDUCTION
The share of population in Mpumalanga below the so-called lower-bound poverty line (of StatsSA) declined/improved to 36.2% in 2013
2013 lower-bound poverty line = R513 per capita per month
In 2013, Mpumalanga’s share of population below the lower-bound poverty line was the 4th highest (unfavourable) among the provinces and slightly higher than the SA rate
The number of people below the lower bound poverty line declined from 1.998 million in 2009 to 1.52 million in 2013 – a decline/improvement of 480 892 people 12<br>
slide13. INEQUALITY REDUCTION IN INCOME INEQUALITY
The Gini-coefficient in Mpumalanga was unchanged between 2009 and 2013 at 0.62
Income in Mpumalanga was therefore as unequally distributed in 2013 than in 2009
In 2013, Mpumalanga’s Gini-coefficient was the 3rd highest (unfavourable) among the provinces, however, lower/better than SA’s Gini-coefficient of 0.64
The proportion of income earned by the bottom 40% in Mpumalanga remained unchanged at 7.5% between 2009 & 2013
Mpumalanga’s Palma ratio declined/improved slightly from 6.63 in 2009 to 6.53 in 2013
The Palma ratio reveals that for every R1 of total income that the poorest 40% earned, the richest 10% earned approximately R6.53 13<br>
slide14. CHALLENGES & CRITICAL QUESTIONS Growth challenge – negative impact of international & national economy and structural challenges, provincial economic drivers not performing well, importance of the development of other industries such as agriculture and tourism with a high labour absorption, important role of MTPA
Importance of investment to stimulate growth – clear provincial investment strategy and also on district and municipal level? Role of MEGA especially to attract FDI!
Importance of cooperation/collaboration and partnerships with the private sector – importance and relevance of LED/RED to increase growth, economic interventions from DEDT – looking at different funding models for development projects
Job creation challenge – focus on the youth and also employability challenges, questions about the sustainability of CRDP & EPWP jobs, importance of job tracking, SMME development
HIV challenge – importance of impact of interventions from DoH
Good progress with basic education but still some challenges with ANA, Mathematics, throughput rate, quality of grade 12 certificate etc - questions about skills and more specifically relevant skills for the labour market (employability)
Back to the basics with basic service delivery! Important for investment!
Importance of evidence-based research & decision making in Government! 14<br>
slide15. 15 15 15 Human Capital Development Rural Development Infrastructure Beneficiation /Production HRDS CRDP STRATEGY INFRASTRUCTURE & WATER MASTER PLANS INDUSTRIAL PLAN + TRADE & INVESTMENT PLAN Youth, PDI’s
SMME’s
Co-ops
Large Industry Youth, PDI’s
SMME’s
Co-ops Youth, PDI’s
SMME’s
Co-ops
Large Industry Youth, PDI’s
SMME’s
Co-ops
Large Industry MEGDP: COMPONENTS 15<br>
slide16. RADICAL SOCIO-ECONOMIC AGENDA Investing in strategic infrastructure development to unlock growth & job creation
Growing strategic economic sectors to create jobs
Strengthening partnerships with the private sector
Investing in the development of township and rural economies – including the provision of infrastructure and support for industrial development
Supporting the development of SMMEs and Cooperatives 16<br>
slide17. SOME KEY PRIORITIES IN 2015/16 Development and implementation of industrial development plan as well as trade & investment plan
Economic interventions and LED on municipal level to stimulate economic growth and development within Municipalities
Developing a job tracking system for the Province
Developing a township and informal business strategy and finalise the SMME strategy
Implementing the BBBEE & PPPF Acts
Establishment of the International Fresh Produce Market and Agri-hubs
Development and implementation of the SEZ project within Nkomazi
Establishing an ICC in Mbombela
Investment opportunities (through MEGA) for the construction of key projects such as the Cultural Hub, High Altitude Training Centre, Blyde Development Cluster, Moloto Rail Corridor, Innovation Hub and Green Energy Plant
Creating export markets for local products and foreign investment in key sectors and infrastructure development 17<br>
slide18. Thank you 18<br>
slide19. ANNEXURE 19<br>
slide20. SOCIO-ECONOMIC RESEARCH 20<br>
slide21. BUDGET AS TOOL FOR GROWTH & DEVELOPMENT Expenditure Expenditure Expenditure 21<br>
slide22. 22 Population 2001
3.4
million
Population
2014
4.2
million Between 2001 & 2014 the population of Mpumalanga grew by 863 700 9 out of 10 people were black African 0-34 yrs = 69.9% 7.8% 7.5%<br>
slide23. DEMOGRAPHICS Mpumalanga annual average population growth 2001-11 = 1.8% Bubble size = share of Mpumalanga population in 2011 By 2030, the share of large 4 unchanged at 47.5%, whilst share of fast 4 will increase from 24.6% to 33.4% 23<br>
slide24. ECONOMIC PERFORMANCE INDUSTRY GROWTH & CONTRIBUTION
No provincial industry/sector with an average annual economic growth in excess of the targeted 5% between 2009 & 2013
Community services (2.6%) and mining (2.3%) achieved the highest economic growth rates between 2009 & 2013 & agriculture the lowest (-0.7% per annum)
According to the latest re-based (2010 constant prices) and revised GDP figures of StatsSA, mining is the largest industry of Mpumalanga with a contribution of 25% to the provincial economic cake – other large industries with contributions of more than 12% include community services (16%), trade (15%), manufacturing (13%) & finance (12%)
Contribution of Mpumalanga to the SA economy in 2013, 7.6% (size of provincial economy R270 billion – current prices) & substantial contributions to the national economy in the following industries/sectors – mining (21%), utilities (15%) and agriculture (almost 9%) – all in constant prices 24<br>
slide25. ECONOMIC INDICATORS Source: Statistics South Africa – GDP Q3, 2014 25<br>
slide26. ECONOMIC INDICATORS Source: Statistics South Africa – GDP Q3, 2014 26<br>
slide27. 27 1 2 3 1.7% in 2013 & 2.7% 1995-13<br>
slide28. IMPACT OF ECONOMIC PERFORMANCE 28<br>
slide29. TOURISM INDICATORS 29<br>
slide30. INVESTMENT Most problematic factors for doing business in SA according to the Global Competitiveness Report 2014-15 – restrictive labour regulations, inadequately educated workforce, inefficient government bureaucracy, corruption, inadequate supply of infrastructure, policy instability, poor work ethic, crime & theft and access to financing
According to the latest report on Doing Business (in South Africa), the following are some the challenges and obstacles in starting a business: getting electricity, trading across borders, registering property, getting credit and enforcing contracts
Barriers to investment in Africa, including South Africa, according to the latest survey of EY Africa – unstable political environment, corruption, weak security, poor basic infrastructure and lack of skilled labour
Importance of political and socio-economic stability for investors! 30<br>
slide31. 31 1 2 3 160 302 = 22 900 pa 2.4% growth from 2014-15 2.2% 2008-15<br>
slide32. EMPLOYMENT PER INDUSTRY 32<br>
slide33. ECONOMIC SECTORAL INDICATORS 33<br>
slide34. IMPROVE EDUCATION OUTCOMES 34<br>
slide35. IMPROVE EDUCATION OUTCOMES Unemployment rate - with matric & certificate was 24.9% in Q4 2014 & 23.7% in Q1 2015 8 423 or 18.7% of matriculants obtained admission to higher certificate studies in 2014 35<br>
slide36. POVERTY & INEQUALITY CRITICAL ANALYSIS
Improvement in the share of population below the lower bound poverty line & distribution of income since 2009 more or less the same
Increase in social grants responsible for some improvement in poverty rate
Approximately 1 million grants pm (R459 million pm) in 2009/10 to 1.3 million grants pm (R704 million pm) in 2013/14
Despite impact of social grants, job creation the most important factor to impact positively on poverty
Reduce poverty by building & developing capabilities of workforce on a broad scale
Labour market inequality central to overall inequality & poverty
Skills constraints push up the premium for skilled labour, inducing large differences between salaries of skilled & unskilled people and thus raising levels of inequality
Income inequality can most effectively be reduced by improving the labour force’s skill levels and thus removing the premium for skilled labour – income inequality can’t be reduced without good quality education
Interventions should be aligned to socio-economic status of specific area 36<br>
slide37. POLICY RESPONSE 37<br>
slide38. The national development plan will be achieved through:
Improve skills base through better education & vocational training
Raise exports – specifically in mining, construction, manufacturing, agriculture & agro-processing, tourism & business services
Support small businesses (better coordination of activities in small business agencies, development finance institutions & public & private incubators)
Increase investment in social & economic infrastructure to lower costs, raise productivity & bring more people into mainstream of economy
Reduce regulatory burden in sectors where private sector is the main investor to achieve greater capacity & lower prices
Increase size & effectiveness of innovation system & closer alignment with companies that operate in sectors consistent with growth strategy
Improve functioning of labour market to help economy to absorb more labour, through reforms & specific proposals concerning dispute resolution & discipline
Improve capacity of the state to effectively implement economic policy
Greater cooperation between public & private sectors, sometimes through PPP’s
Corruption - capacity of corruption-fighting agencies needs to be enhanced NDP ECONOMIC INTERVENTIONS 38<br>
slide39. MPUMALANGA VISION 2030: PRIORITY OUTCOMES In line with the principles of the NDP, V2030 highlights the following socio economic outcomes as priorities:
Employment & Economic Growth
Education and Training
Health Care for All
Social Protection
These priorities do not imply that the “normal business of government” should be deferred, but rather aim to focus the activities and decisions of the Province on key areas, leveraging high impact for improved and sustainable long term socio-economic development in Mpumalanga
The achievement of these outcomes is further dependent on the critical success factors described as “mechanisms” and “conditions” below 39<br>
slide40. Organizing Structure of the Framework 40<br>
slide41. 41 NDP, MP Vision 2030 and MEGDP Linkages 41<br>
slide42. 42 MEGDP TARGETS MEGDP Targets Foundation: 5-7% provincial GDP growth per annum 42<br>
slide43. MEGDP 43<br>
slide44. 44 MEGDP Principles Underpinning
Developmental Initiatives 44<br>