"NIH Appropriations & Grant Trends: FY 2010 - 2020" is the property of its rightful owner. Permission is granted to
download and print the materials on this website for personal, non-commercial use only, and to display it
on your personal computer provided you do not modify the materials and that you retain all copyright
notices contained in the materials. By downloading content from our website, you accept the terms of this
agreement.
Presentation Transcript
01
NIH Appropriations & Grant Trends: FY 2010 - 2020 Produced by FASEB Office of Public Affairs<br>
02
The FY 2020 NIH budget is $41.6 billion ($2.3 billion increase)
5.9% increase
3.3% inflation-adjusted increase
President’s FY 2021 Budget Request: $38.7 billion, an effective cut of 9.2% after adjusting for inflation
FASEB’s FY 2021 Recommendation: At least $44.7 billion
7.4% increase
4.8% inflation-adjusted increase NIH Appropriations: 2010 – Present FASEB Rec. $44.7 FASEB Rec. $21.0 President’s Budget Request $38.7 President’s Budget Request $18.1 Appropriations data track total programmatic level funding, including Superfund activities and PHS evaluation funds. Inflation-adjusted (constant) dollars were calculated using the Biomedical Research and Development Price Index (BRDPI).
Sources: NIH Office of Budget, Appropriations History, Price Indexes, and Budget Request; FASEB Annual Federal Funding Recommendations Actual
Dollars Inflation-Adjusted Dollars (1995) Inflation-Adjusted Dollars (2010) President’s Budget Request $30.4 FASEB Rec. $35.1<br>
03
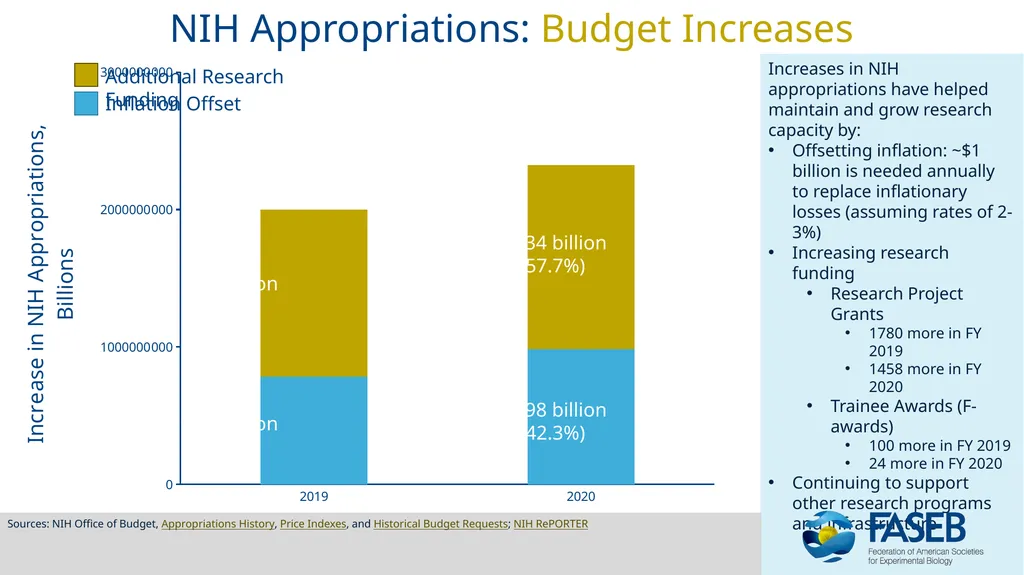
NIH Appropriations: Budget Increases Increases in NIH appropriations have helped maintain and grow research capacity by:
Offsetting inflation: ~$1 billion is needed annually to replace inflationary losses (assuming rates of 2-3%)
Increasing research funding
Research Project Grants
1780 more in FY 2019
1458 more in FY 2020
Trainee Awards (F-awards)
100 more in FY 2019
24 more in FY 2020
Continuing to support other research programs and infrastructure Sources: NIH Office of Budget, Appropriations History, Price Indexes, and Historical Budget Requests; NIH RePORTER Additional Research Funding $1.22 billion
(60.9%) $0.78 billion
(39.1%) $1.34 billion
(57.7%) $0.98 billion
(42.3%) Inflation Offset<br>
04
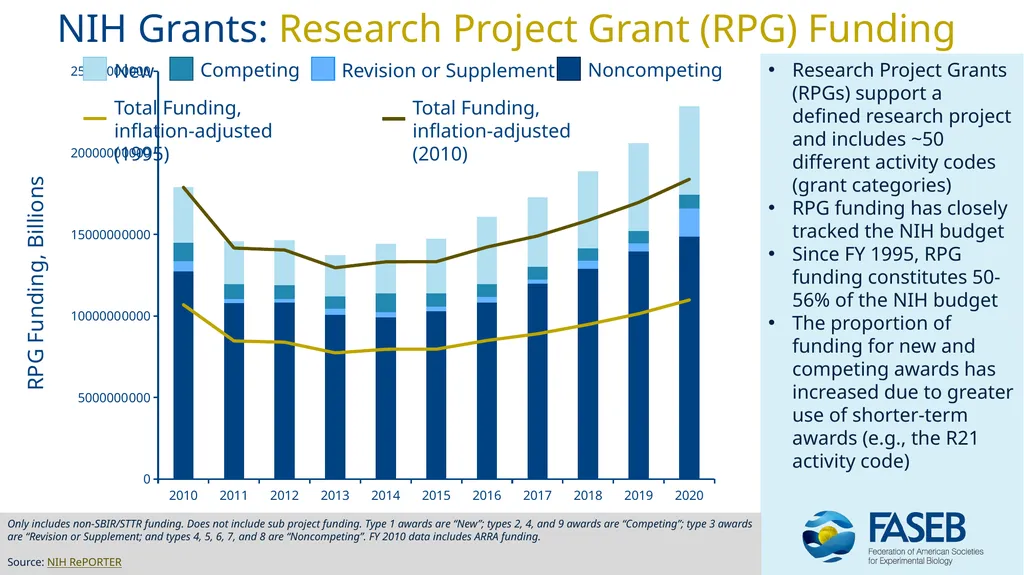
NIH Grants: Research Project Grant (RPG) Funding Research Project Grants (RPGs) support a defined research project and includes ~50 different activity codes (grant categories)
RPG funding has closely tracked the NIH budget
Since FY 1995, RPG funding constitutes 50-56% of the NIH budget
The proportion of funding for new and competing awards has increased due to greater use of shorter-term awards (e.g., the R21 activity code) Only includes non-SBIR/STTR funding. Does not include sub project funding. Type 1 awards are “New”; types 2, 4, and 9 awards are “Competing”; type 3 awards are “Revision or Supplement; and types 4, 5, 6, 7, and 8 are “Noncompeting”. FY 2010 data includes ARRA funding.
Source: NIH RePORTER<br>
05
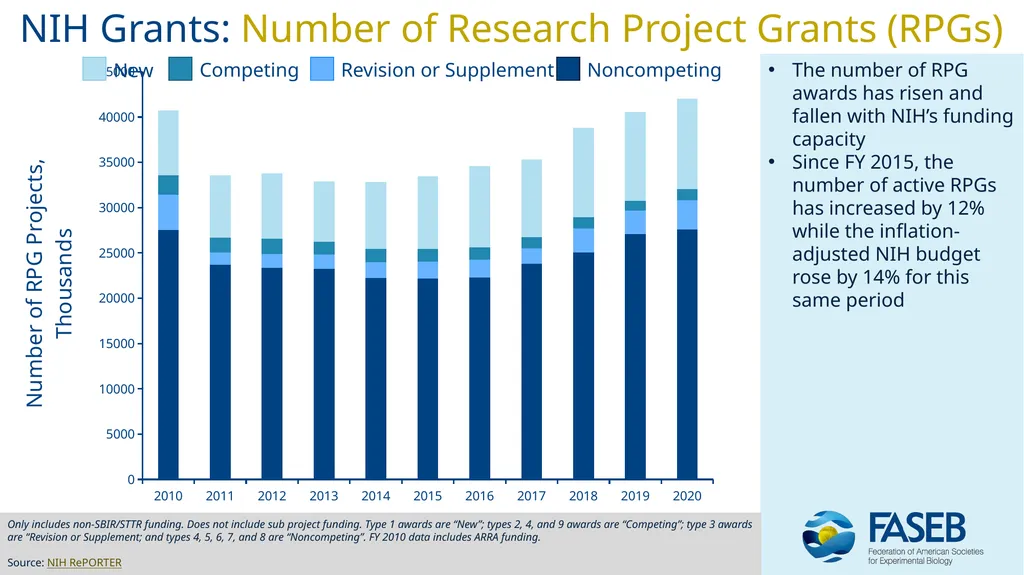
NIH Grants: Number of Research Project Grants (RPGs) The number of RPG awards has risen and fallen with NIH’s funding capacity
Since FY 2015, the number of active RPGs has increased by 12% while the inflation-adjusted NIH budget rose by 14% for this same period Only includes non-SBIR/STTR funding. Does not include sub project funding. Type 1 awards are “New”; types 2, 4, and 9 awards are “Competing”; type 3 awards are “Revision or Supplement; and types 4, 5, 6, 7, and 8 are “Noncompeting”. FY 2010 data includes ARRA funding.
Source: NIH RePORTER<br>
06
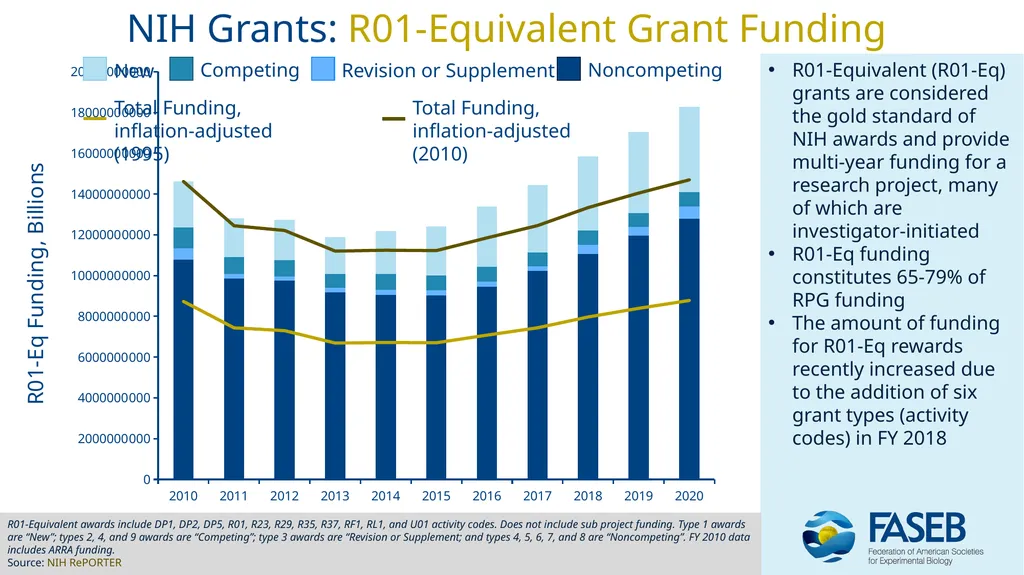
NIH Grants: R01-Equivalent Grant Funding R01-Equivalent (R01-Eq) grants are considered the gold standard of NIH awards and provide multi-year funding for a research project, many of which are investigator-initiated
R01-Eq funding constitutes 65-79% of RPG funding
The amount of funding for R01-Eq rewards recently increased due to the addition of six grant types (activity codes) in FY 2018 R01-Equivalent awards include DP1, DP2, DP5, R01, R23, R29, R35, R37, RF1, RL1, and U01 activity codes. Does not include sub project funding. Type 1 awards are “New”; types 2, 4, and 9 awards are “Competing”; type 3 awards are “Revision or Supplement; and types 4, 5, 6, 7, and 8 are “Noncompeting”. FY 2010 data includes ARRA funding.
Source: NIH RePORTER<br>
07
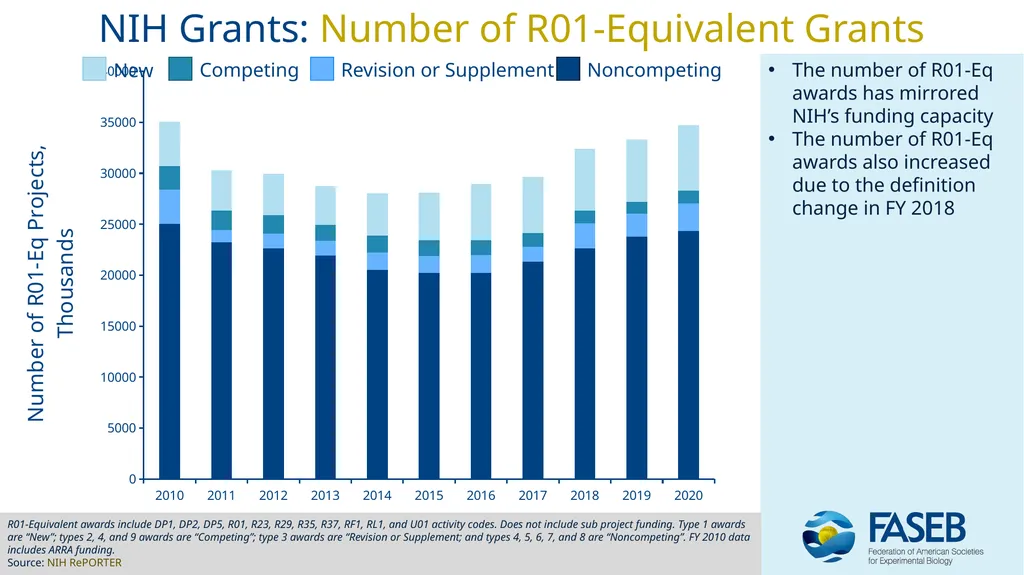
NIH Grants: Number of R01-Equivalent Grants The number of R01-Eq awards has mirrored NIH’s funding capacity
The number of R01-Eq awards also increased due to the definition change in FY 2018 R01-Equivalent awards include DP1, DP2, DP5, R01, R23, R29, R35, R37, RF1, RL1, and U01 activity codes. Does not include sub project funding. Type 1 awards are “New”; types 2, 4, and 9 awards are “Competing”; type 3 awards are “Revision or Supplement; and types 4, 5, 6, 7, and 8 are “Noncompeting”. FY 2010 data includes ARRA funding.
Source: NIH RePORTER<br>
08
NIH Grants: R01-Eq Awards to First-Time Investigators “First-time” R01-Eq awards measure the number of R01-Eq awards made to applicants who have not previously received an R01-Eq award (i.e., new investigators) and constitute 22-29% of all R01-Eq awards
The number of first-time awards in the past decade has been more stable than the number of R01-Eq awards overall, reflecting NIH’s commitment to bring new investigators into the workforce, even when funding is constrained R01-Equivalent awards include DP1, DP2, DP5, R01, R23, R29, R35, R37, RF1, RL1, and U01 activity codes. First-time recipients measure the number of awarded applications submitted by investigators who had not previously received an R01-Eq award. First-time status only applies to the Contact Principal Investigator.
Source: NIH Data Book First Time Contact PI Established Contact PI<br>
09
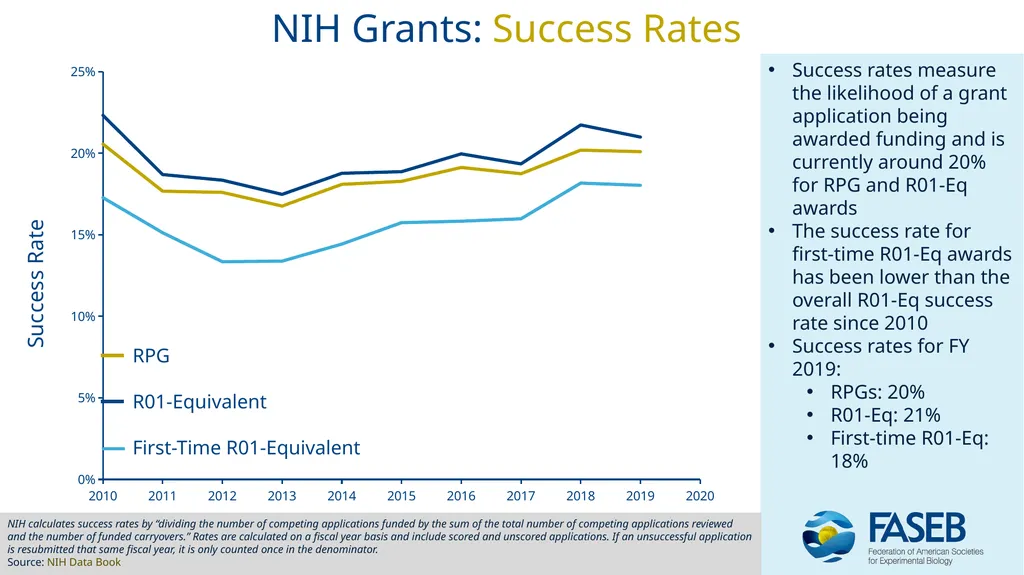
NIH Grants: Success Rates Success rates measure the likelihood of a grant application being awarded funding and is currently around 20% for RPG and R01-Eq awards
The success rate for first-time R01-Eq awards has been lower than the overall R01-Eq success rate since 2010
Success rates for FY 2019:
RPGs: 20%
R01-Eq: 21%
First-time R01-Eq: 18% NIH calculates success rates by “dividing the number of competing applications funded by the sum of the total number of competing applications reviewed and the number of funded carryovers.” Rates are calculated on a fiscal year basis and include scored and unscored applications. If an unsuccessful application is resubmitted that same fiscal year, it is only counted once in the denominator.
Source: NIH Data Book RPG
R01-Equivalent
First-Time R01-Equivalent<br>
10
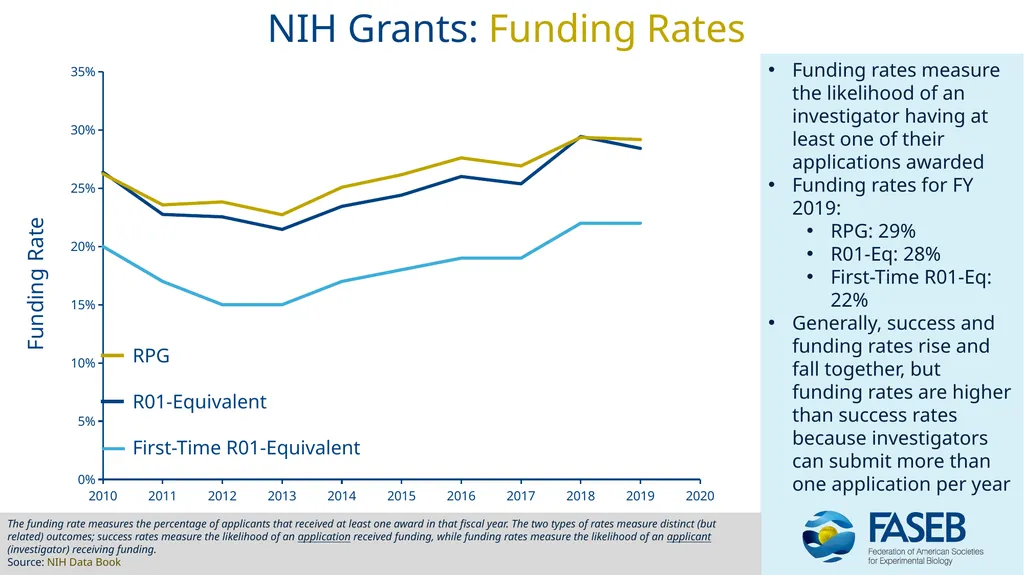
NIH Grants: Funding Rates Funding rates measure the likelihood of an investigator having at least one of their applications awarded
Funding rates for FY 2019:
RPG: 29%
R01-Eq: 28%
First-Time R01-Eq: 22%
Generally, success and funding rates rise and fall together, but funding rates are higher than success rates because investigators can submit more than one application per year The funding rate measures the percentage of applicants that received at least one award in that fiscal year. The two types of rates measure distinct (but related) outcomes; success rates measure the likelihood of an application received funding, while funding rates measure the likelihood of an applicant (investigator) receiving funding.
Source: NIH Data Book RPG
R01-Equivalent
First-Time R01-Equivalent<br>
11
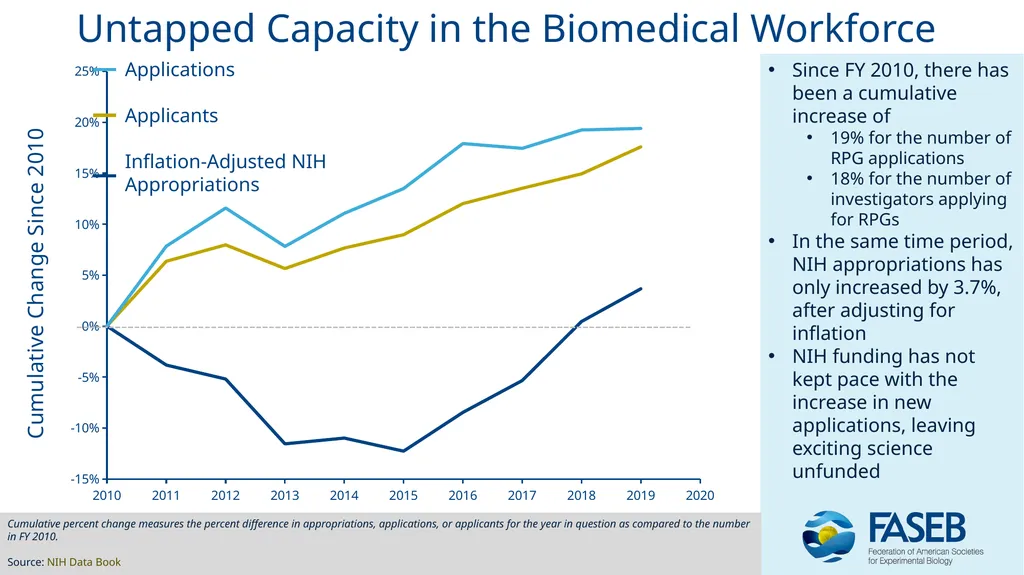
Untapped Capacity in the Biomedical Workforce Since FY 2010, there has been a cumulative increase of
19% for the number of RPG applications
18% for the number of investigators applying for RPGs
In the same time period, NIH appropriations has only increased by 3.7%, after adjusting for inflation
NIH funding has not kept pace with the increase in new applications, leaving exciting science unfunded Cumulative percent change measures the percent difference in appropriations, applications, or applicants for the year in question as compared to the number in FY 2010.