04
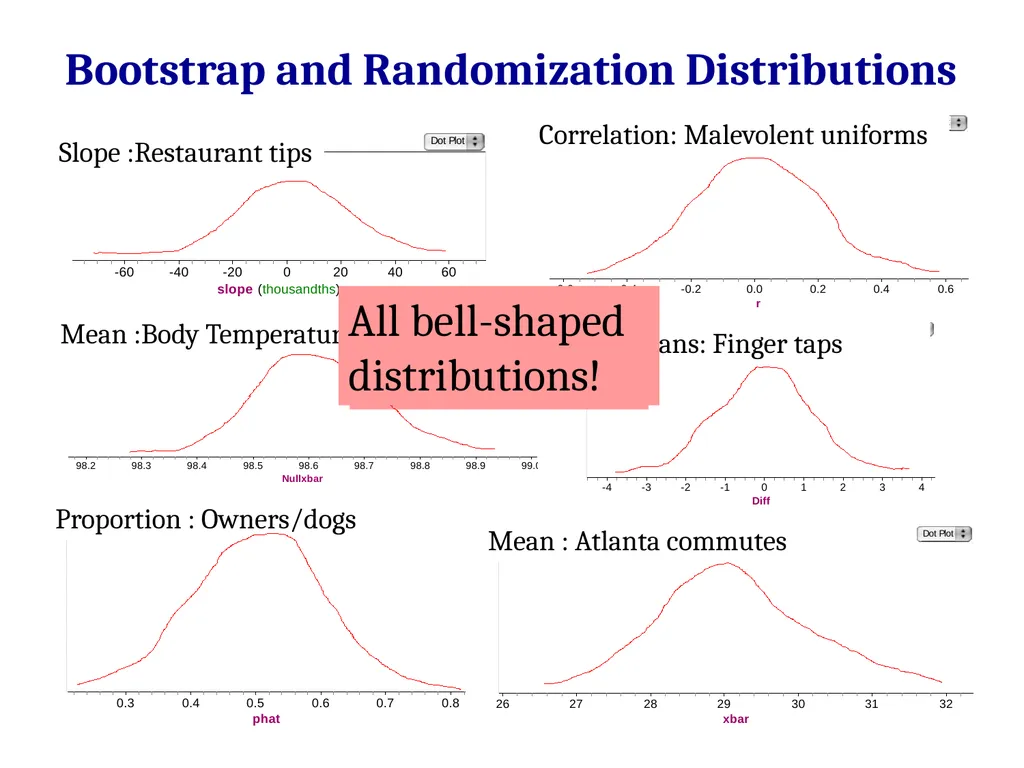
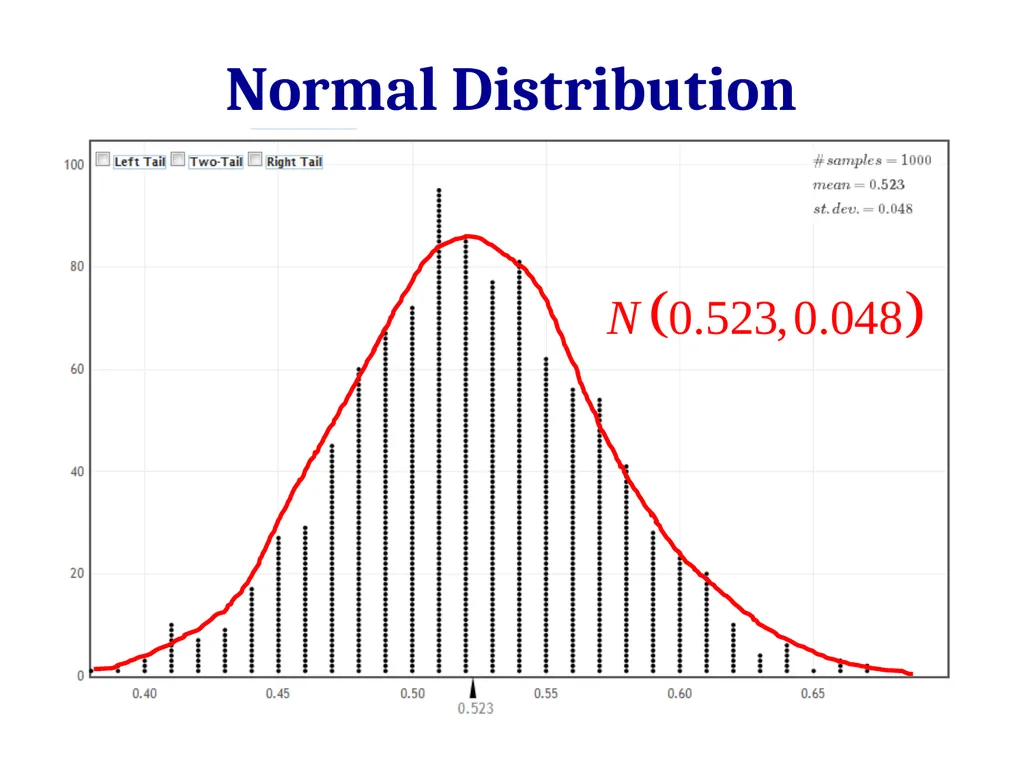
The symmetric, bell-shaped curve we have seen for almost all of our bootstrap and randomization distributions is called a normal distribution Normal Distribution<br>
05
Central Limit Theorem! For a sufficiently large sample size, the distribution of sample statistics for a mean or a proportion is normal http://onlinestatbook.com/stat_sim/sampling_dist/index.html<br>
06
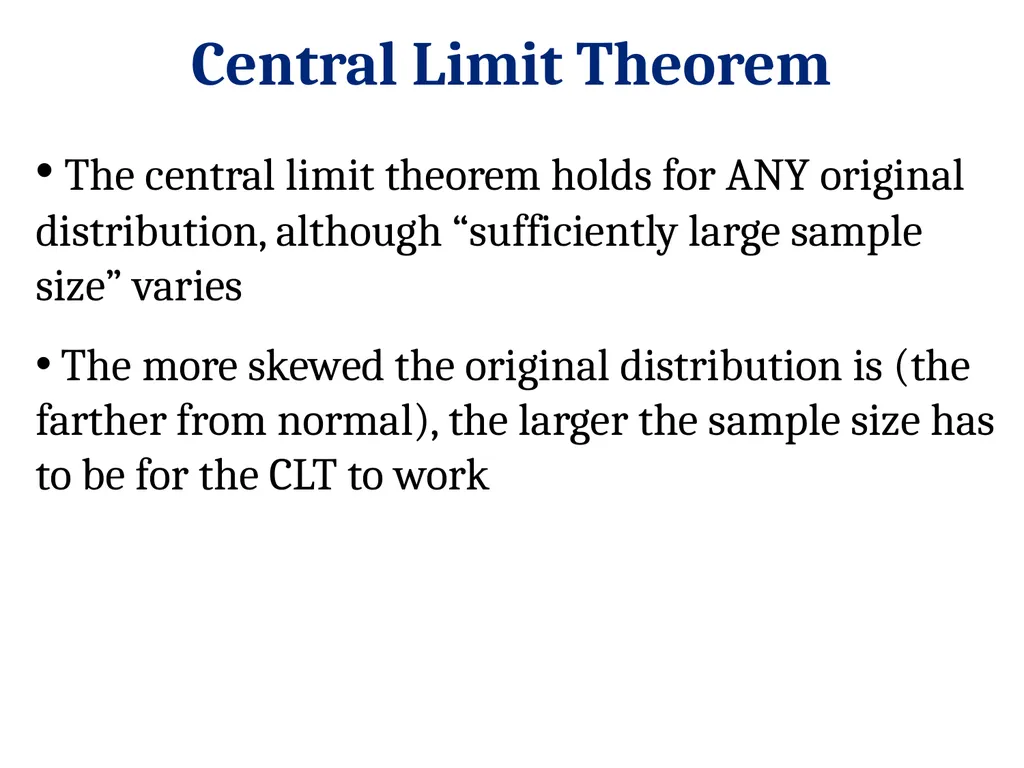
Central Limit Theorem The central limit theorem holds for ANY original distribution, although “sufficiently large sample size” varies
The more skewed the original distribution is (the farther from normal), the larger the sample size has to be for the CLT to work<br>
07
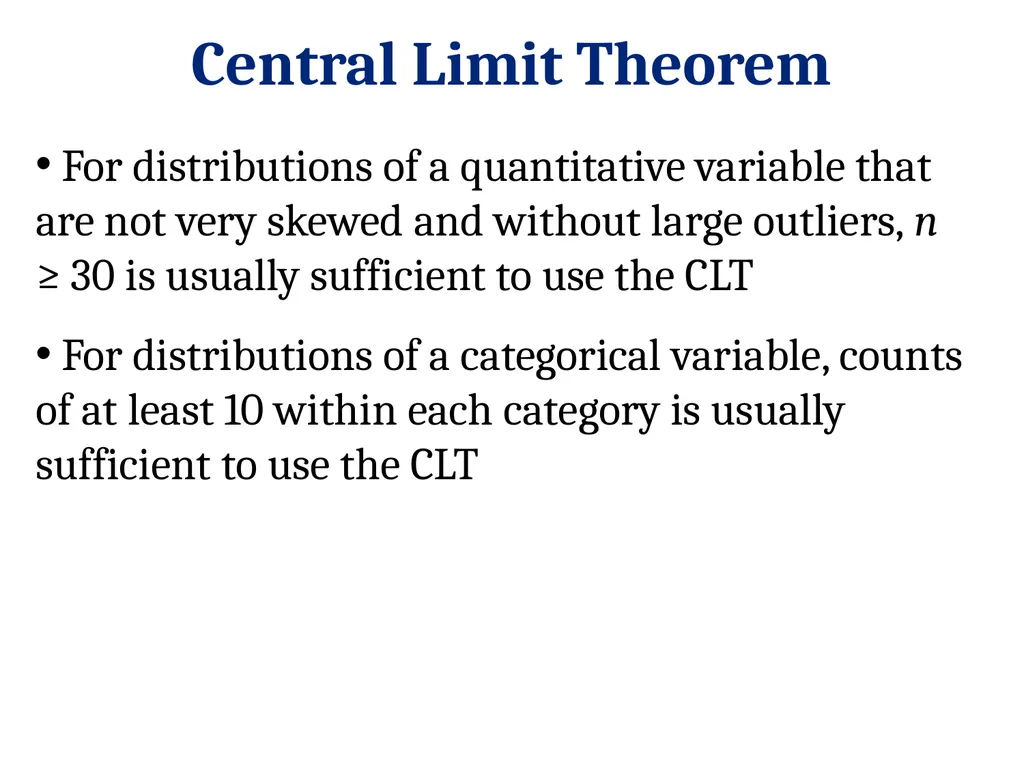
Central Limit Theorem For distributions of a quantitative variable that are not very skewed and without large outliers, n ≥ 30 is usually sufficient to use the CLT
For distributions of a categorical variable, counts of at least 10 within each category is usually sufficient to use the CLT<br>
08
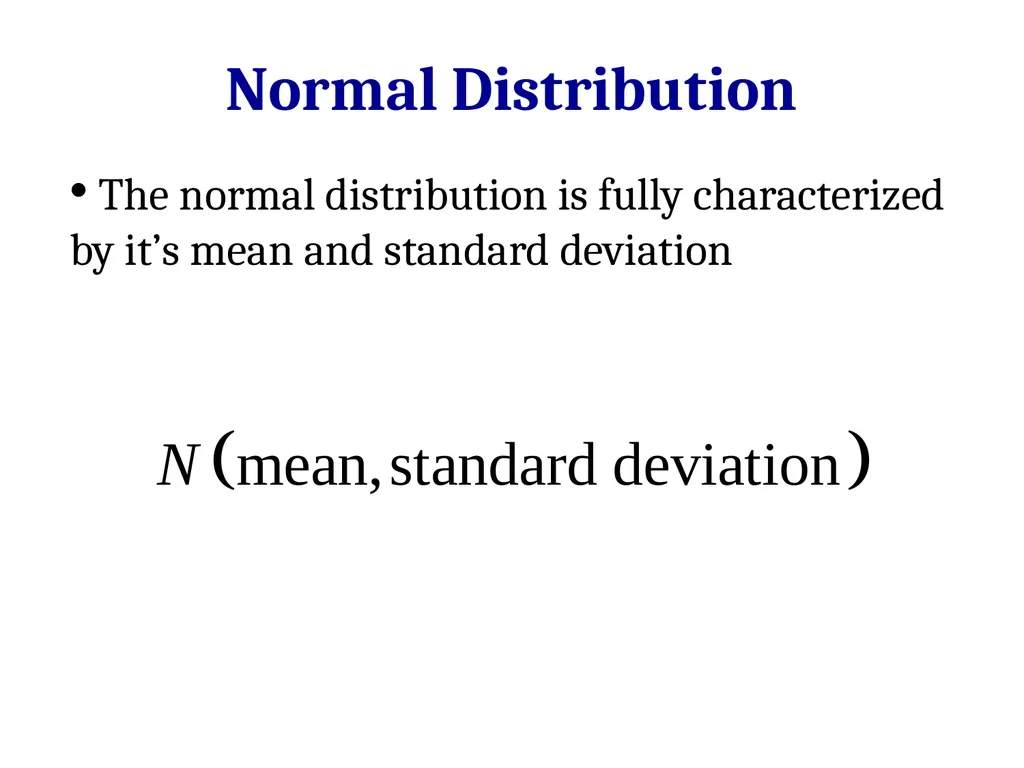
The normal distribution is fully characterized by it’s mean and standard deviation Normal Distribution<br>
09
Normal Distribution<br>
10
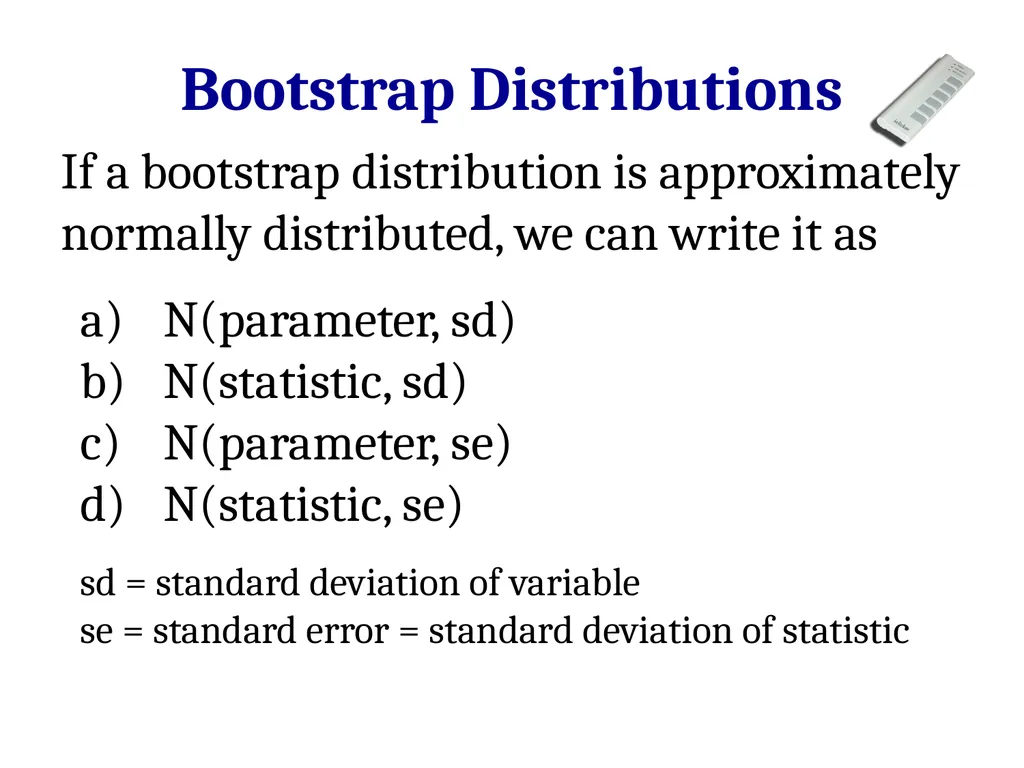
Bootstrap Distributions If a bootstrap distribution is approximately normally distributed, we can write it as
N(parameter, sd)
N(statistic, sd)
N(parameter, se)
N(statistic, se)
sd = standard deviation of variable
se = standard error = standard deviation of statistic<br>
11
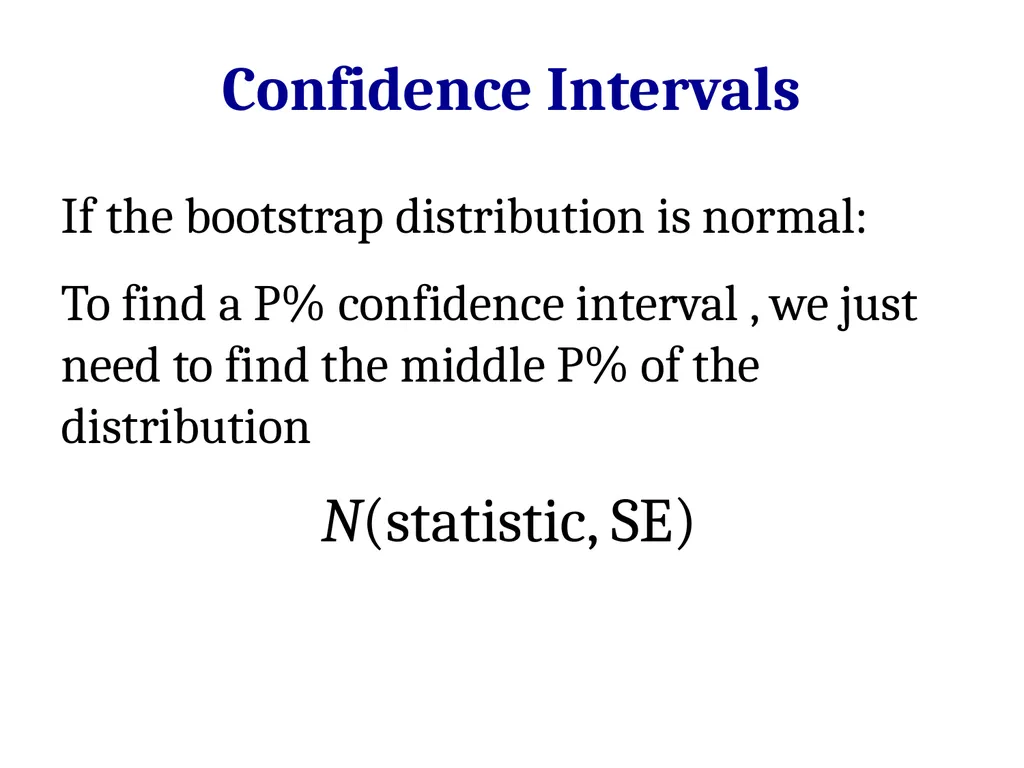
Confidence Intervals If the bootstrap distribution is normal:
To find a P% confidence interval , we just need to find the middle P% of the distribution
N(statistic, SE)<br>
12
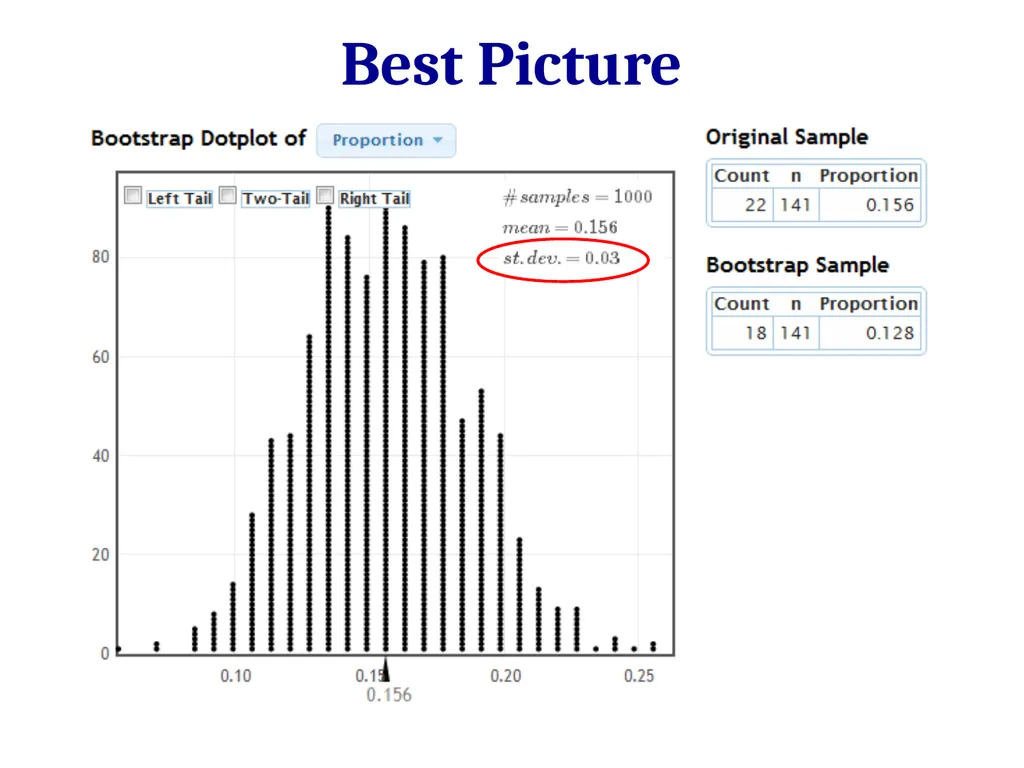
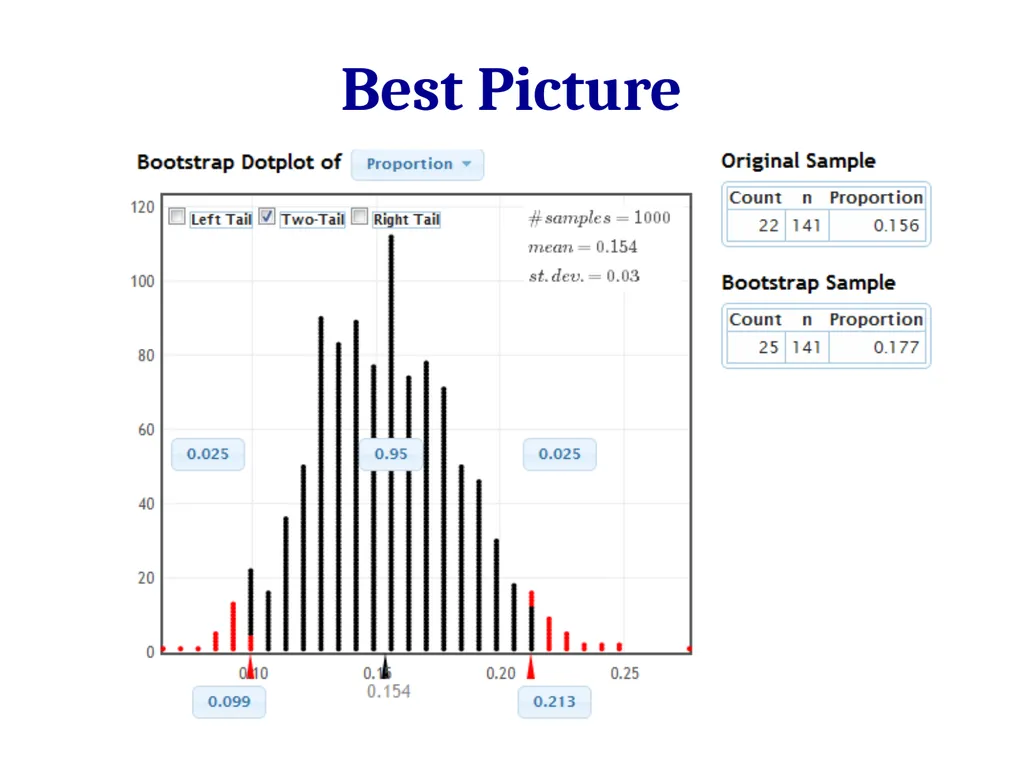
Best Picture What proportion of visitors to www.naplesnews.com thought The Artist should win best picture?<br>
13
Best Picture www.lock5stat.com/statkey<br>
14
Area under a Curve The area under the curve of a normal distribution is equal to the proportion of the distribution falling within that range
Knowing just the mean and standard deviation of a normal distribution allows you to calculate areas in the tails and percentiles http://davidmlane.com/hyperstat/z_table.html<br>
15
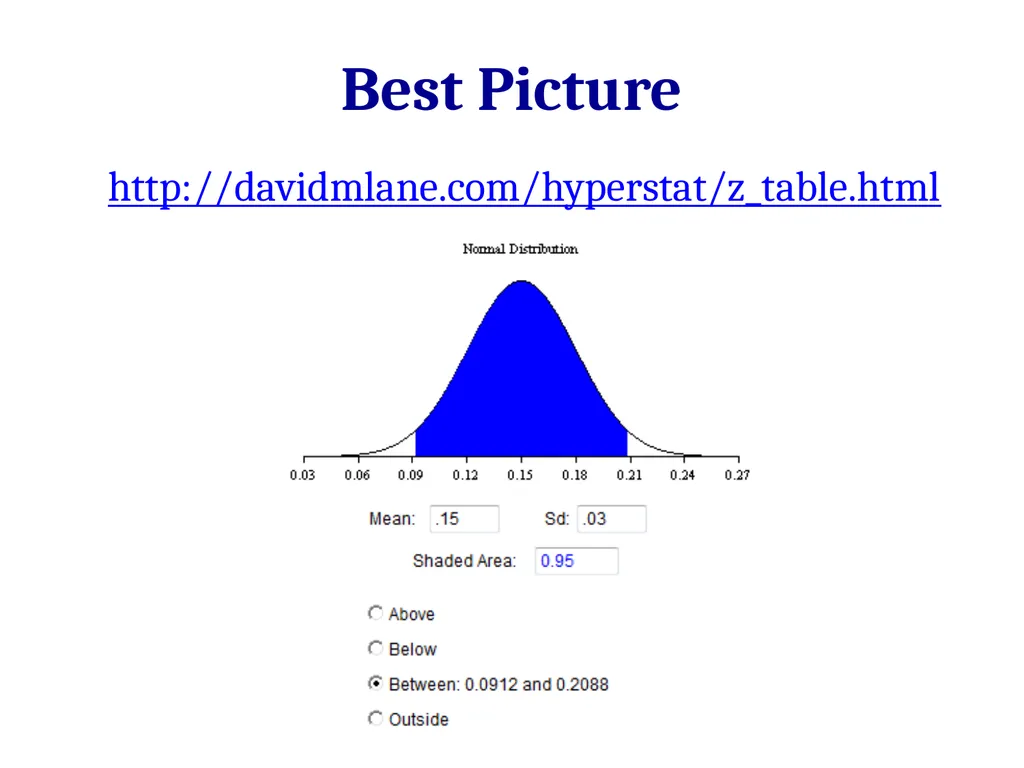
Best Picture http://davidmlane.com/hyperstat/z_table.html<br>
17
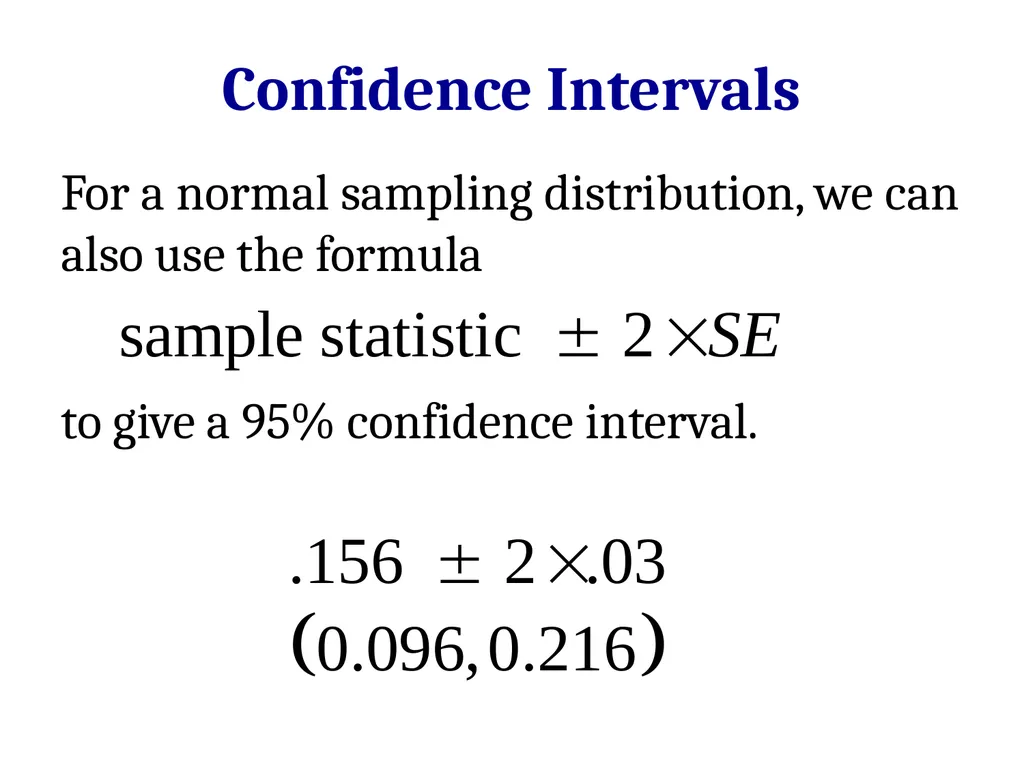
For a normal sampling distribution, we can also use the formula
to give a 95% confidence interval. Confidence Intervals<br>
18
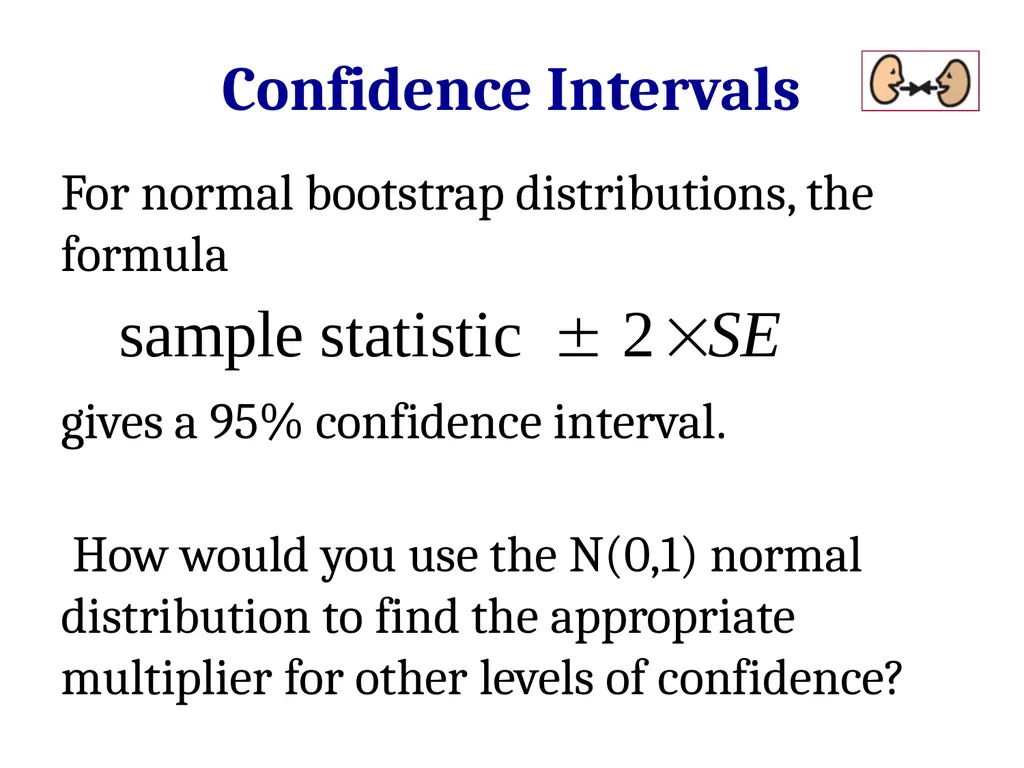
For normal bootstrap distributions, the formula
gives a 95% confidence interval.
How would you use the N(0,1) normal distribution to find the appropriate multiplier for other levels of confidence? Confidence Intervals<br>
19
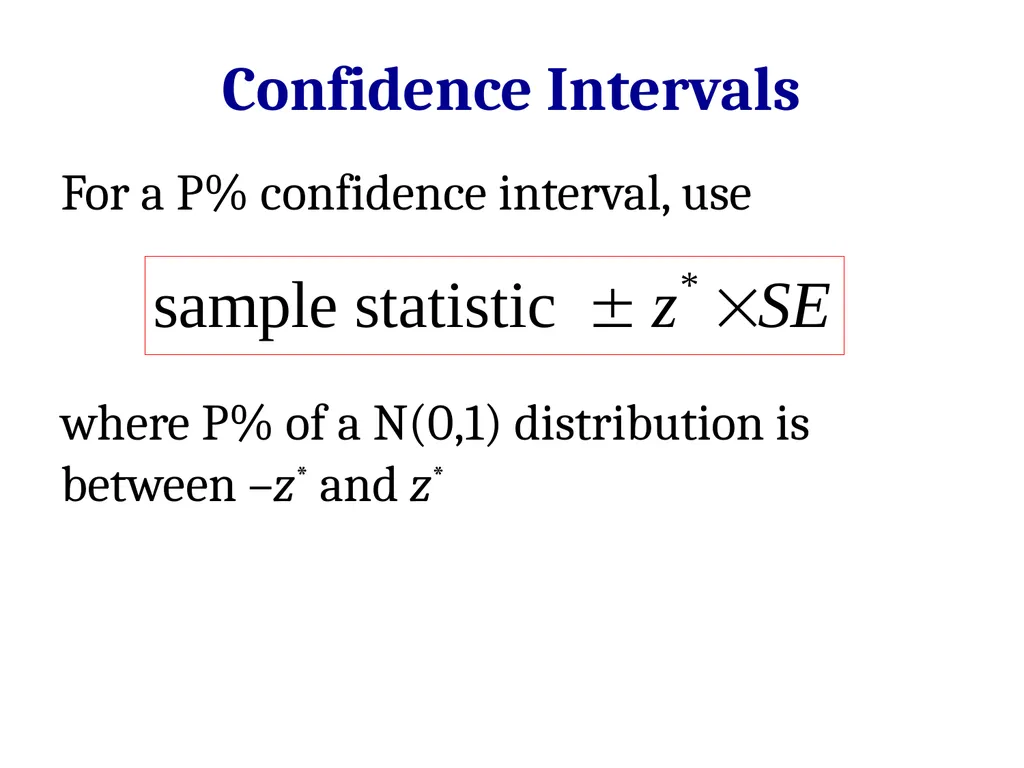
For a P% confidence interval, use
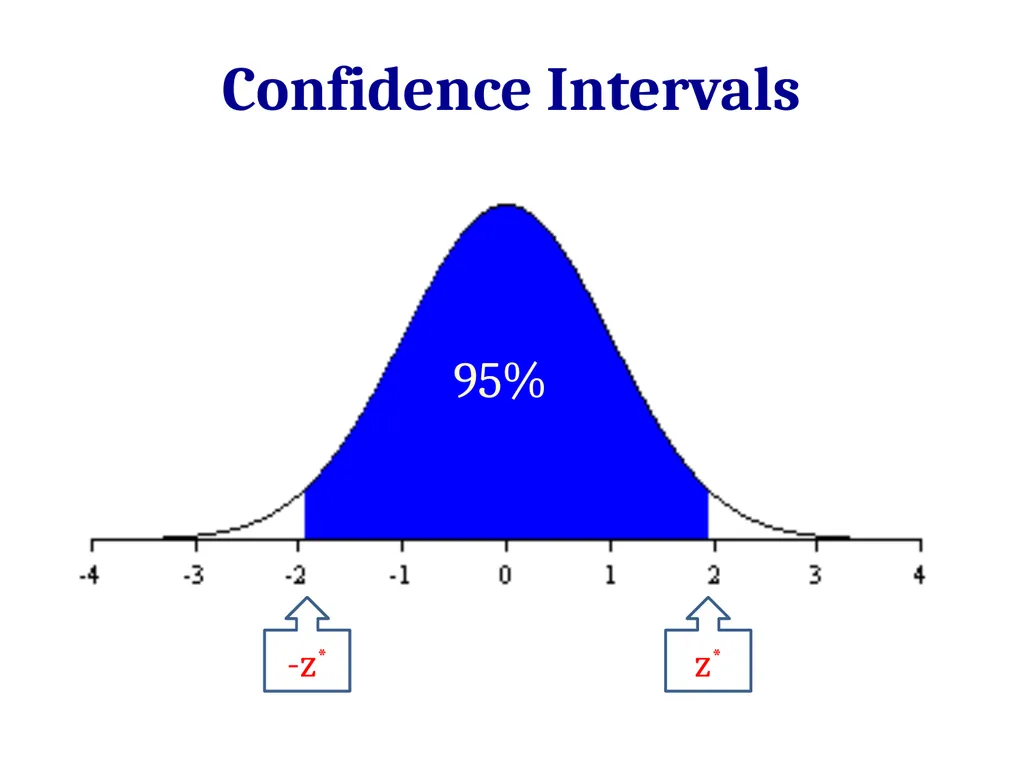
where P% of a N(0,1) distribution is between –z* and z* Confidence Intervals<br>
20
z* -z* 95% Confidence Intervals<br>
21
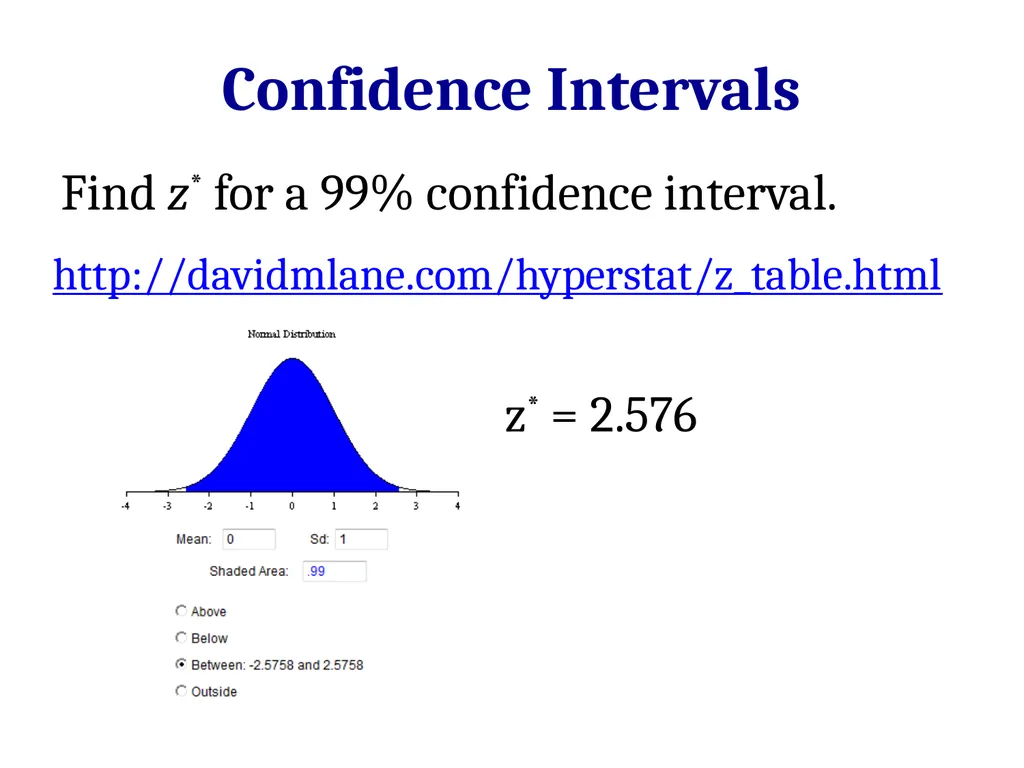
Confidence Intervals Find z* for a 99% confidence interval. http://davidmlane.com/hyperstat/z_table.html z* = 2.576<br>
22
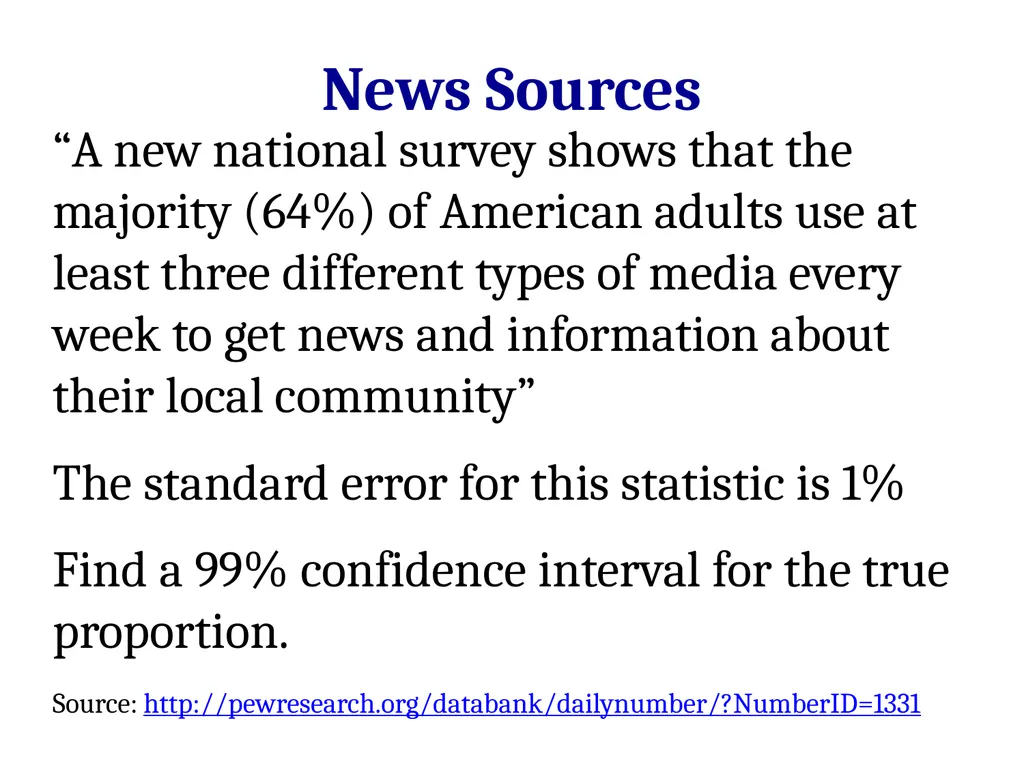
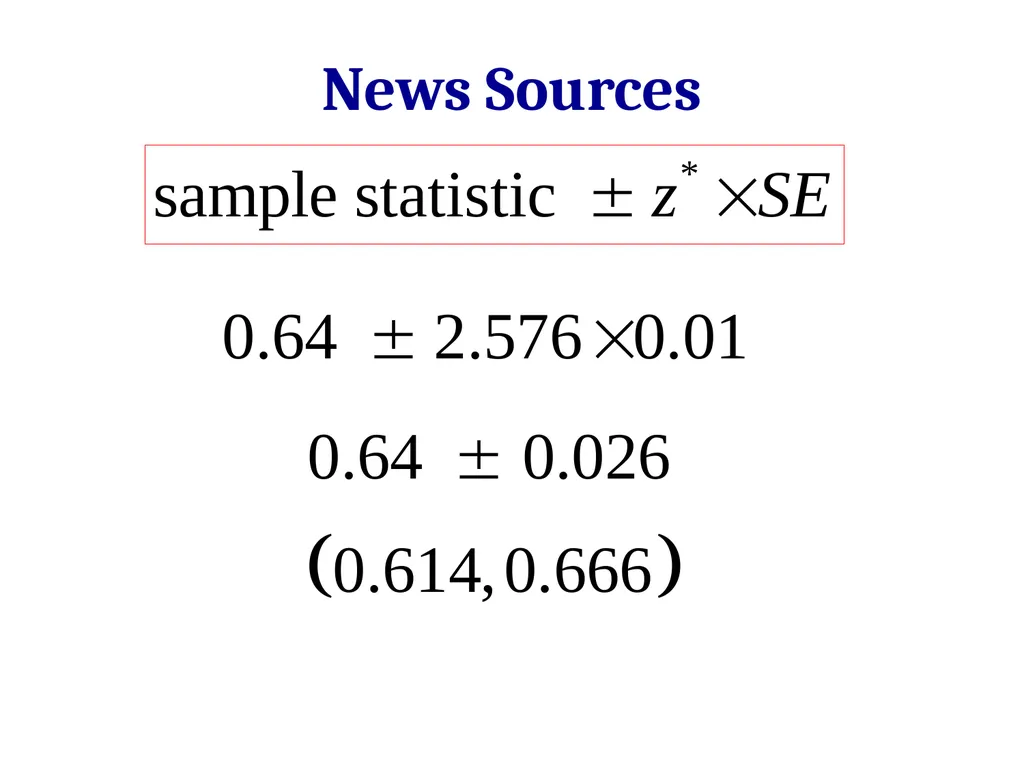
News Sources “A new national survey shows that the majority (64%) of American adults use at least three different types of media every week to get news and information about their local community”
The standard error for this statistic is 1%
Find a 99% confidence interval for the true proportion.
Source: http://pewresearch.org/databank/dailynumber/?NumberID=1331<br>
24
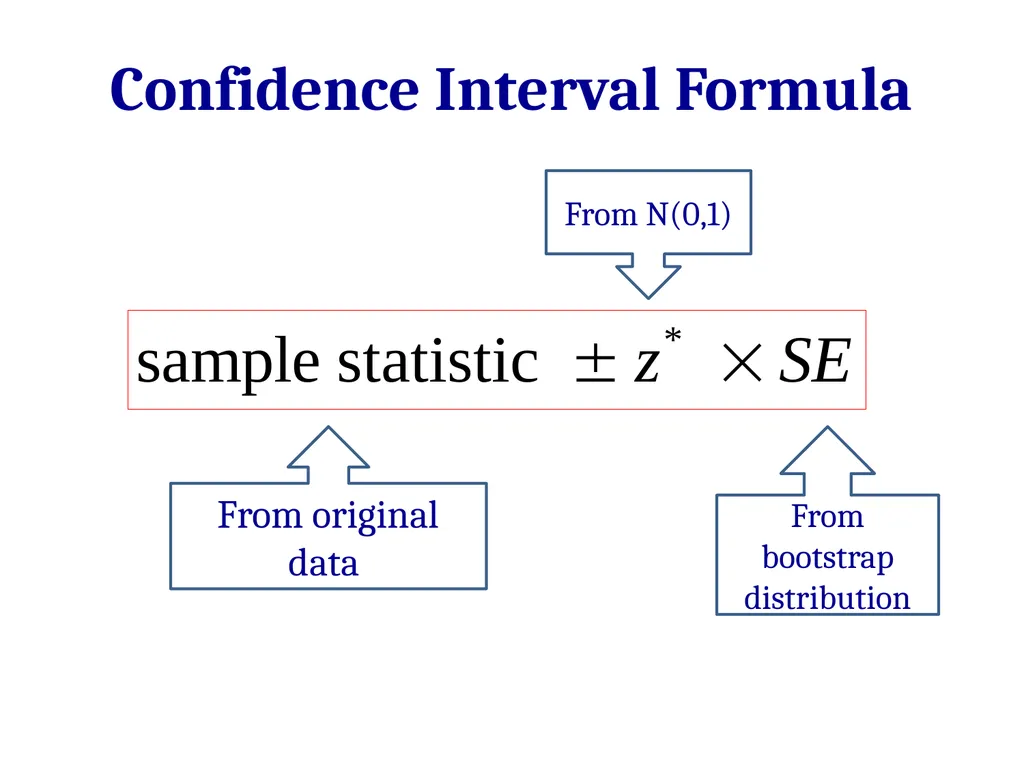
Confidence Interval Formula From original data From bootstrap distribution From N(0,1)<br>
25
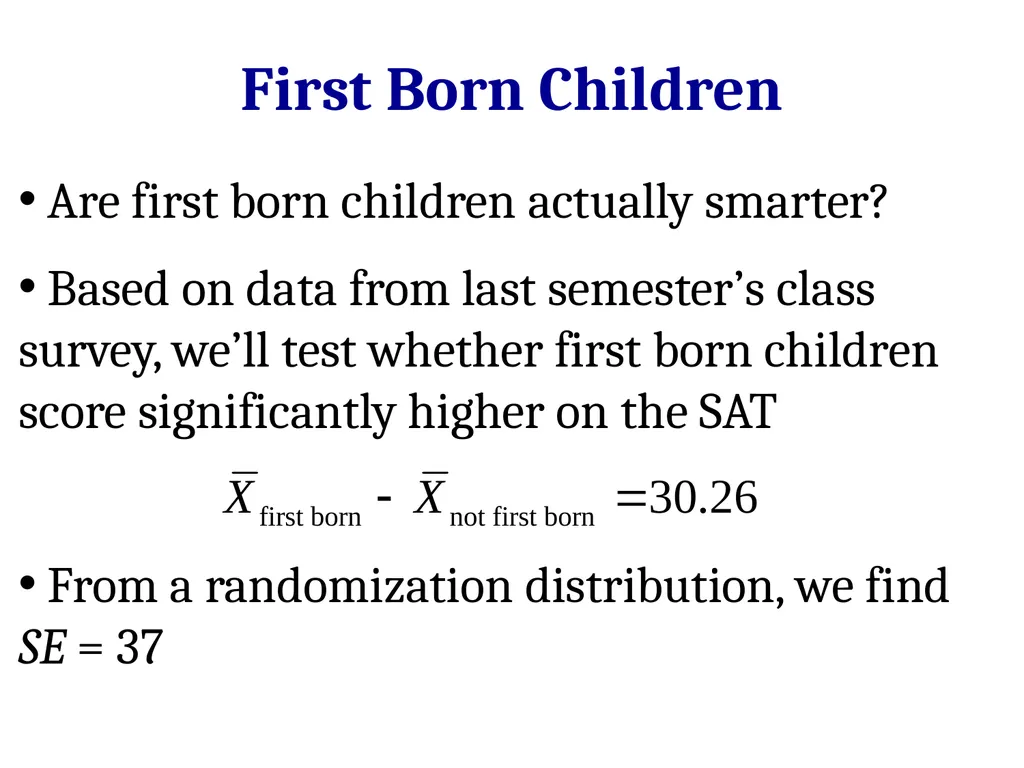
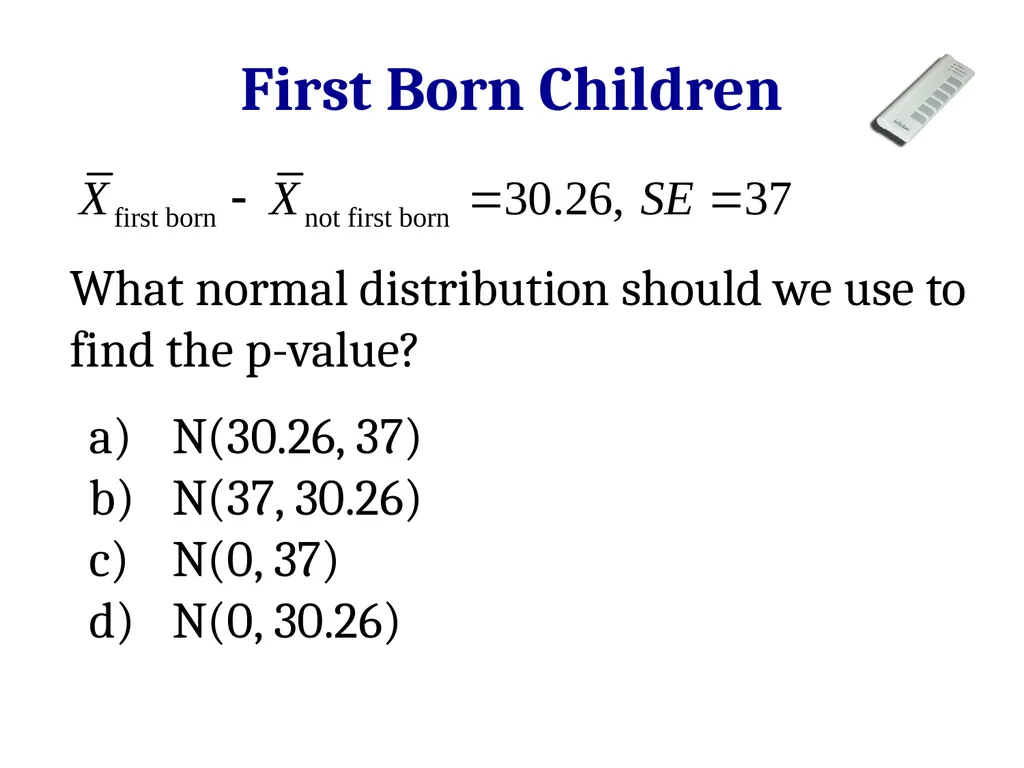
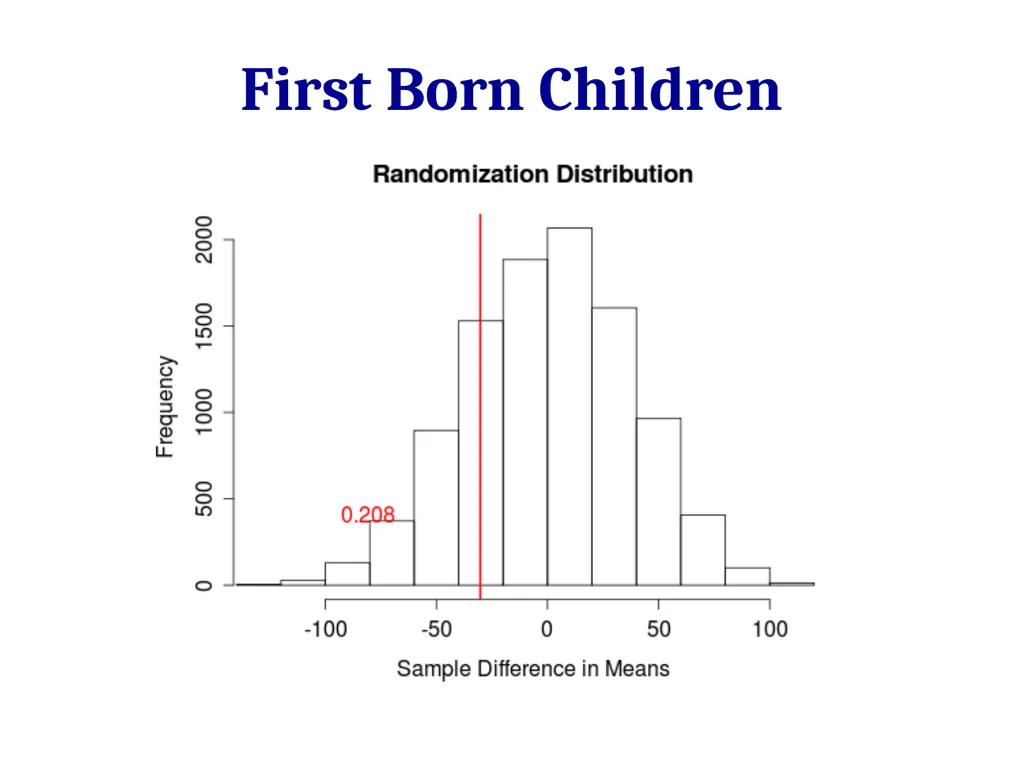
First Born Children Are first born children actually smarter?
Based on data from last semester’s class survey, we’ll test whether first born children score significantly higher on the SAT
From a randomization distribution, we find SE = 37<br>
26
First Born Children What normal distribution should we use to find the p-value?
N(30.26, 37)
N(37, 30.26)
N(0, 37)
N(0, 30.26)<br>
27
Hypothesis Testing<br>
28
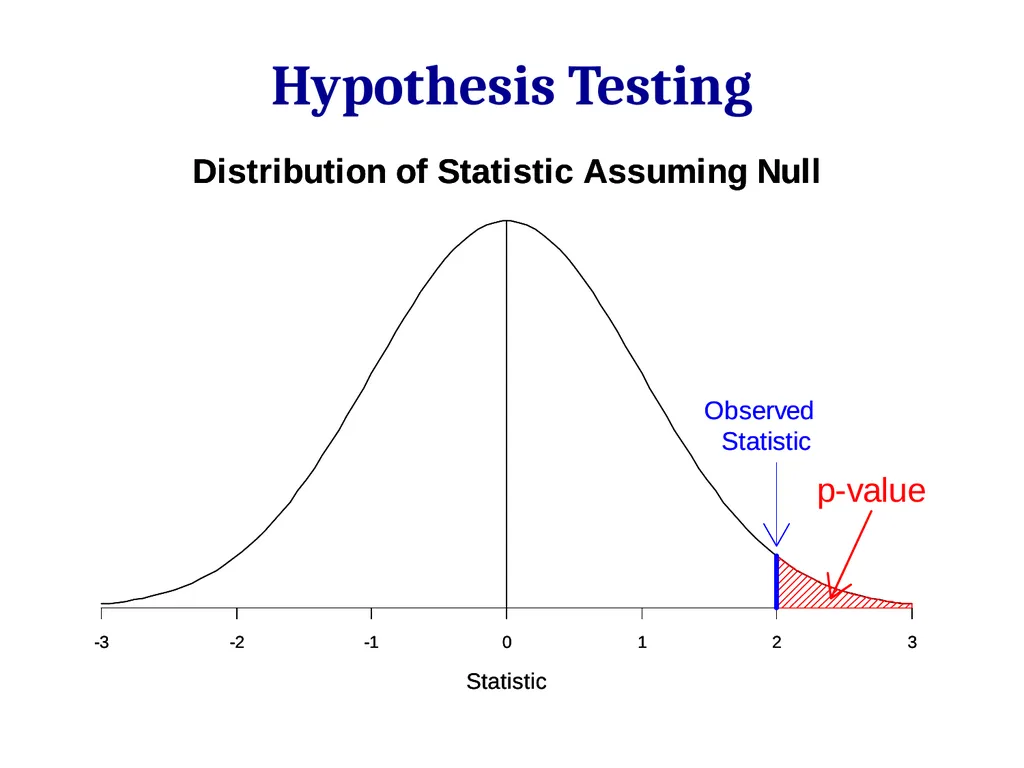
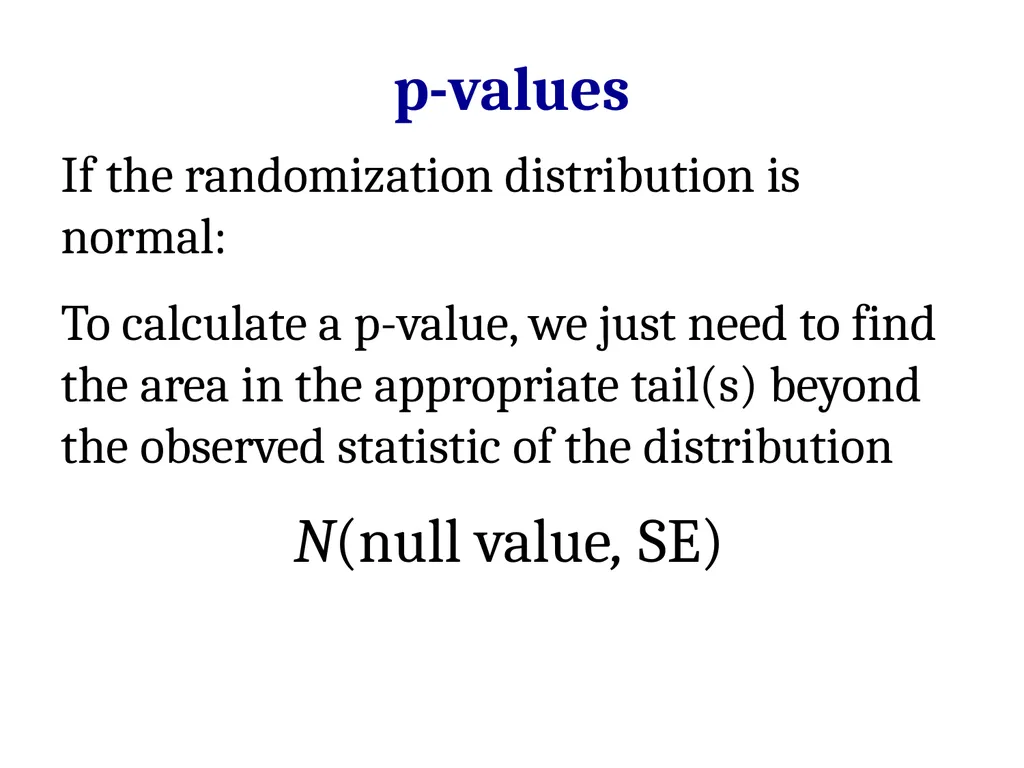
p-values If the randomization distribution is normal:
To calculate a p-value, we just need to find the area in the appropriate tail(s) beyond the observed statistic of the distribution
N(null value, SE)<br>
29
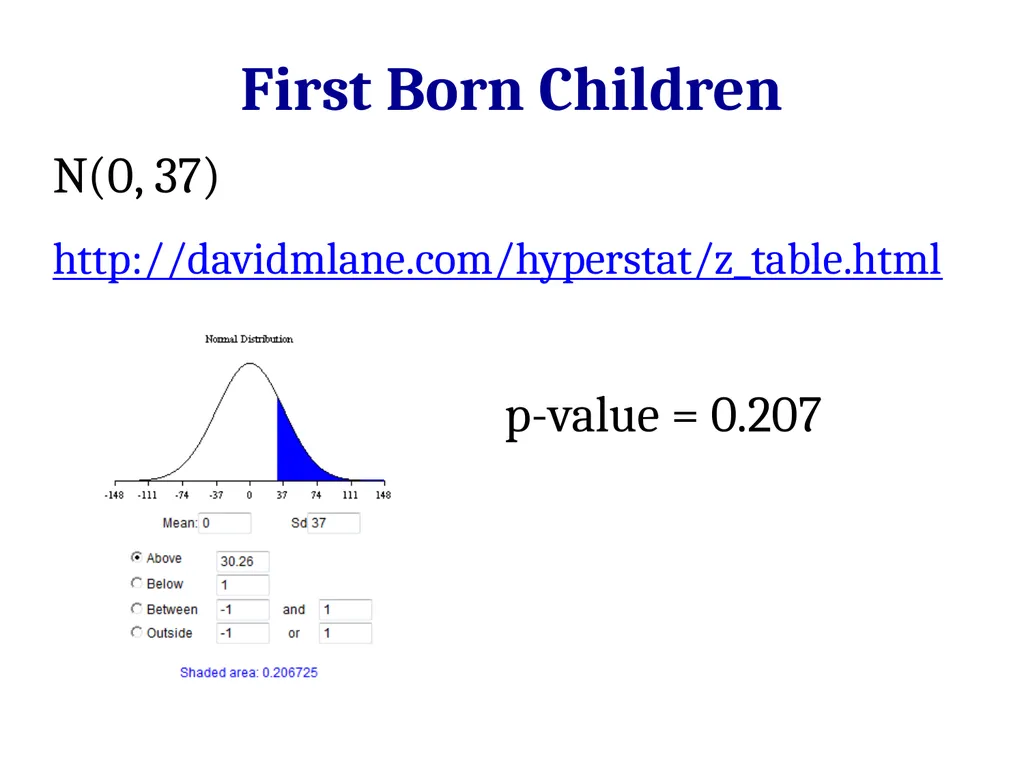
First Born Children N(0, 37)
http://davidmlane.com/hyperstat/z_table.html p-value = 0.207<br>
30
First Born Children<br>
31
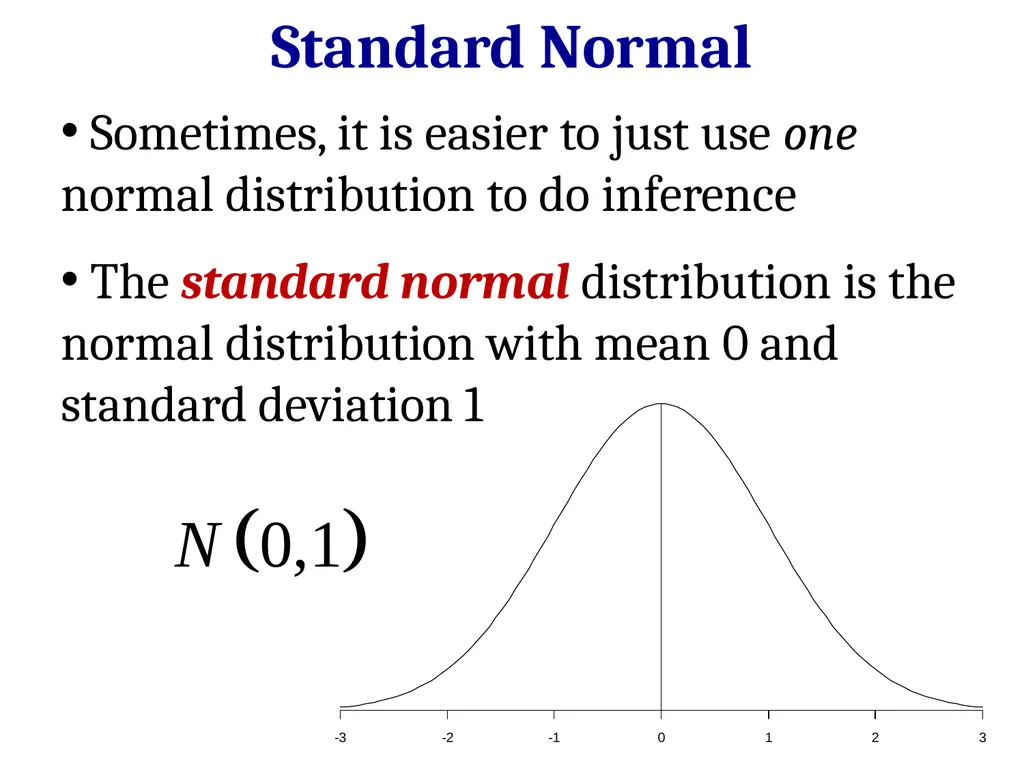
Standard Normal Sometimes, it is easier to just use one normal distribution to do inference
The standard normal distribution is the normal distribution with mean 0 and standard deviation 1<br>
32
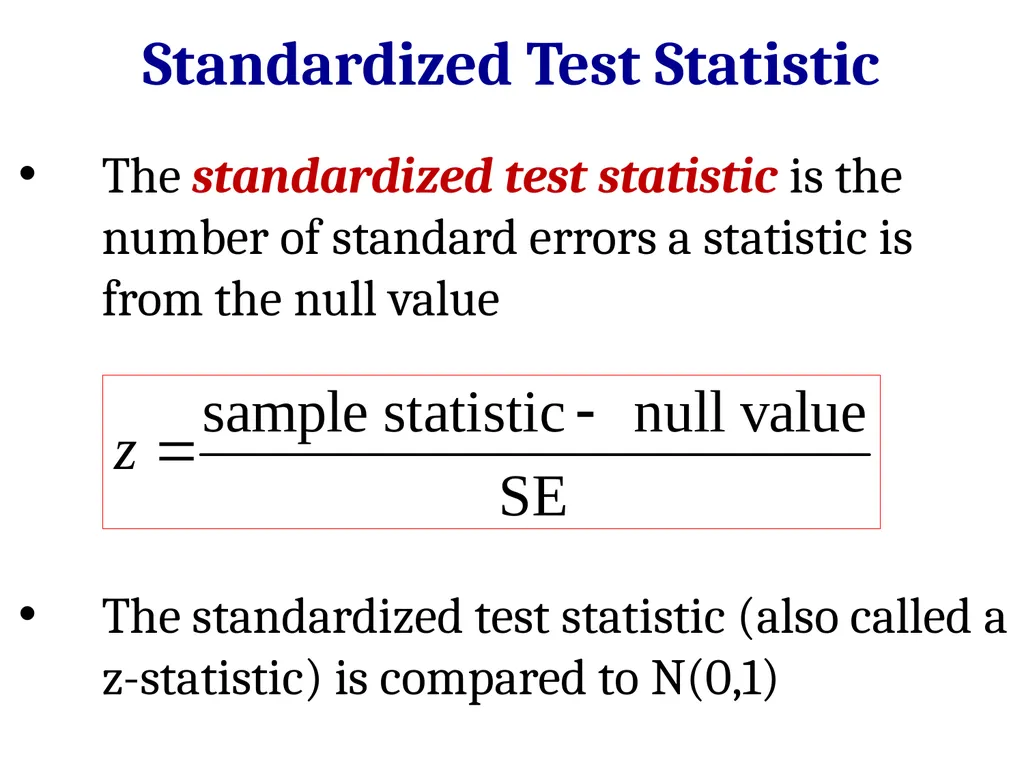
Standardized Test Statistic The standardized test statistic is the number of standard errors a statistic is from the null value
The standardized test statistic (also called a z-statistic) is compared to N(0,1)<br>
33
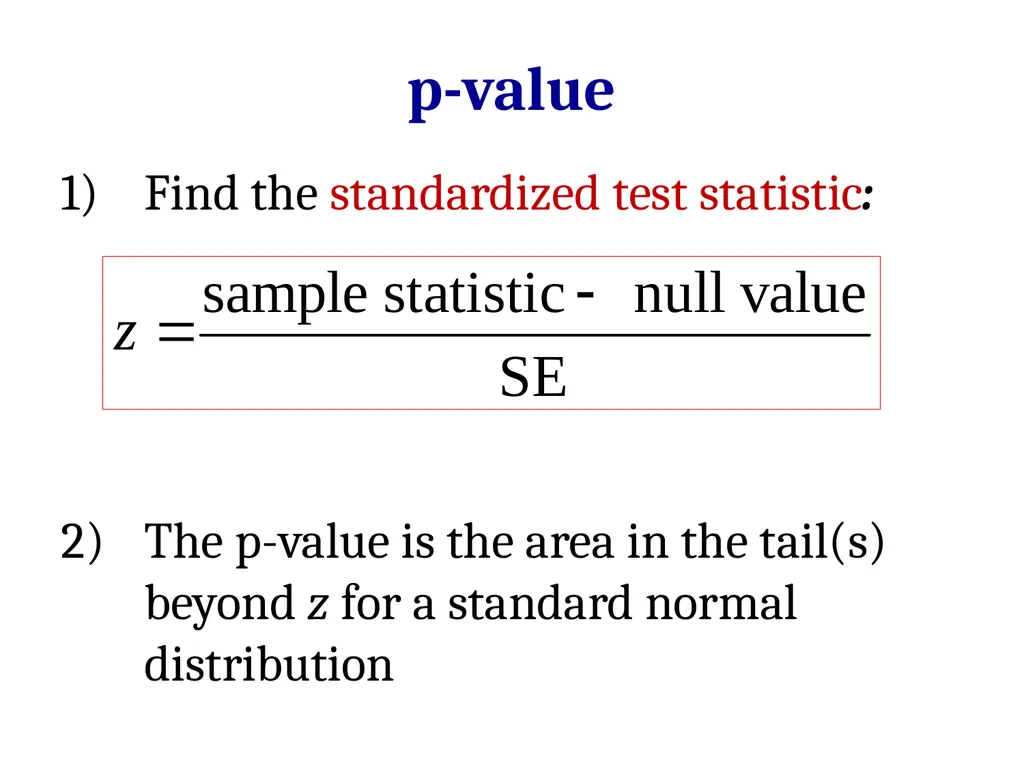
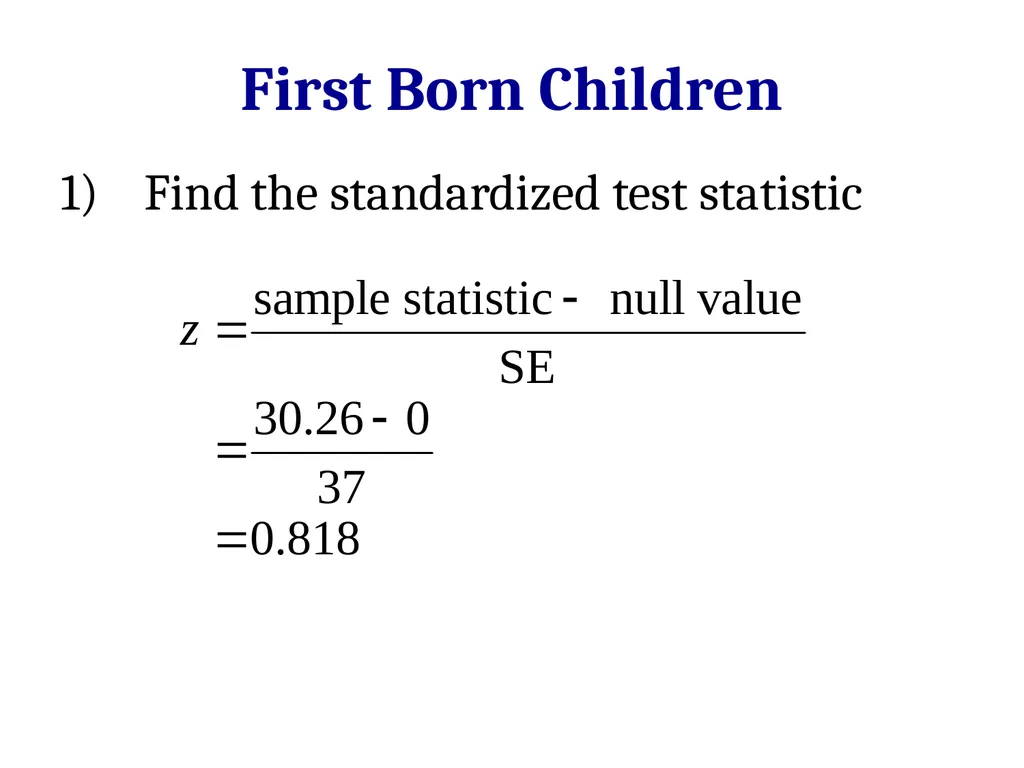
p-value Find the standardized test statistic:
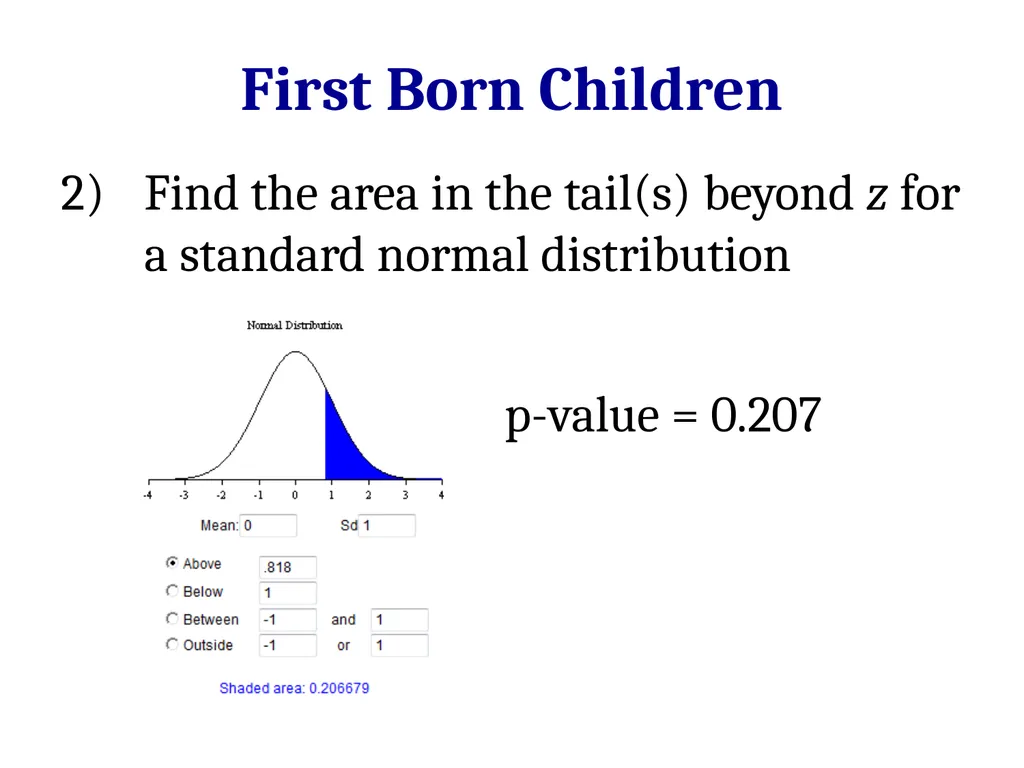
The p-value is the area in the tail(s) beyond z for a standard normal distribution<br>
34
First Born Children Find the standardized test statistic<br>
35
First Born Children Find the area in the tail(s) beyond z for a standard normal distribution p-value = 0.207<br>
36
z-statistic Calculating the number of standard errors a statistic is from the null value allows us to assess extremity on a common scale<br>
37
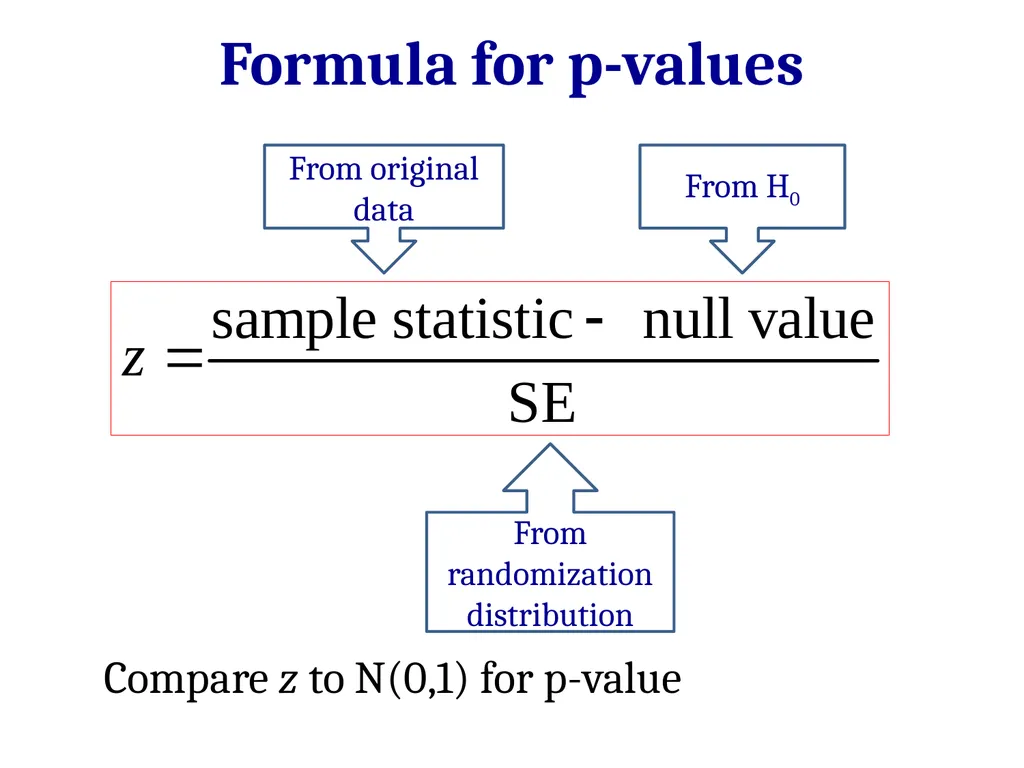
Formula for p-values From randomization distribution From H0 From original data Compare z to N(0,1) for p-value<br>
38
Standard Error Wouldn’t it be nice if we could compute the standard error without doing thousands of simulations?
We can!!!
Or rather, we’ll be able to on Wednesday!<br>