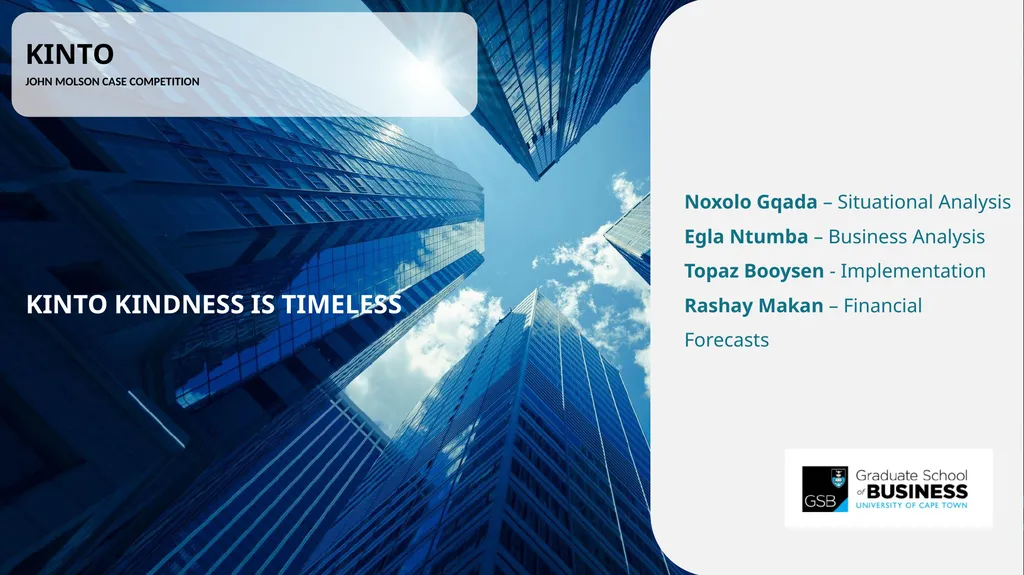
Noxolo Gqada – Situational Analysis Egla Ntumba –
Description: Noxolo Gqada Situational Analysis Egla Ntumba Business Analysis Topaz Booysen - Implementation Rashay Makan Financial Forecasts JOHN MOLSON CASE COMPETITION KINTO KINTO KINDNESS IS TIMELESS MOBILITY MAGIC DISTRIBUTION NETWORK GROWTH
Related Topics
Download Presentation
"Noxolo Gqada – Situational Analysis Egla Ntumba –" is the property of its rightful owner. Permission is granted to download and print the materials on this website for personal, non-commercial use only, and to display it on your personal computer provided you do not modify the materials and that you retain all copyright notices contained in the materials. By downloading content from our website, you accept the terms of this agreement.
Presentation Transcript
slide1. Noxolo Gqada – Situational Analysis
Egla Ntumba – Business Analysis
Topaz Booysen - Implementation
Rashay Makan – Financial Forecasts JOHN MOLSON CASE COMPETITION KINTO KINTO KINDNESS IS TIMELESS<br>
slide2. MOBILITY MAGIC DISTRIBUTION NETWORK GROWTHDouble fleet size by 2026 ‹#› SITUATIONAL ANALYSIS: KINTO Rapid scale Break even BUSINESS MODEL
CONSUMER NEEDGEOGRAPHICAL ? Technology & Brand<br>
slide3. ‹#›<br>
slide4. Become one of the
Largest cross-brandmobility platform
in 2028 Deliver
DOUBLE FEET
in 2026220K Deliver
111M EUR PROFIT
over 5 years(73% increase to base)Double feet by 2026 VALUE PROMISE ‹#› A 6 year strategy to leverage and incentivise dealerships & expand into multi-brand dealerships 1 2 3 =<br>
slide5. KEY ISSUES ‹#› DEALERSHIPS ARE LESS PROFITABLE CHANGE IN CONSUMER NEEDS ! MULTI- BRAND
Brands influence consumer decision making
B2B/B2C POOR DEALERSHIP RELATIONSHIPS
Unused vehicles
Increase capacity requirements: Front end and back-end
“left out” - poor relationship management !<br>
slide6. KINTO range
EXISTING regions CONTINUE SERVICING CORPORATE AND PRIVATE CLIENTS Centralised Kinto customer service centre for all Toyota dealerships
Centralised asset management platform to integrate with dealerships PLATFORM AND CUSTOMER SUPPORT FOR TOYOTA DEALERSHIPS Partnership with local multi-brand dealerships ONBOARD MULTI-BRAND DEALERS MEDIUM TERM LONG TERM Ongoing DO NOT CHANGE 1 2 3 ‹#› RECOMMENDATION SUMMARY<br>
slide7. BUSINESS ANALYSIS<br>
slide8. TAM
(2021 - 2030)1 SAM SOM MAAS INDUSTRY OVERVIEW CHANGING CONSUMER DEMAND IS DRIVING MAAS INDUSTRY GROWTH ‹#› Sources:
Intelligent Transport, 2021
Newsroom, 2021 $3.3B - $40.1B $1.1B - $12.8B $73.7M - $85.8M 32% of TAM 6.7% EU market share 32.1% CAGR (2021 - 2030)<br>
slide9. INDUSTRY DYNAMICS THE DEALER RELATIONSHIP IS IMPORTANT TO KINTO’S SUCCESS ‹#›<br>
slide10. CUSTOMER PROFILE THERE IS AN OPPORTUNITY TO SERVE CUSTOMER NEEDS ‹#› CUSTOMER NEED
High quality
Multi-brand
Efficiency
Ease of booking
Flexibility VALUE PROPOSITION
High quality
Distribution
Vehicle range
Efficiency
Flexibility ✘ ✘<br>
slide11. REVENUE SHARING ANALYSIS MAINTENANCE AND REFURBISHMENTS DRIVE REVENUE ‹#› DEALERSHIPS
(3,000 Dealers) KINTO REVENUE STREAMS
Subscription
Rental
Leasing REVENUE STREAMS
Maintenance
Refurbishment END CONSUMER<br>
slide12. ANALYSIS OF MAAS MODEL ON DEALER THERE IS AN OPPORTUNITY TO BETTER ALIGN DEALER INCENTIVES TO NEW MODEL ‹#› 1 to 2x
(per year) 104x to 156x
(per year) Owned car model Usage model<br>
slide13. DEALER RELATIONSHIP ANALYSIS THERE IS AN OPPORTUNITY TO BETTER ALIGN TO DEALER NEEDS ‹#› CUSTOMER NEED
High quality
Profitability
Capacity management
Distribution VALUE PROPOSITION
High quality cars
Brand recognition
Vehicle range
Distribution ✘ ✘<br>
slide14. RECOMMENDATIONS<br>
slide15. KINTO range
EXISTING regions CONTINUE SERVICING CORPORATE AND PRIVATE CLIENTS Centralised Kinto customer service centre for all Toyota dealerships
Centralised asset management platform to integrate with dealerships TECH & CUSTOMER SUPPORT FOR TOYOTA DEALERSHIPS Partnership with local multi-brand dealerships ONBOARD MULTI-BRAND DEALERS MEDIUM TERM LONG TERM Ongoing DO NOT CHANGE 1 2 3 ‹#› RECOMMENDATION SUMMARY<br>
slide16. KEY ISSUES ‹#› DEALERSHIPS ARE LESS PROFITABLE CHANGE IN CONSUMER NEEDS ! MULTI- BRAND
Brands influence consumer decision making
B2B/B2C POOR DEALERSHIP RELATIONSHIPS
Unused vehicles
Increase capacity requirements: Front end and back-end
“left out” - poor relationship management !<br>
slide17. ALTERNATIVES AND RECOMMENDATIONS Rec1 Rec2 Alt 1 Alt 2 ‹#› Alt 3<br>
slide18. TECH-DRIVEN CENTRALISED SUPPORT FOR DEALERSHIPS
Customer centre - front end → capacity support
Platform integration → asset management support RECOMMENDATION 1: DEALERSHIP TECH AND CUSTOMER SUPPORT IMPACT: DOUBLE FLEET WHY?
Improve relationships ‹#› PROTECT REVENUE FOR DEALER THROUGH EFFICIENCIES
Tech integration -
Stock management - car listing on KINTO platform
Maintenance booking WHY?
Incentivise dealership DRIVER
Operating Efficiency
Access to tech that will drive access to new clients WHY?
Increase market opportunity MED-TERM 1<br>
slide19. EXPAND INTO MULTI-BRAND DEALERSHIP
Demand driven
Improve consumer access to wider range RECOMMENDATION 2: EXPAND TO MULTI-BRAND DEALER IMPACT: 111 EM IN REVENUE WHY?
Consumer decision making process ‹#› USE PARTNERSHIPS WITH EXISTING MULTI-BRAND DEALERSHIPS
Access to Tech
Access to larger customer base
changing consumer need
Smaller distributors WHY?
Tech advantage HOW
Shared services - Technology & customer centre WHY?
Easy plug in model reduce BTE MEDIUM TERM 2<br>
slide20. IMPLEMENTATION PLANS<br>
slide21. THE KINTO PLATFORM AND SERVICE EXPERIENCE ‹#› Requests vehicle lease through KINTO CLIENT DEALER KINTO TECH AND CUSTOMER SERVICE Locates closest dealers with available vehicles Dealer is informed of booking BOOKING PROCESS SERVICE PROCESS Tech informs client of service due and identifies closest dealer with capacity Dealer completes service Collect car from dealer Client drops off at assigned dealer 1<br>
slide22. DEALER BENEFITS
Additional revenue streams
Increased stock utilisation
Maintenance capacity usage
Alleviate customer management
Marketing Kinto platform and app development Customer service team hiring and training Launch to Toyota Dealers IMPLEMENTATION OF KINTO SERVICE ROLL OUT TO DEALERS ‹#› 1 System integration capability
Customer service booking
Front-end client user experience
Dealer partner portal 6 month pilot with Swedish Toyota dealers
3 years roll out to all other 9 countries Dealer conferences
Kinto sales team<br>
slide23. ONBOARDING MULTI-BRAND DEALERS TO THE KINTO OFFERING ‹#› Do not stock Toyota or Lexus
Within 10kms of current partner dealers
Over 30 vehicles in stock
Servicing facilities DEALER CRITERIA 2 USE PILOT AS PROOF OF SUCCESS FOR MULTI-BRAND DEALERS Identify Key Dealers Onboard Sales team
Demos
Data on geo-potential TACTICS<br>
slide24. IMPLEMENTATION ROLL-OUT PLAN DEVELOP KINTO PRODUCT 2022 2023 2026 INCREASE SALES TEAM COSTS:
________
85 Mil EUR BUILD CUSTOMER SERVICE CENTRE 2025 2024 ‹#› Foundation Toyota Dealers Multi-Brand Dealers<br>
slide25. FINANCIAL FORECASTS<br>
slide26. 85 million EUR investment over 3 years funded by existing equity investment ‹#›<br>
slide27. ‹#› 130 000 Vehicles Generating 63 million EUR Revenue<br>
slide28. ‹#› 111 Million EUR Profit Strategy<br>
slide29. POTENTIAL RISK RISK IMPACT LEVEL CONTINGENCY PLAN KEY RISKS AND MITIGATIONS 1 2 3 ‹#›<br>
slide30. IN CLOSING<br>
slide31. ‹#› TO BECOME THE MOBILITY LEADER IN EUROPE KINTO KINDNESS: RELATIONSHIPS ARE KEY DOUBLE FEET
in 2026220K Deliver
111M EUR PROFIT
over 5 years<br>
slide32. CURRENT STATE ANALYSIS
2 | OWNERS CONUNDRUM
3 | VALUE PROMISE
4 | KEY ISSUES
5 | RECOMMENDATIONS Thank you 2022 GSB GROUP
Noxolo Gqada
Egla Ntumba
Topaz Booysen
Rashay Makan<br>
slide33. 3.5% Industry CAGR
600 EUR PM Lease Cost (Corporate)
450 EUR PM Lease Cost (Private)
XX XXX
XXX
XX
XXX
XXX
XX SUMMARY OF KEY FINANCIAL DRIVERS BUSINESS MODEL REVENUE DRIVERS<br>
slide34. XXX XXX ALTERNATIVE 1 ALTERNATIVE 2 XXX ALTERNATIVE 3 ALTERNATIVES 1 2 3 XXXX
XXX
XXX XXXX
XXX
XXX XXXX
XXX
XXX ‹#›<br>
slide35. RECOMMENDATIONS AND ALTERNATIVES 1 2 Alt 1 Alt 2 ‹#› Alt 3<br>
slide36. XXXX
XXX
XXX
XX 2000’s XXXX
XXX
XXX
XX XXXX
XXX
XXX
XX XXXX
XXX
XXX
XX TODAY 2000’s 2000’s 2000’s ‹#› SITUATIONAL ANALYSIS<br>
Egla Ntumba – Business Analysis
Topaz Booysen - Implementation
Rashay Makan – Financial Forecasts JOHN MOLSON CASE COMPETITION KINTO KINTO KINDNESS IS TIMELESS<br>
slide2. MOBILITY MAGIC DISTRIBUTION NETWORK GROWTHDouble fleet size by 2026 ‹#› SITUATIONAL ANALYSIS: KINTO Rapid scale Break even BUSINESS MODEL
CONSUMER NEEDGEOGRAPHICAL ? Technology & Brand<br>
slide3. ‹#›<br>
slide4. Become one of the
Largest cross-brandmobility platform
in 2028 Deliver
DOUBLE FEET
in 2026220K Deliver
111M EUR PROFIT
over 5 years(73% increase to base)Double feet by 2026 VALUE PROMISE ‹#› A 6 year strategy to leverage and incentivise dealerships & expand into multi-brand dealerships 1 2 3 =<br>
slide5. KEY ISSUES ‹#› DEALERSHIPS ARE LESS PROFITABLE CHANGE IN CONSUMER NEEDS ! MULTI- BRAND
Brands influence consumer decision making
B2B/B2C POOR DEALERSHIP RELATIONSHIPS
Unused vehicles
Increase capacity requirements: Front end and back-end
“left out” - poor relationship management !<br>
slide6. KINTO range
EXISTING regions CONTINUE SERVICING CORPORATE AND PRIVATE CLIENTS Centralised Kinto customer service centre for all Toyota dealerships
Centralised asset management platform to integrate with dealerships PLATFORM AND CUSTOMER SUPPORT FOR TOYOTA DEALERSHIPS Partnership with local multi-brand dealerships ONBOARD MULTI-BRAND DEALERS MEDIUM TERM LONG TERM Ongoing DO NOT CHANGE 1 2 3 ‹#› RECOMMENDATION SUMMARY<br>
slide7. BUSINESS ANALYSIS<br>
slide8. TAM
(2021 - 2030)1 SAM SOM MAAS INDUSTRY OVERVIEW CHANGING CONSUMER DEMAND IS DRIVING MAAS INDUSTRY GROWTH ‹#› Sources:
Intelligent Transport, 2021
Newsroom, 2021 $3.3B - $40.1B $1.1B - $12.8B $73.7M - $85.8M 32% of TAM 6.7% EU market share 32.1% CAGR (2021 - 2030)<br>
slide9. INDUSTRY DYNAMICS THE DEALER RELATIONSHIP IS IMPORTANT TO KINTO’S SUCCESS ‹#›<br>
slide10. CUSTOMER PROFILE THERE IS AN OPPORTUNITY TO SERVE CUSTOMER NEEDS ‹#› CUSTOMER NEED
High quality
Multi-brand
Efficiency
Ease of booking
Flexibility VALUE PROPOSITION
High quality
Distribution
Vehicle range
Efficiency
Flexibility ✘ ✘<br>
slide11. REVENUE SHARING ANALYSIS MAINTENANCE AND REFURBISHMENTS DRIVE REVENUE ‹#› DEALERSHIPS
(3,000 Dealers) KINTO REVENUE STREAMS
Subscription
Rental
Leasing REVENUE STREAMS
Maintenance
Refurbishment END CONSUMER<br>
slide12. ANALYSIS OF MAAS MODEL ON DEALER THERE IS AN OPPORTUNITY TO BETTER ALIGN DEALER INCENTIVES TO NEW MODEL ‹#› 1 to 2x
(per year) 104x to 156x
(per year) Owned car model Usage model<br>
slide13. DEALER RELATIONSHIP ANALYSIS THERE IS AN OPPORTUNITY TO BETTER ALIGN TO DEALER NEEDS ‹#› CUSTOMER NEED
High quality
Profitability
Capacity management
Distribution VALUE PROPOSITION
High quality cars
Brand recognition
Vehicle range
Distribution ✘ ✘<br>
slide14. RECOMMENDATIONS<br>
slide15. KINTO range
EXISTING regions CONTINUE SERVICING CORPORATE AND PRIVATE CLIENTS Centralised Kinto customer service centre for all Toyota dealerships
Centralised asset management platform to integrate with dealerships TECH & CUSTOMER SUPPORT FOR TOYOTA DEALERSHIPS Partnership with local multi-brand dealerships ONBOARD MULTI-BRAND DEALERS MEDIUM TERM LONG TERM Ongoing DO NOT CHANGE 1 2 3 ‹#› RECOMMENDATION SUMMARY<br>
slide16. KEY ISSUES ‹#› DEALERSHIPS ARE LESS PROFITABLE CHANGE IN CONSUMER NEEDS ! MULTI- BRAND
Brands influence consumer decision making
B2B/B2C POOR DEALERSHIP RELATIONSHIPS
Unused vehicles
Increase capacity requirements: Front end and back-end
“left out” - poor relationship management !<br>
slide17. ALTERNATIVES AND RECOMMENDATIONS Rec1 Rec2 Alt 1 Alt 2 ‹#› Alt 3<br>
slide18. TECH-DRIVEN CENTRALISED SUPPORT FOR DEALERSHIPS
Customer centre - front end → capacity support
Platform integration → asset management support RECOMMENDATION 1: DEALERSHIP TECH AND CUSTOMER SUPPORT IMPACT: DOUBLE FLEET WHY?
Improve relationships ‹#› PROTECT REVENUE FOR DEALER THROUGH EFFICIENCIES
Tech integration -
Stock management - car listing on KINTO platform
Maintenance booking WHY?
Incentivise dealership DRIVER
Operating Efficiency
Access to tech that will drive access to new clients WHY?
Increase market opportunity MED-TERM 1<br>
slide19. EXPAND INTO MULTI-BRAND DEALERSHIP
Demand driven
Improve consumer access to wider range RECOMMENDATION 2: EXPAND TO MULTI-BRAND DEALER IMPACT: 111 EM IN REVENUE WHY?
Consumer decision making process ‹#› USE PARTNERSHIPS WITH EXISTING MULTI-BRAND DEALERSHIPS
Access to Tech
Access to larger customer base
changing consumer need
Smaller distributors WHY?
Tech advantage HOW
Shared services - Technology & customer centre WHY?
Easy plug in model reduce BTE MEDIUM TERM 2<br>
slide20. IMPLEMENTATION PLANS<br>
slide21. THE KINTO PLATFORM AND SERVICE EXPERIENCE ‹#› Requests vehicle lease through KINTO CLIENT DEALER KINTO TECH AND CUSTOMER SERVICE Locates closest dealers with available vehicles Dealer is informed of booking BOOKING PROCESS SERVICE PROCESS Tech informs client of service due and identifies closest dealer with capacity Dealer completes service Collect car from dealer Client drops off at assigned dealer 1<br>
slide22. DEALER BENEFITS
Additional revenue streams
Increased stock utilisation
Maintenance capacity usage
Alleviate customer management
Marketing Kinto platform and app development Customer service team hiring and training Launch to Toyota Dealers IMPLEMENTATION OF KINTO SERVICE ROLL OUT TO DEALERS ‹#› 1 System integration capability
Customer service booking
Front-end client user experience
Dealer partner portal 6 month pilot with Swedish Toyota dealers
3 years roll out to all other 9 countries Dealer conferences
Kinto sales team<br>
slide23. ONBOARDING MULTI-BRAND DEALERS TO THE KINTO OFFERING ‹#› Do not stock Toyota or Lexus
Within 10kms of current partner dealers
Over 30 vehicles in stock
Servicing facilities DEALER CRITERIA 2 USE PILOT AS PROOF OF SUCCESS FOR MULTI-BRAND DEALERS Identify Key Dealers Onboard Sales team
Demos
Data on geo-potential TACTICS<br>
slide24. IMPLEMENTATION ROLL-OUT PLAN DEVELOP KINTO PRODUCT 2022 2023 2026 INCREASE SALES TEAM COSTS:
________
85 Mil EUR BUILD CUSTOMER SERVICE CENTRE 2025 2024 ‹#› Foundation Toyota Dealers Multi-Brand Dealers<br>
slide25. FINANCIAL FORECASTS<br>
slide26. 85 million EUR investment over 3 years funded by existing equity investment ‹#›<br>
slide27. ‹#› 130 000 Vehicles Generating 63 million EUR Revenue<br>
slide28. ‹#› 111 Million EUR Profit Strategy<br>
slide29. POTENTIAL RISK RISK IMPACT LEVEL CONTINGENCY PLAN KEY RISKS AND MITIGATIONS 1 2 3 ‹#›<br>
slide30. IN CLOSING<br>
slide31. ‹#› TO BECOME THE MOBILITY LEADER IN EUROPE KINTO KINDNESS: RELATIONSHIPS ARE KEY DOUBLE FEET
in 2026220K Deliver
111M EUR PROFIT
over 5 years<br>
slide32. CURRENT STATE ANALYSIS
2 | OWNERS CONUNDRUM
3 | VALUE PROMISE
4 | KEY ISSUES
5 | RECOMMENDATIONS Thank you 2022 GSB GROUP
Noxolo Gqada
Egla Ntumba
Topaz Booysen
Rashay Makan<br>
slide33. 3.5% Industry CAGR
600 EUR PM Lease Cost (Corporate)
450 EUR PM Lease Cost (Private)
XX XXX
XXX
XX
XXX
XXX
XX SUMMARY OF KEY FINANCIAL DRIVERS BUSINESS MODEL REVENUE DRIVERS<br>
slide34. XXX XXX ALTERNATIVE 1 ALTERNATIVE 2 XXX ALTERNATIVE 3 ALTERNATIVES 1 2 3 XXXX
XXX
XXX XXXX
XXX
XXX XXXX
XXX
XXX ‹#›<br>
slide35. RECOMMENDATIONS AND ALTERNATIVES 1 2 Alt 1 Alt 2 ‹#› Alt 3<br>
slide36. XXXX
XXX
XXX
XX 2000’s XXXX
XXX
XXX
XX XXXX
XXX
XXX
XX XXXX
XXX
XXX
XX TODAY 2000’s 2000’s 2000’s ‹#› SITUATIONAL ANALYSIS<br>