OECD-WTO TiVA database Eurostat Seminar: Global Value Chains and Economic Globalisation Dublin, April 2013 nadim.ahmadoecd.org Background: Increasing international fragmentation of production . Has meant that gross trade statistics may
Related Topics
Share
Embed code
Download this presentation From Below
"OECD-WTO TiVA database Eurostat Seminar: Global" is the property of its rightful owner. Permission is granted to
download and print the materials on this website for personal, non-commercial use only, and to display it
on your personal computer provided you do not modify the materials and that you retain all copyright
notices contained in the materials. By downloading content from our website, you accept the terms of this
agreement.
Presentation Transcript
01
OECD-WTO TiVA database
Eurostat Seminar:
Global Value Chains and Economic Globalisation
Dublin, April 2013 nadim.ahmad@oecd.org<br>
02
Background: Increasing international fragmentation of production …. Has meant that gross trade statistics may create ‘misleading perceptions’ and imperfect policies
Export driven growth strategies may target the wrong industries and export markets.
typically reveal a low contribution made by the service sector (less than 25%), and
cannot reveal whose final consumers drive supply
Protectionism can be counter-productive
Imports can improve competitiveness
And imports increasingly embody value originally generated in the importing country. 2<br>
03
Trade in Value-Added Provides a means to better inform such policies
And others………..
Systemic risks:- impact of macro-economic shocks on supply-chains
Integration of emerging economies in GVCs
Bilateral Trade Balances 3<br>
04
How do we measure TiVA? Using a global IO table 4<br>
05
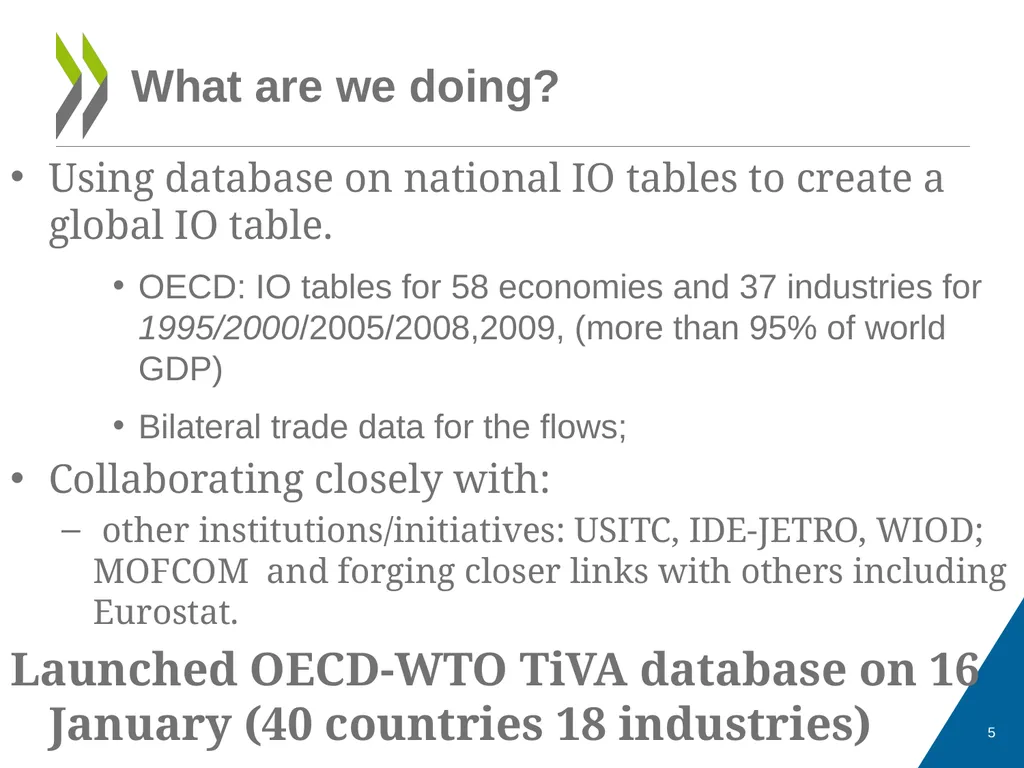
What are we doing? Using database on national IO tables to create a global IO table.
OECD: IO tables for 58 economies and 37 industries for 1995/2000/2005/2008,2009, (more than 95% of world GDP)
Bilateral trade data for the flows;
Collaborating closely with:
other institutions/initiatives: USITC, IDE-JETRO, WIOD; MOFCOM and forging closer links with others including Eurostat.
Launched OECD-WTO TiVA database on 16 January (40 countries 18 industries) 5<br>
06
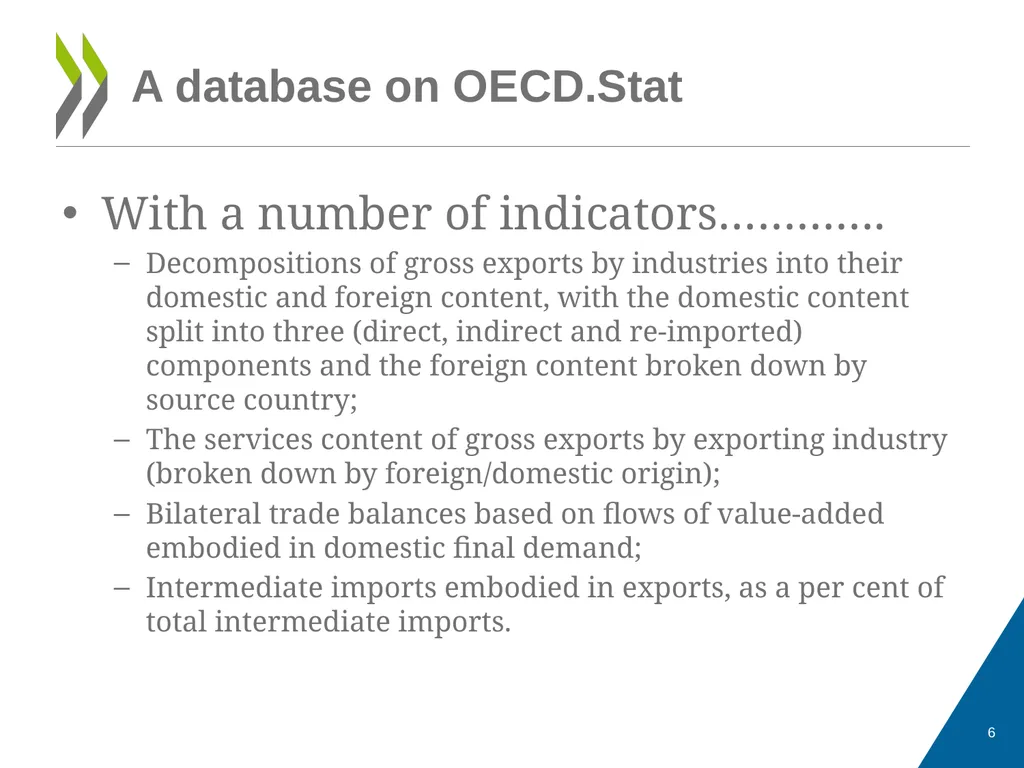
A database on OECD.Stat With a number of indicators………….
Decompositions of gross exports by industries into their domestic and foreign content, with the domestic content split into three (direct, indirect and re-imported) components and the foreign content broken down by source country;
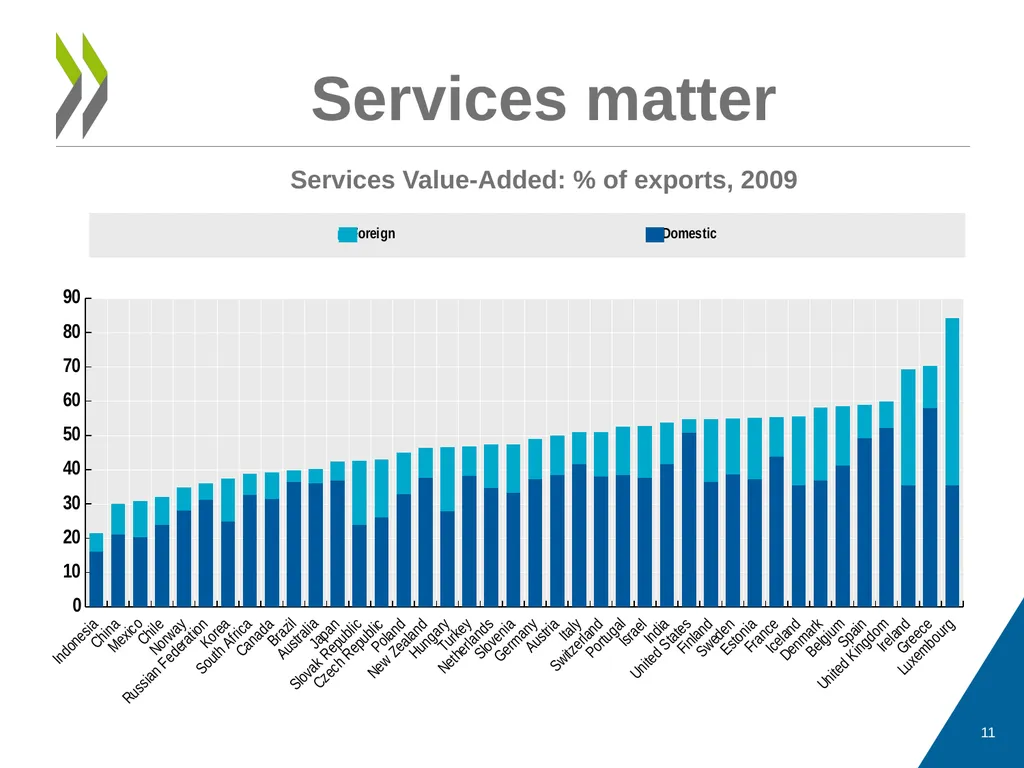
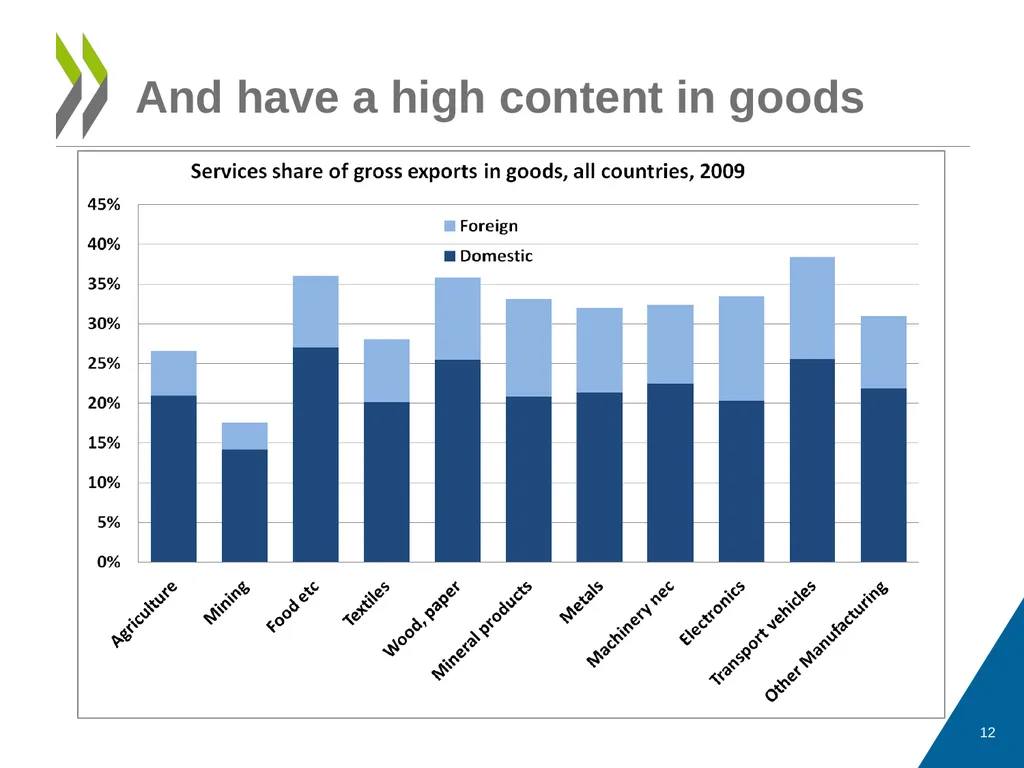
The services content of gross exports by exporting industry (broken down by foreign/domestic origin);
Bilateral trade balances based on flows of value-added embodied in domestic final demand;
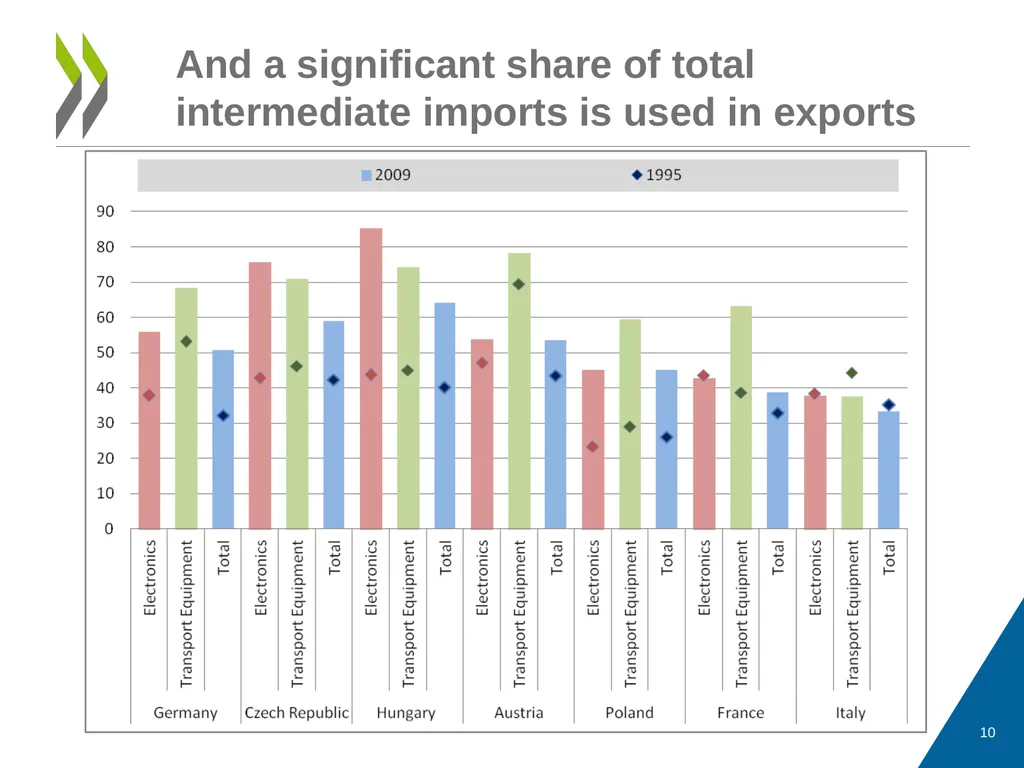
Intermediate imports embodied in exports, as a per cent of total intermediate imports. 6<br>
07
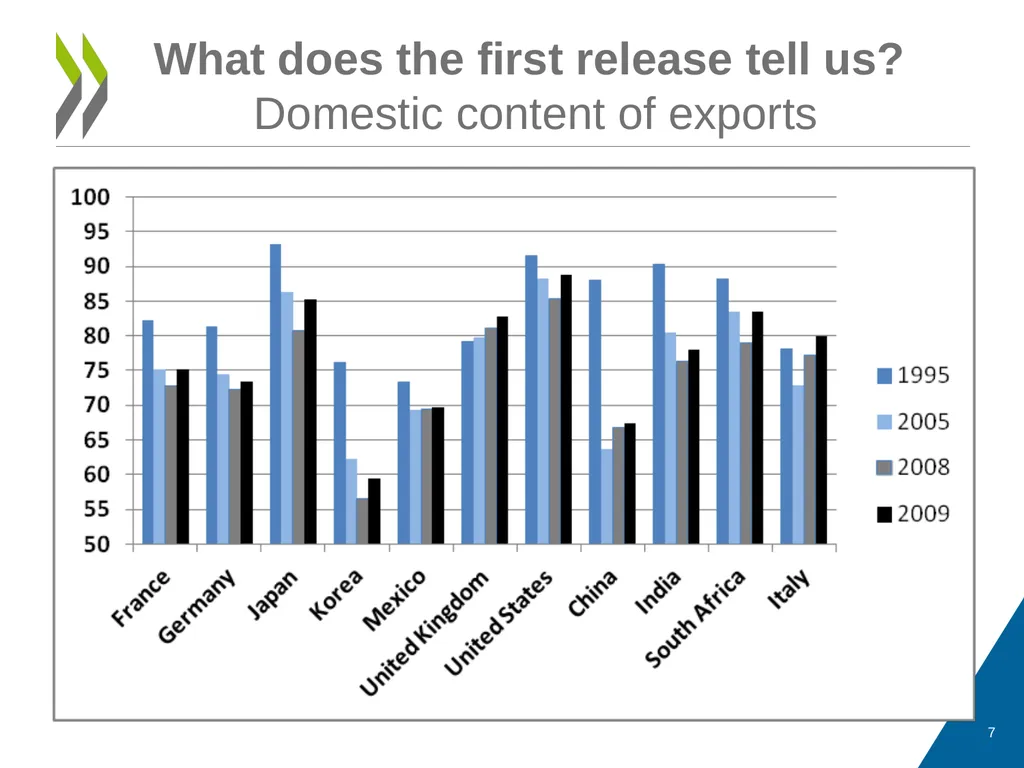
What does the first release tell us? Domestic content of exports 7<br>
08
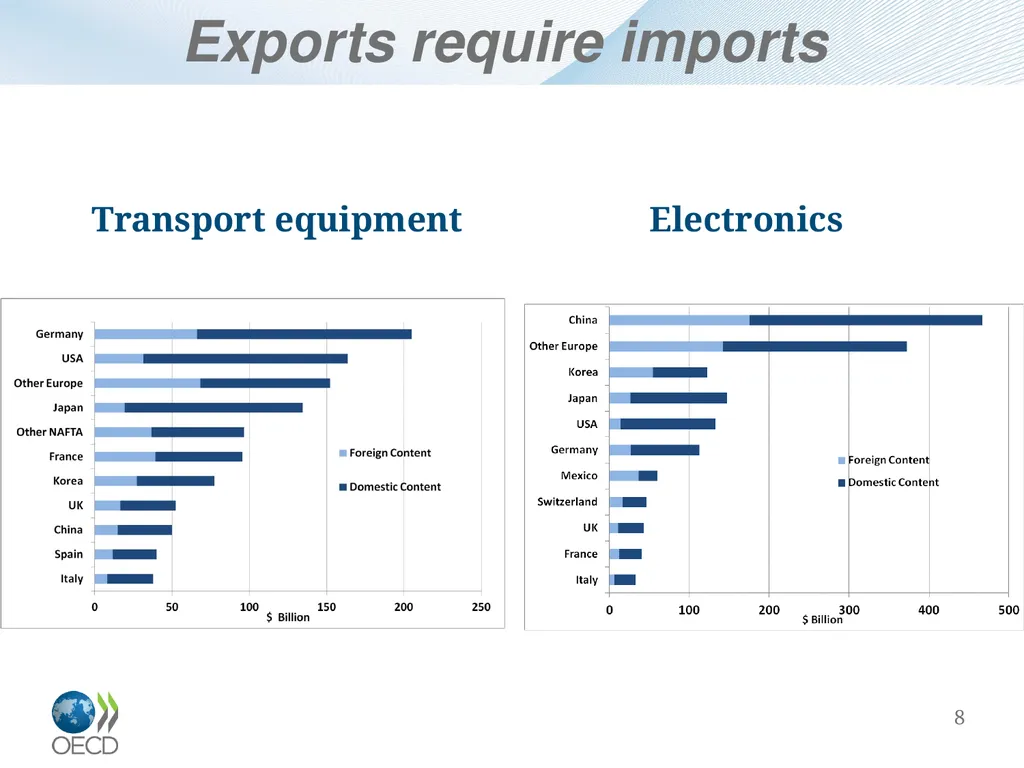
Exports require imports Transport equipment Electronics 8<br>
09
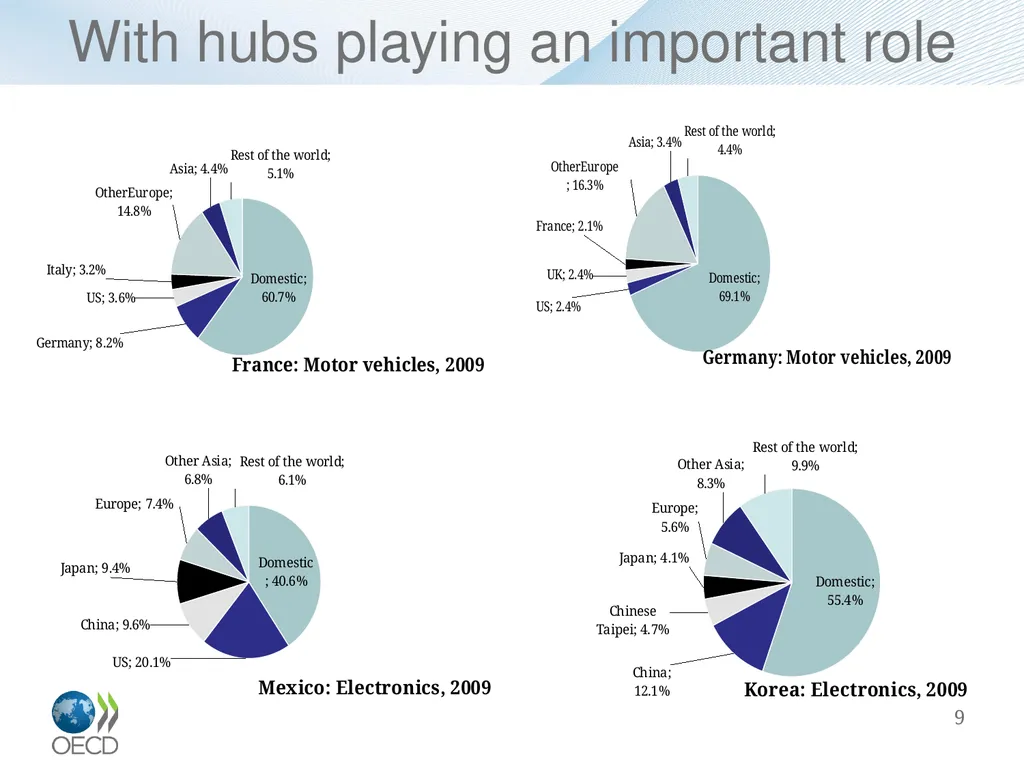
With hubs playing an important role 9<br>
10
And a significant share of total intermediate imports is used in exports 10<br>
11
Services matter Services Value-Added: % of exports, 2009 11<br>
12
And have a high content in goods 12<br>
13
Who trades with who? Japan’s trade balances 13<br>
14
14<br>
15
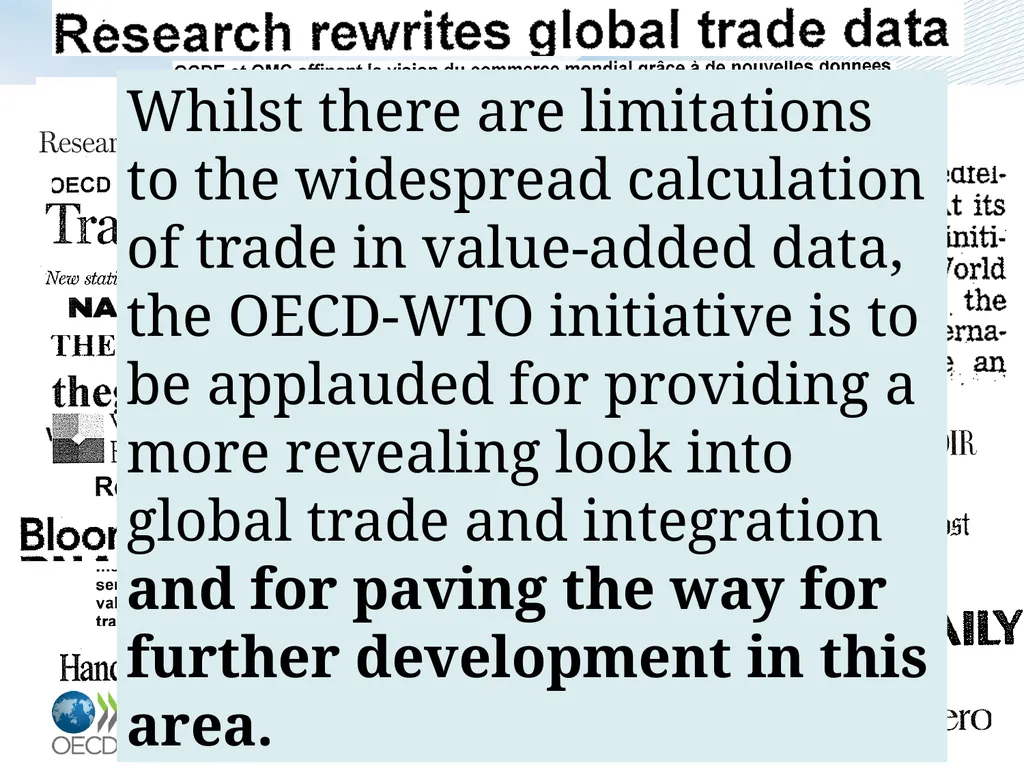
15 Whilst there are limitations to the widespread calculation of trade in value-added data, the OECD-WTO initiative is to be applauded for providing a more revealing look into global trade and integration and for paving the way for further development in this area.<br>
16
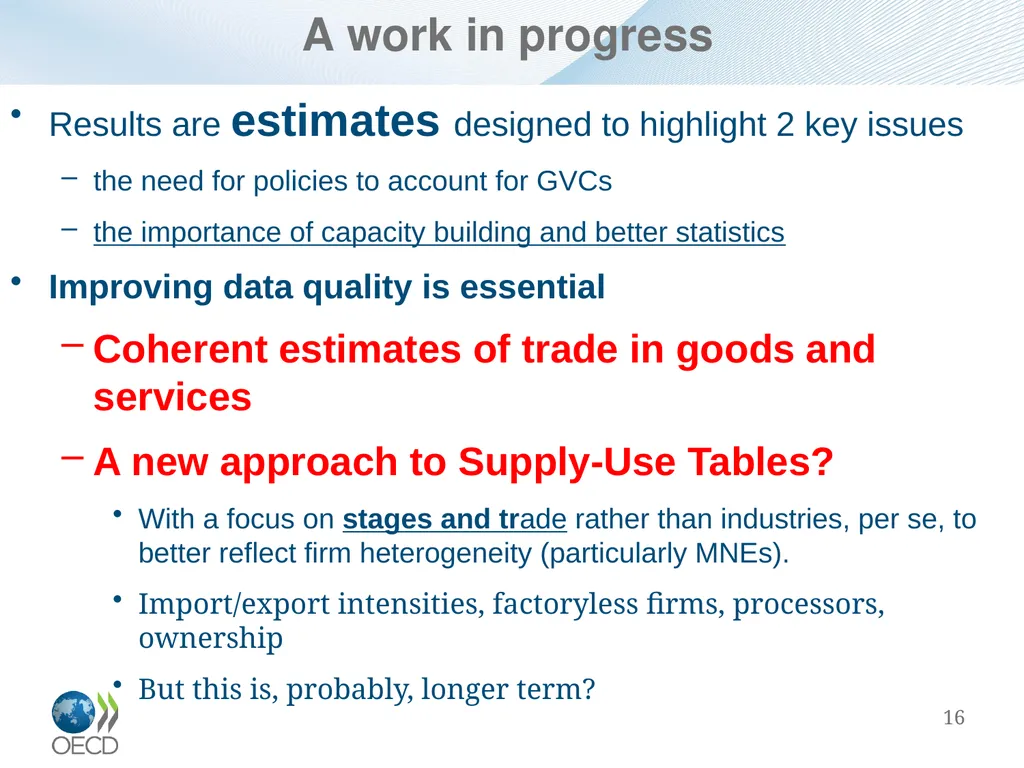
A work in progress Results are estimates designed to highlight 2 key issues
the need for policies to account for GVCs
the importance of capacity building and better statistics
Improving data quality is essential
Coherent estimates of trade in goods and services
A new approach to Supply-Use Tables?
With a focus on stages and trade rather than industries, per se, to better reflect firm heterogeneity (particularly MNEs).
Import/export intensities, factoryless firms, processors, ownership
But this is, probably, longer term? 16<br>
17
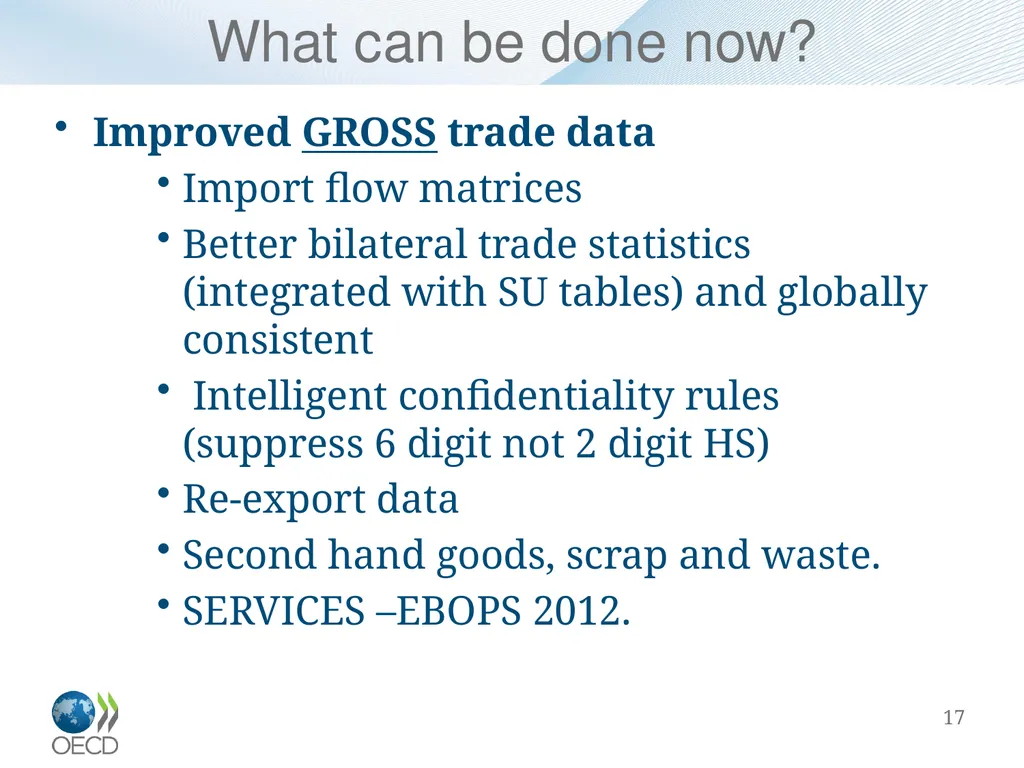
What can be done now? Improved GROSS trade data
Import flow matrices
Better bilateral trade statistics (integrated with SU tables) and globally consistent
Intelligent confidentiality rules (suppress 6 digit not 2 digit HS)
Re-export data
Second hand goods, scrap and waste.
SERVICES –EBOPS 2012. 17<br>
18
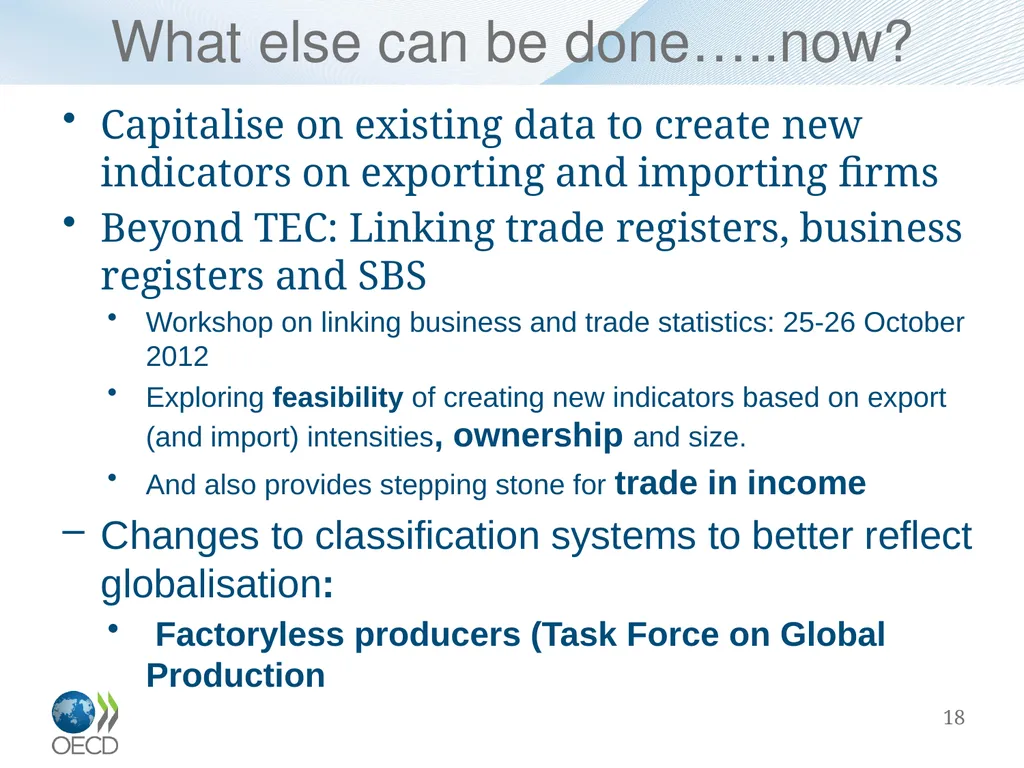
What else can be done…..now? Capitalise on existing data to create new indicators on exporting and importing firms
Beyond TEC: Linking trade registers, business registers and SBS
Workshop on linking business and trade statistics: 25-26 October 2012
Exploring feasibility of creating new indicators based on export (and import) intensities, ownership and size.
And also provides stepping stone for trade in income
Changes to classification systems to better reflect globalisation:
Factoryless producers (Task Force on Global Production 18<br>
19
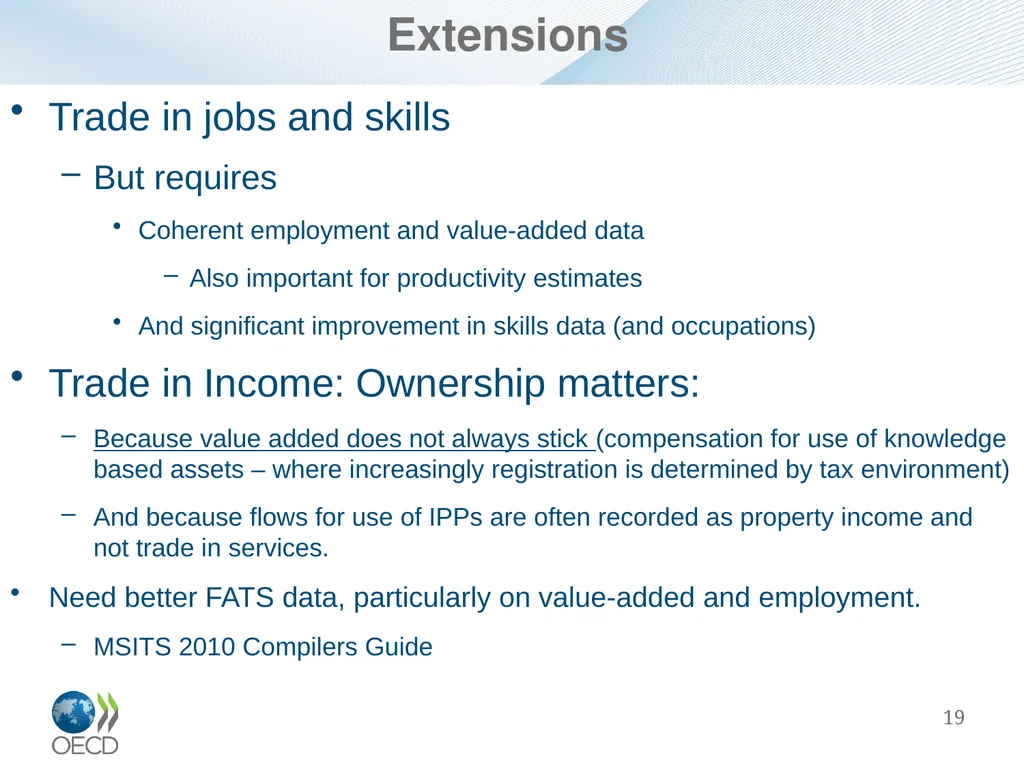
Extensions Trade in jobs and skills
But requires
Coherent employment and value-added data
Also important for productivity estimates
And significant improvement in skills data (and occupations)
Trade in Income: Ownership matters:
Because value added does not always stick (compensation for use of knowledge based assets – where increasingly registration is determined by tax environment)
And because flows for use of IPPs are often recorded as property income and not trade in services.
Need better FATS data, particularly on value-added and employment.
MSITS 2010 Compilers Guide 19<br>
20
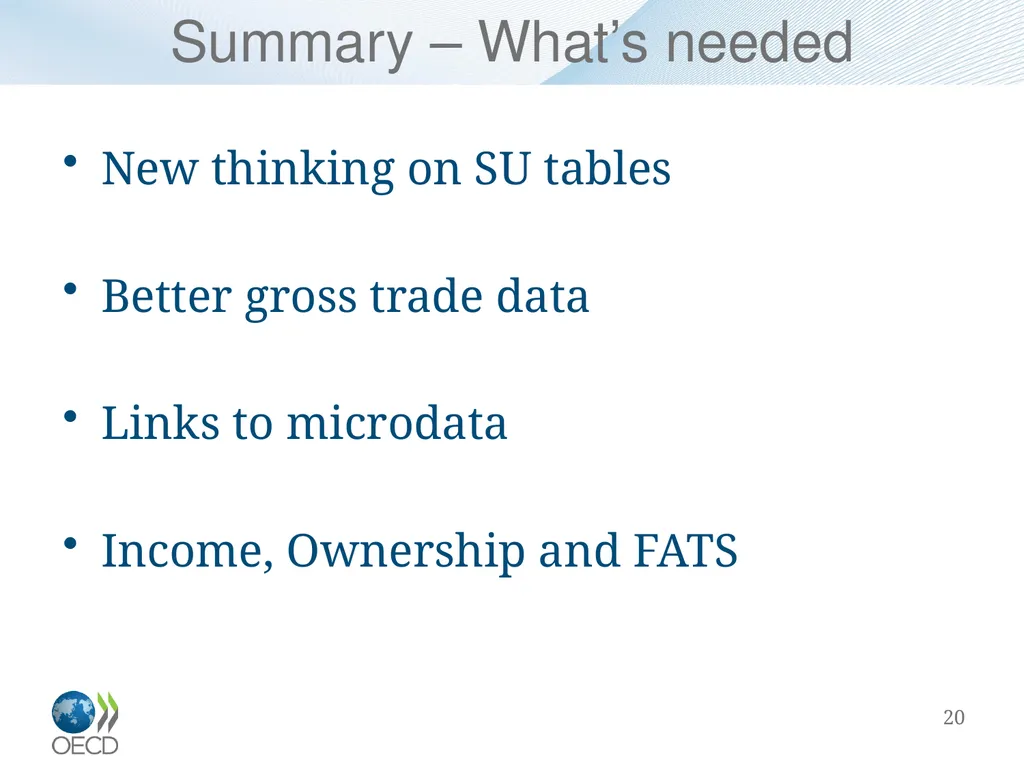
Summary – What’s needed New thinking on SU tables
Better gross trade data
Links to microdata
Income, Ownership and FATS 20<br>
21
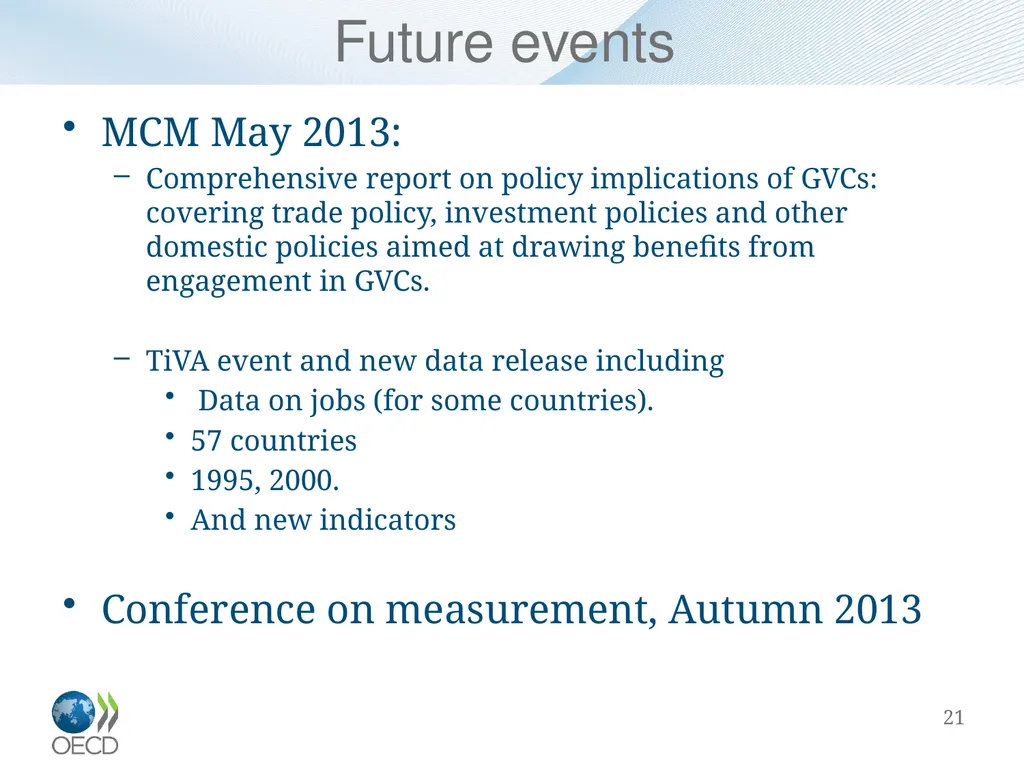
Future events MCM May 2013:
Comprehensive report on policy implications of GVCs: covering trade policy, investment policies and other domestic policies aimed at drawing benefits from engagement in GVCs.
TiVA event and new data release including
Data on jobs (for some countries).
57 countries
1995, 2000.
And new indicators