04
What is the Data Science Pathfinder Programme?<br>
05
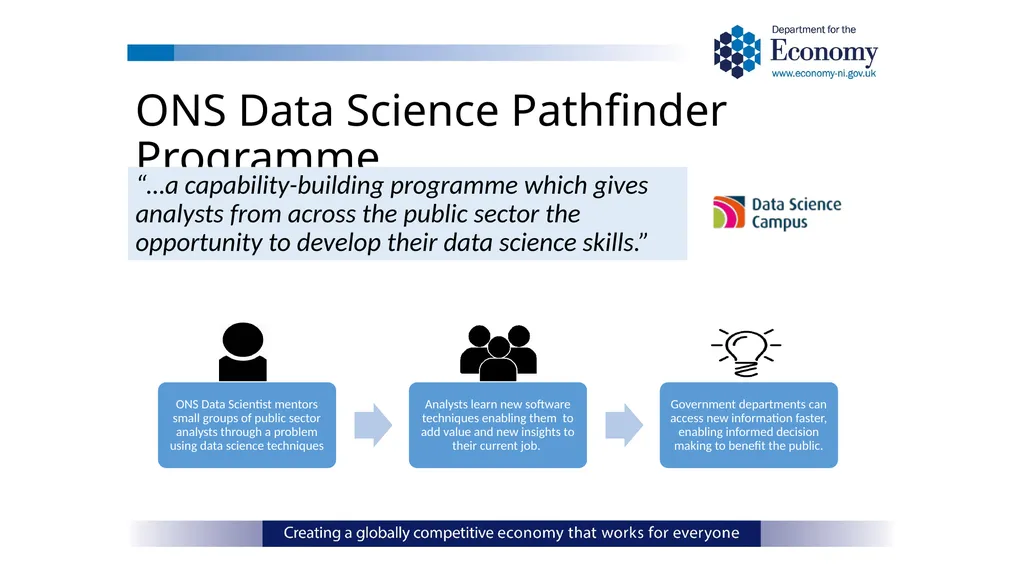
ONS Data Science Pathfinder Programme “…a capability-building programme which gives analysts from across the public sector the opportunity to develop their data science skills.”<br>
06
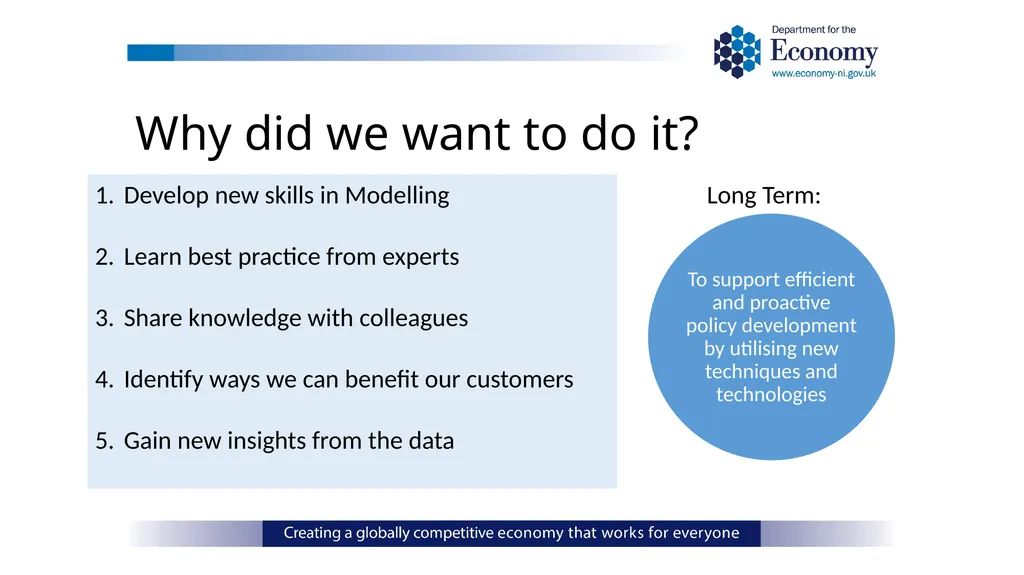
Why did we want to do it? Develop new skills in Modelling
Learn best practice from experts
Share knowledge with colleagues
Identify ways we can benefit our customers
Gain new insights from the data Long Term:<br>
07
Predicting success on the Training for Success programme<br>
08
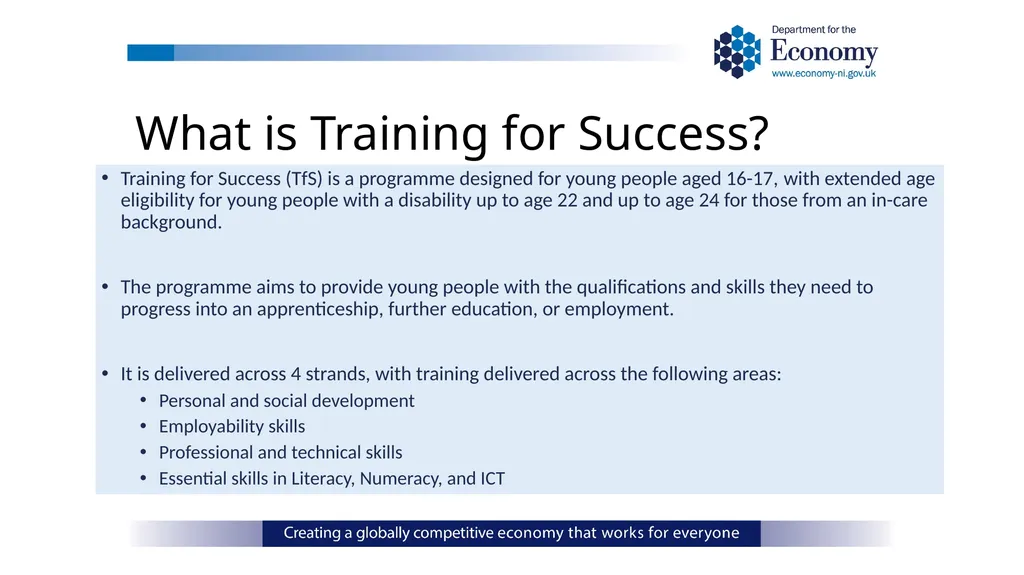
What is Training for Success? Training for Success (TfS) is a programme designed for young people aged 16-17, with extended age eligibility for young people with a disability up to age 22 and up to age 24 for those from an in-care background.
The programme aims to provide young people with the qualifications and skills they need to progress into an apprenticeship, further education, or employment.
It is delivered across 4 strands, with training delivered across the following areas:
Personal and social development
Employability skills
Professional and technical skills
Essential skills in Literacy, Numeracy, and ICT<br>
09
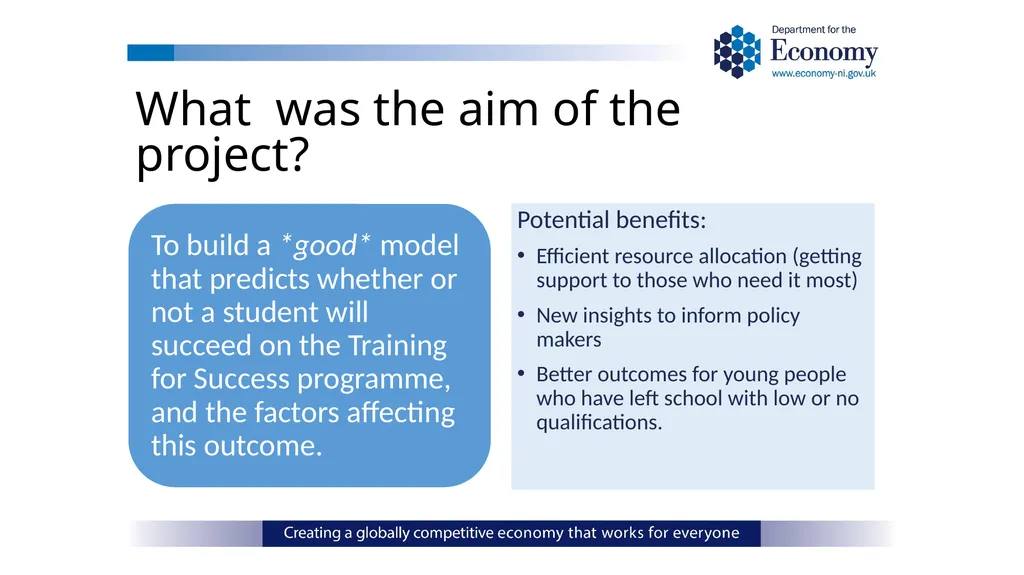
What was the aim of the project? Potential benefits:
Efficient resource allocation (getting support to those who need it most)
New insights to inform policy makers
Better outcomes for young people who have left school with low or no qualifications.<br>
11
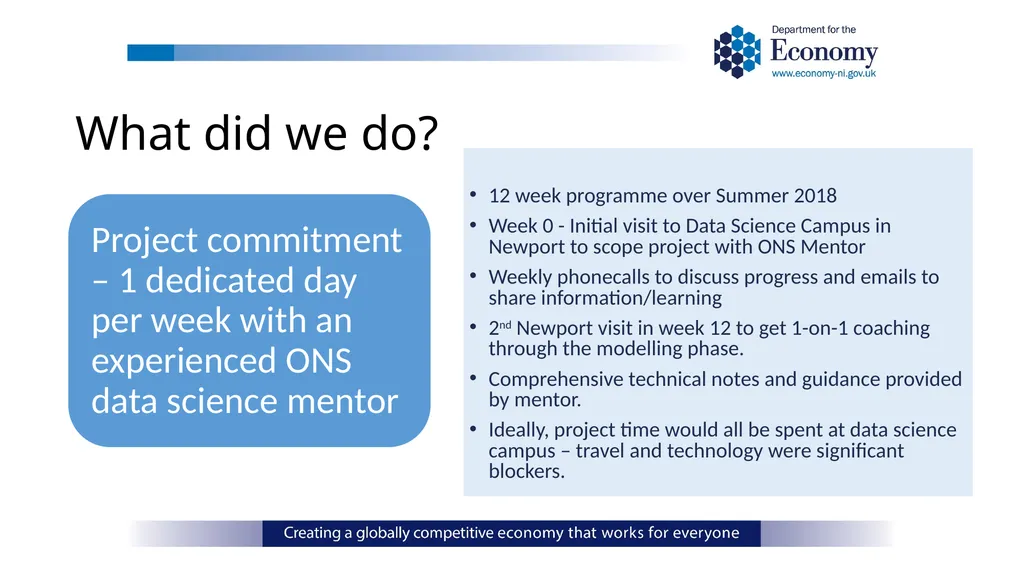
What did we do? 12 week programme over Summer 2018
Week 0 - Initial visit to Data Science Campus in Newport to scope project with ONS Mentor
Weekly phonecalls to discuss progress and emails to share information/learning
2nd Newport visit in week 12 to get 1-on-1 coaching through the modelling phase.
Comprehensive technical notes and guidance provided by mentor.
Ideally, project time would all be spent at data science campus – travel and technology were significant blockers.<br>
12
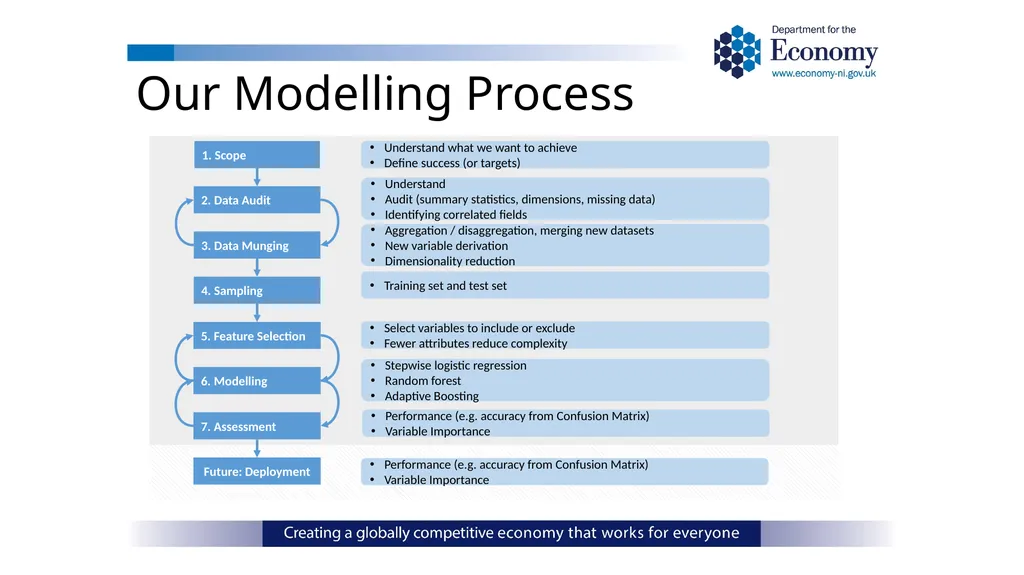
Our Modelling Process 2. Data Audit 3. Data Munging 5. Feature Selection 6. Modelling 4. Sampling 7. Assessment Future: Deployment Understand what we want to achieve
Define success (or targets) Understand
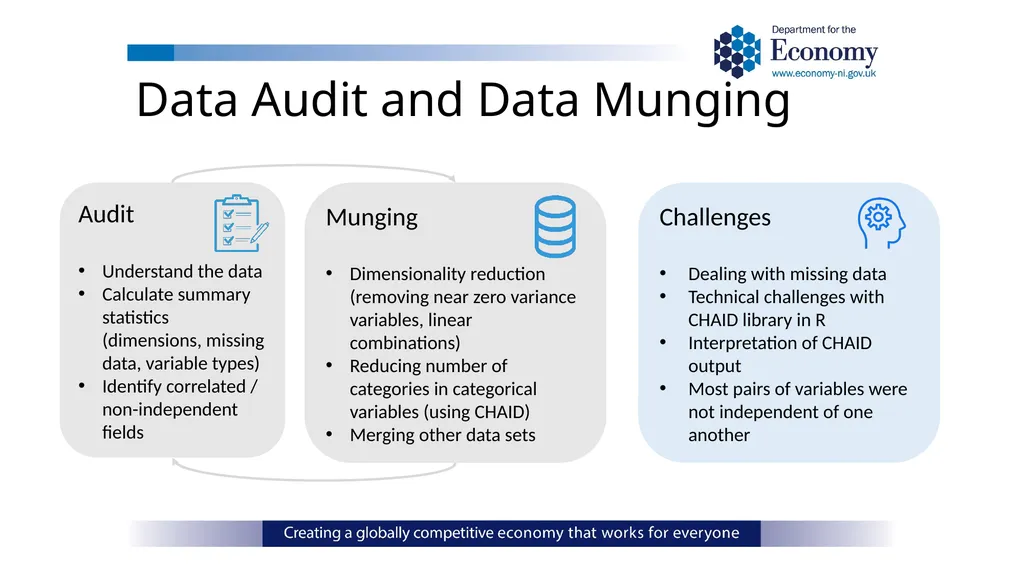
Audit (summary statistics, dimensions, missing data)
Identifying correlated fields Aggregation / disaggregation, merging new datasets
New variable derivation
Dimensionality reduction Training set and test set Select variables to include or exclude
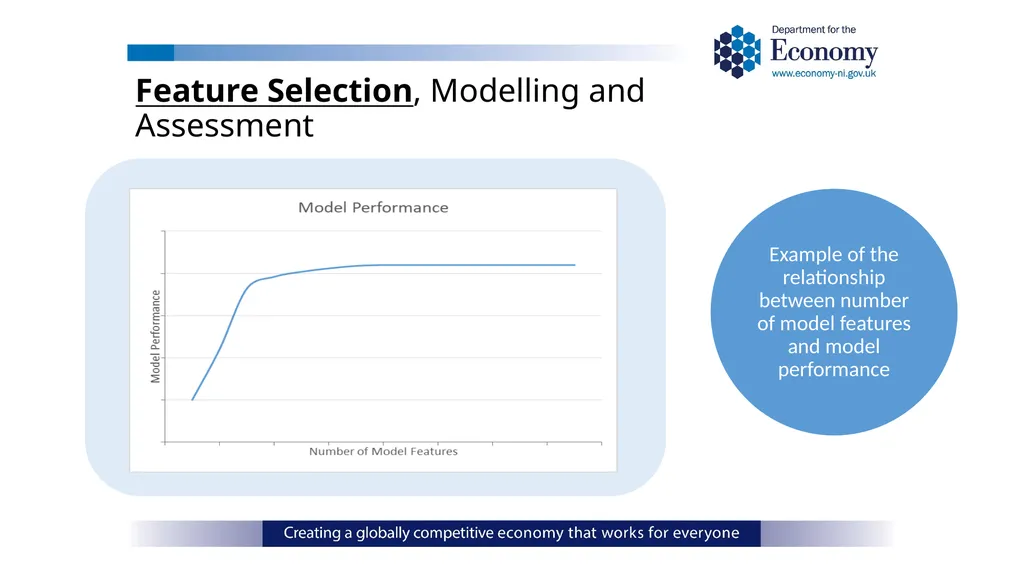
Fewer attributes reduce complexity Stepwise logistic regression
Random forest
Adaptive Boosting Performance (e.g. accuracy from Confusion Matrix)
Variable Importance 1. Scope Performance (e.g. accuracy from Confusion Matrix)
Variable Importance<br>
13
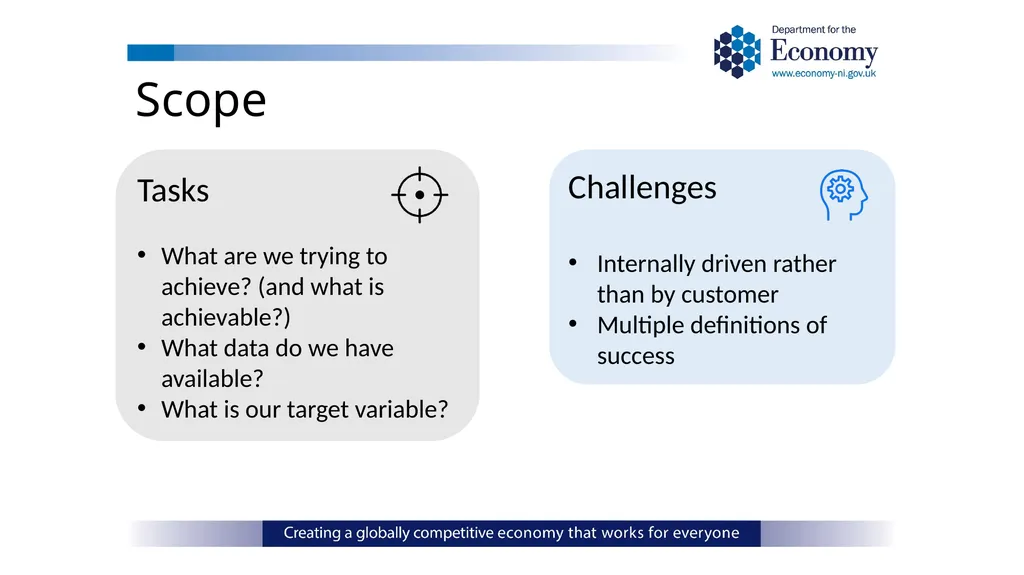
Scope Tasks
What are we trying to achieve? (and what is achievable?)
What data do we have available?
What is our target variable? Challenges
Internally driven rather than by customer
Multiple definitions of success<br>
14
Data Audit and Data Munging<br>
15
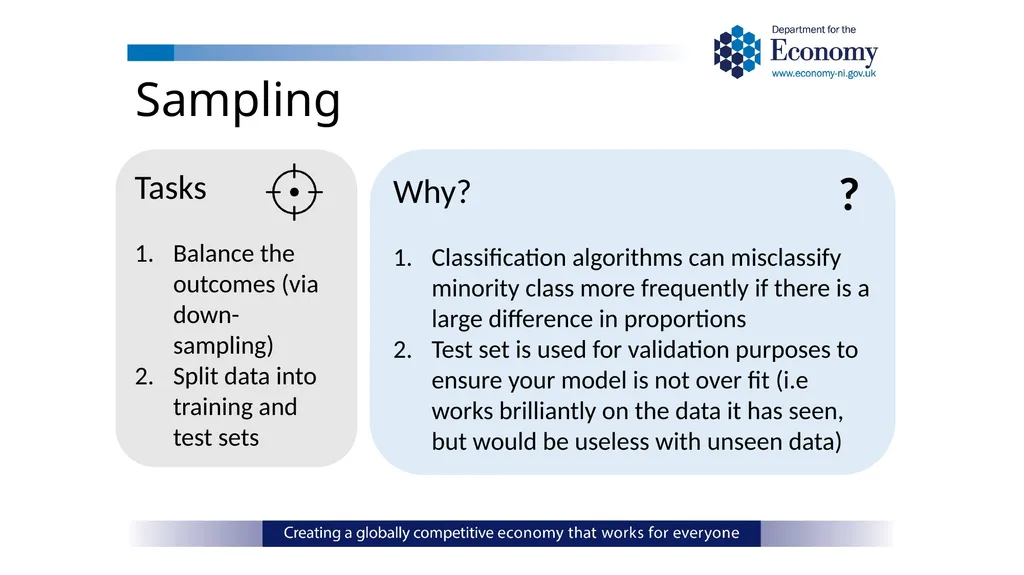
Sampling Tasks
Balance the outcomes (via down-sampling)
Split data into training and test sets Why?
Classification algorithms can misclassify minority class more frequently if there is a large difference in proportions
Test set is used for validation purposes to ensure your model is not over fit (i.e works brilliantly on the data it has seen, but would be useless with unseen data) ?<br>
16
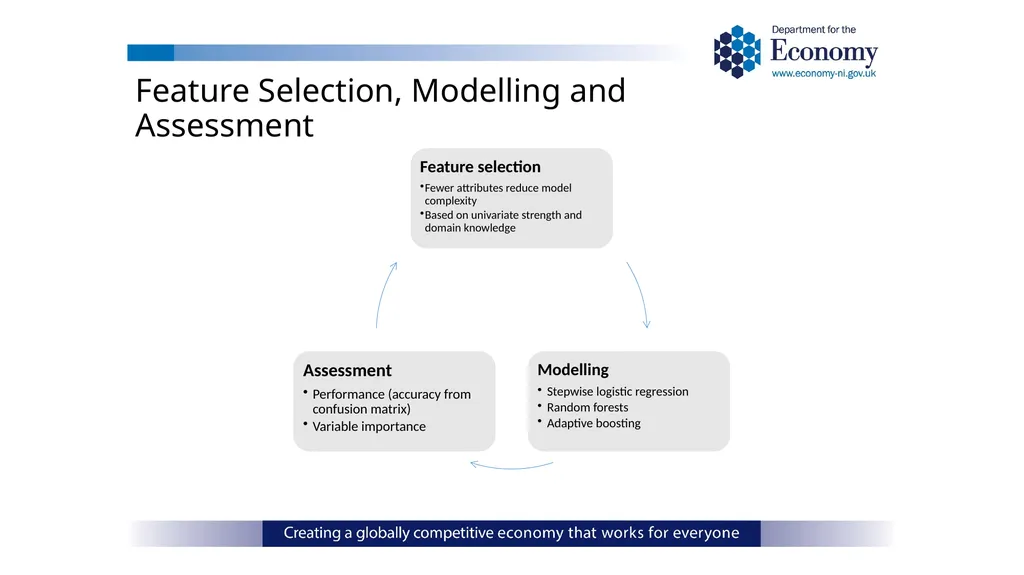
Feature Selection, Modelling and Assessment<br>
17
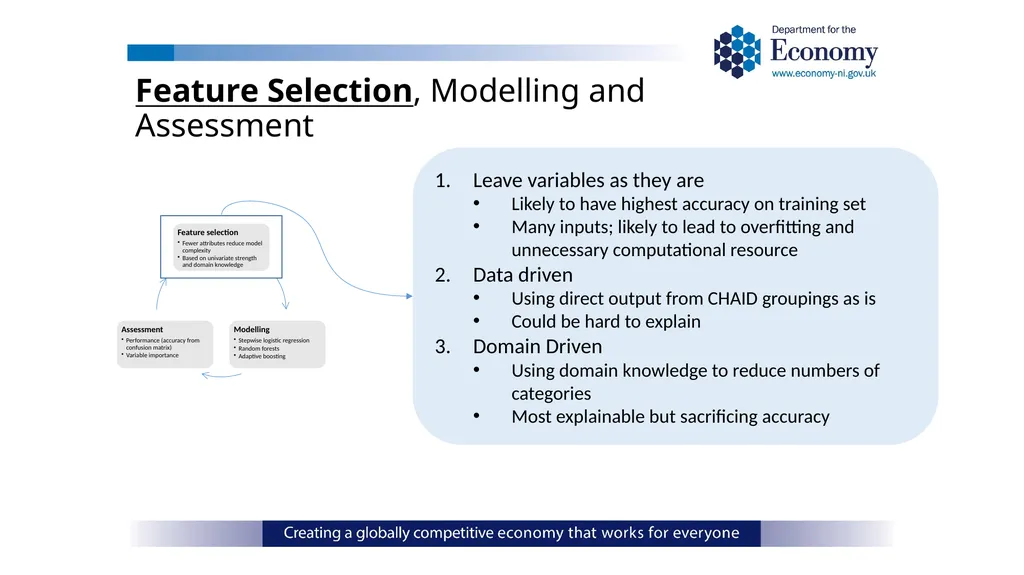
Feature Selection, Modelling and Assessment Leave variables as they are
Likely to have highest accuracy on training set
Many inputs; likely to lead to overfitting and unnecessary computational resource
Data driven
Using direct output from CHAID groupings as is
Could be hard to explain
Domain Driven
Using domain knowledge to reduce numbers of categories
Most explainable but sacrificing accuracy<br>
18
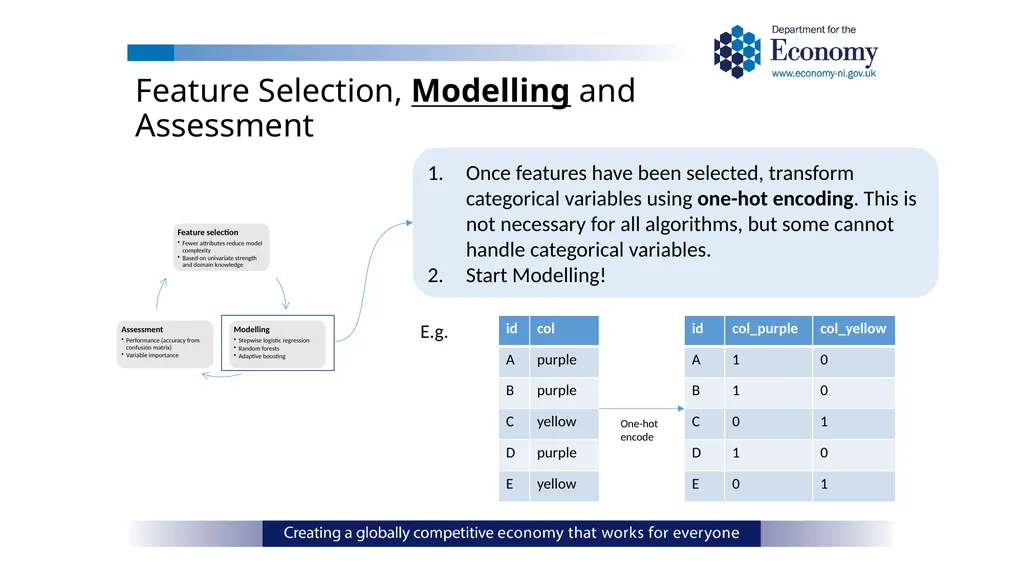
Feature Selection, Modelling and Assessment Once features have been selected, transform categorical variables using one-hot encoding. This is not necessary for all algorithms, but some cannot handle categorical variables.
Start Modelling! E.g. One-hot encode<br>
19
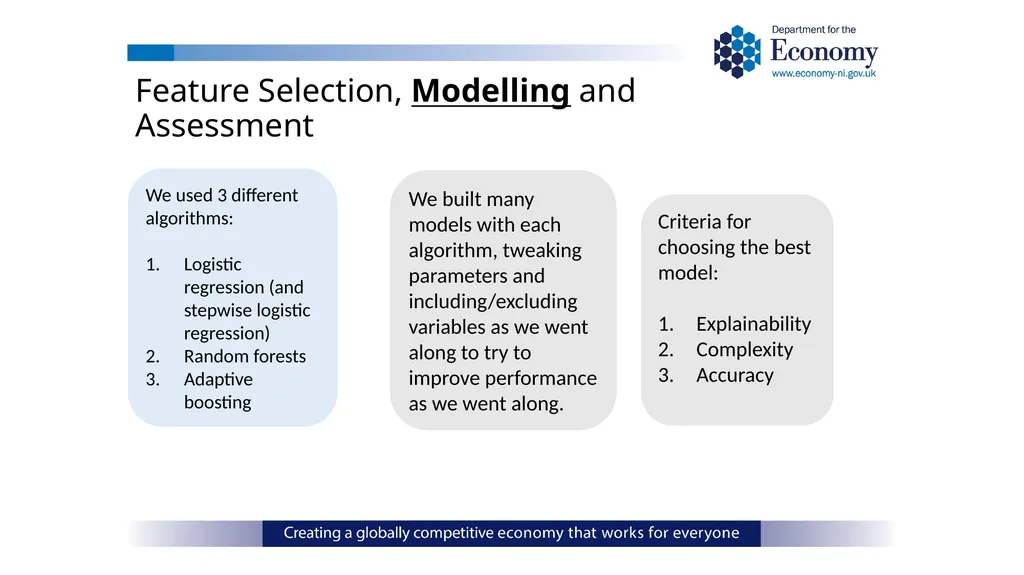
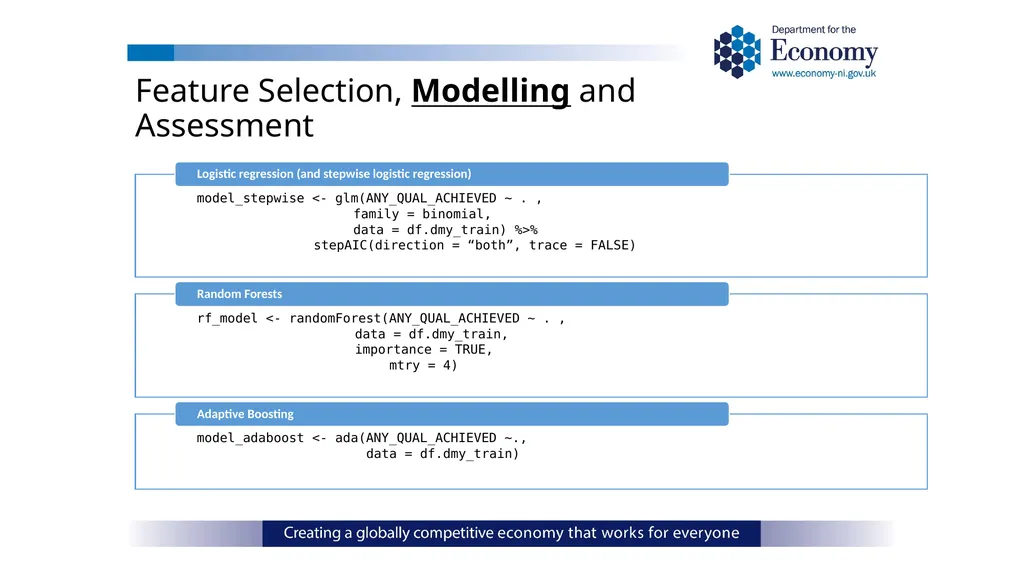
Feature Selection, Modelling and Assessment We used 3 different algorithms:
Logistic regression (and stepwise logistic regression)
Random forests
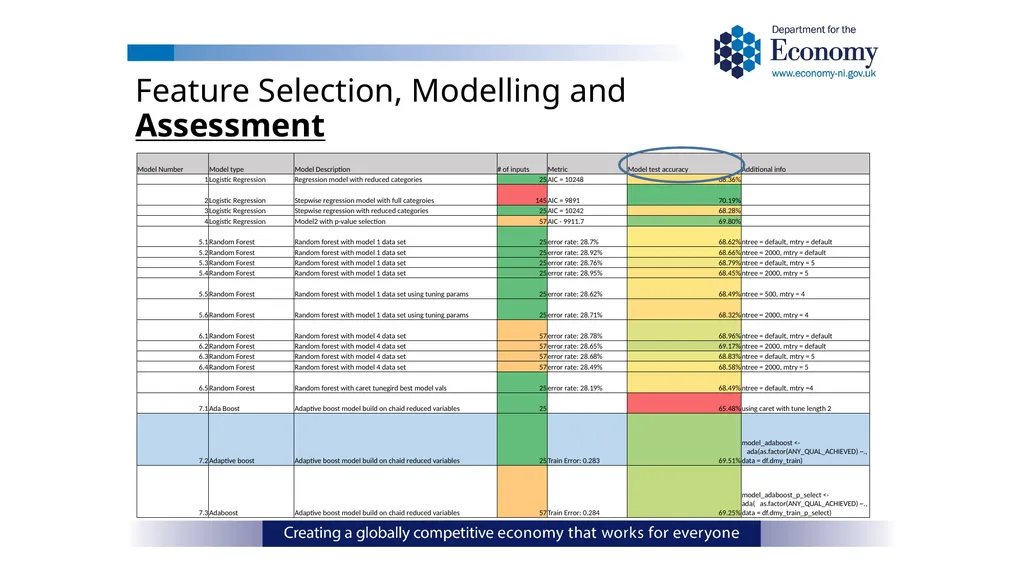
Adaptive boosting We built many models with each algorithm, tweaking parameters and including/excluding variables as we went along to try to improve performance as we went along. Criteria for choosing the best model:
Explainability
Complexity
Accuracy<br>
20
Feature Selection, Modelling and Assessment<br>
21
Feature Selection, Modelling and Assessment<br>
22
Feature Selection, Modelling and Assessment<br>
23
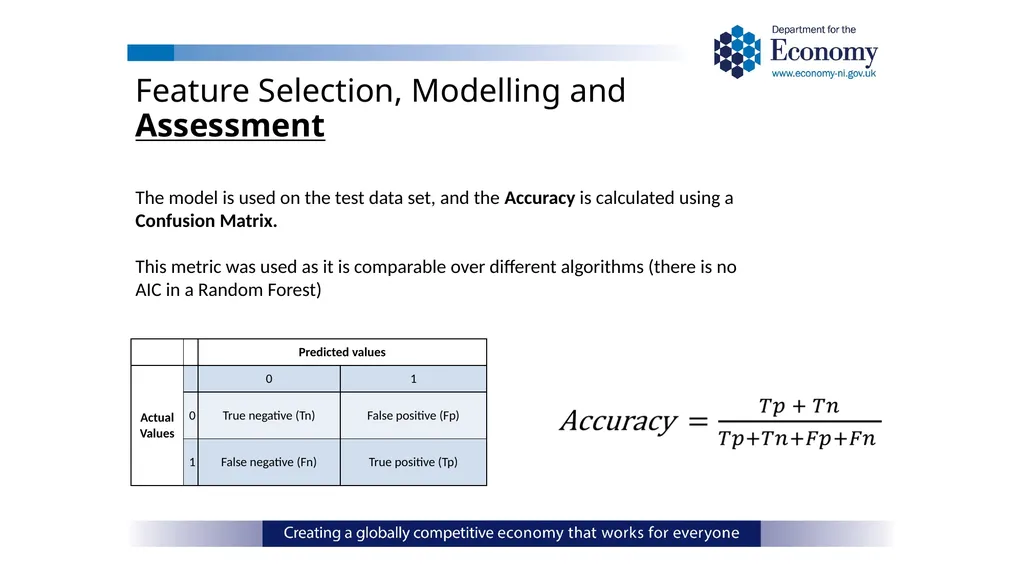
Feature Selection, Modelling and Assessment The model is used on the test data set, and the Accuracy is calculated using a Confusion Matrix.
This metric was used as it is comparable over different algorithms (there is no AIC in a Random Forest)<br>
25
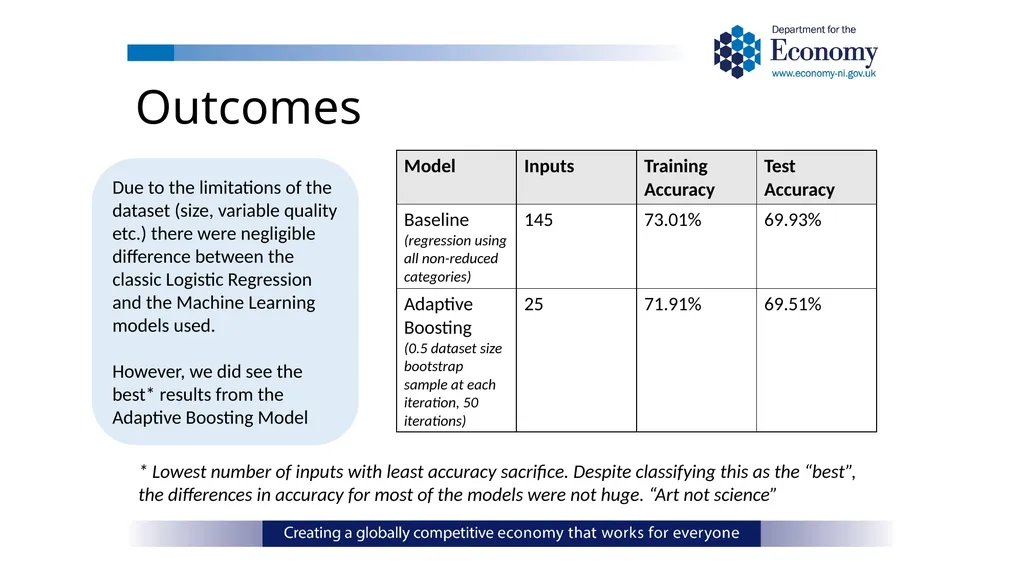
Outcomes Due to the limitations of the dataset (size, variable quality etc.) there were negligible difference between the classic Logistic Regression and the Machine Learning models used.
However, we did see the best* results from the Adaptive Boosting Model * Lowest number of inputs with least accuracy sacrifice. Despite classifying this as the “best”, the differences in accuracy for most of the models were not huge. “Art not science”<br>
26
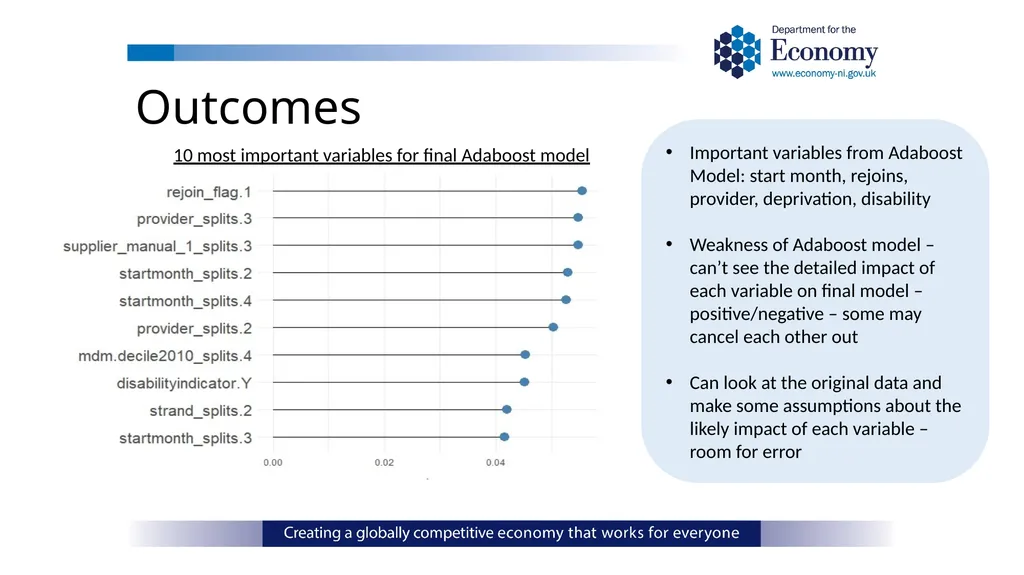
Outcomes 10 most important variables for final Adaboost model Important variables from Adaboost Model: start month, rejoins, provider, deprivation, disability
Weakness of Adaboost model – can’t see the detailed impact of each variable on final model – positive/negative – some may cancel each other out
Can look at the original data and make some assumptions about the likely impact of each variable – room for error<br>
27
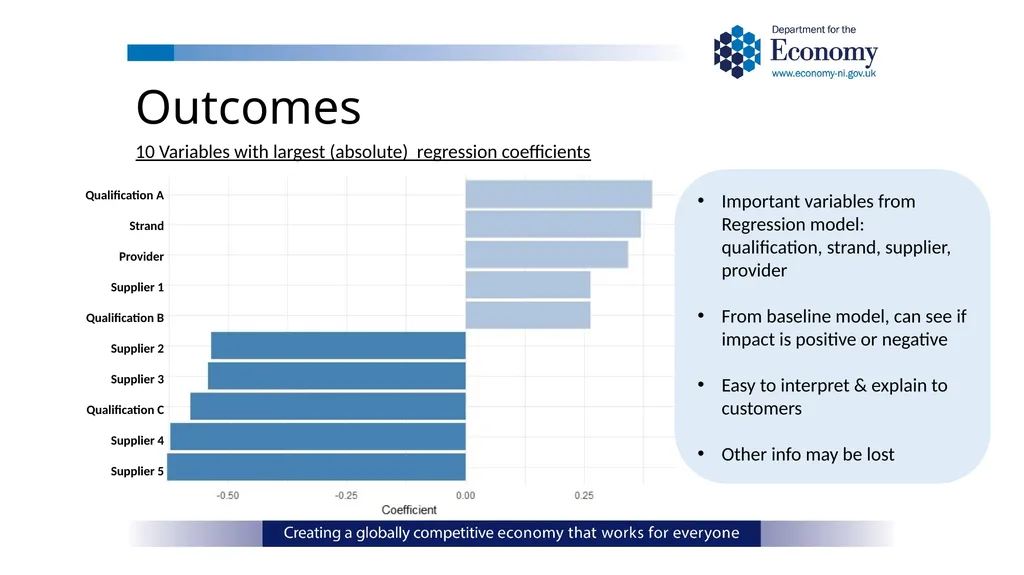
Outcomes 10 Variables with largest (absolute) regression coefficients Important variables from Regression model: qualification, strand, supplier, provider
From baseline model, can see if impact is positive or negative
Easy to interpret & explain to customers
Other info may be lost<br>
28
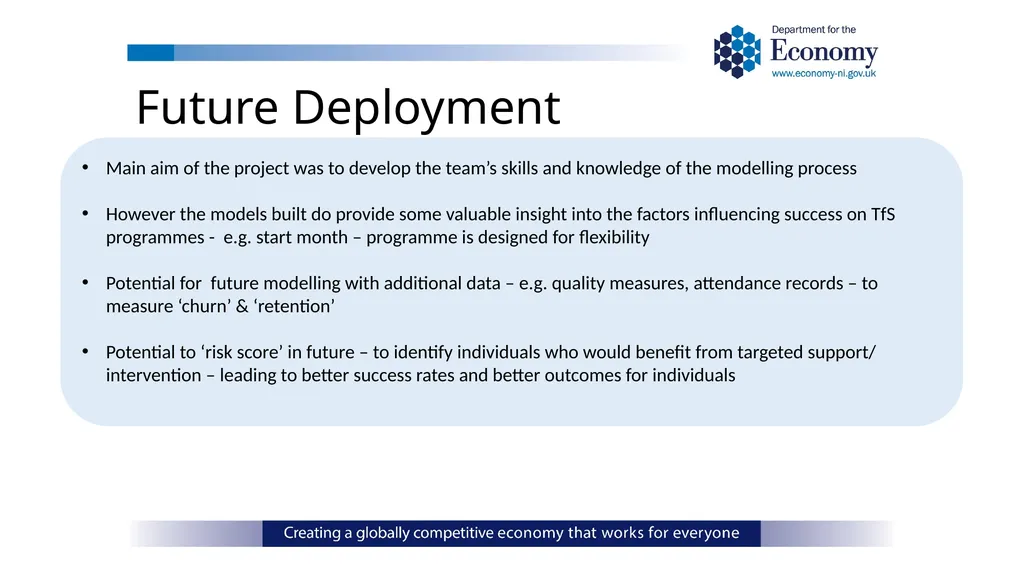
Future Deployment Main aim of the project was to develop the team’s skills and knowledge of the modelling process
However the models built do provide some valuable insight into the factors influencing success on TfS programmes - e.g. start month – programme is designed for flexibility
Potential for future modelling with additional data – e.g. quality measures, attendance records – to measure ‘churn’ & ‘retention’
Potential to ‘risk score’ in future – to identify individuals who would benefit from targeted support/ intervention – leading to better success rates and better outcomes for individuals<br>
30
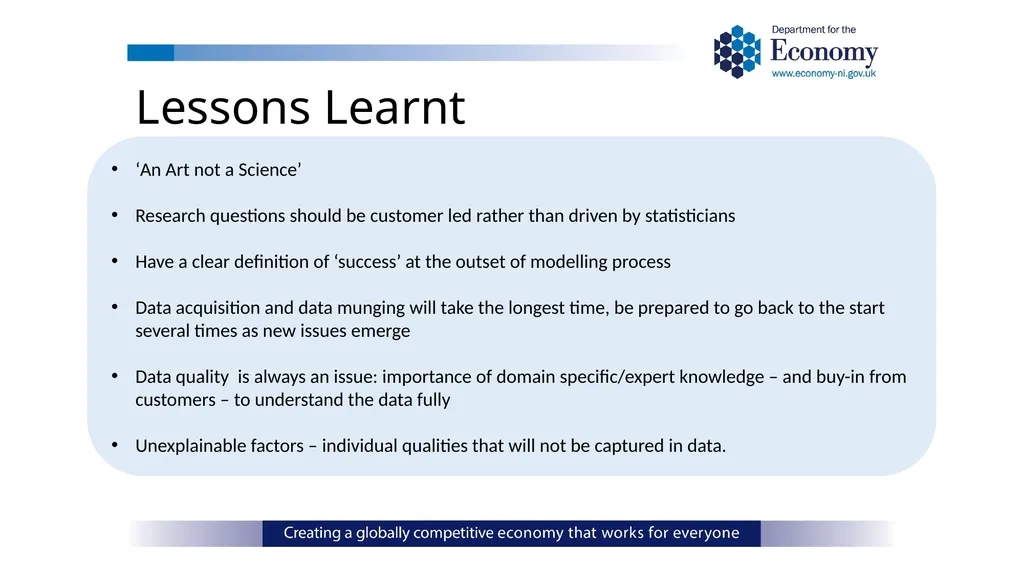
Lessons Learnt ‘An Art not a Science’
Research questions should be customer led rather than driven by statisticians
Have a clear definition of ‘success’ at the outset of modelling process
Data acquisition and data munging will take the longest time, be prepared to go back to the start several times as new issues emerge
Data quality is always an issue: importance of domain specific/expert knowledge – and buy-in from customers – to understand the data fully
Unexplainable factors – individual qualities that will not be captured in data.<br>
31
Reflections on working with ONS<br>
32
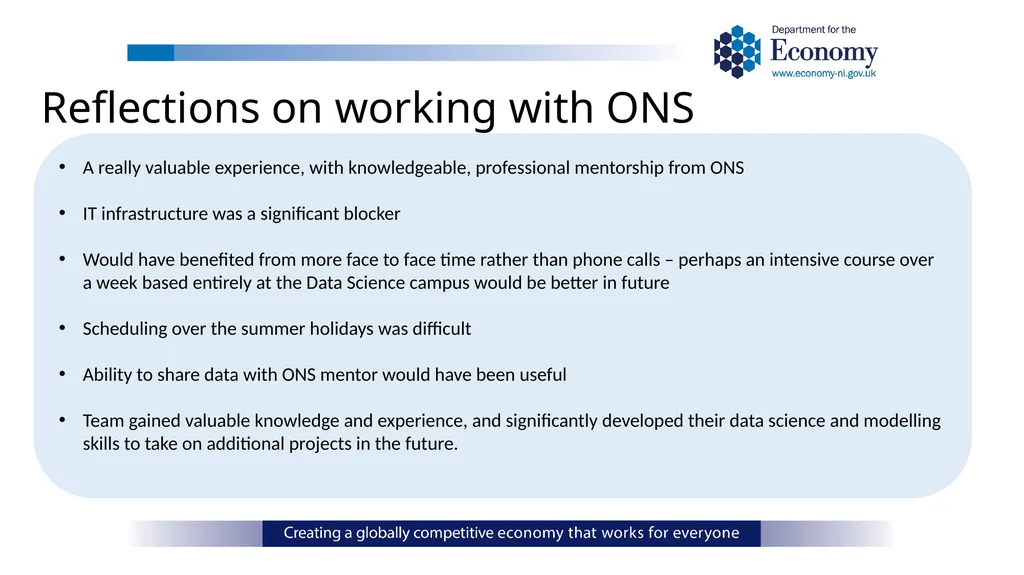
Reflections on working with ONS A really valuable experience, with knowledgeable, professional mentorship from ONS
IT infrastructure was a significant blocker
Would have benefited from more face to face time rather than phone calls – perhaps an intensive course over a week based entirely at the Data Science campus would be better in future
Scheduling over the summer holidays was difficult
Ability to share data with ONS mentor would have been useful
Team gained valuable knowledge and experience, and significantly developed their data science and modelling skills to take on additional projects in the future.<br>