
Performance Analysis And Acceleration of High
Description: Performance Analysis And Acceleration of High Bandwidth Memory System Rohit Devidas Chavan, Jyoti Verma, Sekhar Dangudubiyyam 1 Accellera Systems Initiative 2 AGENDA Objective HBM3 Subsystem Architecture Performance Analysis for HBM3
Related Topics
Download Presentation
"Performance Analysis And Acceleration of High" is the property of its rightful owner. Permission is granted to download and print the materials on this website for personal, non-commercial use only, and to display it on your personal computer provided you do not modify the materials and that you retain all copyright notices contained in the materials. By downloading content from our website, you accept the terms of this agreement.
Presentation Transcript
slide1. Performance Analysis And Acceleration of High Bandwidth Memory System Rohit Devidas Chavan, Jyoti Verma, Sekhar Dangudubiyyam 1<br>
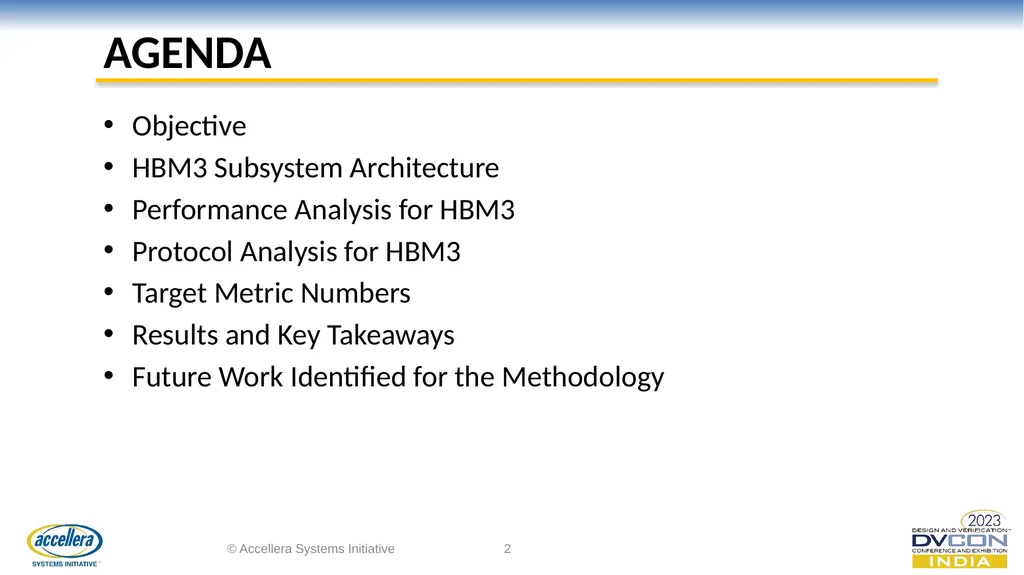
slide2. © Accellera Systems Initiative 2 AGENDA Objective
HBM3 Subsystem Architecture
Performance Analysis for HBM3
Protocol Analysis for HBM3
Target Metric Numbers
Results and Key Takeaways
Future Work Identified for the Methodology<br>
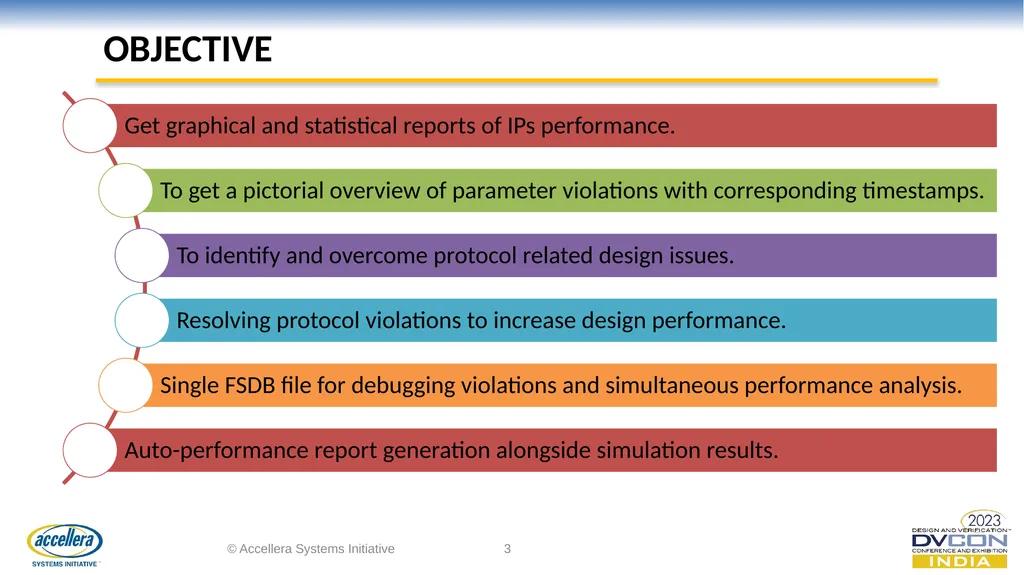
slide3. © Accellera Systems Initiative 3 objective<br>
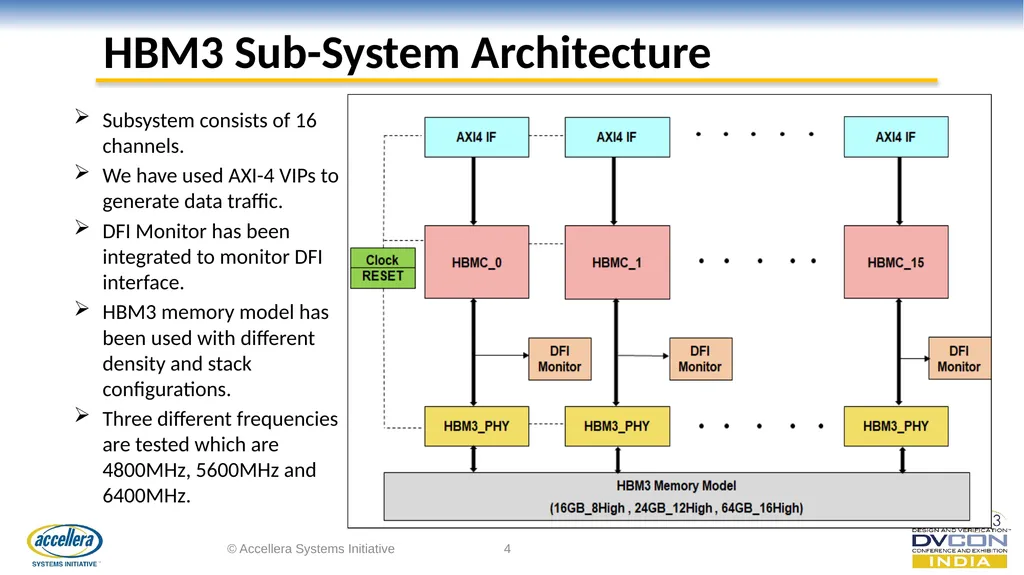
slide4. © Accellera Systems Initiative 4 HBM3 Sub-System Architecture Subsystem consists of 16 channels.
We have used AXI-4 VIPs to generate data traffic.
DFI Monitor has been integrated to monitor DFI interface.
HBM3 memory model has been used with different density and stack configurations.
Three different frequencies are tested which are 4800MHz, 5600MHz and 6400MHz.<br>
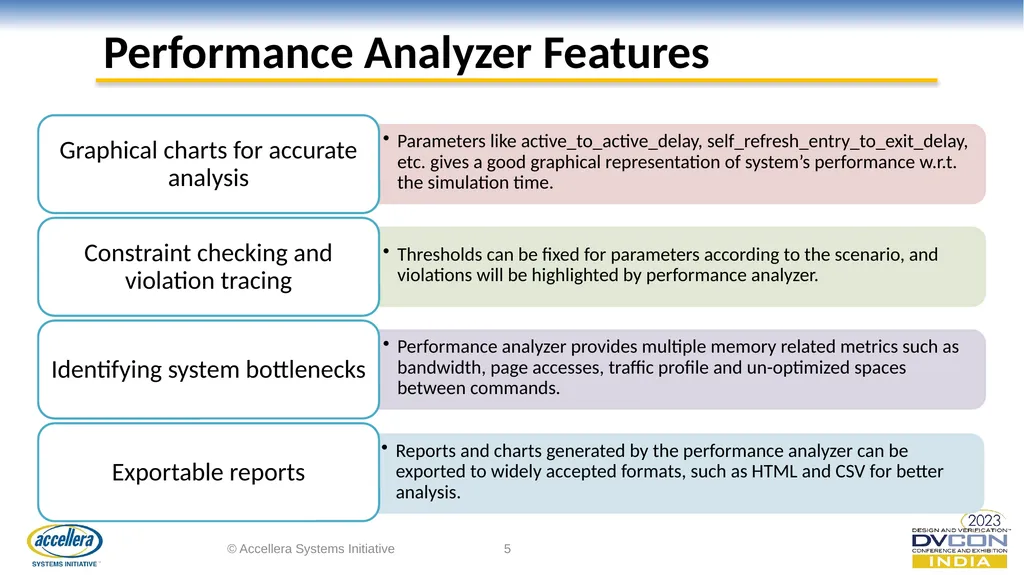
slide5. © Accellera Systems Initiative 5 Performance Analyzer Features<br>
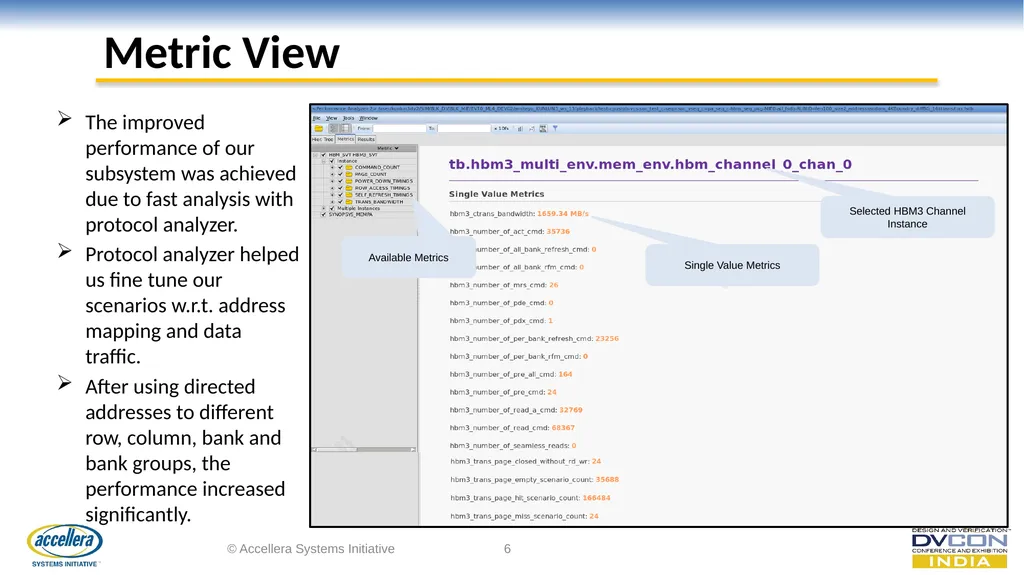
slide6. © Accellera Systems Initiative 6 Metric View Single Value Metrics Available Metrics Selected HBM3 Channel Instance The improved performance of our subsystem was achieved due to fast analysis with protocol analyzer.
Protocol analyzer helped us fine tune our scenarios w.r.t. address mapping and data traffic.
After using directed addresses to different row, column, bank and bank groups, the performance increased significantly.<br>
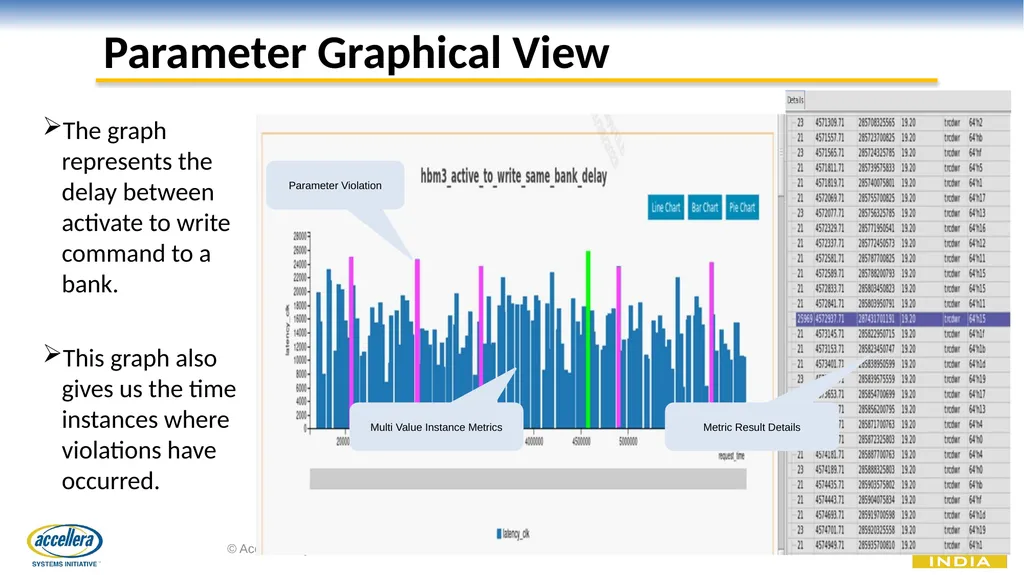
slide7. © Accellera Systems Initiative 7 Parameter Graphical View The graph represents the delay between activate to write command to a bank.
This graph also gives us the time instances where violations have occurred. Multi Value Instance Metrics Metric Result Details Parameter Violation<br>
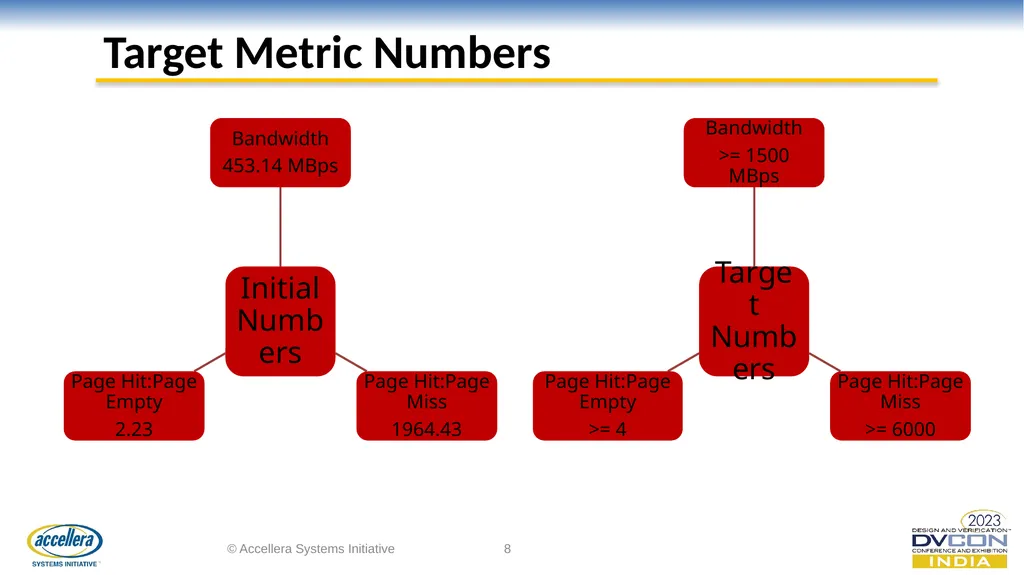
slide8. © Accellera Systems Initiative 8 Target Metric Numbers<br>
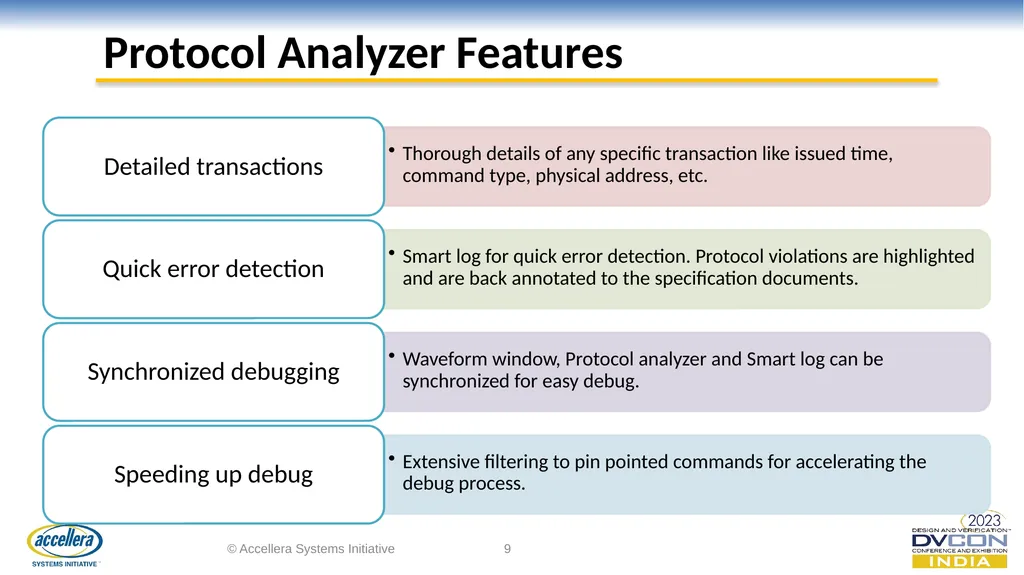
slide9. © Accellera Systems Initiative 9 Protocol Analyzer Features<br>
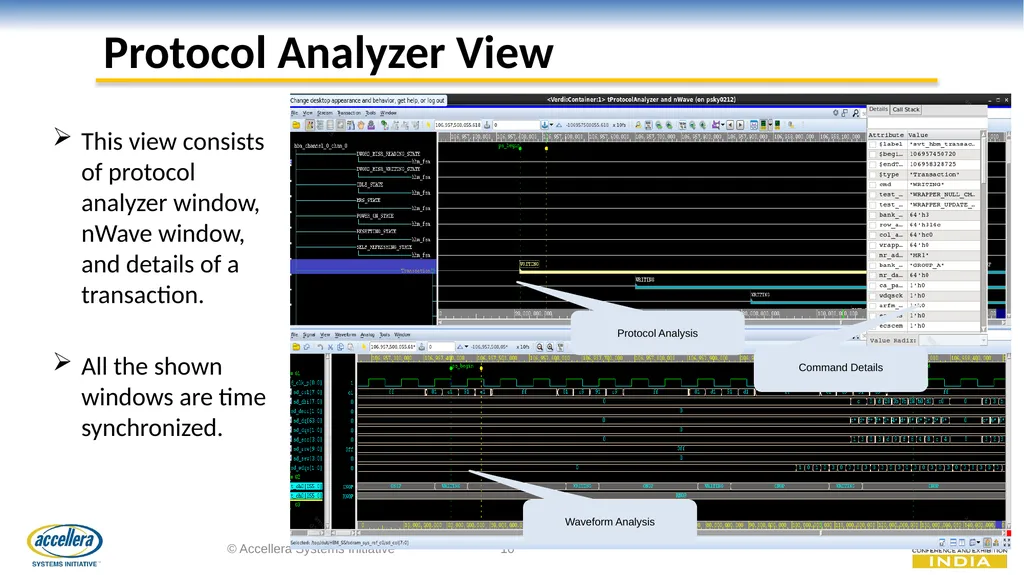
slide10. © Accellera Systems Initiative 10 Protocol Analyzer View This view consists of protocol analyzer window, nWave window, and details of a transaction.
All the shown windows are time synchronized. Protocol Analysis Waveform Analysis Command Details<br>
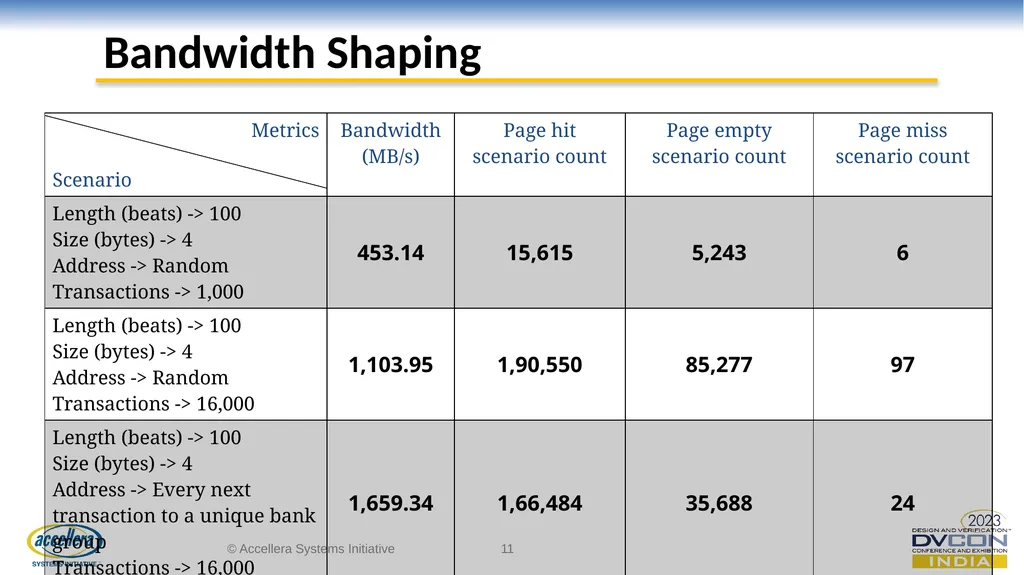
slide11. © Accellera Systems Initiative 11 Bandwidth Shaping<br>
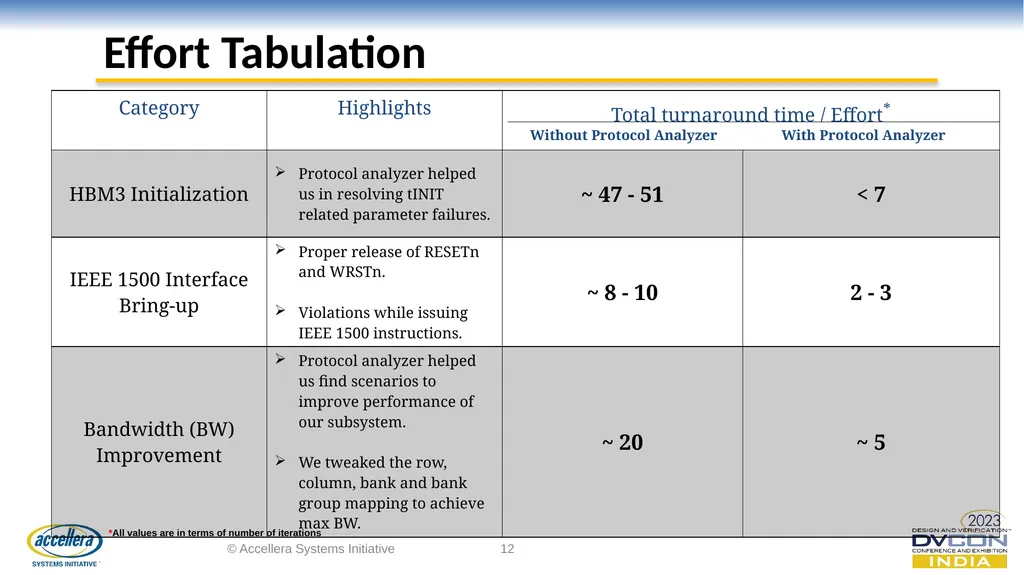
slide12. © Accellera Systems Initiative 12 Effort Tabulation *All values are in terms of number of iterations<br>
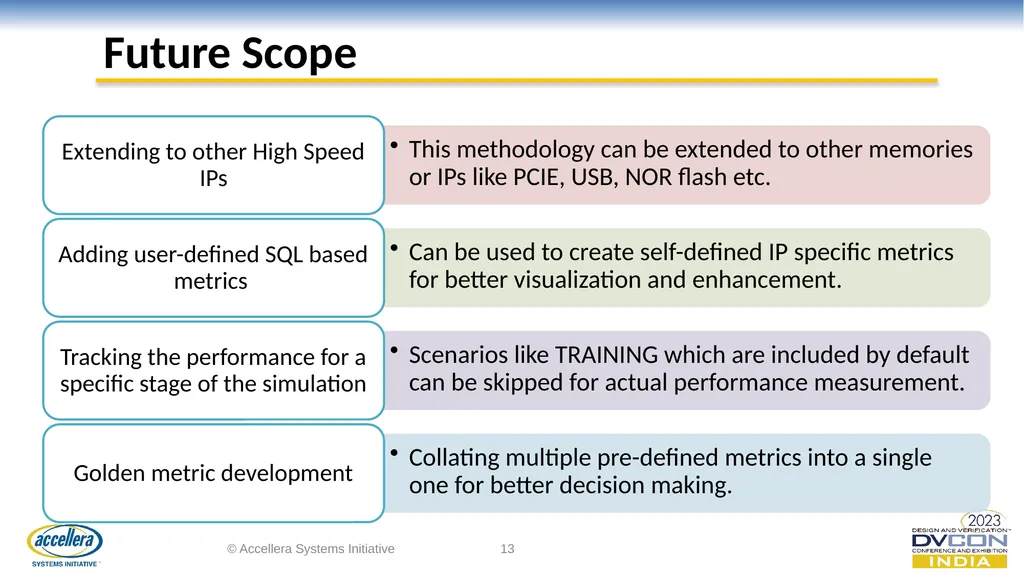
slide13. © Accellera Systems Initiative 13 Future Scope<br>
slide14. Questions © Accellera Systems Initiative 14<br>
slide2. © Accellera Systems Initiative 2 AGENDA Objective
HBM3 Subsystem Architecture
Performance Analysis for HBM3
Protocol Analysis for HBM3
Target Metric Numbers
Results and Key Takeaways
Future Work Identified for the Methodology<br>
slide3. © Accellera Systems Initiative 3 objective<br>
slide4. © Accellera Systems Initiative 4 HBM3 Sub-System Architecture Subsystem consists of 16 channels.
We have used AXI-4 VIPs to generate data traffic.
DFI Monitor has been integrated to monitor DFI interface.
HBM3 memory model has been used with different density and stack configurations.
Three different frequencies are tested which are 4800MHz, 5600MHz and 6400MHz.<br>
slide5. © Accellera Systems Initiative 5 Performance Analyzer Features<br>
slide6. © Accellera Systems Initiative 6 Metric View Single Value Metrics Available Metrics Selected HBM3 Channel Instance The improved performance of our subsystem was achieved due to fast analysis with protocol analyzer.
Protocol analyzer helped us fine tune our scenarios w.r.t. address mapping and data traffic.
After using directed addresses to different row, column, bank and bank groups, the performance increased significantly.<br>
slide7. © Accellera Systems Initiative 7 Parameter Graphical View The graph represents the delay between activate to write command to a bank.
This graph also gives us the time instances where violations have occurred. Multi Value Instance Metrics Metric Result Details Parameter Violation<br>
slide8. © Accellera Systems Initiative 8 Target Metric Numbers<br>
slide9. © Accellera Systems Initiative 9 Protocol Analyzer Features<br>
slide10. © Accellera Systems Initiative 10 Protocol Analyzer View This view consists of protocol analyzer window, nWave window, and details of a transaction.
All the shown windows are time synchronized. Protocol Analysis Waveform Analysis Command Details<br>
slide11. © Accellera Systems Initiative 11 Bandwidth Shaping<br>
slide12. © Accellera Systems Initiative 12 Effort Tabulation *All values are in terms of number of iterations<br>
slide13. © Accellera Systems Initiative 13 Future Scope<br>
slide14. Questions © Accellera Systems Initiative 14<br>