PHL424: Feynman diagrams PHL424: Feynman diagrams
1 / 1

PHL424: Feynman diagrams PHL424: Feynman diagrams

Author : jane-oiler | Published Date : 2025-05-12

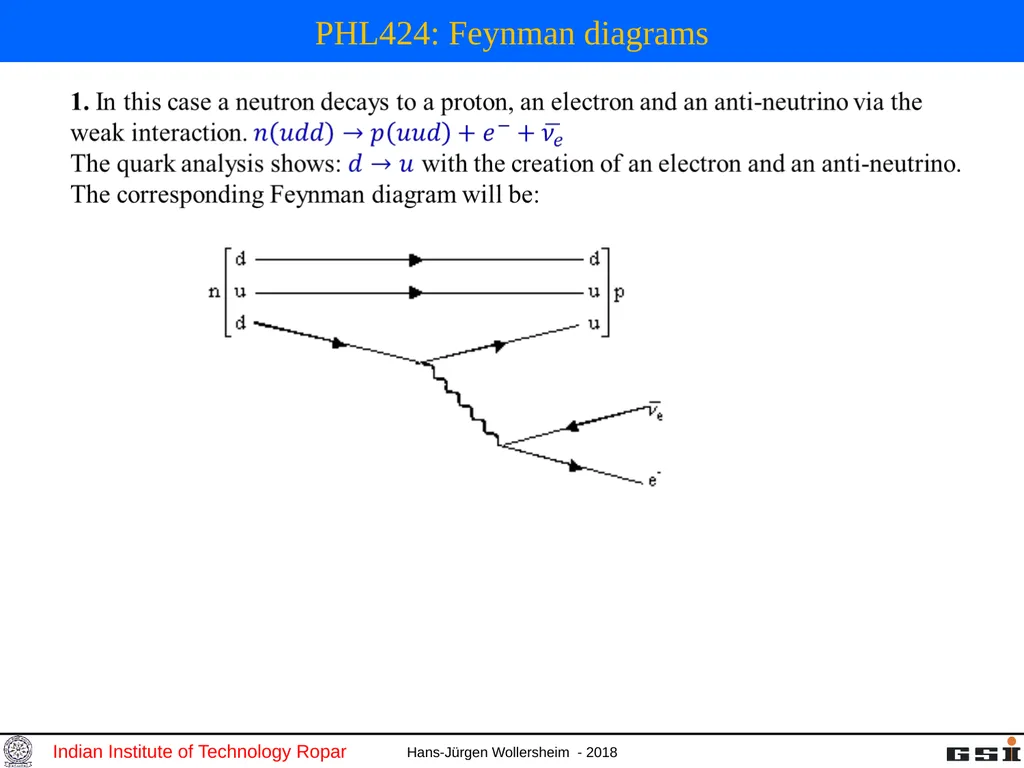
Description: PHL424: Feynman diagrams PHL424: Feynman diagrams The Feynman diagram is a simple combination of a quark weak vertex and a lepton-weak vertex. The quarks come form the same generation. Similarly, the leptons are a first generation pair.

Presentation Embed Code

Download Presentation

Download Presentation The PPT/PDF document "" is the property of its rightful owner. Permission is granted to download and print the materials on this website for personal, non-commercial use only, and to display it on your personal computer provided you do not modify the materials and that you retain all copyright notices contained in the materials. By downloading content from our website, you accept the terms of this agreement.

Transcript:
Loading transcript�

Download Document

Here is the link to download the presentation.
"PHL424: Feynman diagrams PHL424: Feynman diagrams"The content belongs to its owner. You may download and print it for personal use, without modification, and keep all copyright notices. By downloading, you agree to these terms.

Related Presentations

interaction theory of electromagnetic radiation.Feynman and Wheeler hy
UML Sequence Diagrams
Ishikawa Diagrams
Ishikawa Diagrams
Mr. Feynman Wasn’t Joking
Understanding
Understanding
Beyond Feynman Diagrams
State Diagrams
State Diagrams
Communication with Advanced Aliens
Nuclear Physics : Origin of elements
Using Tape Diagrams and
HOW TO DRAW BUBBLE DIAGRAMS
Dispositional Metasemantics
    The decay rate   The decay rate
    The decay rate   The decay rate
Beyond Feynman Diagrams Lecture 3