
Polio Transition Progress Monitoring & Evaluation
DP
Published · 42 slides · 0 views

1 / 1
Description
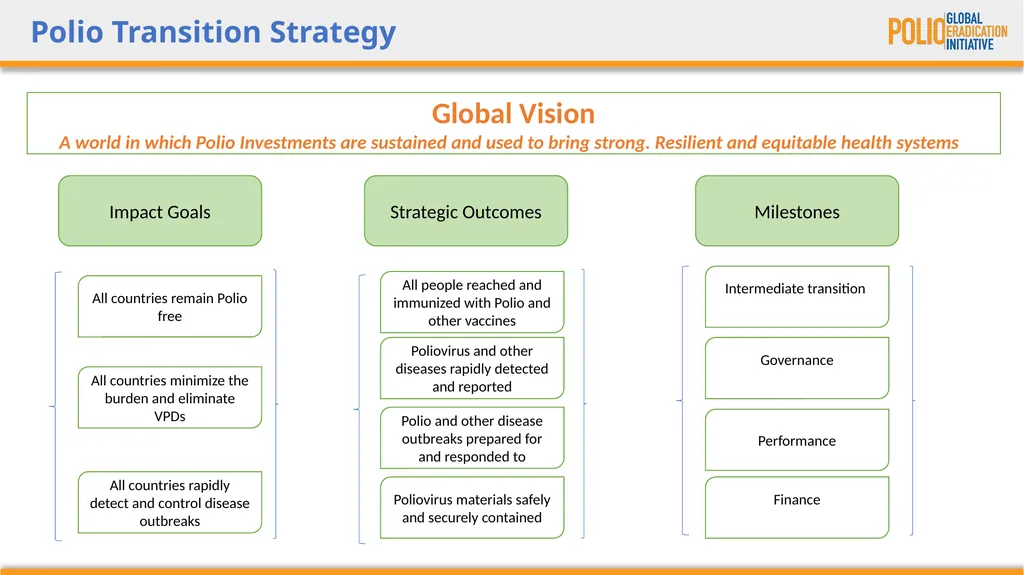
Polio Transition Progress Monitoring Evaluation Update Quarter-3, 2024 Polio Transition Strategy Global Vision A world in which Polio Investments are sustained and used to bring strong. Resilient and equitable health systems Impact Goals
Related Topics
Share
Embed code
Download this presentation From Below
"Polio Transition Progress Monitoring & Evaluation" is the property of its rightful owner. Permission is granted to download and print the materials on this website for personal, non-commercial use only, and to display it on your personal computer provided you do not modify the materials and that you retain all copyright notices contained in the materials. By downloading content from our website, you accept the terms of this agreement.
Presentation Transcript
01
Polio Transition Progress Monitoring & Evaluation Update
Quarter-3, 2024<br>
Quarter-3, 2024<br>
02
Polio Transition Strategy Global Vision
A world in which Polio Investments are sustained and used to bring strong. Resilient and equitable health systems Impact Goals Strategic Outcomes Milestones All countries remain Polio free All countries minimize the burden and eliminate VPDs All countries rapidly detect and control disease outbreaks All people reached and immunized with Polio and other vaccines Poliovirus materials safely and securely contained Polio and other disease outbreaks prepared for and responded to Poliovirus and other diseases rapidly detected and reported Intermediate transition Finance Performance Governance<br>
A world in which Polio Investments are sustained and used to bring strong. Resilient and equitable health systems Impact Goals Strategic Outcomes Milestones All countries remain Polio free All countries minimize the burden and eliminate VPDs All countries rapidly detect and control disease outbreaks All people reached and immunized with Polio and other vaccines Poliovirus materials safely and securely contained Polio and other disease outbreaks prepared for and responded to Poliovirus and other diseases rapidly detected and reported Intermediate transition Finance Performance Governance<br>
03
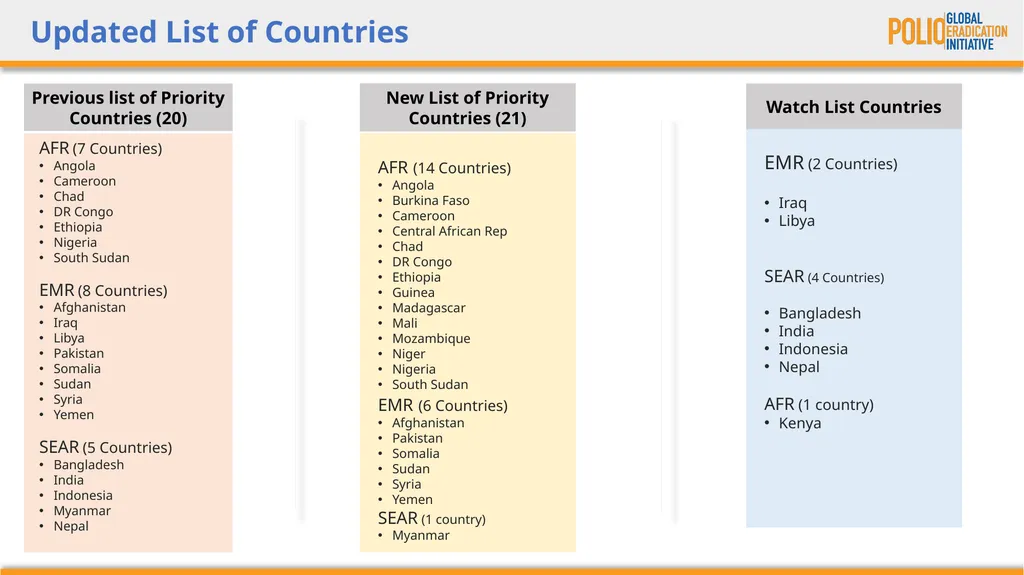
Updated List of Countries<br>
04
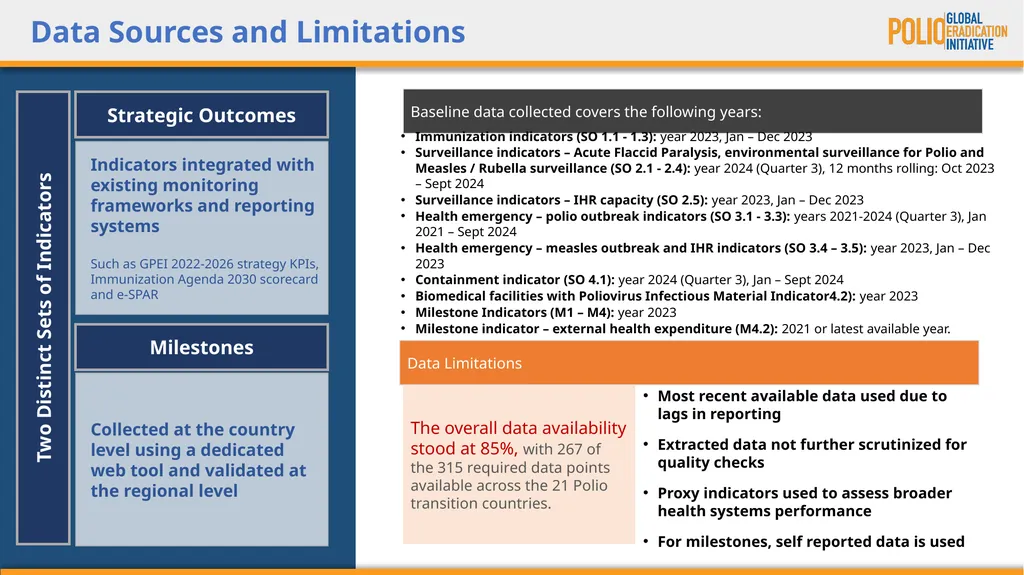
Data Sources and Limitations Indicators integrated with existing monitoring frameworks and reporting systems
Such as GPEI 2022-2026 strategy KPIs, Immunization Agenda 2030 scorecard and e-SPAR Collected at the country level using a dedicated web tool and validated at the regional level Two Distinct Sets of Indicators Baseline data collected covers the following years: Data Limitations The overall data availability stood at 85%, with 267 of the 315 required data points available across the 21 Polio transition countries. Most recent available data used due to lags in reporting
Extracted data not further scrutinized for quality checks
Proxy indicators used to assess broader health systems performance
For milestones, self reported data is used Strategic Outcomes Milestones Immunization indicators (SO 1.1 - 1.3): year 2023, Jan – Dec 2023
Surveillance indicators – Acute Flaccid Paralysis, environmental surveillance for Polio and Measles / Rubella surveillance (SO 2.1 - 2.4): year 2024 (Quarter 3), 12 months rolling: Oct 2023 – Sept 2024
Surveillance indicators – IHR capacity (SO 2.5): year 2023, Jan – Dec 2023
Health emergency – polio outbreak indicators (SO 3.1 - 3.3): years 2021-2024 (Quarter 3), Jan 2021 – Sept 2024
Health emergency – measles outbreak and IHR indicators (SO 3.4 – 3.5): year 2023, Jan – Dec 2023
Containment indicator (SO 4.1): year 2024 (Quarter 3), Jan – Sept 2024
Biomedical facilities with Poliovirus Infectious Material Indicator4.2): year 2023
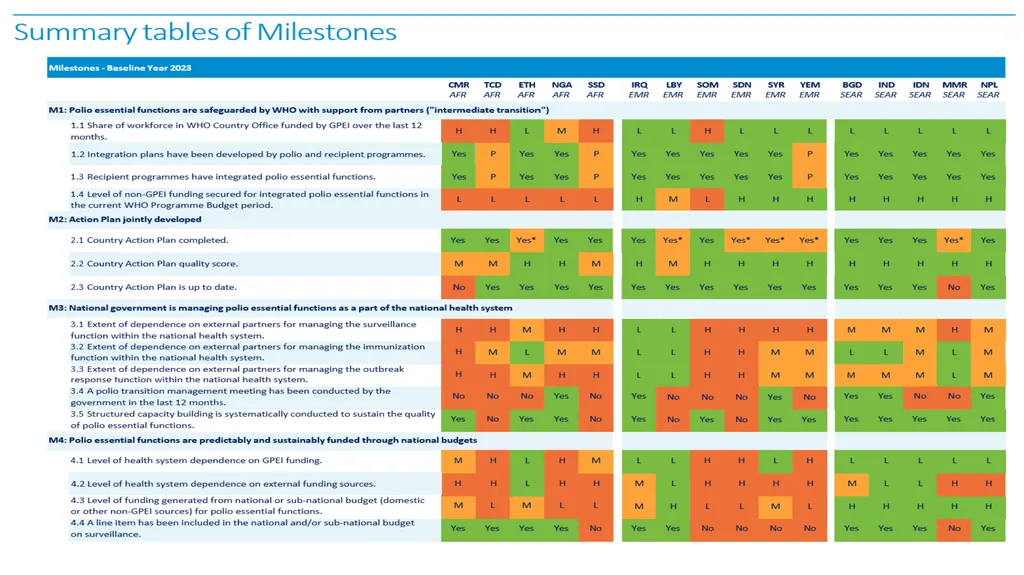
Milestone Indicators (M1 – M4): year 2023
Milestone indicator – external health expenditure (M4.2): 2021 or latest available year.<br>
Such as GPEI 2022-2026 strategy KPIs, Immunization Agenda 2030 scorecard and e-SPAR Collected at the country level using a dedicated web tool and validated at the regional level Two Distinct Sets of Indicators Baseline data collected covers the following years: Data Limitations The overall data availability stood at 85%, with 267 of the 315 required data points available across the 21 Polio transition countries. Most recent available data used due to lags in reporting
Extracted data not further scrutinized for quality checks
Proxy indicators used to assess broader health systems performance
For milestones, self reported data is used Strategic Outcomes Milestones Immunization indicators (SO 1.1 - 1.3): year 2023, Jan – Dec 2023
Surveillance indicators – Acute Flaccid Paralysis, environmental surveillance for Polio and Measles / Rubella surveillance (SO 2.1 - 2.4): year 2024 (Quarter 3), 12 months rolling: Oct 2023 – Sept 2024
Surveillance indicators – IHR capacity (SO 2.5): year 2023, Jan – Dec 2023
Health emergency – polio outbreak indicators (SO 3.1 - 3.3): years 2021-2024 (Quarter 3), Jan 2021 – Sept 2024
Health emergency – measles outbreak and IHR indicators (SO 3.4 – 3.5): year 2023, Jan – Dec 2023
Containment indicator (SO 4.1): year 2024 (Quarter 3), Jan – Sept 2024
Biomedical facilities with Poliovirus Infectious Material Indicator4.2): year 2023
Milestone Indicators (M1 – M4): year 2023
Milestone indicator – external health expenditure (M4.2): 2021 or latest available year.<br>
05
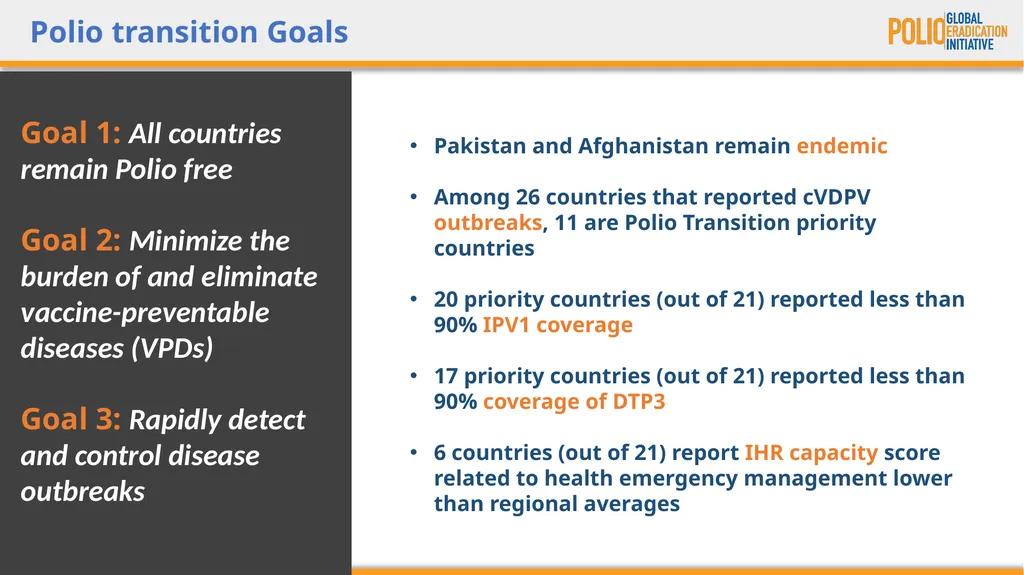
Polio transition Goals Pakistan and Afghanistan remain endemic
Among 26 countries that reported cVDPV outbreaks, 11 are Polio Transition priority countries
20 priority countries (out of 21) reported less than 90% IPV1 coverage
17 priority countries (out of 21) reported less than 90% coverage of DTP3
6 countries (out of 21) report IHR capacity score related to health emergency management lower than regional averages Goal 1: All countries remain Polio free
Goal 2: Minimize the burden of and eliminate vaccine-preventable diseases (VPDs)
Goal 3: Rapidly detect and control disease outbreaks<br>
Among 26 countries that reported cVDPV outbreaks, 11 are Polio Transition priority countries
20 priority countries (out of 21) reported less than 90% IPV1 coverage
17 priority countries (out of 21) reported less than 90% coverage of DTP3
6 countries (out of 21) report IHR capacity score related to health emergency management lower than regional averages Goal 1: All countries remain Polio free
Goal 2: Minimize the burden of and eliminate vaccine-preventable diseases (VPDs)
Goal 3: Rapidly detect and control disease outbreaks<br>
06
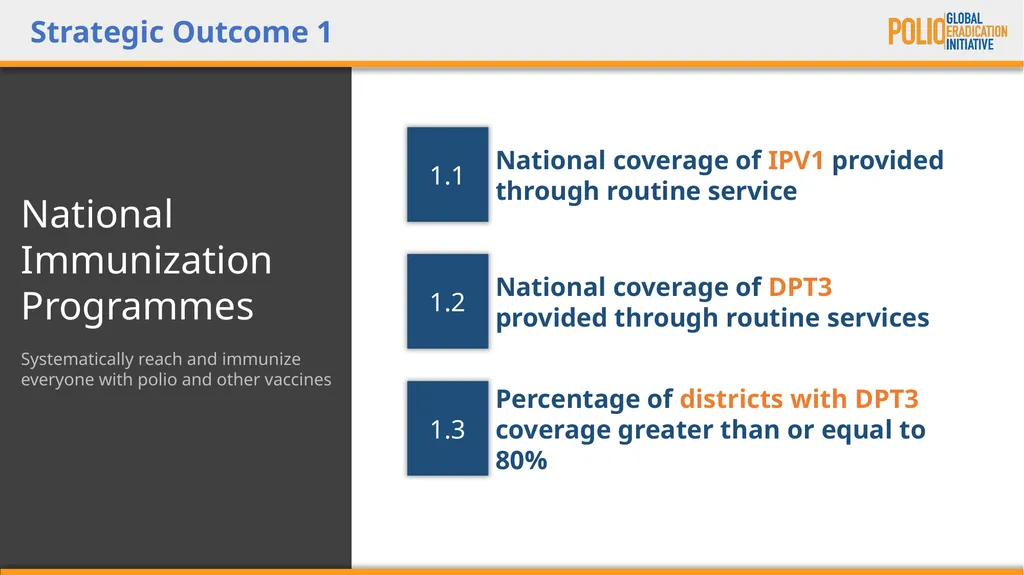
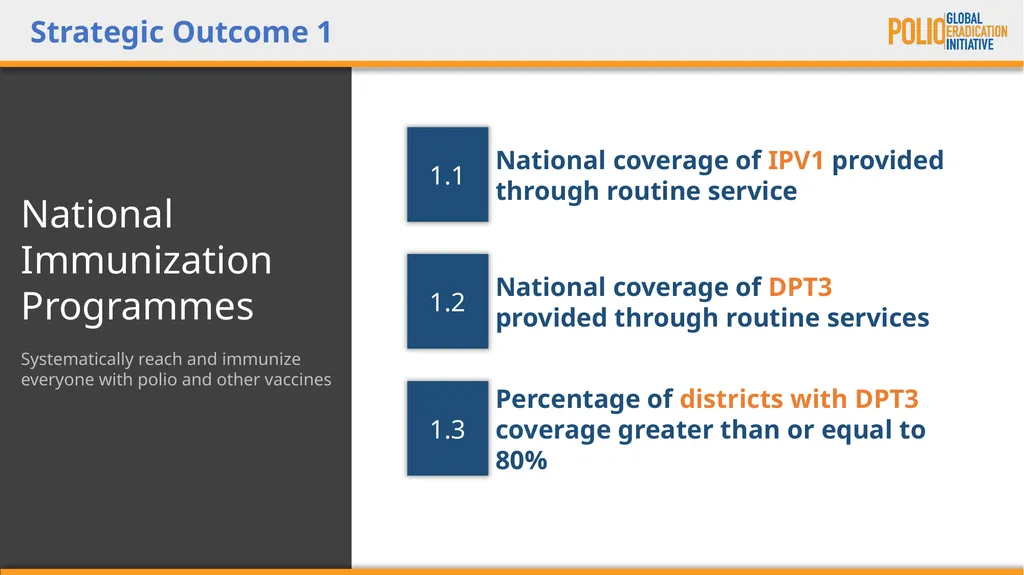
National Immunization Programmes
Systematically reach and immunize everyone with polio and other vaccines Strategic Outcome 1 Percentage of districts with DPT3 coverage greater than or equal to 80% National coverage of DPT3 provided through routine services National coverage of IPV1 provided through routine service 1.3 1.2 1.1<br>
Systematically reach and immunize everyone with polio and other vaccines Strategic Outcome 1 Percentage of districts with DPT3 coverage greater than or equal to 80% National coverage of DPT3 provided through routine services National coverage of IPV1 provided through routine service 1.3 1.2 1.1<br>
07
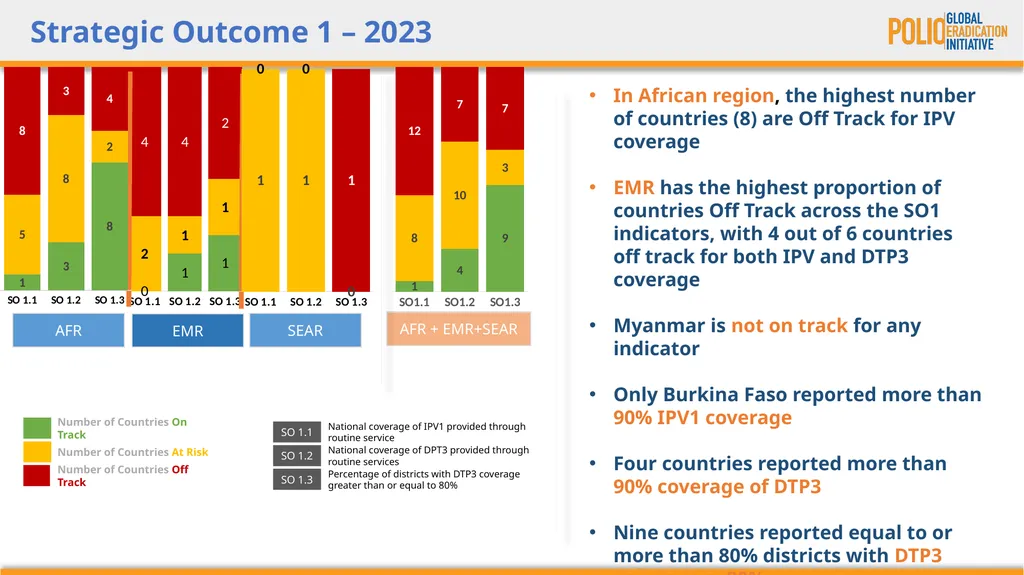
Strategic Outcome 1 – 2023 AFR EMR In African region, the highest number of countries (8) are Off Track for IPV coverage
EMR has the highest proportion of countries Off Track across the SO1 indicators, with 4 out of 6 countries off track for both IPV and DTP3 coverage
Myanmar is not on track for any indicator
Only Burkina Faso reported more than 90% IPV1 coverage
Four countries reported more than 90% coverage of DTP3
Nine countries reported equal to or more than 80% districts with DTP3 coverage ≥ 80% AFR + EMR+SEAR SEAR<br>
EMR has the highest proportion of countries Off Track across the SO1 indicators, with 4 out of 6 countries off track for both IPV and DTP3 coverage
Myanmar is not on track for any indicator
Only Burkina Faso reported more than 90% IPV1 coverage
Four countries reported more than 90% coverage of DTP3
Nine countries reported equal to or more than 80% districts with DTP3 coverage ≥ 80% AFR + EMR+SEAR SEAR<br>
08
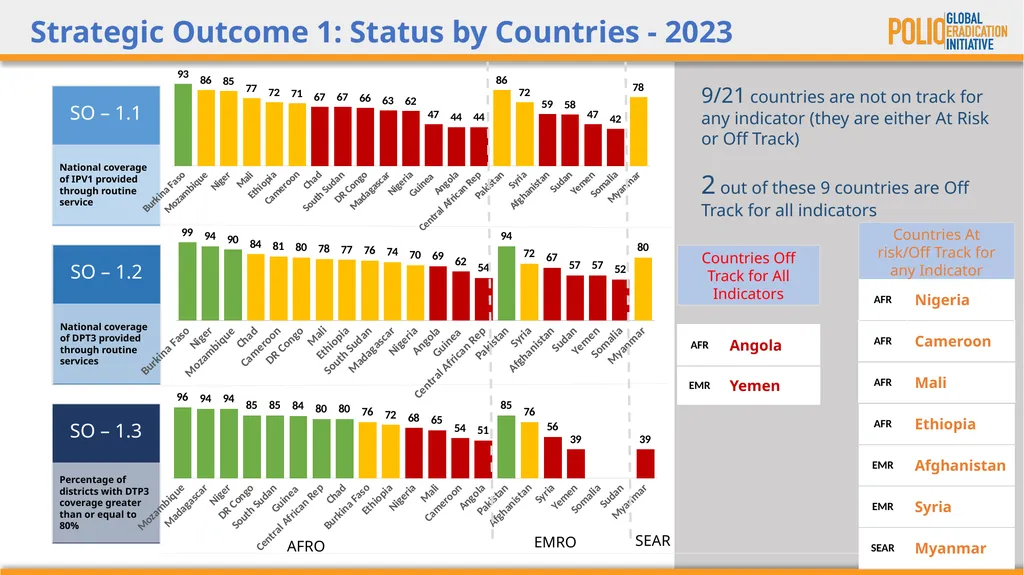
Strategic Outcome 1: Status by Countries - 2023 SO – 1.2 National coverage of DPT3 provided through routine services SO – 1.3 Percentage of districts with DTP3 coverage greater than or equal to 80% 9/21 countries are not on track for any indicator (they are either At Risk or Off Track)
2 out of these 9 countries are Off Track for all indicators Countries Off Track for All Indicators Countries At risk/Off Track for any Indicator SEAR EMRO AFRO<br>
2 out of these 9 countries are Off Track for all indicators Countries Off Track for All Indicators Countries At risk/Off Track for any Indicator SEAR EMRO AFRO<br>
09
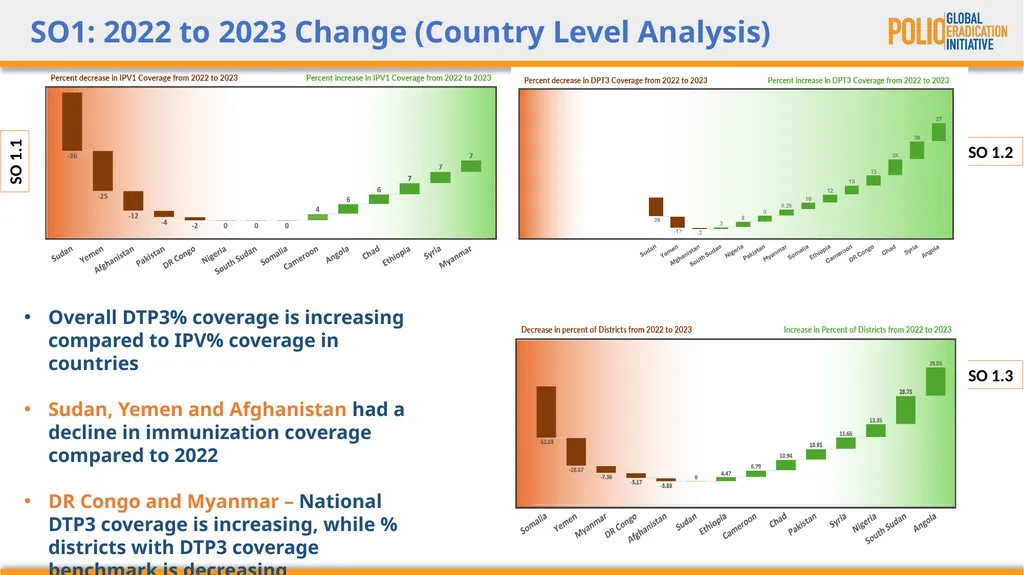
SO1: 2022 to 2023 Change (Country Level Analysis) Overall DTP3% coverage is increasing compared to IPV% coverage in countries
Sudan, Yemen and Afghanistan had a decline in immunization coverage compared to 2022
DR Congo and Myanmar – National DTP3 coverage is increasing, while % districts with DTP3 coverage benchmark is decreasing SO 1.1 SO 1.2 SO 1.3<br>
Sudan, Yemen and Afghanistan had a decline in immunization coverage compared to 2022
DR Congo and Myanmar – National DTP3 coverage is increasing, while % districts with DTP3 coverage benchmark is decreasing SO 1.1 SO 1.2 SO 1.3<br>
10
National Surveillance Systems
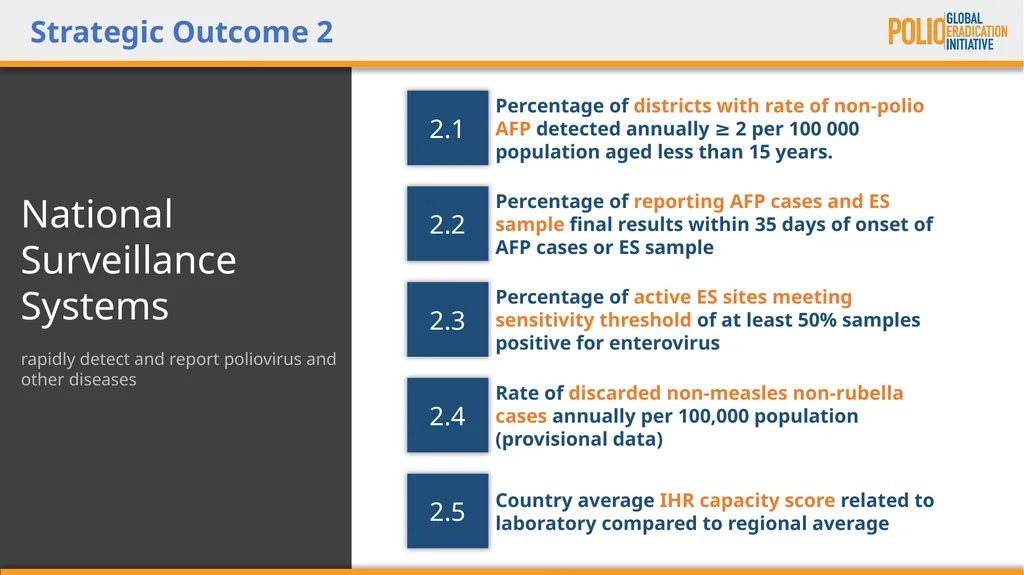
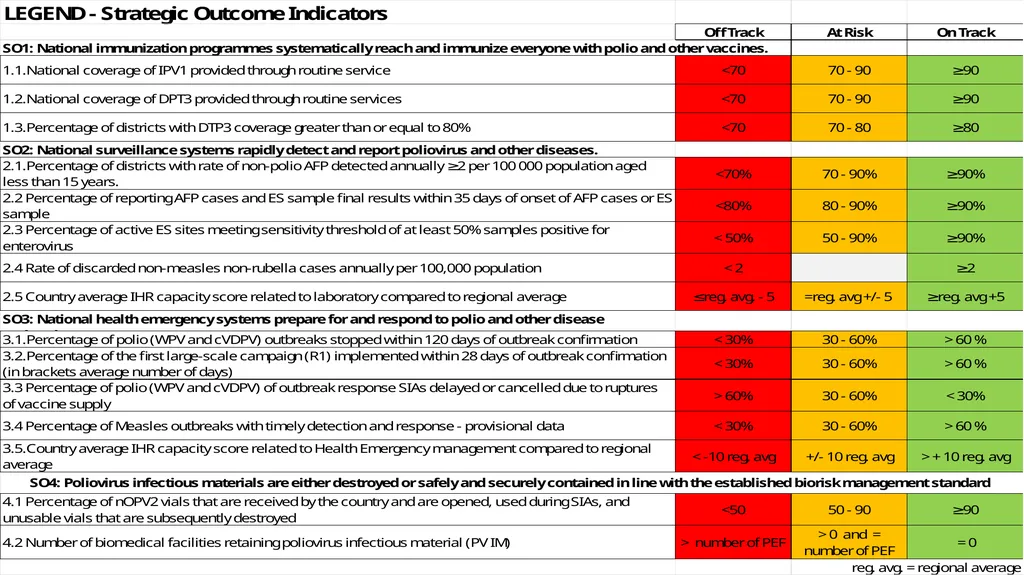
rapidly detect and report poliovirus and other diseases Strategic Outcome 2 Percentage of active ES sites meeting sensitivity threshold of at least 50% samples positive for enterovirus Percentage of reporting AFP cases and ES sample final results within 35 days of onset of AFP cases or ES sample Percentage of districts with rate of non-polio AFP detected annually ≥ 2 per 100 000 population aged less than 15 years. 2.3 2.2 2.1 Rate of discarded non-measles non-rubella cases annually per 100,000 population (provisional data) 2.4 Country average IHR capacity score related to laboratory compared to regional average 2.5<br>
rapidly detect and report poliovirus and other diseases Strategic Outcome 2 Percentage of active ES sites meeting sensitivity threshold of at least 50% samples positive for enterovirus Percentage of reporting AFP cases and ES sample final results within 35 days of onset of AFP cases or ES sample Percentage of districts with rate of non-polio AFP detected annually ≥ 2 per 100 000 population aged less than 15 years. 2.3 2.2 2.1 Rate of discarded non-measles non-rubella cases annually per 100,000 population (provisional data) 2.4 Country average IHR capacity score related to laboratory compared to regional average 2.5<br>
11
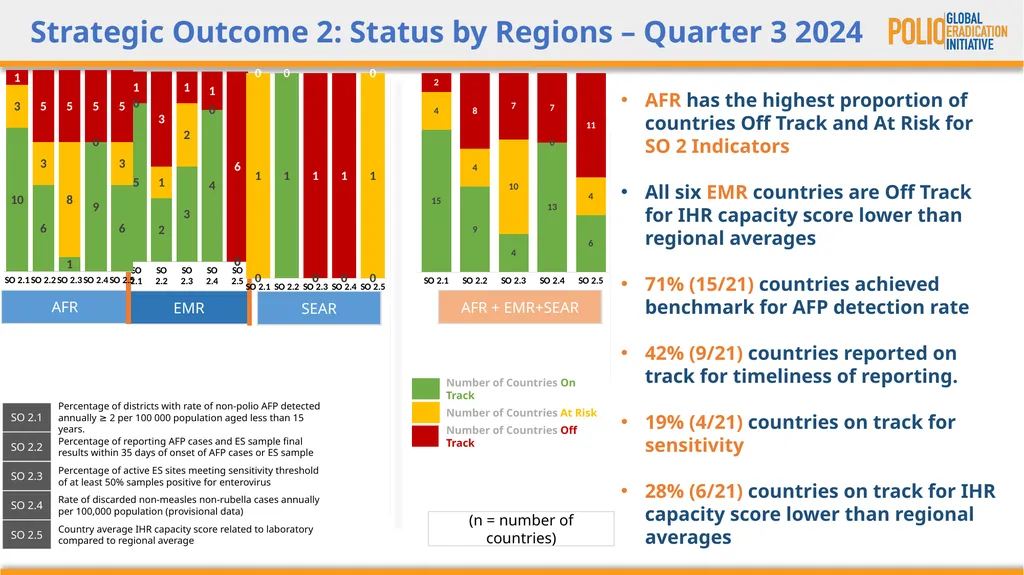
Strategic Outcome 2: Status by Regions – Quarter 3 2024 (n = number of countries) AFR EMR AFR has the highest proportion of countries Off Track and At Risk for SO 2 Indicators
All six EMR countries are Off Track for IHR capacity score lower than regional averages
71% (15/21) countries achieved benchmark for AFP detection rate
42% (9/21) countries reported on track for timeliness of reporting.
19% (4/21) countries on track for sensitivity
28% (6/21) countries on track for IHR capacity score lower than regional averages AFR + EMR+SEAR SEAR<br>
All six EMR countries are Off Track for IHR capacity score lower than regional averages
71% (15/21) countries achieved benchmark for AFP detection rate
42% (9/21) countries reported on track for timeliness of reporting.
19% (4/21) countries on track for sensitivity
28% (6/21) countries on track for IHR capacity score lower than regional averages AFR + EMR+SEAR SEAR<br>
12
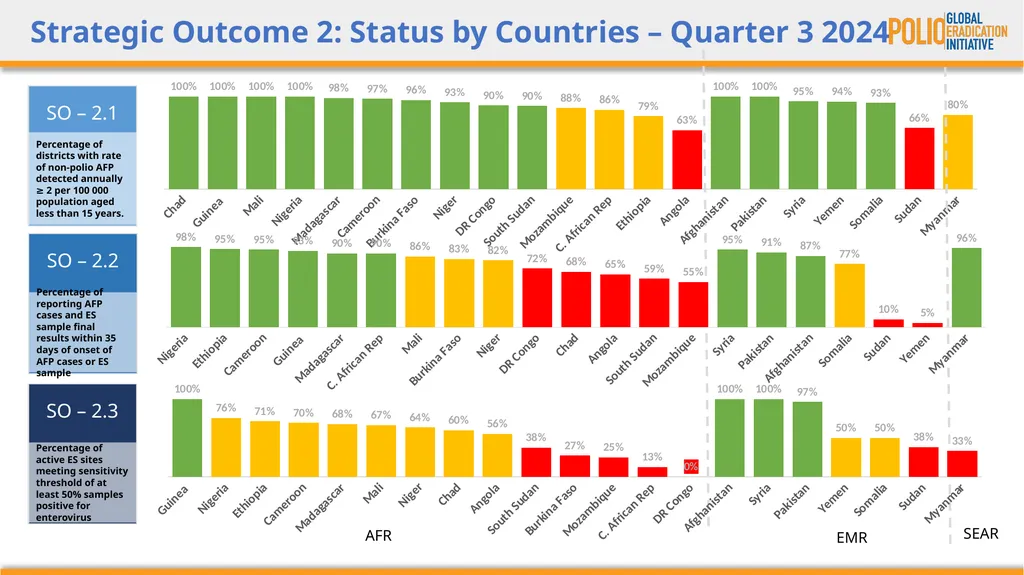
Strategic Outcome 2: Status by Countries – Quarter 3 2024 AFR EMR SO – 2.1 Percentage of districts with rate of non-polio AFP detected annually ≥ 2 per 100 000 population aged less than 15 years. SO – 2.2 Percentage of reporting AFP cases and ES sample final results within 35 days of onset of AFP cases or ES sample SO – 2.3 Percentage of active ES sites meeting sensitivity threshold of at least 50% samples positive for enterovirus SEAR<br>
13
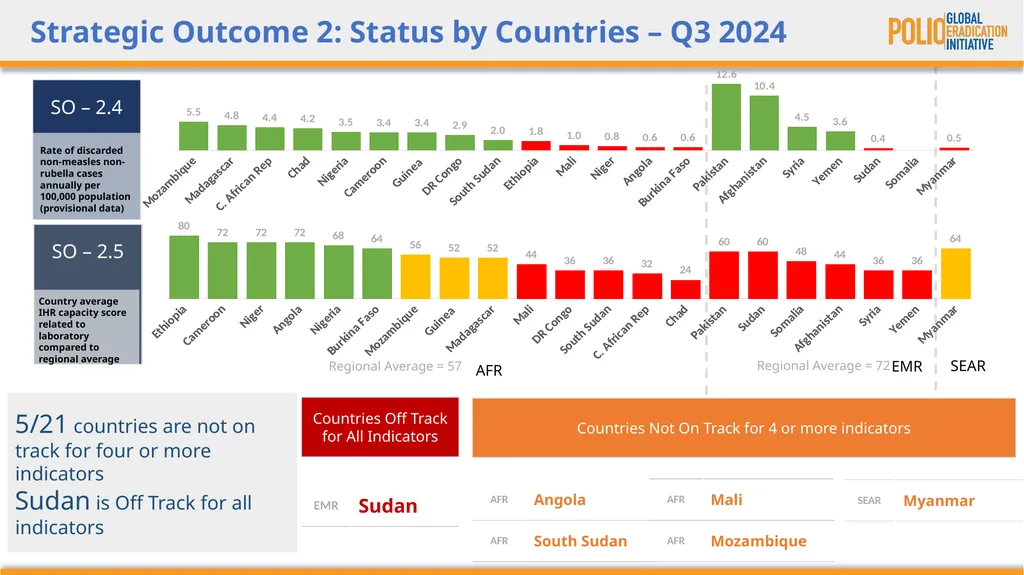
Strategic Outcome 2: Status by Countries – Q3 2024 AFR EMR Regional Average = 57 Regional Average = 72 SO – 2.4 Rate of discarded non-measles non-rubella cases annually per 100,000 population (provisional data) SO – 2.5 Country average IHR capacity score related to laboratory compared to regional average 5/21 countries are not on track for four or more indicators
Sudan is Off Track for all indicators Countries Off Track for All Indicators Countries Not On Track for 4 or more indicators SEAR<br>
Sudan is Off Track for all indicators Countries Off Track for All Indicators Countries Not On Track for 4 or more indicators SEAR<br>
14
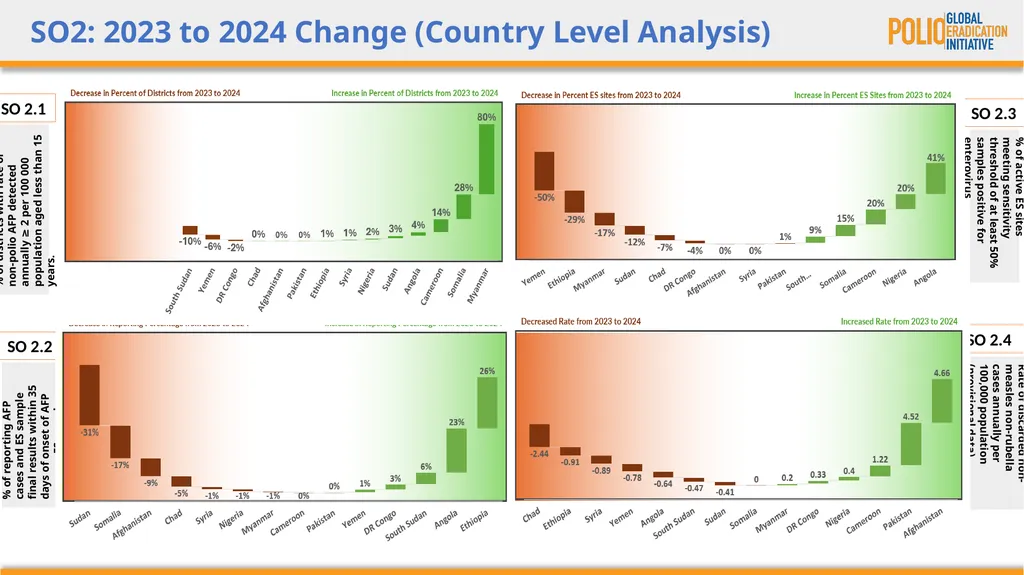
SO2: 2023 to 2024 Change (Country Level Analysis) % of districts with rate of non-polio AFP detected annually ≥ 2 per 100 000 population aged less than 15 years. % of reporting AFP cases and ES sample final results within 35 days of onset of AFP cases or ES sample % of active ES sites meeting sensitivity threshold of at least 50% samples positive for enterovirus Rate of discarded non-measles non-rubella cases annually per 100,000 population (provisional data) SO 2.2 SO 2.4 SO 2.3 SO 2.1<br>
15
National Health Emergency Systems
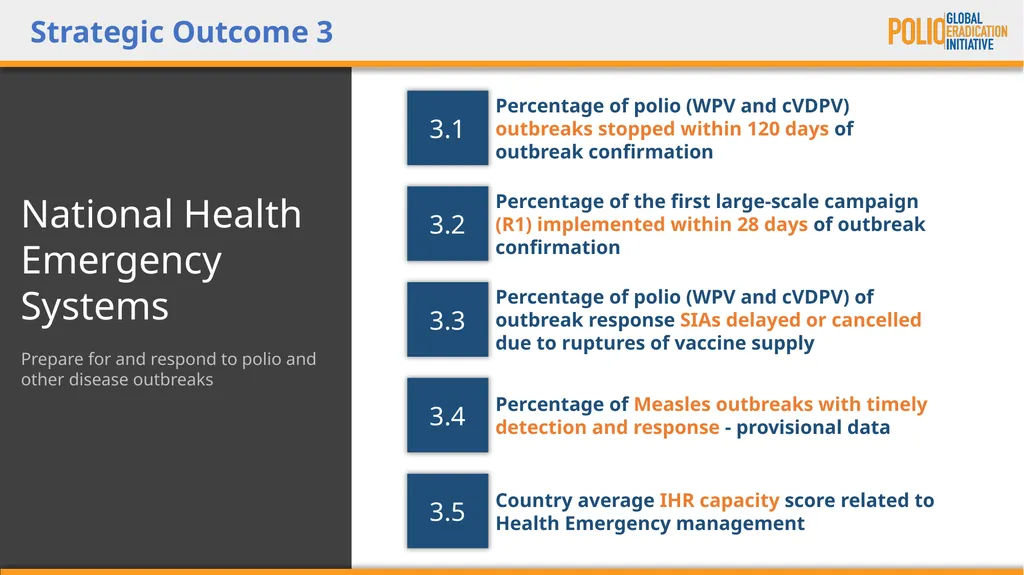
Prepare for and respond to polio and other disease outbreaks Strategic Outcome 3 Percentage of polio (WPV and cVDPV) of outbreak response SIAs delayed or cancelled due to ruptures of vaccine supply Percentage of the first large-scale campaign (R1) implemented within 28 days of outbreak confirmation Percentage of polio (WPV and cVDPV) outbreaks stopped within 120 days of outbreak confirmation 3.3 3.2 3.1 Percentage of Measles outbreaks with timely detection and response - provisional data 3.4 Country average IHR capacity score related to Health Emergency management 3.5<br>
Prepare for and respond to polio and other disease outbreaks Strategic Outcome 3 Percentage of polio (WPV and cVDPV) of outbreak response SIAs delayed or cancelled due to ruptures of vaccine supply Percentage of the first large-scale campaign (R1) implemented within 28 days of outbreak confirmation Percentage of polio (WPV and cVDPV) outbreaks stopped within 120 days of outbreak confirmation 3.3 3.2 3.1 Percentage of Measles outbreaks with timely detection and response - provisional data 3.4 Country average IHR capacity score related to Health Emergency management 3.5<br>
16
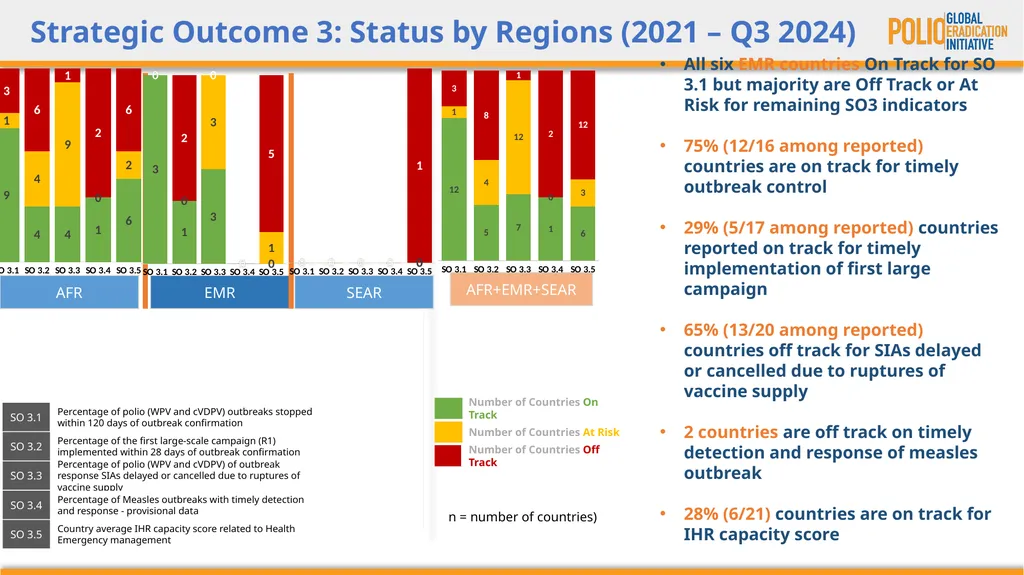
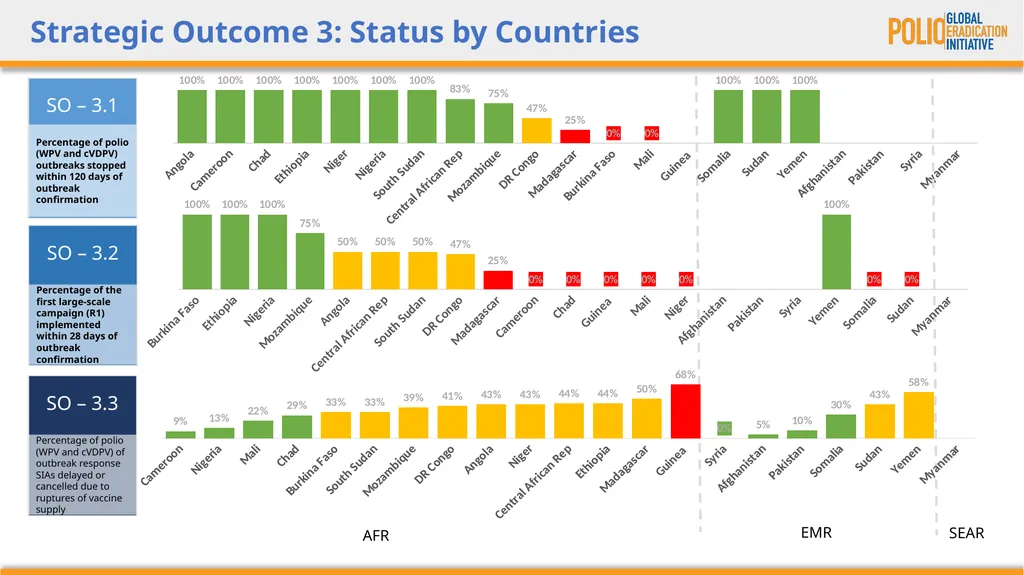
Strategic Outcome 3: Status by Regions (2021 – Q3 2024) AFR EMR n = number of countries) All six EMR countries On Track for SO 3.1 but majority are Off Track or At Risk for remaining SO3 indicators
75% (12/16 among reported) countries are on track for timely outbreak control
29% (5/17 among reported) countries reported on track for timely implementation of first large campaign
65% (13/20 among reported) countries off track for SIAs delayed or cancelled due to ruptures of vaccine supply
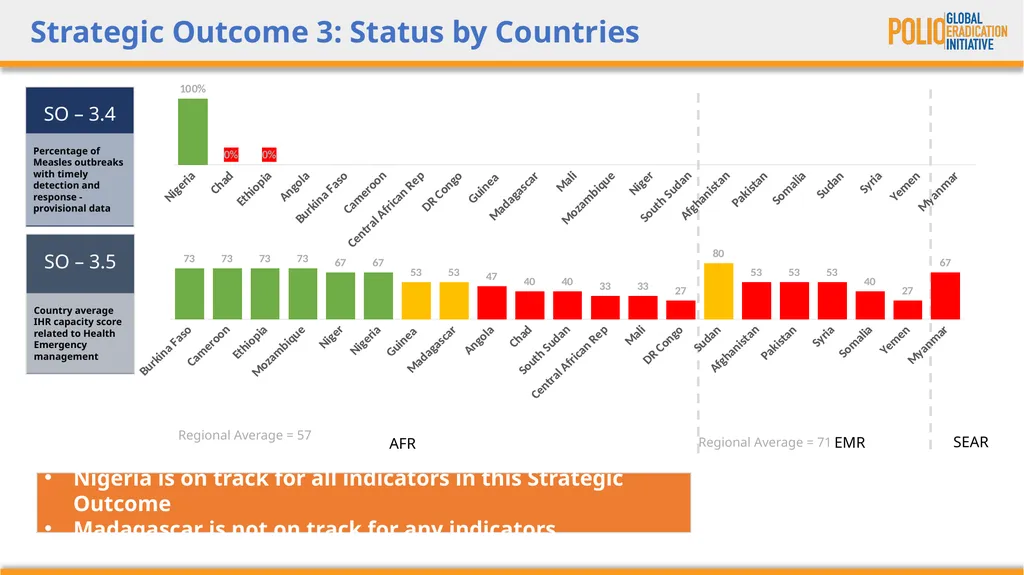
2 countries are off track on timely detection and response of measles outbreak
28% (6/21) countries are on track for IHR capacity score AFR+EMR+SEAR SEAR<br>
75% (12/16 among reported) countries are on track for timely outbreak control
29% (5/17 among reported) countries reported on track for timely implementation of first large campaign
65% (13/20 among reported) countries off track for SIAs delayed or cancelled due to ruptures of vaccine supply
2 countries are off track on timely detection and response of measles outbreak
28% (6/21) countries are on track for IHR capacity score AFR+EMR+SEAR SEAR<br>
17
Strategic Outcome 3: Status by Countries AFR EMR SO – 3.1 Percentage of polio (WPV and cVDPV) outbreaks stopped within 120 days of outbreak confirmation SO – 3.2 Percentage of the first large-scale campaign (R1) implemented within 28 days of outbreak confirmation SO – 3.3 Percentage of polio (WPV and cVDPV) of outbreak response SIAs delayed or cancelled due to ruptures of vaccine supply SEAR<br>
18
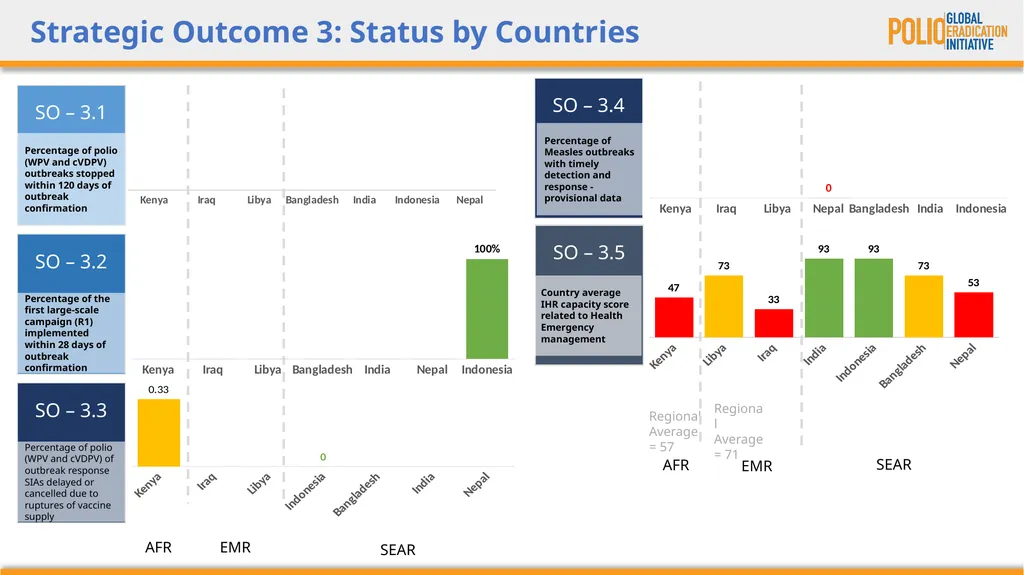
Strategic Outcome 3: Status by Countries AFR EMR Regional Average = 57 Regional Average = 71 SO – 3.4 Percentage of Measles outbreaks with timely detection and response - provisional data SO – 3.5 Country average IHR capacity score related to Health Emergency management Nigeria is on track for all indicators in this Strategic Outcome
Madagascar is not on track for any indicators SEAR<br>
Madagascar is not on track for any indicators SEAR<br>
19
Poliovirus Infectious Materials
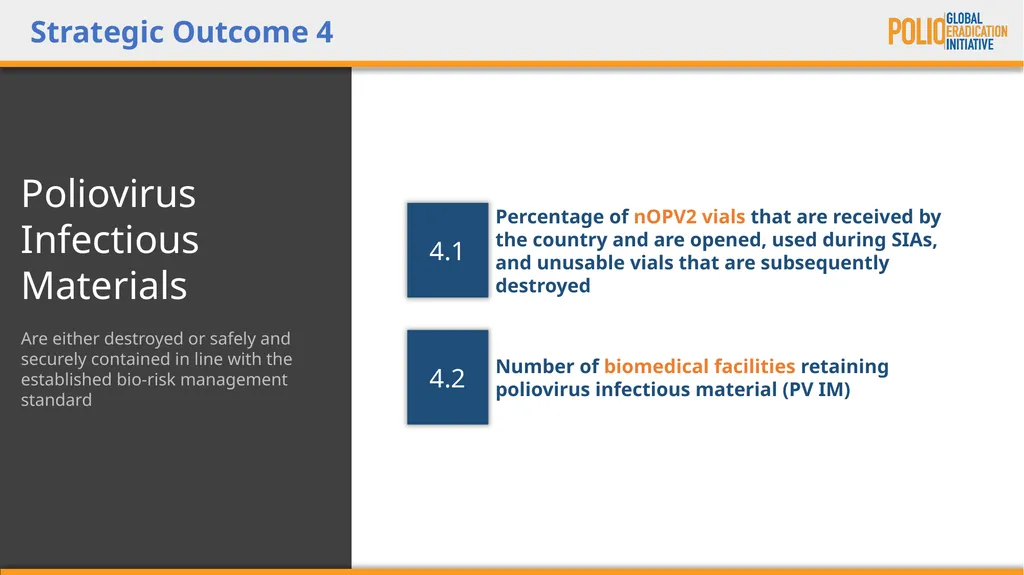
Are either destroyed or safely and securely contained in line with the established bio-risk management standard Strategic Outcome 4 Number of biomedical facilities retaining poliovirus infectious material (PV IM) Percentage of nOPV2 vials that are received by the country and are opened, used during SIAs, and unusable vials that are subsequently destroyed 4.2 4.1<br>
Are either destroyed or safely and securely contained in line with the established bio-risk management standard Strategic Outcome 4 Number of biomedical facilities retaining poliovirus infectious material (PV IM) Percentage of nOPV2 vials that are received by the country and are opened, used during SIAs, and unusable vials that are subsequently destroyed 4.2 4.1<br>
20
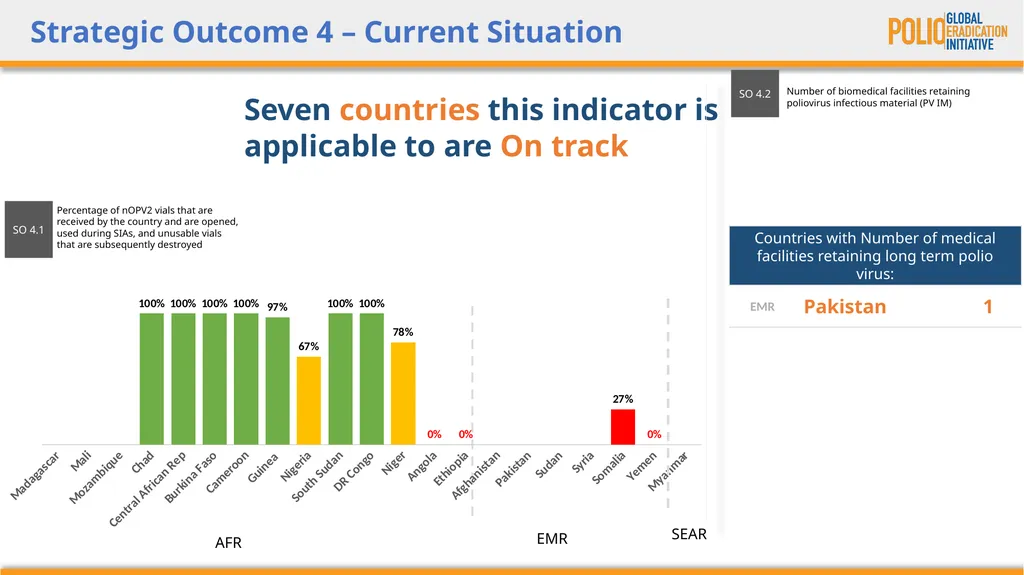
Strategic Outcome 4 – Current Situation Percentage of nOPV2 vials that are received by the country and are opened, used during SIAs, and unusable vials that are subsequently destroyed SO 4.1 Seven countries this indicator is applicable to are On track Number of biomedical facilities retaining poliovirus infectious material (PV IM) SO 4.2 Countries with Number of medical facilities retaining long term polio virus: AFR EMR SEAR<br>
21
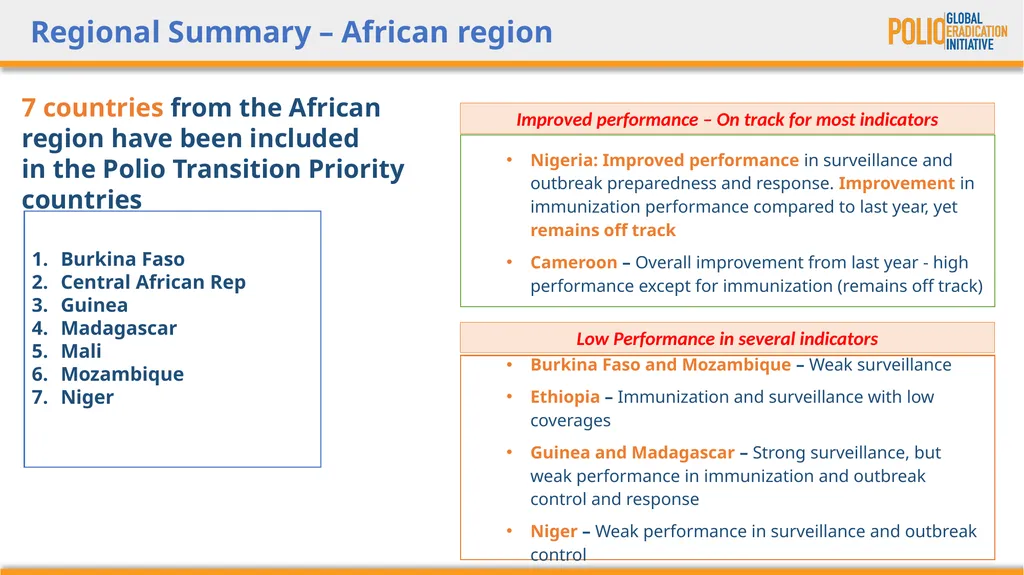
Regional Summary – African region 7 countries from the African region have been included in the Polio Transition Priority countries Nigeria: Improved performance in surveillance and outbreak preparedness and response. Improvement in immunization performance compared to last year, yet remains off track
Cameroon – Overall improvement from last year - high performance except for immunization (remains off track) Burkina Faso and Mozambique – Weak surveillance
Ethiopia – Immunization and surveillance with low coverages
Guinea and Madagascar – Strong surveillance, but weak performance in immunization and outbreak control and response
Niger – Weak performance in surveillance and outbreak control Improved performance – On track for most indicators Low Performance in several indicators Burkina Faso
Central African Rep
Guinea
Madagascar
Mali
Mozambique
Niger<br>
Cameroon – Overall improvement from last year - high performance except for immunization (remains off track) Burkina Faso and Mozambique – Weak surveillance
Ethiopia – Immunization and surveillance with low coverages
Guinea and Madagascar – Strong surveillance, but weak performance in immunization and outbreak control and response
Niger – Weak performance in surveillance and outbreak control Improved performance – On track for most indicators Low Performance in several indicators Burkina Faso
Central African Rep
Guinea
Madagascar
Mali
Mozambique
Niger<br>
22
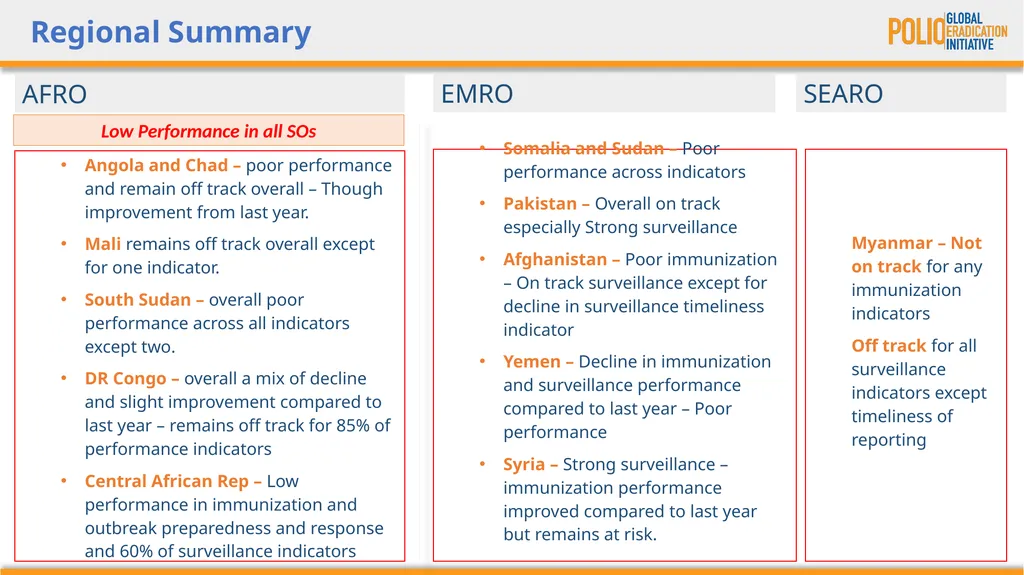
Regional Summary AFRO Angola and Chad – poor performance and remain off track overall – Though improvement from last year.
Mali remains off track overall except for one indicator.
South Sudan – overall poor performance across all indicators except two.
DR Congo – overall a mix of decline and slight improvement compared to last year – remains off track for 85% of performance indicators
Central African Rep – Low performance in immunization and outbreak preparedness and response and 60% of surveillance indicators Low Performance in all SOs Somalia and Sudan – Poor performance across indicators
Pakistan – Overall on track especially Strong surveillance
Afghanistan – Poor immunization – On track surveillance except for decline in surveillance timeliness indicator
Yemen – Decline in immunization and surveillance performance compared to last year – Poor performance
Syria – Strong surveillance – immunization performance improved compared to last year but remains at risk. EMRO Myanmar – Not on track for any immunization indicators
Off track for all surveillance indicators except timeliness of reporting SEARO<br>
Mali remains off track overall except for one indicator.
South Sudan – overall poor performance across all indicators except two.
DR Congo – overall a mix of decline and slight improvement compared to last year – remains off track for 85% of performance indicators
Central African Rep – Low performance in immunization and outbreak preparedness and response and 60% of surveillance indicators Low Performance in all SOs Somalia and Sudan – Poor performance across indicators
Pakistan – Overall on track especially Strong surveillance
Afghanistan – Poor immunization – On track surveillance except for decline in surveillance timeliness indicator
Yemen – Decline in immunization and surveillance performance compared to last year – Poor performance
Syria – Strong surveillance – immunization performance improved compared to last year but remains at risk. EMRO Myanmar – Not on track for any immunization indicators
Off track for all surveillance indicators except timeliness of reporting SEARO<br>
23
Watchlist Countries<br>
24
National Immunization Programmes
Systematically reach and immunize everyone with polio and other vaccines Strategic Outcome 1 Percentage of districts with DPT3 coverage greater than or equal to 80% National coverage of DPT3 provided through routine services National coverage of IPV1 provided through routine service 1.3 1.2 1.1<br>
Systematically reach and immunize everyone with polio and other vaccines Strategic Outcome 1 Percentage of districts with DPT3 coverage greater than or equal to 80% National coverage of DPT3 provided through routine services National coverage of IPV1 provided through routine service 1.3 1.2 1.1<br>
25
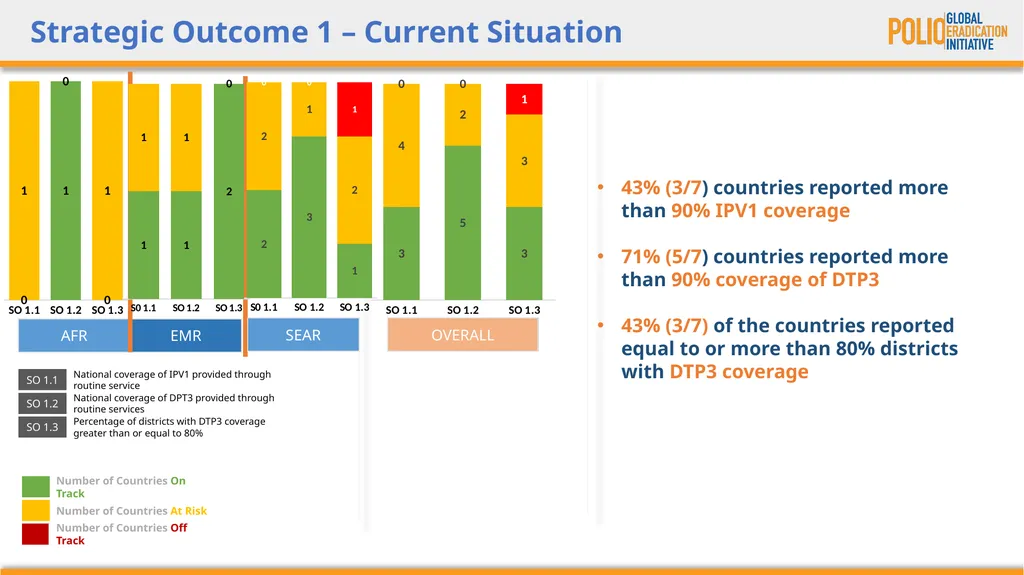
Strategic Outcome 1 – Current Situation AFR EMR 43% (3/7) countries reported more than 90% IPV1 coverage
71% (5/7) countries reported more than 90% coverage of DTP3
43% (3/7) of the countries reported equal to or more than 80% districts with DTP3 coverage SEAR OVERALL<br>
71% (5/7) countries reported more than 90% coverage of DTP3
43% (3/7) of the countries reported equal to or more than 80% districts with DTP3 coverage SEAR OVERALL<br>
26
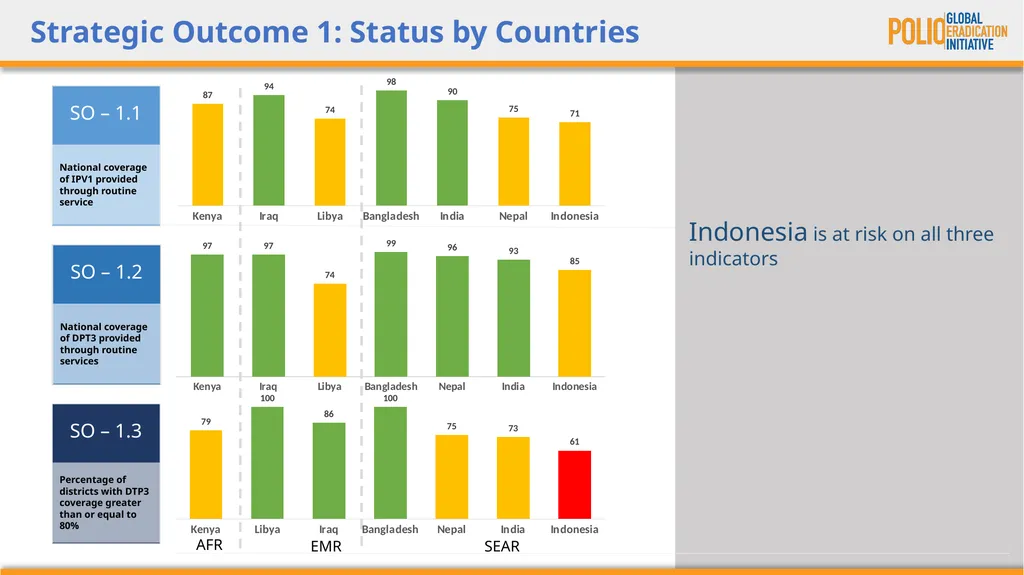
Strategic Outcome 1: Status by Countries SO – 1.2 National coverage of DPT3 provided through routine services SO – 1.3 Percentage of districts with DTP3 coverage greater than or equal to 80% Indonesia is at risk on all three indicators AFR EMR SEAR<br>
27
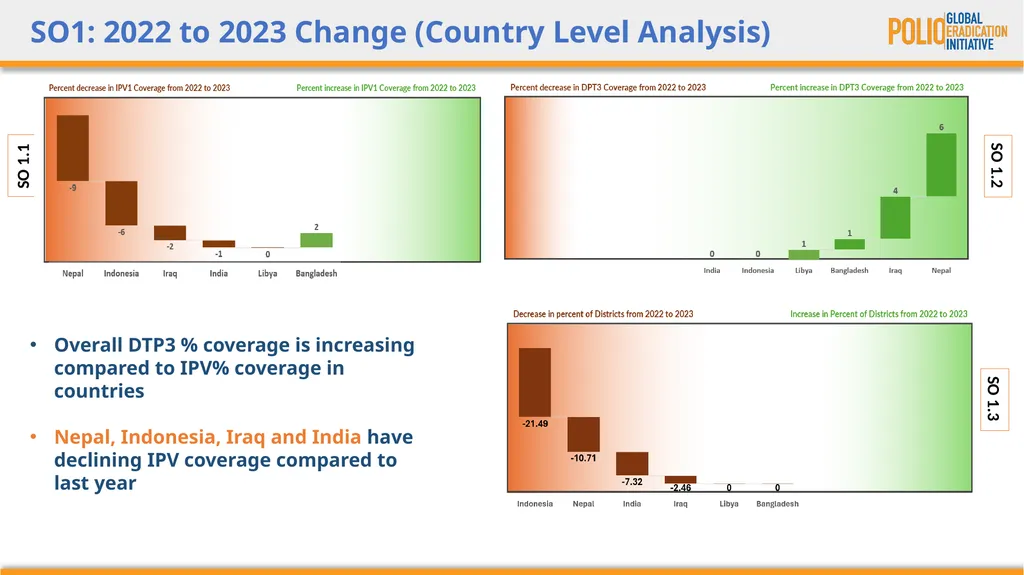
SO1: 2022 to 2023 Change (Country Level Analysis) Overall DTP3 % coverage is increasing compared to IPV% coverage in countries
Nepal, Indonesia, Iraq and India have declining IPV coverage compared to last year SO 1.2 SO 1.3 SO 1.1<br>
Nepal, Indonesia, Iraq and India have declining IPV coverage compared to last year SO 1.2 SO 1.3 SO 1.1<br>
28
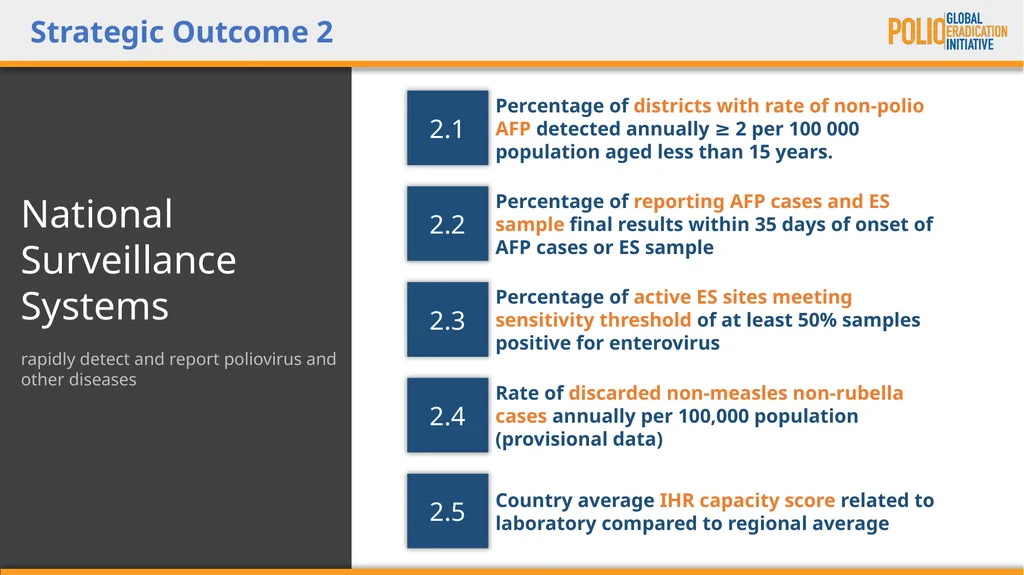
National Surveillance Systems
rapidly detect and report poliovirus and other diseases Strategic Outcome 2 Percentage of active ES sites meeting sensitivity threshold of at least 50% samples positive for enterovirus Percentage of reporting AFP cases and ES sample final results within 35 days of onset of AFP cases or ES sample Percentage of districts with rate of non-polio AFP detected annually ≥ 2 per 100 000 population aged less than 15 years. 2.3 2.2 2.1 Rate of discarded non-measles non-rubella cases annually per 100,000 population (provisional data) 2.4 Country average IHR capacity score related to laboratory compared to regional average 2.5<br>
rapidly detect and report poliovirus and other diseases Strategic Outcome 2 Percentage of active ES sites meeting sensitivity threshold of at least 50% samples positive for enterovirus Percentage of reporting AFP cases and ES sample final results within 35 days of onset of AFP cases or ES sample Percentage of districts with rate of non-polio AFP detected annually ≥ 2 per 100 000 population aged less than 15 years. 2.3 2.2 2.1 Rate of discarded non-measles non-rubella cases annually per 100,000 population (provisional data) 2.4 Country average IHR capacity score related to laboratory compared to regional average 2.5<br>
29
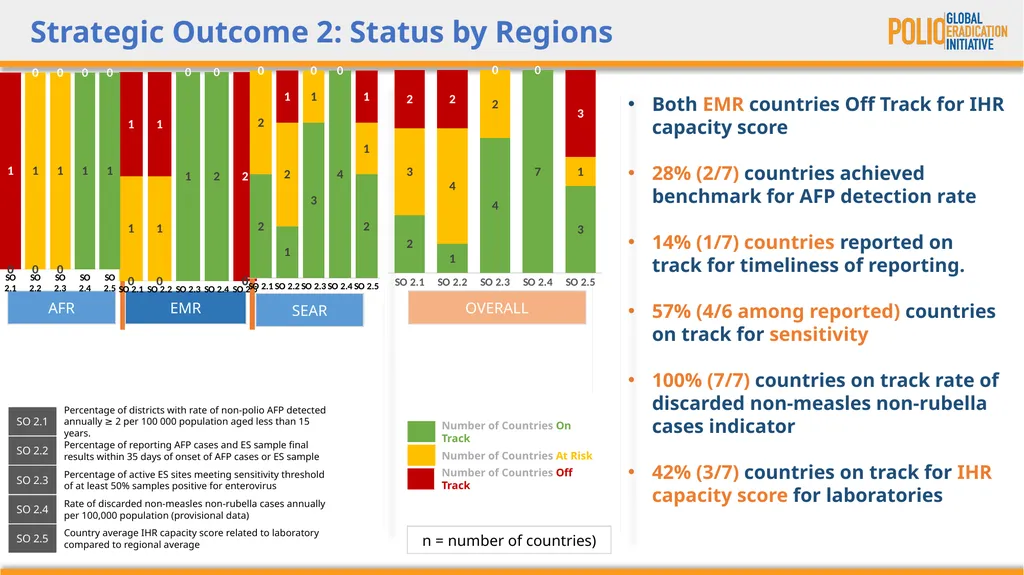
Strategic Outcome 2: Status by Regions n = number of countries) AFR EMR Both EMR countries Off Track for IHR capacity score
28% (2/7) countries achieved benchmark for AFP detection rate
14% (1/7) countries reported on track for timeliness of reporting.
57% (4/6 among reported) countries on track for sensitivity
100% (7/7) countries on track rate of discarded non-measles non-rubella cases indicator
42% (3/7) countries on track for IHR capacity score for laboratories SEAR OVERALL<br>
28% (2/7) countries achieved benchmark for AFP detection rate
14% (1/7) countries reported on track for timeliness of reporting.
57% (4/6 among reported) countries on track for sensitivity
100% (7/7) countries on track rate of discarded non-measles non-rubella cases indicator
42% (3/7) countries on track for IHR capacity score for laboratories SEAR OVERALL<br>
30
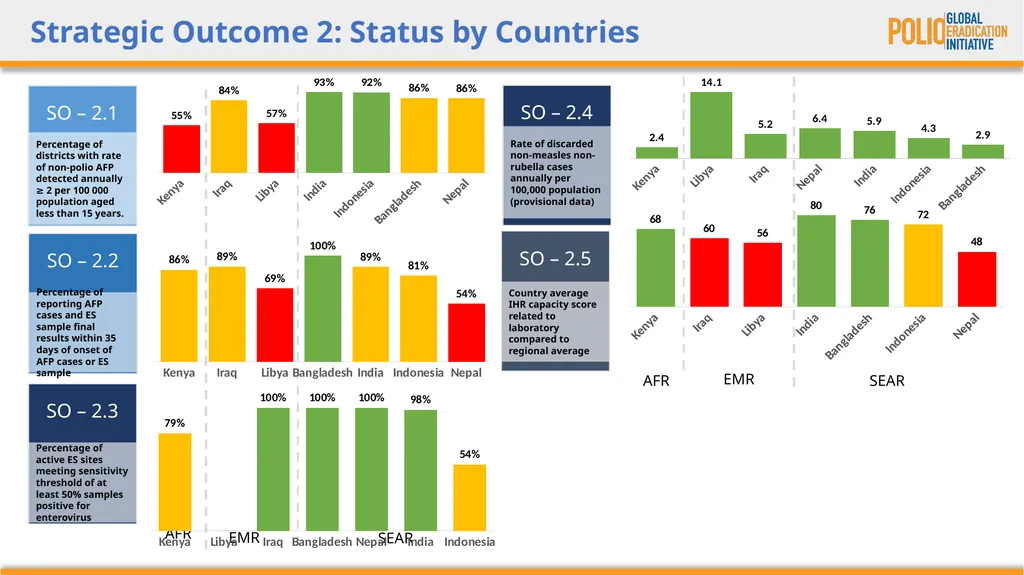
Strategic Outcome 2: Status by Countries AFR EMR SO – 2.1 Percentage of districts with rate of non-polio AFP detected annually ≥ 2 per 100 000 population aged less than 15 years. SO – 2.2 Percentage of reporting AFP cases and ES sample final results within 35 days of onset of AFP cases or ES sample SO – 2.3 Percentage of active ES sites meeting sensitivity threshold of at least 50% samples positive for enterovirus SEAR SO – 2.4 Rate of discarded non-measles non-rubella cases annually per 100,000 population (provisional data) SO – 2.5 Country average IHR capacity score related to laboratory compared to regional average AFR EMR SEAR<br>
31
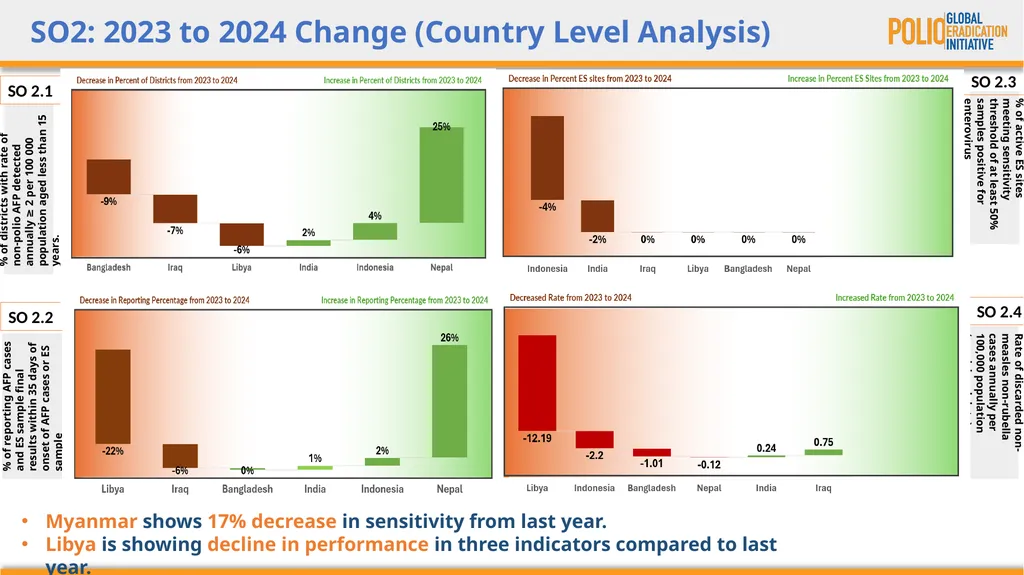
SO2: 2023 to 2024 Change (Country Level Analysis) % of districts with rate of non-polio AFP detected annually ≥ 2 per 100 000 population aged less than 15 years. % of reporting AFP cases and ES sample final results within 35 days of onset of AFP cases or ES sample % of active ES sites meeting sensitivity threshold of at least 50% samples positive for enterovirus Rate of discarded non-measles non-rubella cases annually per 100,000 population (provisional data) Myanmar shows 17% decrease in sensitivity from last year.
Libya is showing decline in performance in three indicators compared to last year. SO 2.3 SO 2.4 SO 2.1 SO 2.2<br>
Libya is showing decline in performance in three indicators compared to last year. SO 2.3 SO 2.4 SO 2.1 SO 2.2<br>
32
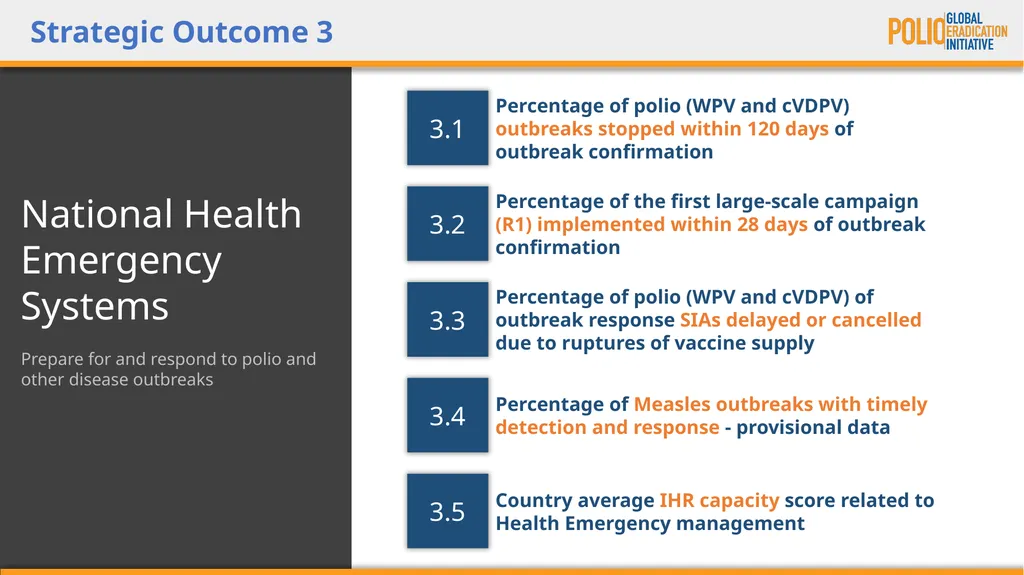
National Health Emergency Systems
Prepare for and respond to polio and other disease outbreaks Strategic Outcome 3 Percentage of polio (WPV and cVDPV) of outbreak response SIAs delayed or cancelled due to ruptures of vaccine supply Percentage of the first large-scale campaign (R1) implemented within 28 days of outbreak confirmation Percentage of polio (WPV and cVDPV) outbreaks stopped within 120 days of outbreak confirmation 3.3 3.2 3.1 Percentage of Measles outbreaks with timely detection and response - provisional data 3.4 Country average IHR capacity score related to Health Emergency management 3.5<br>
Prepare for and respond to polio and other disease outbreaks Strategic Outcome 3 Percentage of polio (WPV and cVDPV) of outbreak response SIAs delayed or cancelled due to ruptures of vaccine supply Percentage of the first large-scale campaign (R1) implemented within 28 days of outbreak confirmation Percentage of polio (WPV and cVDPV) outbreaks stopped within 120 days of outbreak confirmation 3.3 3.2 3.1 Percentage of Measles outbreaks with timely detection and response - provisional data 3.4 Country average IHR capacity score related to Health Emergency management 3.5<br>
33
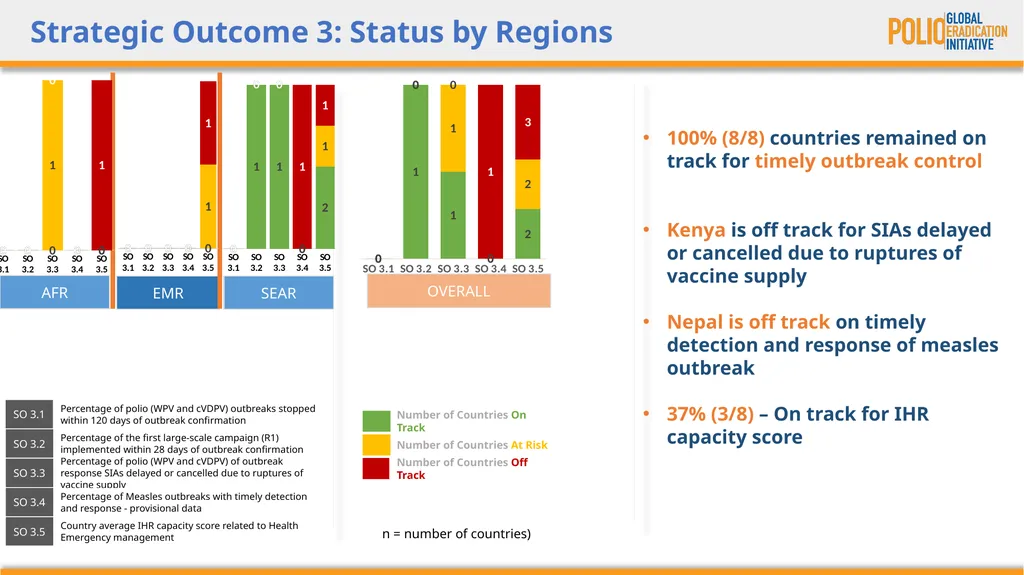
Strategic Outcome 3: Status by Regions AFR EMR n = number of countries) 100% (8/8) countries remained on track for timely outbreak control
Kenya is off track for SIAs delayed or cancelled due to ruptures of vaccine supply
Nepal is off track on timely detection and response of measles outbreak
37% (3/8) – On track for IHR capacity score SEAR OVERALL<br>
Kenya is off track for SIAs delayed or cancelled due to ruptures of vaccine supply
Nepal is off track on timely detection and response of measles outbreak
37% (3/8) – On track for IHR capacity score SEAR OVERALL<br>
34
Strategic Outcome 3: Status by Countries AFR EMR Regional Average = 57 SEAR AFR EMR SEAR Regional Average = 71 SO – 3.1 Percentage of polio (WPV and cVDPV) outbreaks stopped within 120 days of outbreak confirmation<br>
35
Poliovirus Infectious Materials
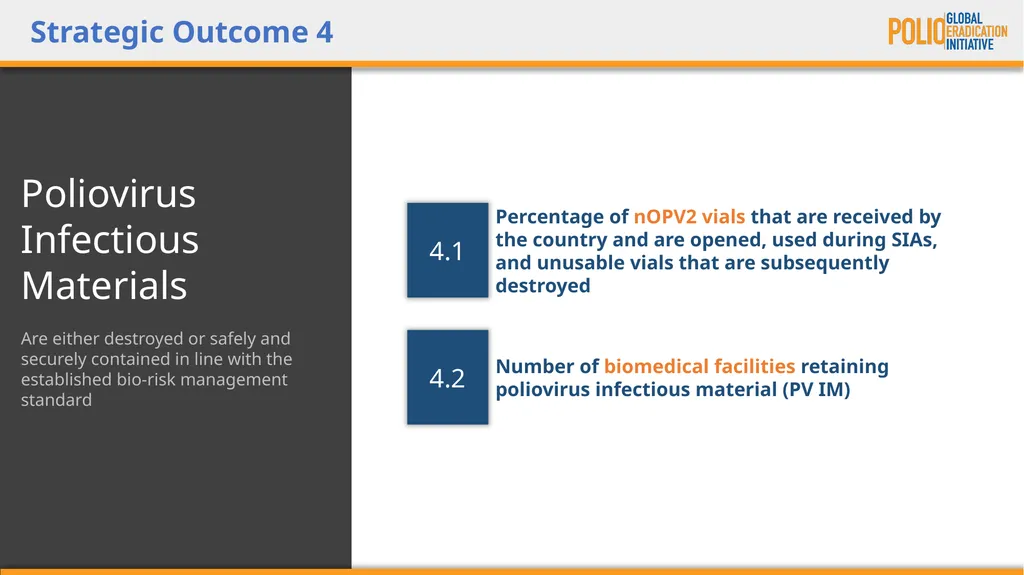
Are either destroyed or safely and securely contained in line with the established bio-risk management standard Strategic Outcome 4 Number of biomedical facilities retaining poliovirus infectious material (PV IM) Percentage of nOPV2 vials that are received by the country and are opened, used during SIAs, and unusable vials that are subsequently destroyed 4.2 4.1<br>
Are either destroyed or safely and securely contained in line with the established bio-risk management standard Strategic Outcome 4 Number of biomedical facilities retaining poliovirus infectious material (PV IM) Percentage of nOPV2 vials that are received by the country and are opened, used during SIAs, and unusable vials that are subsequently destroyed 4.2 4.1<br>
36
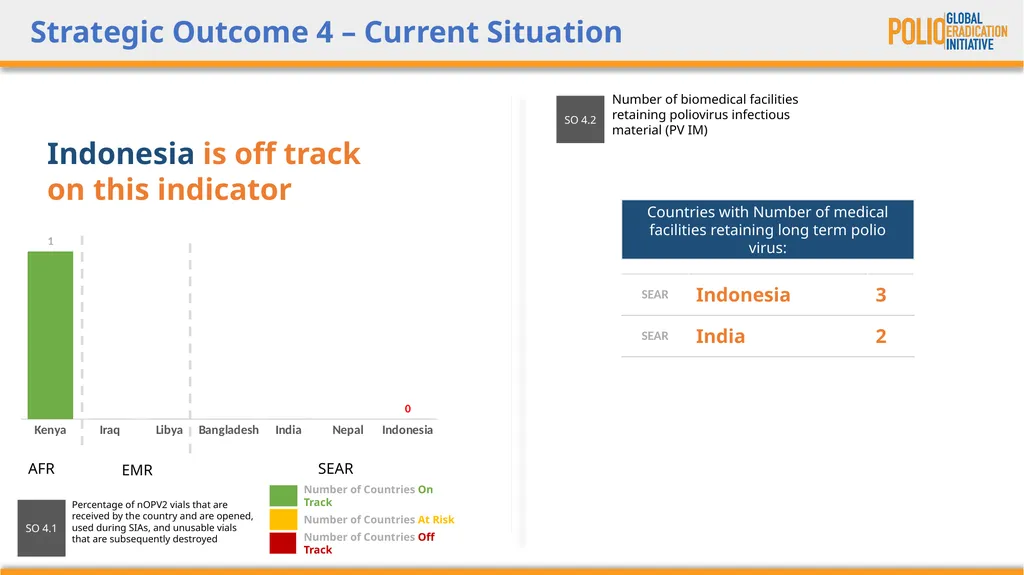
Strategic Outcome 4 – Current Situation Percentage of nOPV2 vials that are received by the country and are opened, used during SIAs, and unusable vials that are subsequently destroyed SO 4.1 Indonesia is off track on this indicator Number of biomedical facilities retaining poliovirus infectious material (PV IM) SO 4.2 Countries with Number of medical facilities retaining long term polio virus: EMR AFR SEAR<br>
37
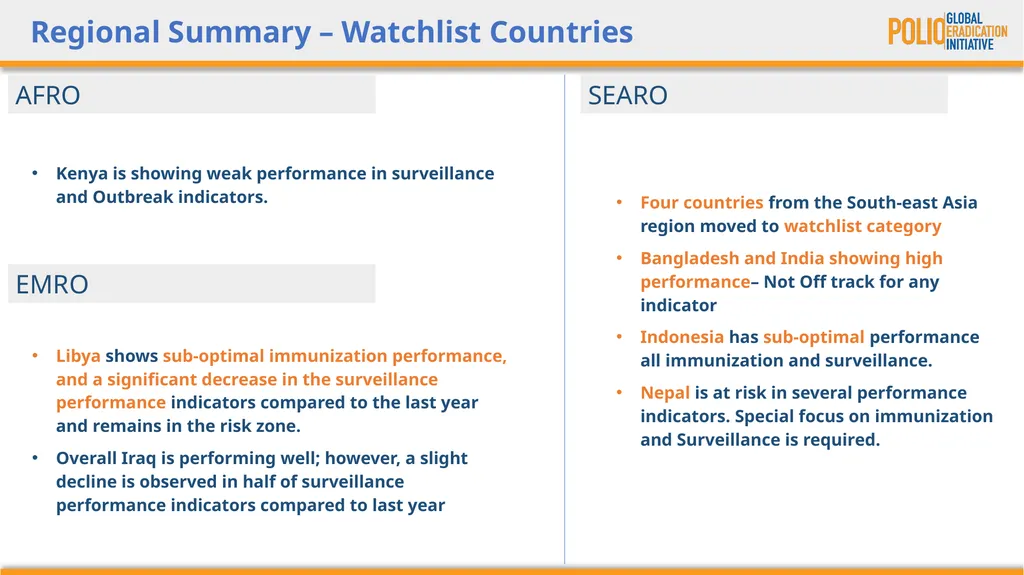
Regional Summary – Watchlist Countries Libya shows sub-optimal immunization performance, and a significant decrease in the surveillance performance indicators compared to the last year and remains in the risk zone.
Overall Iraq is performing well; however, a slight decline is observed in half of surveillance performance indicators compared to last year EMRO SEARO Four countries from the South-east Asia region moved to watchlist category
Bangladesh and India showing high performance– Not Off track for any indicator
Indonesia has sub-optimal performance all immunization and surveillance.
Nepal is at risk in several performance indicators. Special focus on immunization and Surveillance is required. AFRO Kenya is showing weak performance in surveillance and Outbreak indicators.<br>
Overall Iraq is performing well; however, a slight decline is observed in half of surveillance performance indicators compared to last year EMRO SEARO Four countries from the South-east Asia region moved to watchlist category
Bangladesh and India showing high performance– Not Off track for any indicator
Indonesia has sub-optimal performance all immunization and surveillance.
Nepal is at risk in several performance indicators. Special focus on immunization and Surveillance is required. AFRO Kenya is showing weak performance in surveillance and Outbreak indicators.<br>
38
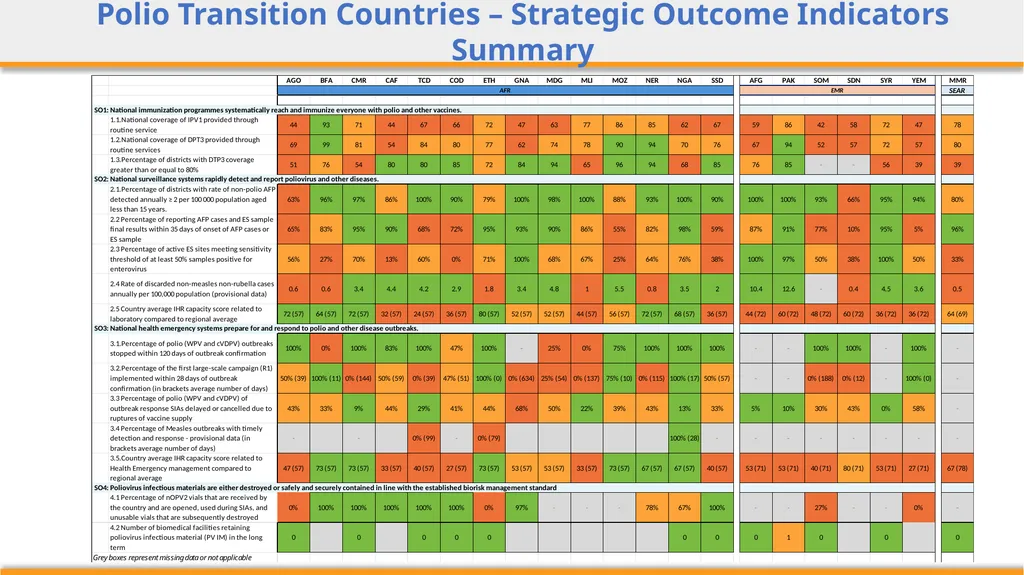
Polio Transition Countries – Strategic Outcome Indicators Summary<br>
39
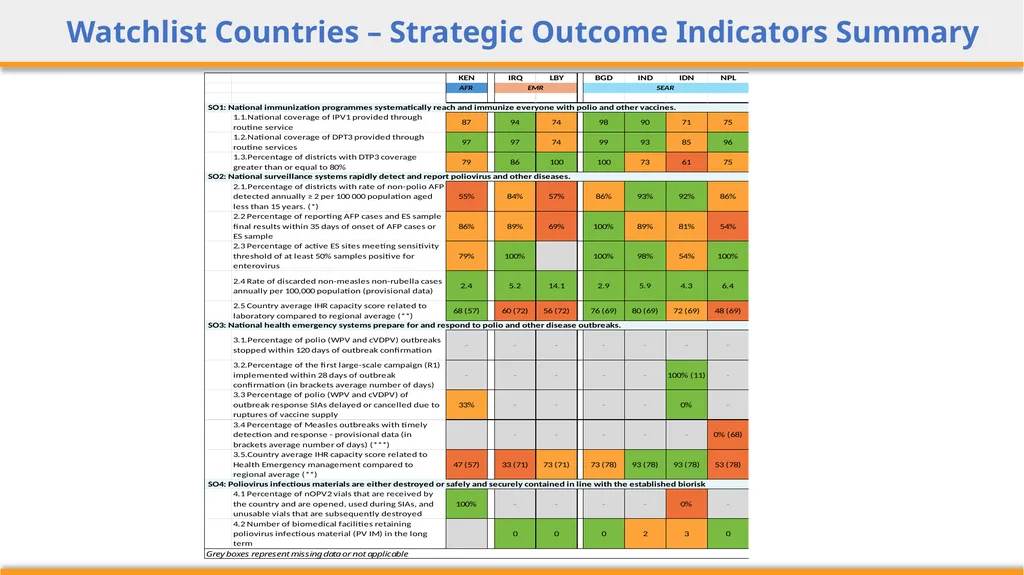
Watchlist Countries – Strategic Outcome Indicators Summary<br>
40
Thank You<br>