
PRESENTATION TO THE PORTFOLIO COMMITTEE ON 8
YM
Published · 67 slides · 0 views

1 / 1


Description
PRESENTATION TO THE PORTFOLIO COMMITTEE ON 8 NOVEMBER 2016 1 DEPARTMENT OF AGRICULTURE, FORESTRY AND FISHERIES SUMMARY OF QUARTER 2 ORGANISATIONAL PERFORMANCE REPORT FOR 201617 PRESENTATION OUTLINE OPERATIONAL ENVIRONMENT DAFF 201419
Related Topics
Share
Embed code
Download this presentation From Below
"PRESENTATION TO THE PORTFOLIO COMMITTEE ON 8" is the property of its rightful owner. Permission is granted to download and print the materials on this website for personal, non-commercial use only, and to display it on your personal computer provided you do not modify the materials and that you retain all copyright notices contained in the materials. By downloading content from our website, you accept the terms of this agreement.
Presentation Transcript
01
PRESENTATION TO THE PORTFOLIO COMMITTEE ON 8 NOVEMBER 2016 1 DEPARTMENT OF AGRICULTURE, FORESTRY AND FISHERIES
SUMMARY OF QUARTER 2
ORGANISATIONAL PERFORMANCE REPORT FOR 2016/17<br>
02
PRESENTATION OUTLINE OPERATIONAL ENVIRONMENT
DAFF 2014/19 FOCUS
DAFF MTSF PROGRESS
PERFORMANCE HIGHLIGHTS AGAINST QUARTER 2 TARGETS
DAFF MIDTERM PERFORMANCE
Q2 NON-ACHIEVEMENTS
HUMAN RESOURCES
STATE OF EXPENDITURE
CONCLUSION 2<br>
DAFF 2014/19 FOCUS
DAFF MTSF PROGRESS
PERFORMANCE HIGHLIGHTS AGAINST QUARTER 2 TARGETS
DAFF MIDTERM PERFORMANCE
Q2 NON-ACHIEVEMENTS
HUMAN RESOURCES
STATE OF EXPENDITURE
CONCLUSION 2<br>
03
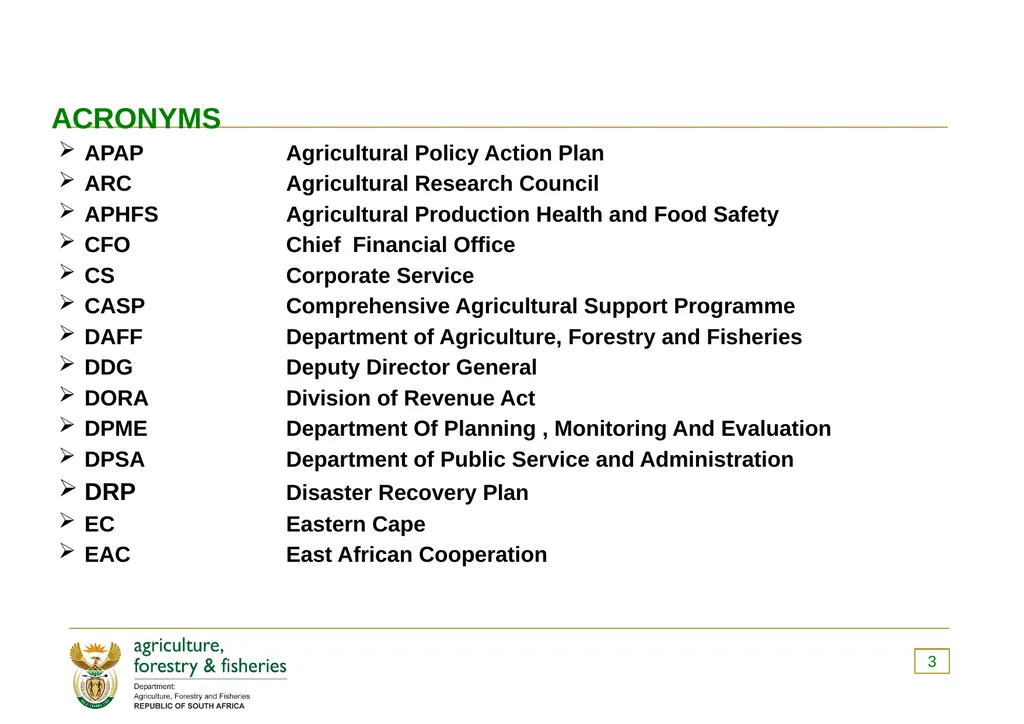
3 ACRONYMS APAP Agricultural Policy Action Plan
ARC Agricultural Research Council
APHFS Agricultural Production Health and Food Safety
CFO Chief Financial Office
CS Corporate Service
CASP Comprehensive Agricultural Support Programme
DAFF Department of Agriculture, Forestry and Fisheries
DDG Deputy Director General
DORA Division of Revenue Act
DPME Department Of Planning , Monitoring And Evaluation
DPSA Department of Public Service and Administration
DRP Disaster Recovery Plan
EC Eastern Cape
EAC East African Cooperation<br>
ARC Agricultural Research Council
APHFS Agricultural Production Health and Food Safety
CFO Chief Financial Office
CS Corporate Service
CASP Comprehensive Agricultural Support Programme
DAFF Department of Agriculture, Forestry and Fisheries
DDG Deputy Director General
DORA Division of Revenue Act
DPME Department Of Planning , Monitoring And Evaluation
DPSA Department of Public Service and Administration
DRP Disaster Recovery Plan
EC Eastern Cape
EAC East African Cooperation<br>
04
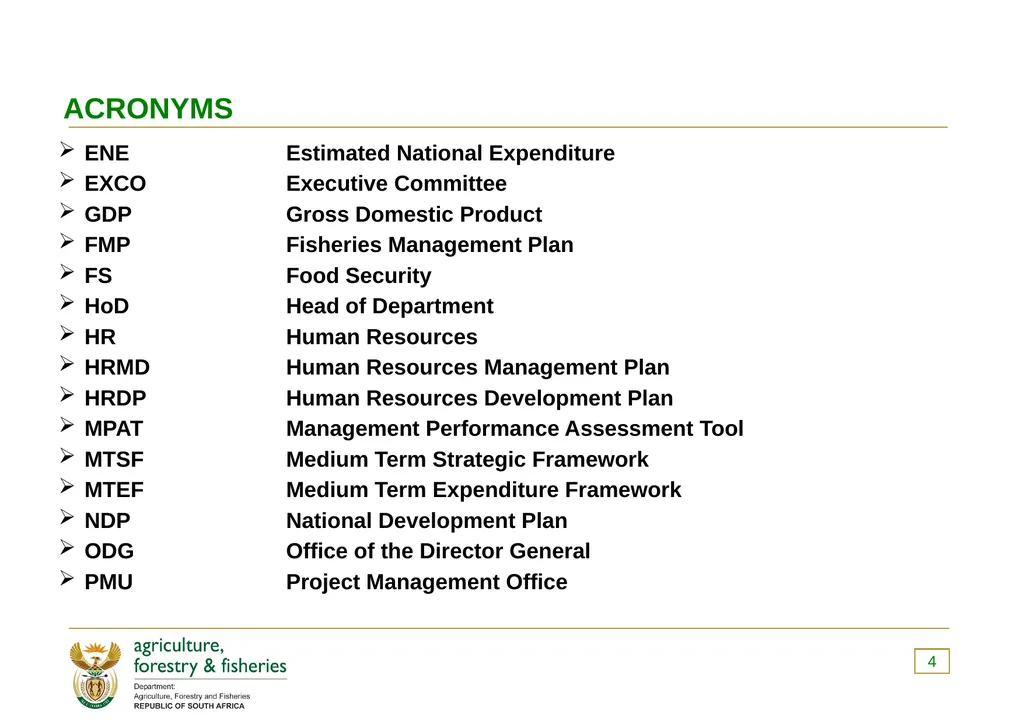
4 ACRONYMS ENE Estimated National Expenditure
EXCO Executive Committee
GDP Gross Domestic Product
FMP Fisheries Management Plan
FS Food Security
HoD Head of Department
HR Human Resources
HRMD Human Resources Management Plan
HRDP Human Resources Development Plan
MPAT Management Performance Assessment Tool
MTSF Medium Term Strategic Framework
MTEF Medium Term Expenditure Framework
NDP National Development Plan
ODG Office of the Director General
PMU Project Management Office<br>
EXCO Executive Committee
GDP Gross Domestic Product
FMP Fisheries Management Plan
FS Food Security
HoD Head of Department
HR Human Resources
HRMD Human Resources Management Plan
HRDP Human Resources Development Plan
MPAT Management Performance Assessment Tool
MTSF Medium Term Strategic Framework
MTEF Medium Term Expenditure Framework
NDP National Development Plan
ODG Office of the Director General
PMU Project Management Office<br>
05
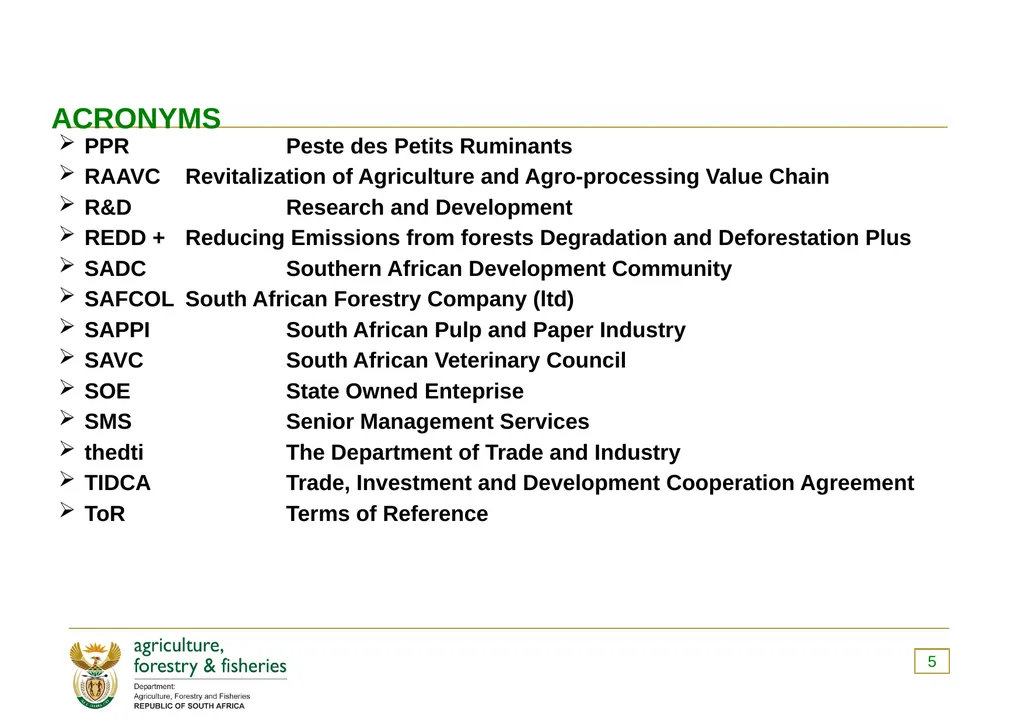
5 ACRONYMS PPR Peste des Petits Ruminants
RAAVC Revitalization of Agriculture and Agro-processing Value Chain
R&D Research and Development
REDD + Reducing Emissions from forests Degradation and Deforestation Plus
SADC Southern African Development Community
SAFCOL South African Forestry Company (ltd)
SAPPI South African Pulp and Paper Industry
SAVC South African Veterinary Council
SOE State Owned Enteprise
SMS Senior Management Services
thedti The Department of Trade and Industry
TIDCA Trade, Investment and Development Cooperation Agreement
ToR Terms of Reference<br>
RAAVC Revitalization of Agriculture and Agro-processing Value Chain
R&D Research and Development
REDD + Reducing Emissions from forests Degradation and Deforestation Plus
SADC Southern African Development Community
SAFCOL South African Forestry Company (ltd)
SAPPI South African Pulp and Paper Industry
SAVC South African Veterinary Council
SOE State Owned Enteprise
SMS Senior Management Services
thedti The Department of Trade and Industry
TIDCA Trade, Investment and Development Cooperation Agreement
ToR Terms of Reference<br>
06
OPERATIONAL ENVIRONMENT 6<br>
07
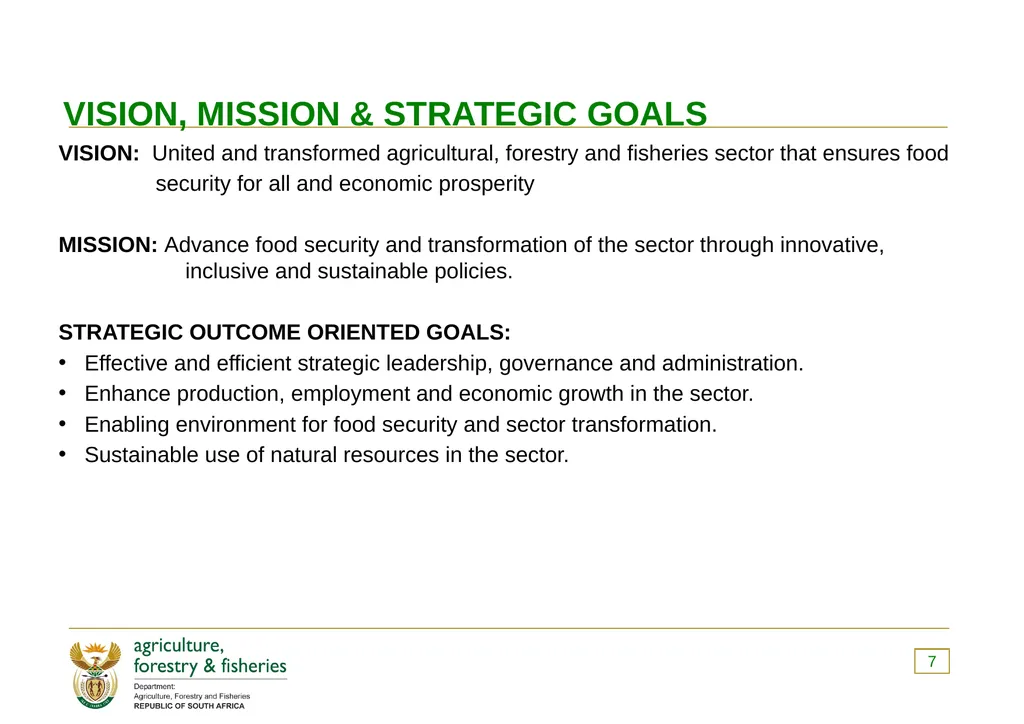
7 VISION, MISSION & STRATEGIC GOALS VISION: United and transformed agricultural, forestry and fisheries sector that ensures food
security for all and economic prosperity
MISSION: Advance food security and transformation of the sector through innovative, inclusive and sustainable policies.
STRATEGIC OUTCOME ORIENTED GOALS:
Effective and efficient strategic leadership, governance and administration.
Enhance production, employment and economic growth in the sector.
Enabling environment for food security and sector transformation.
Sustainable use of natural resources in the sector.<br>
security for all and economic prosperity
MISSION: Advance food security and transformation of the sector through innovative, inclusive and sustainable policies.
STRATEGIC OUTCOME ORIENTED GOALS:
Effective and efficient strategic leadership, governance and administration.
Enhance production, employment and economic growth in the sector.
Enabling environment for food security and sector transformation.
Sustainable use of natural resources in the sector.<br>
08
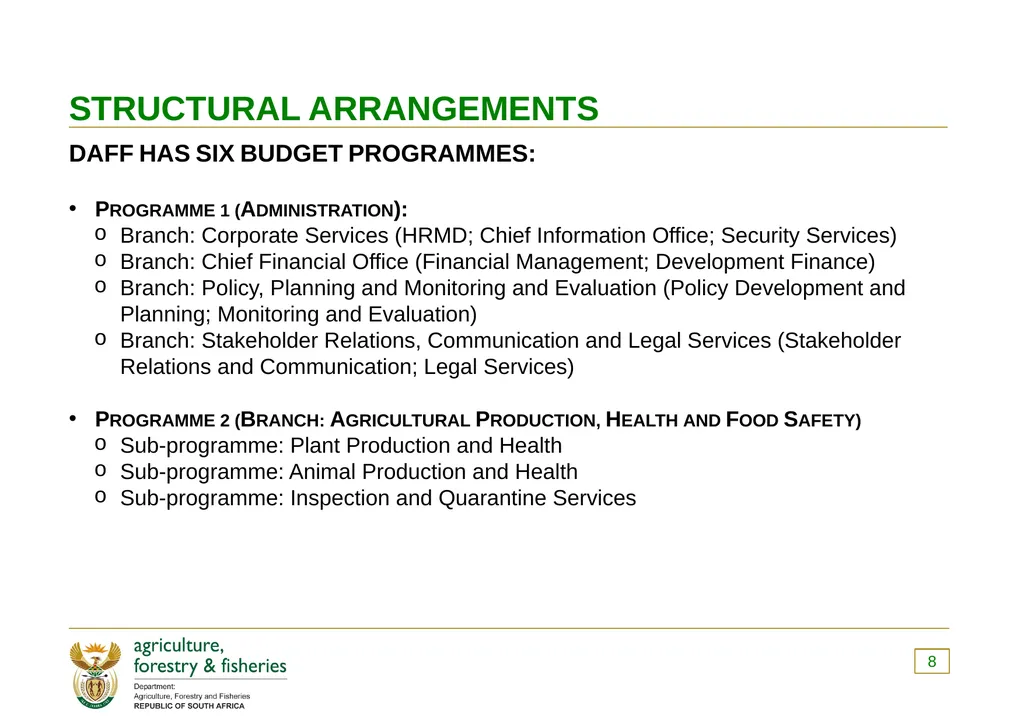
STRUCTURAL ARRANGEMENTS DAFF HAS SIX BUDGET PROGRAMMES:
Programme 1 (Administration):
Branch: Corporate Services (HRMD; Chief Information Office; Security Services)
Branch: Chief Financial Office (Financial Management; Development Finance)
Branch: Policy, Planning and Monitoring and Evaluation (Policy Development and Planning; Monitoring and Evaluation)
Branch: Stakeholder Relations, Communication and Legal Services (Stakeholder Relations and Communication; Legal Services)
Programme 2 (Branch: Agricultural Production, Health and Food Safety)
Sub-programme: Plant Production and Health
Sub-programme: Animal Production and Health
Sub-programme: Inspection and Quarantine Services 8<br>
Programme 1 (Administration):
Branch: Corporate Services (HRMD; Chief Information Office; Security Services)
Branch: Chief Financial Office (Financial Management; Development Finance)
Branch: Policy, Planning and Monitoring and Evaluation (Policy Development and Planning; Monitoring and Evaluation)
Branch: Stakeholder Relations, Communication and Legal Services (Stakeholder Relations and Communication; Legal Services)
Programme 2 (Branch: Agricultural Production, Health and Food Safety)
Sub-programme: Plant Production and Health
Sub-programme: Animal Production and Health
Sub-programme: Inspection and Quarantine Services 8<br>
09
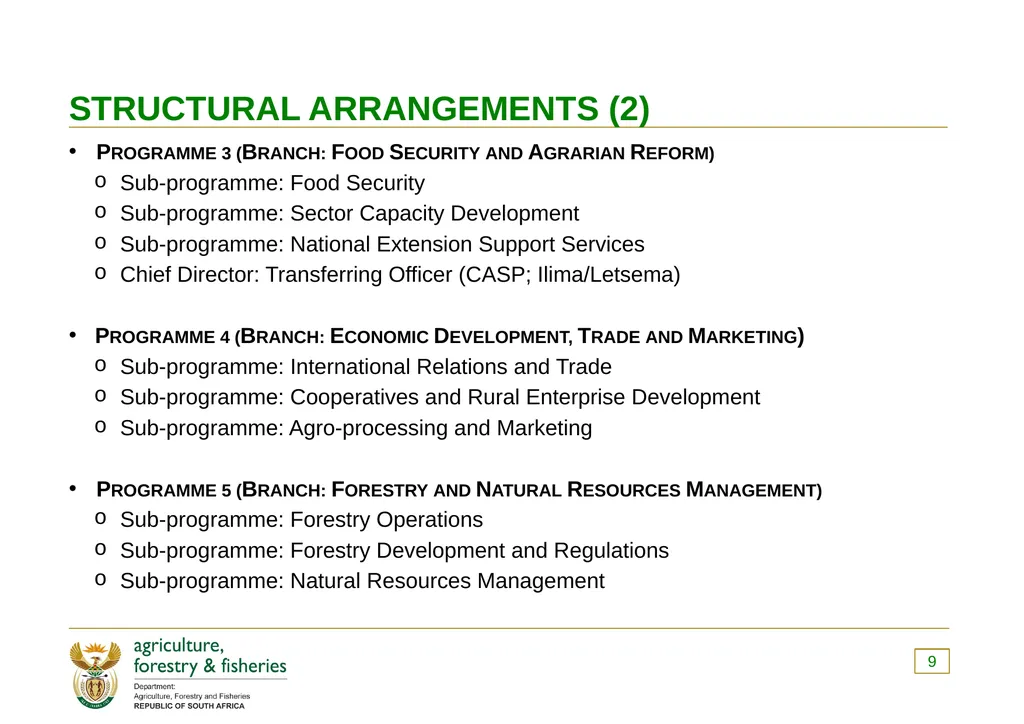
STRUCTURAL ARRANGEMENTS (2) Programme 3 (Branch: Food Security and Agrarian Reform)
Sub-programme: Food Security
Sub-programme: Sector Capacity Development
Sub-programme: National Extension Support Services
Chief Director: Transferring Officer (CASP; Ilima/Letsema)
Programme 4 (Branch: Economic Development, Trade and Marketing)
Sub-programme: International Relations and Trade
Sub-programme: Cooperatives and Rural Enterprise Development
Sub-programme: Agro-processing and Marketing
Programme 5 (Branch: Forestry and Natural Resources Management)
Sub-programme: Forestry Operations
Sub-programme: Forestry Development and Regulations
Sub-programme: Natural Resources Management 9<br>
Sub-programme: Food Security
Sub-programme: Sector Capacity Development
Sub-programme: National Extension Support Services
Chief Director: Transferring Officer (CASP; Ilima/Letsema)
Programme 4 (Branch: Economic Development, Trade and Marketing)
Sub-programme: International Relations and Trade
Sub-programme: Cooperatives and Rural Enterprise Development
Sub-programme: Agro-processing and Marketing
Programme 5 (Branch: Forestry and Natural Resources Management)
Sub-programme: Forestry Operations
Sub-programme: Forestry Development and Regulations
Sub-programme: Natural Resources Management 9<br>
10
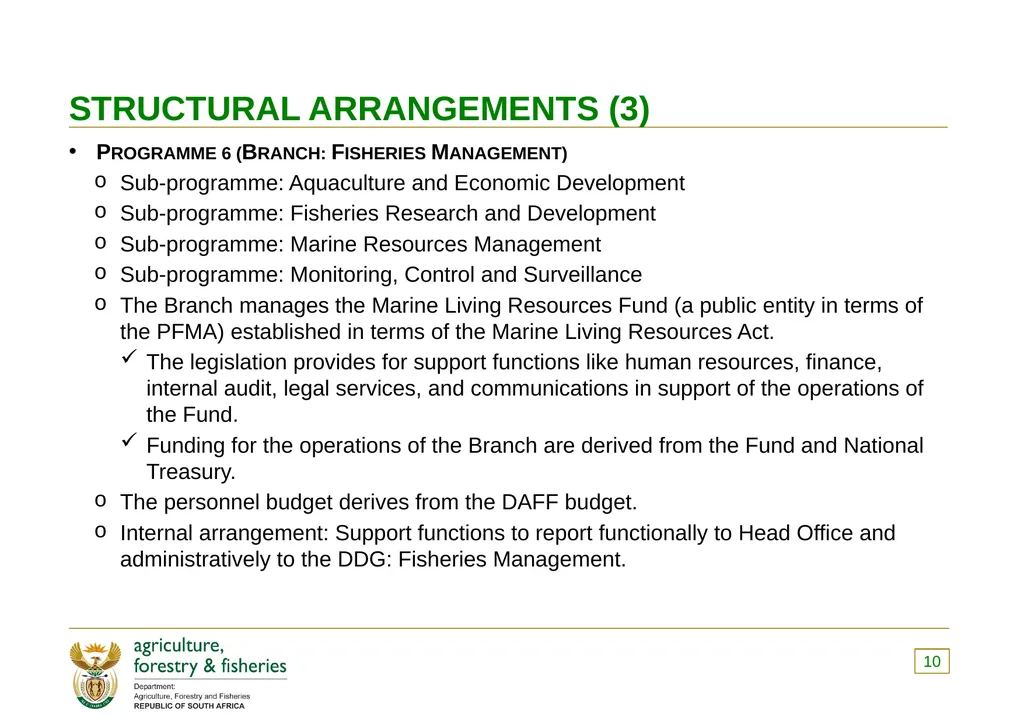
STRUCTURAL ARRANGEMENTS (3) Programme 6 (Branch: Fisheries Management)
Sub-programme: Aquaculture and Economic Development
Sub-programme: Fisheries Research and Development
Sub-programme: Marine Resources Management
Sub-programme: Monitoring, Control and Surveillance
The Branch manages the Marine Living Resources Fund (a public entity in terms of the PFMA) established in terms of the Marine Living Resources Act.
The legislation provides for support functions like human resources, finance, internal audit, legal services, and communications in support of the operations of the Fund.
Funding for the operations of the Branch are derived from the Fund and National Treasury.
The personnel budget derives from the DAFF budget.
Internal arrangement: Support functions to report functionally to Head Office and administratively to the DDG: Fisheries Management. 10<br>
Sub-programme: Aquaculture and Economic Development
Sub-programme: Fisheries Research and Development
Sub-programme: Marine Resources Management
Sub-programme: Monitoring, Control and Surveillance
The Branch manages the Marine Living Resources Fund (a public entity in terms of the PFMA) established in terms of the Marine Living Resources Act.
The legislation provides for support functions like human resources, finance, internal audit, legal services, and communications in support of the operations of the Fund.
Funding for the operations of the Branch are derived from the Fund and National Treasury.
The personnel budget derives from the DAFF budget.
Internal arrangement: Support functions to report functionally to Head Office and administratively to the DDG: Fisheries Management. 10<br>
11
DAFF 2014-19 FOCUS 11<br>
12
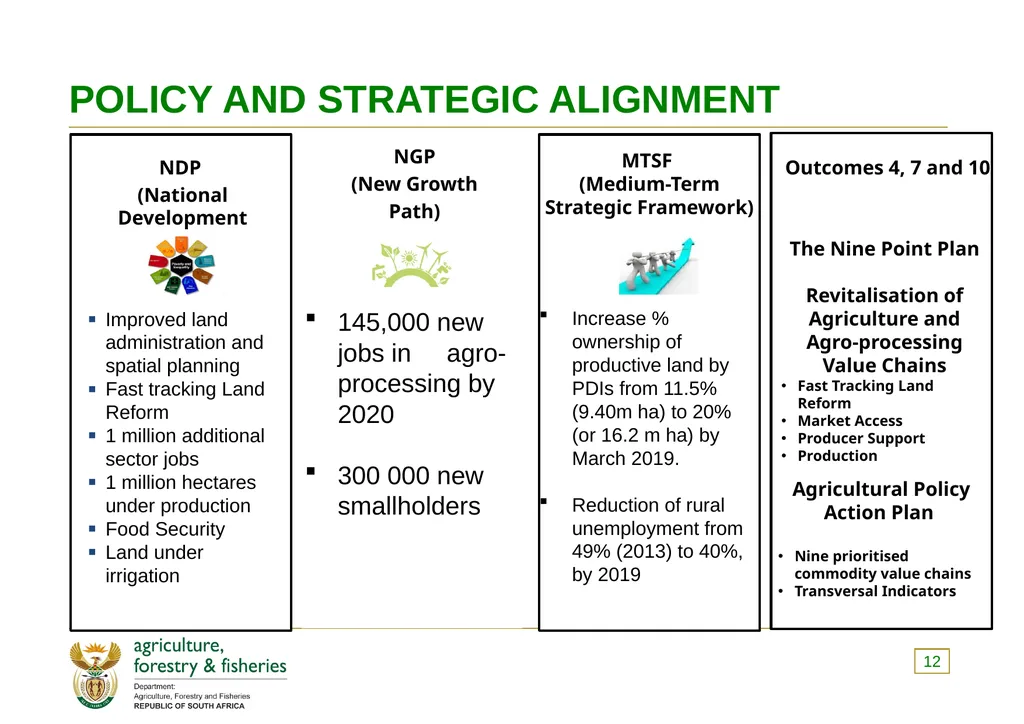
POLICY AND STRATEGIC ALIGNMENT 12 NDP
(National Development Plan) Improved land administration and spatial planning
Fast tracking Land Reform
1 million additional sector jobs
1 million hectares under production
Food Security
Land under irrigation MTSF
(Medium-Term Strategic Framework) Outcomes 4, 7 and 10 Increase % ownership of productive land by PDIs from 11.5% (9.40m ha) to 20% (or 16.2 m ha) by March 2019.
Reduction of rural unemployment from 49% (2013) to 40%, by 2019 The Nine Point Plan
Revitalisation of Agriculture and Agro-processing Value Chains
Fast Tracking Land Reform
Market Access
Producer Support
Production Agricultural Policy Action Plan
Nine prioritised commodity value chains
Transversal Indicators 145,000 new jobs in agro-processing by 2020
300 000 new smallholders NGP
(New Growth
Path)<br>
(National Development Plan) Improved land administration and spatial planning
Fast tracking Land Reform
1 million additional sector jobs
1 million hectares under production
Food Security
Land under irrigation MTSF
(Medium-Term Strategic Framework) Outcomes 4, 7 and 10 Increase % ownership of productive land by PDIs from 11.5% (9.40m ha) to 20% (or 16.2 m ha) by March 2019.
Reduction of rural unemployment from 49% (2013) to 40%, by 2019 The Nine Point Plan
Revitalisation of Agriculture and Agro-processing Value Chains
Fast Tracking Land Reform
Market Access
Producer Support
Production Agricultural Policy Action Plan
Nine prioritised commodity value chains
Transversal Indicators 145,000 new jobs in agro-processing by 2020
300 000 new smallholders NGP
(New Growth
Path)<br>
13
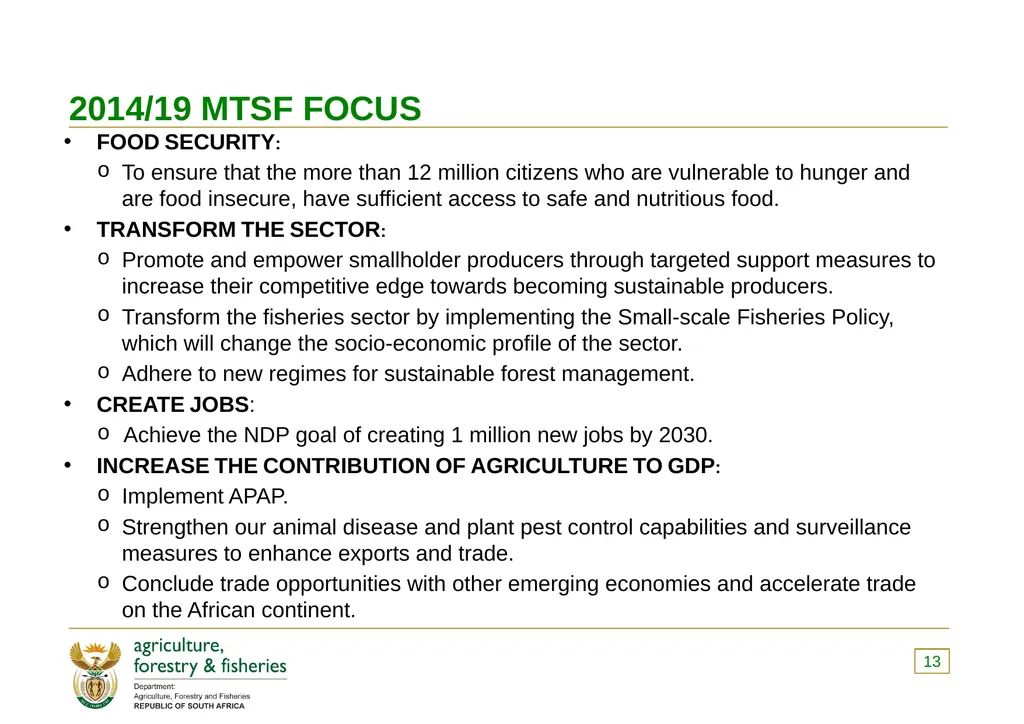
2014/19 MTSF FOCUS FOOD SECURITY:
To ensure that the more than 12 million citizens who are vulnerable to hunger and are food insecure, have sufficient access to safe and nutritious food.
TRANSFORM THE SECTOR:
Promote and empower smallholder producers through targeted support measures to increase their competitive edge towards becoming sustainable producers.
Transform the fisheries sector by implementing the Small-scale Fisheries Policy, which will change the socio-economic profile of the sector.
Adhere to new regimes for sustainable forest management.
CREATE JOBS:
Achieve the NDP goal of creating 1 million new jobs by 2030.
INCREASE THE CONTRIBUTION OF AGRICULTURE TO GDP:
Implement APAP.
Strengthen our animal disease and plant pest control capabilities and surveillance measures to enhance exports and trade.
Conclude trade opportunities with other emerging economies and accelerate trade on the African continent. 13<br>
To ensure that the more than 12 million citizens who are vulnerable to hunger and are food insecure, have sufficient access to safe and nutritious food.
TRANSFORM THE SECTOR:
Promote and empower smallholder producers through targeted support measures to increase their competitive edge towards becoming sustainable producers.
Transform the fisheries sector by implementing the Small-scale Fisheries Policy, which will change the socio-economic profile of the sector.
Adhere to new regimes for sustainable forest management.
CREATE JOBS:
Achieve the NDP goal of creating 1 million new jobs by 2030.
INCREASE THE CONTRIBUTION OF AGRICULTURE TO GDP:
Implement APAP.
Strengthen our animal disease and plant pest control capabilities and surveillance measures to enhance exports and trade.
Conclude trade opportunities with other emerging economies and accelerate trade on the African continent. 13<br>
14
DAFF MTSF PROGRESS 14<br>
15
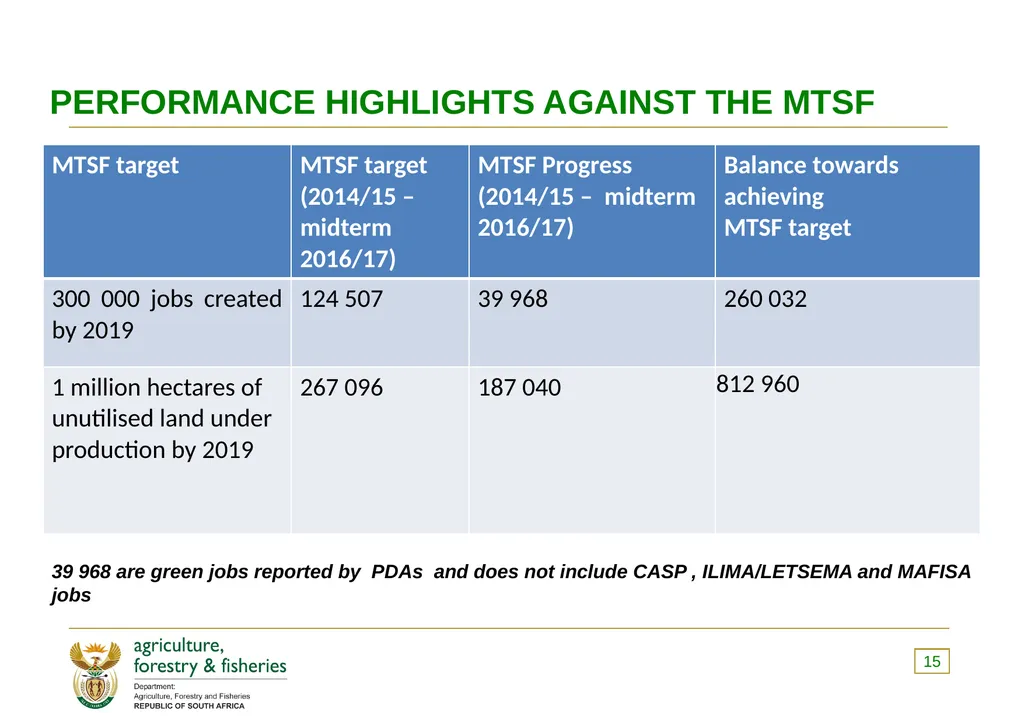
PERFORMANCE HIGHLIGHTS AGAINST THE MTSF 15 39 968 are green jobs reported by PDAs and does not include CASP , ILIMA/LETSEMA and MAFISA jobs<br>
16
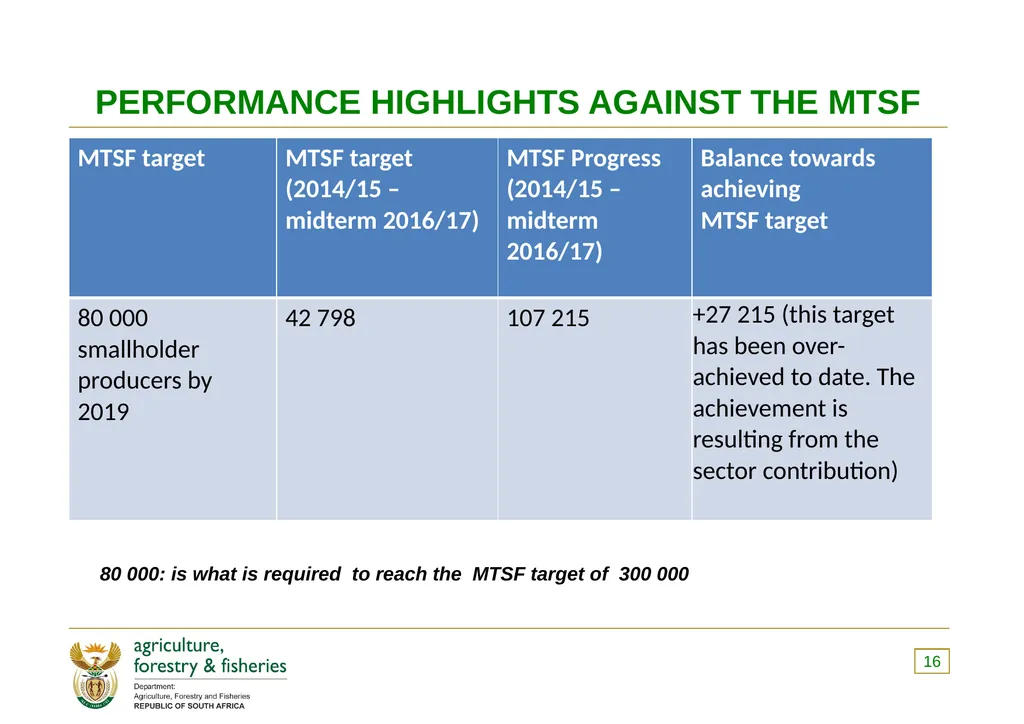
PERFORMANCE HIGHLIGHTS AGAINST THE MTSF 16 80 000: is what is required to reach the MTSF target of 300 000<br>
17
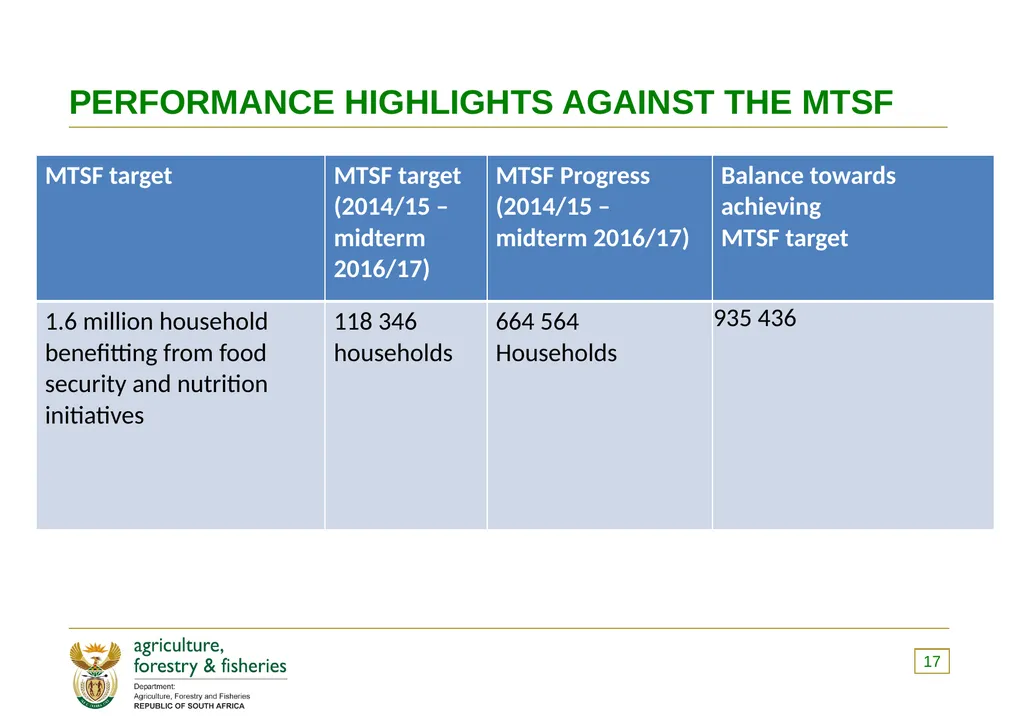
PERFORMANCE HIGHLIGHTS AGAINST THE MTSF 17<br>
18
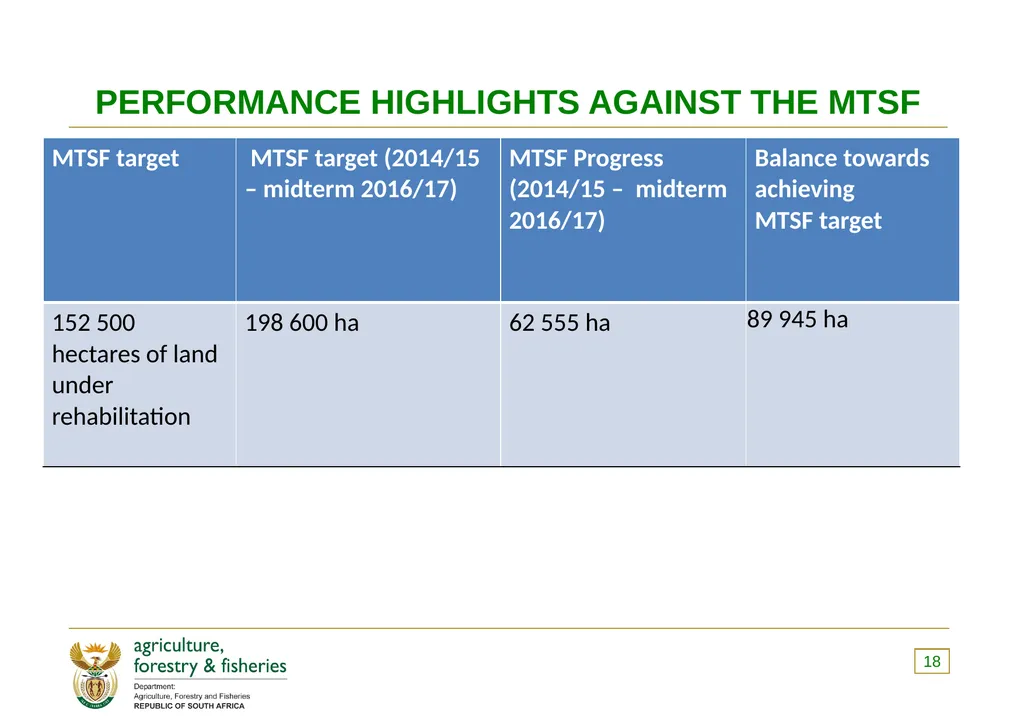
PERFORMANCE HIGHLIGHTS AGAINST THE MTSF 18<br>
19
PERFORMANCE
HIGHLIGHTS AGAINST QUARTER 2 TARGETS 19<br>
20
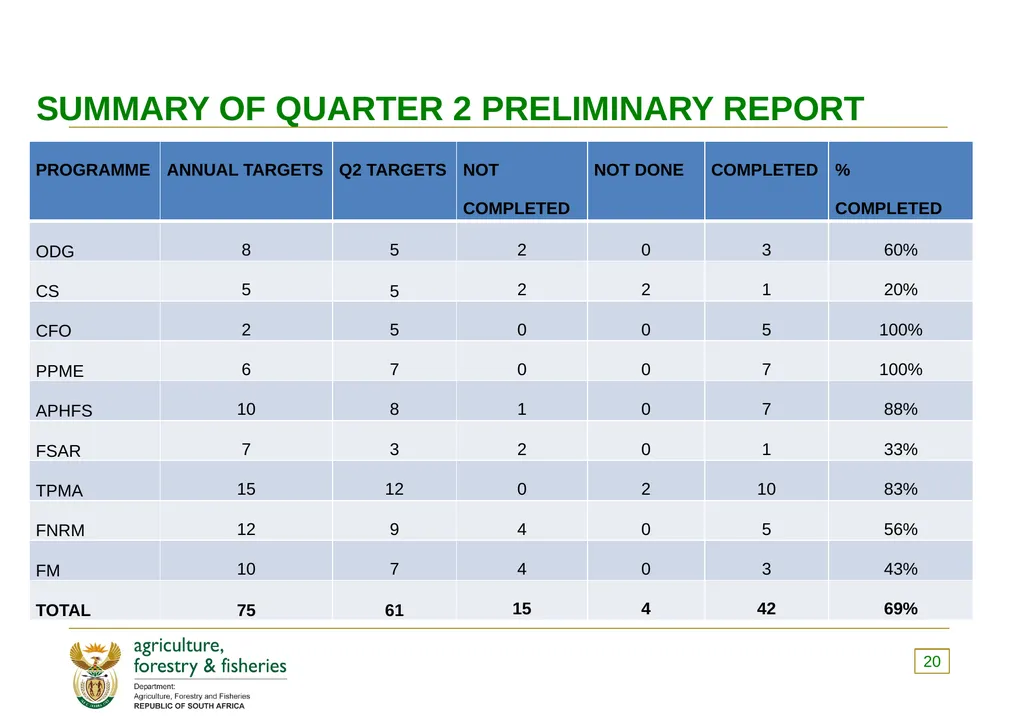
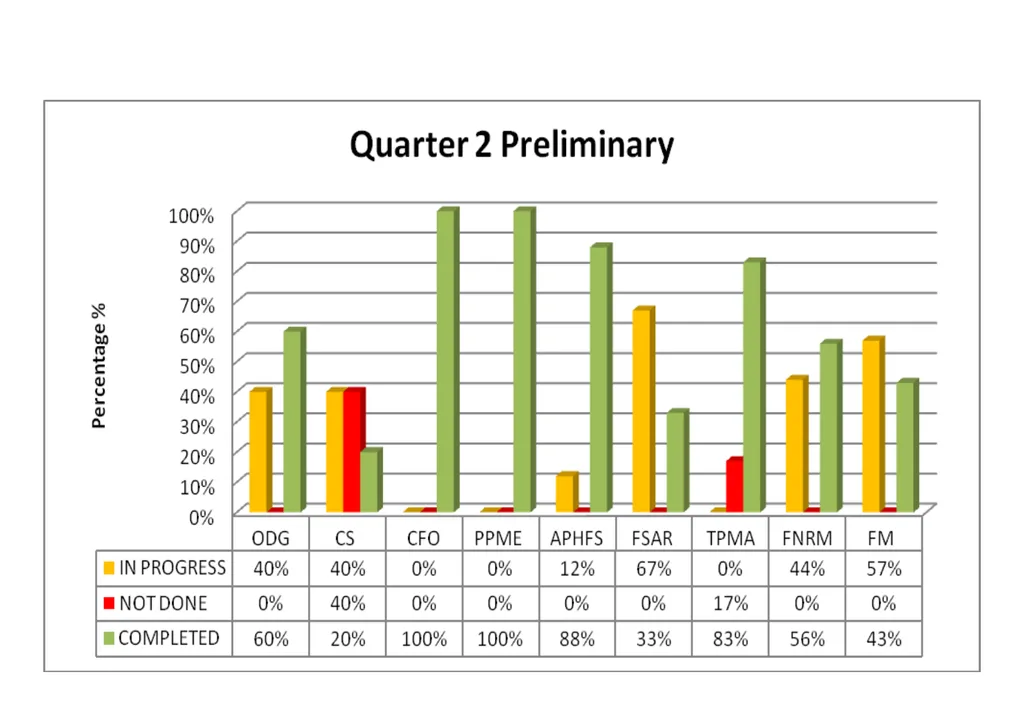
SUMMARY OF QUARTER 2 PRELIMINARY REPORT 20<br>
21
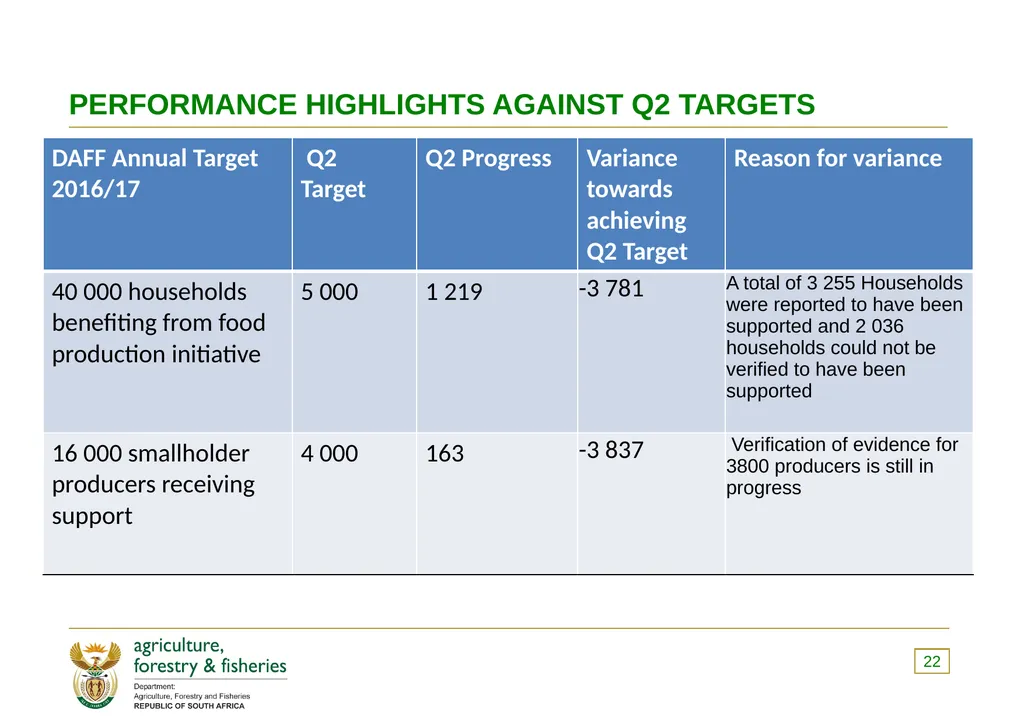
PERFORMANCE HIGHLIGHTS AGAINST Q2 TARGETS 22<br>
22
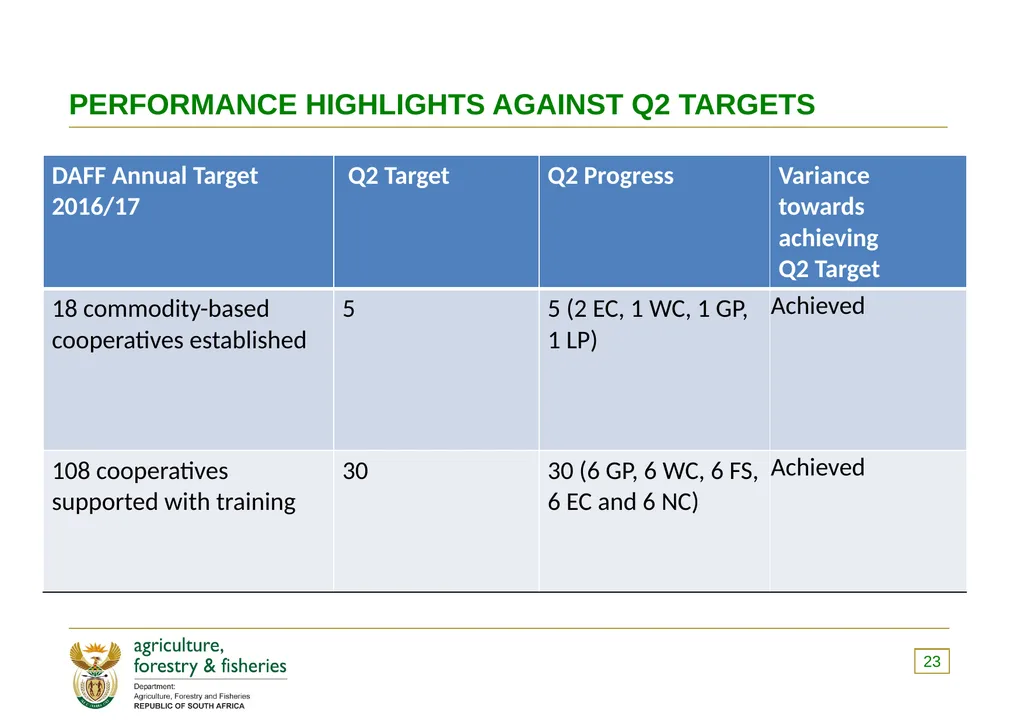
PERFORMANCE HIGHLIGHTS AGAINST Q2 TARGETS 23<br>
23
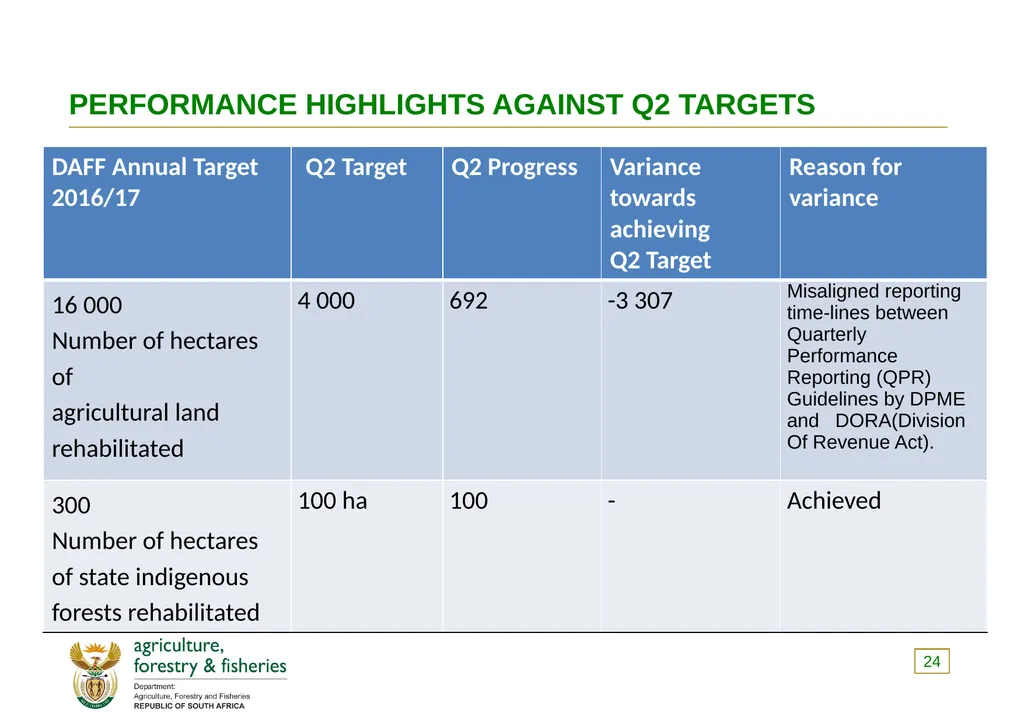
PERFORMANCE HIGHLIGHTS AGAINST Q2 TARGETS 24<br>
24
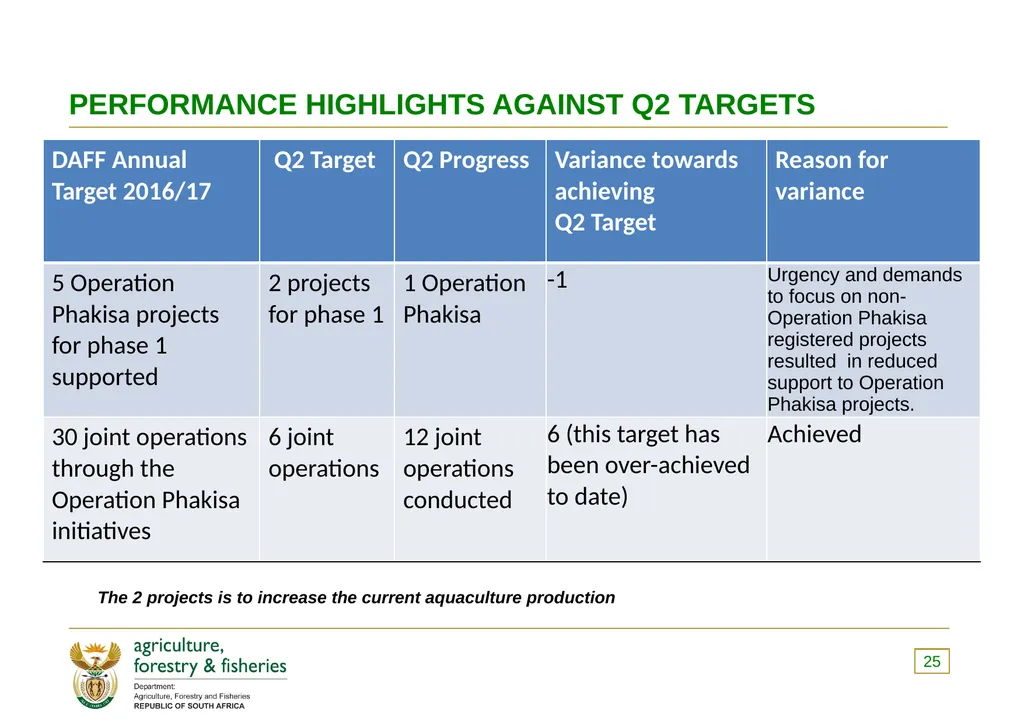
PERFORMANCE HIGHLIGHTS AGAINST Q2 TARGETS 25 The 2 projects is to increase the current aquaculture production<br>
25
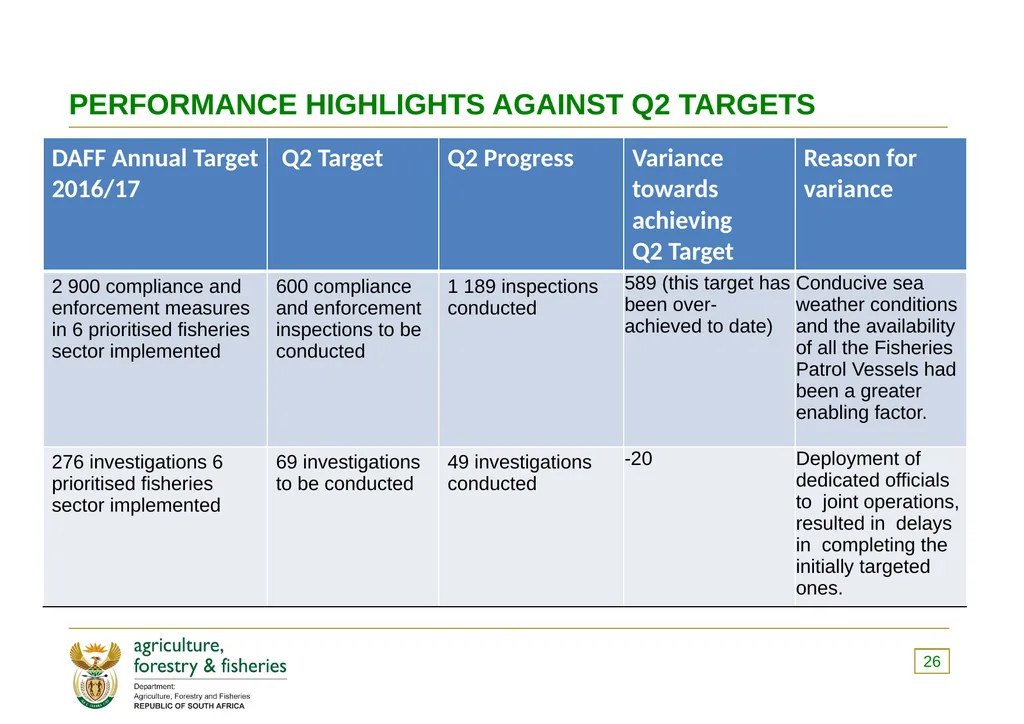
PERFORMANCE HIGHLIGHTS AGAINST Q2 TARGETS 26<br>
26
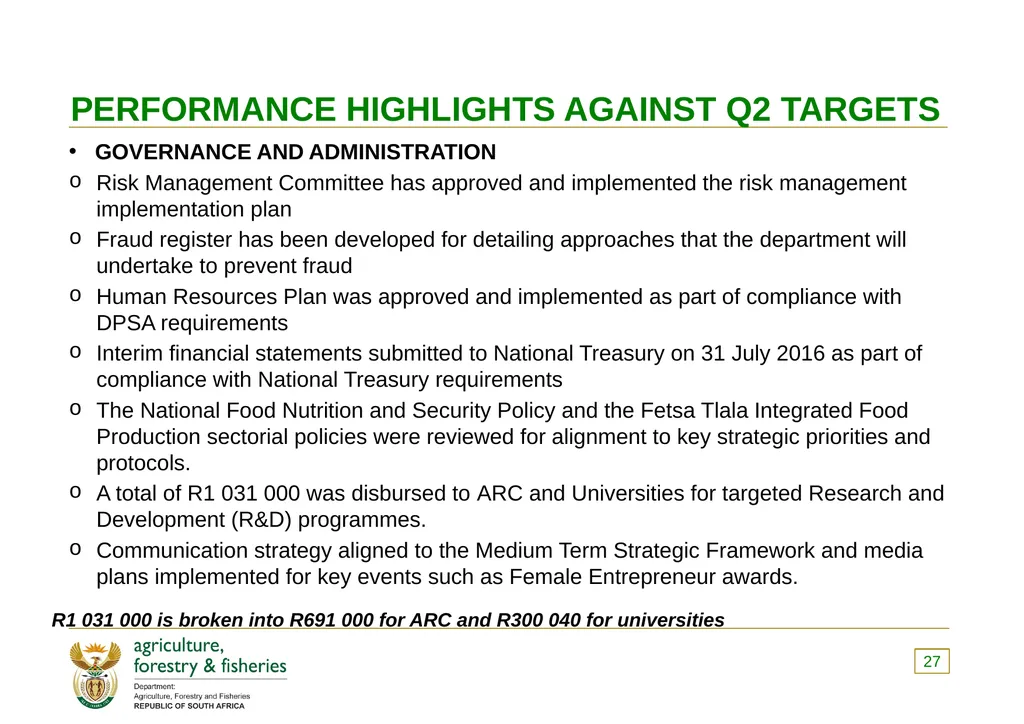
PERFORMANCE HIGHLIGHTS AGAINST Q2 TARGETS GOVERNANCE AND ADMINISTRATION
Risk Management Committee has approved and implemented the risk management implementation plan
Fraud register has been developed for detailing approaches that the department will undertake to prevent fraud
Human Resources Plan was approved and implemented as part of compliance with DPSA requirements
Interim financial statements submitted to National Treasury on 31 July 2016 as part of compliance with National Treasury requirements
The National Food Nutrition and Security Policy and the Fetsa Tlala Integrated Food Production sectorial policies were reviewed for alignment to key strategic priorities and protocols.
A total of R1 031 000 was disbursed to ARC and Universities for targeted Research and Development (R&D) programmes.
Communication strategy aligned to the Medium Term Strategic Framework and media plans implemented for key events such as Female Entrepreneur awards. 27 R1 031 000 is broken into R691 000 for ARC and R300 040 for universities<br>
Risk Management Committee has approved and implemented the risk management implementation plan
Fraud register has been developed for detailing approaches that the department will undertake to prevent fraud
Human Resources Plan was approved and implemented as part of compliance with DPSA requirements
Interim financial statements submitted to National Treasury on 31 July 2016 as part of compliance with National Treasury requirements
The National Food Nutrition and Security Policy and the Fetsa Tlala Integrated Food Production sectorial policies were reviewed for alignment to key strategic priorities and protocols.
A total of R1 031 000 was disbursed to ARC and Universities for targeted Research and Development (R&D) programmes.
Communication strategy aligned to the Medium Term Strategic Framework and media plans implemented for key events such as Female Entrepreneur awards. 27 R1 031 000 is broken into R691 000 for ARC and R300 040 for universities<br>
27
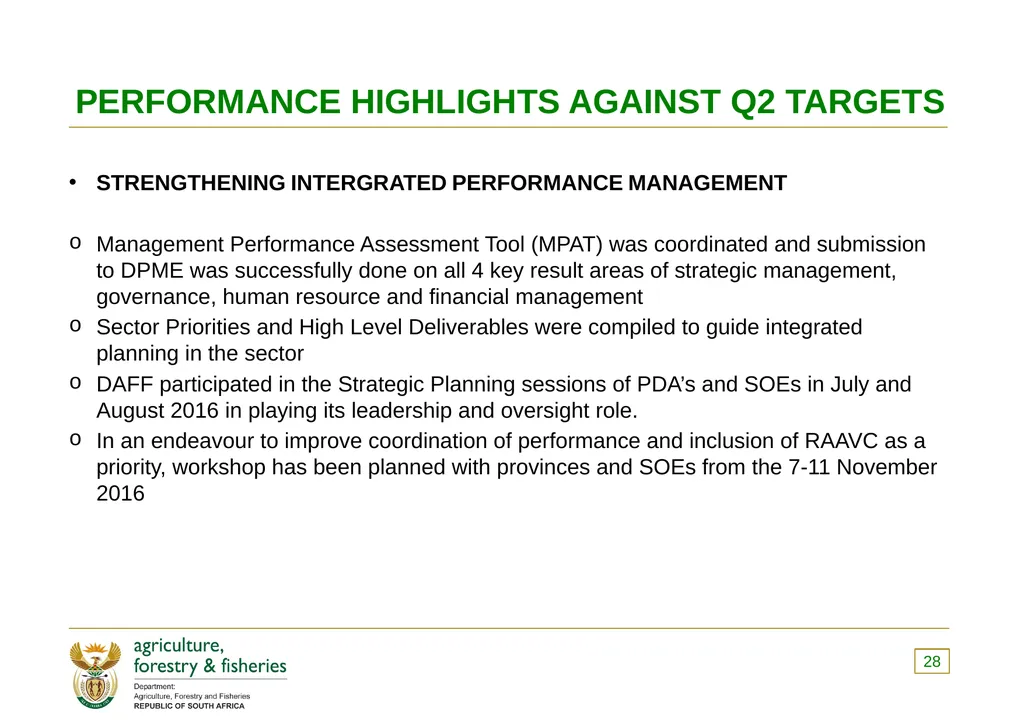
PERFORMANCE HIGHLIGHTS AGAINST Q2 TARGETS STRENGTHENING INTERGRATED PERFORMANCE MANAGEMENT
Management Performance Assessment Tool (MPAT) was coordinated and submission to DPME was successfully done on all 4 key result areas of strategic management, governance, human resource and financial management
Sector Priorities and High Level Deliverables were compiled to guide integrated planning in the sector
DAFF participated in the Strategic Planning sessions of PDA’s and SOEs in July and August 2016 in playing its leadership and oversight role.
In an endeavour to improve coordination of performance and inclusion of RAAVC as a priority, workshop has been planned with provinces and SOEs from the 7-11 November 2016 28<br>
Management Performance Assessment Tool (MPAT) was coordinated and submission to DPME was successfully done on all 4 key result areas of strategic management, governance, human resource and financial management
Sector Priorities and High Level Deliverables were compiled to guide integrated planning in the sector
DAFF participated in the Strategic Planning sessions of PDA’s and SOEs in July and August 2016 in playing its leadership and oversight role.
In an endeavour to improve coordination of performance and inclusion of RAAVC as a priority, workshop has been planned with provinces and SOEs from the 7-11 November 2016 28<br>
28
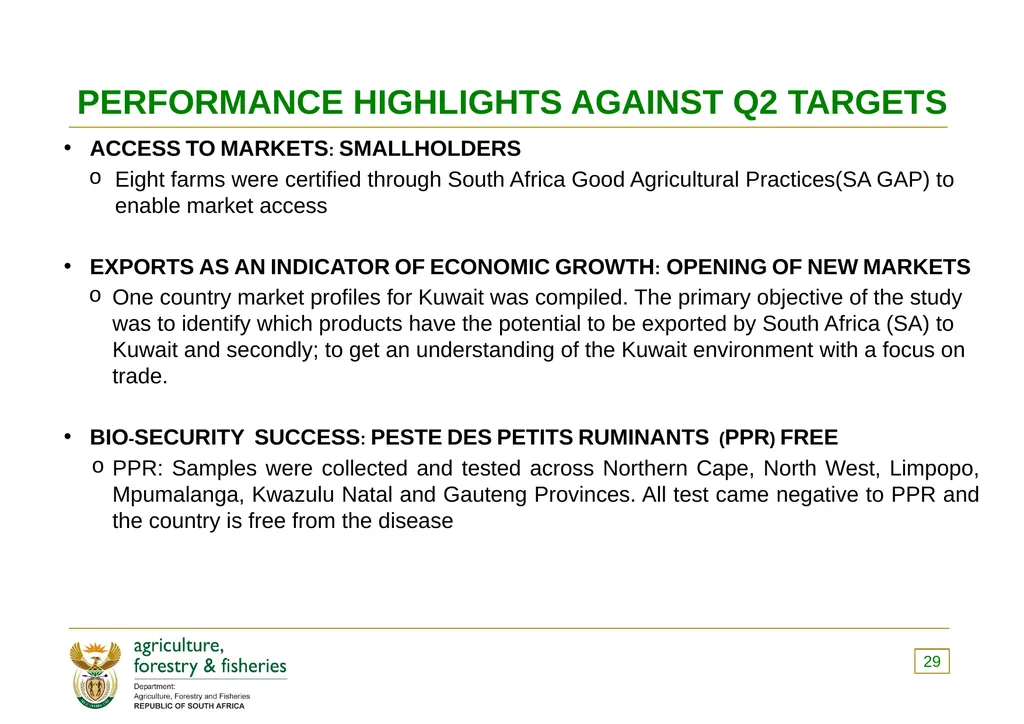
PERFORMANCE HIGHLIGHTS AGAINST Q2 TARGETS ACCESS TO MARKETS: SMALLHOLDERS
Eight farms were certified through South Africa Good Agricultural Practices(SA GAP) to enable market access
EXPORTS AS AN INDICATOR OF ECONOMIC GROWTH: OPENING OF NEW MARKETS
One country market profiles for Kuwait was compiled. The primary objective of the study was to identify which products have the potential to be exported by South Africa (SA) to Kuwait and secondly; to get an understanding of the Kuwait environment with a focus on trade.
BIO-SECURITY SUCCESS: PESTE DES PETITS RUMINANTS (PPR) FREE
PPR: Samples were collected and tested across Northern Cape, North West, Limpopo, Mpumalanga, Kwazulu Natal and Gauteng Provinces. All test came negative to PPR and the country is free from the disease 29<br>
Eight farms were certified through South Africa Good Agricultural Practices(SA GAP) to enable market access
EXPORTS AS AN INDICATOR OF ECONOMIC GROWTH: OPENING OF NEW MARKETS
One country market profiles for Kuwait was compiled. The primary objective of the study was to identify which products have the potential to be exported by South Africa (SA) to Kuwait and secondly; to get an understanding of the Kuwait environment with a focus on trade.
BIO-SECURITY SUCCESS: PESTE DES PETITS RUMINANTS (PPR) FREE
PPR: Samples were collected and tested across Northern Cape, North West, Limpopo, Mpumalanga, Kwazulu Natal and Gauteng Provinces. All test came negative to PPR and the country is free from the disease 29<br>
29
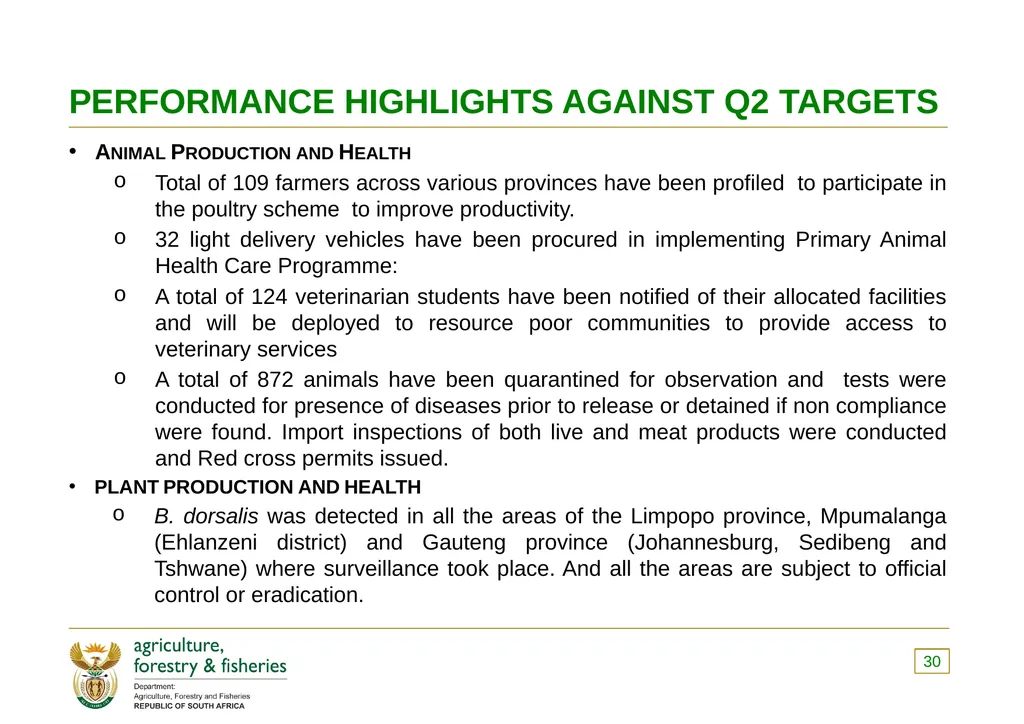
PERFORMANCE HIGHLIGHTS AGAINST Q2 TARGETS Animal Production and Health
Total of 109 farmers across various provinces have been profiled to participate in the poultry scheme to improve productivity.
32 light delivery vehicles have been procured in implementing Primary Animal Health Care Programme:
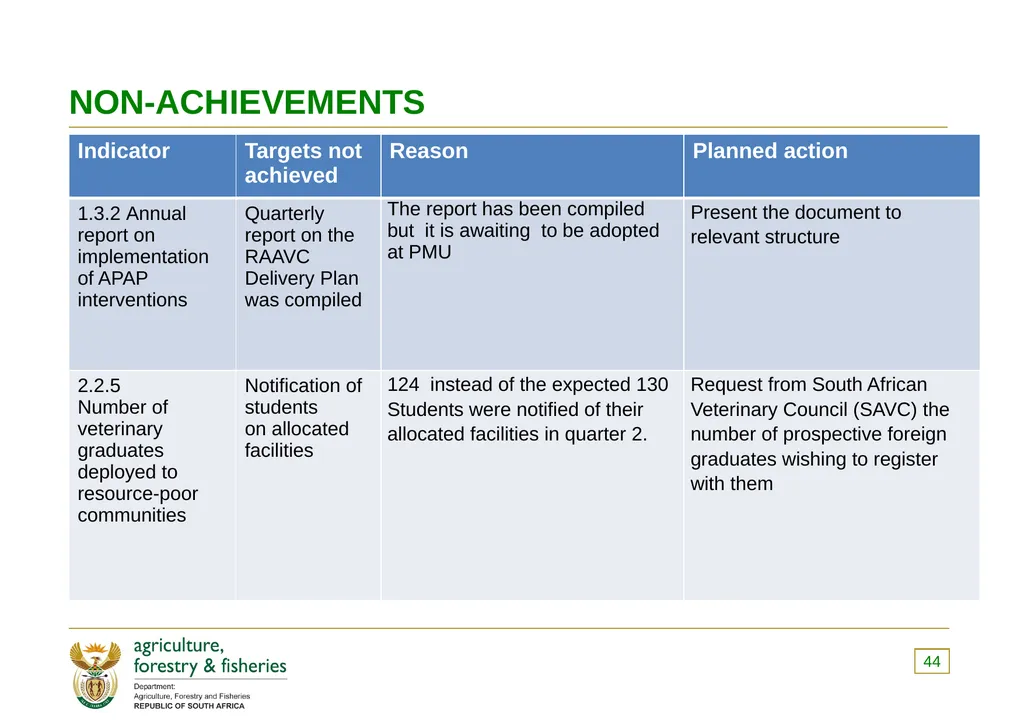
A total of 124 veterinarian students have been notified of their allocated facilities and will be deployed to resource poor communities to provide access to veterinary services
A total of 872 animals have been quarantined for observation and tests were conducted for presence of diseases prior to release or detained if non compliance were found. Import inspections of both live and meat products were conducted and Red cross permits issued.
PLANT PRODUCTION AND HEALTH
B. dorsalis was detected in all the areas of the Limpopo province, Mpumalanga (Ehlanzeni district) and Gauteng province (Johannesburg, Sedibeng and Tshwane) where surveillance took place. And all the areas are subject to official control or eradication. 30<br>
Total of 109 farmers across various provinces have been profiled to participate in the poultry scheme to improve productivity.
32 light delivery vehicles have been procured in implementing Primary Animal Health Care Programme:
A total of 124 veterinarian students have been notified of their allocated facilities and will be deployed to resource poor communities to provide access to veterinary services
A total of 872 animals have been quarantined for observation and tests were conducted for presence of diseases prior to release or detained if non compliance were found. Import inspections of both live and meat products were conducted and Red cross permits issued.
PLANT PRODUCTION AND HEALTH
B. dorsalis was detected in all the areas of the Limpopo province, Mpumalanga (Ehlanzeni district) and Gauteng province (Johannesburg, Sedibeng and Tshwane) where surveillance took place. And all the areas are subject to official control or eradication. 30<br>
30
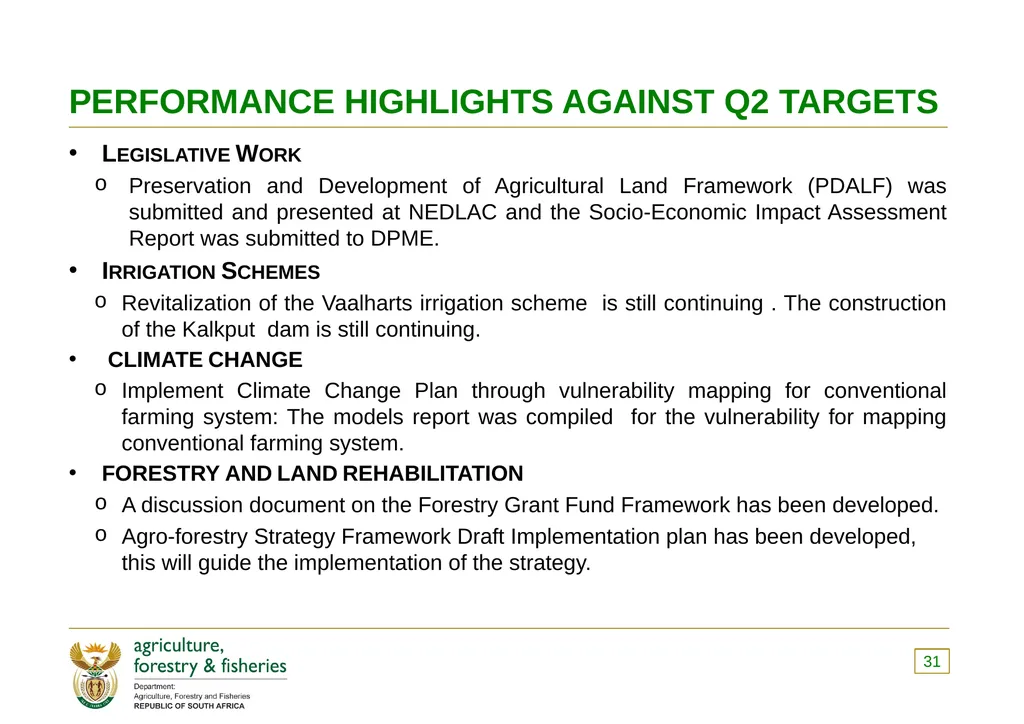
PERFORMANCE HIGHLIGHTS AGAINST Q2 TARGETS Legislative Work
Preservation and Development of Agricultural Land Framework (PDALF) was submitted and presented at NEDLAC and the Socio-Economic Impact Assessment Report was submitted to DPME.
Irrigation Schemes
Revitalization of the Vaalharts irrigation scheme is still continuing . The construction of the Kalkput dam is still continuing.
CLIMATE CHANGE
Implement Climate Change Plan through vulnerability mapping for conventional farming system: The models report was compiled for the vulnerability for mapping conventional farming system.
FORESTRY AND LAND REHABILITATION
A discussion document on the Forestry Grant Fund Framework has been developed.
Agro-forestry Strategy Framework Draft Implementation plan has been developed, this will guide the implementation of the strategy. 31<br>
Preservation and Development of Agricultural Land Framework (PDALF) was submitted and presented at NEDLAC and the Socio-Economic Impact Assessment Report was submitted to DPME.
Irrigation Schemes
Revitalization of the Vaalharts irrigation scheme is still continuing . The construction of the Kalkput dam is still continuing.
CLIMATE CHANGE
Implement Climate Change Plan through vulnerability mapping for conventional farming system: The models report was compiled for the vulnerability for mapping conventional farming system.
FORESTRY AND LAND REHABILITATION
A discussion document on the Forestry Grant Fund Framework has been developed.
Agro-forestry Strategy Framework Draft Implementation plan has been developed, this will guide the implementation of the strategy. 31<br>
31
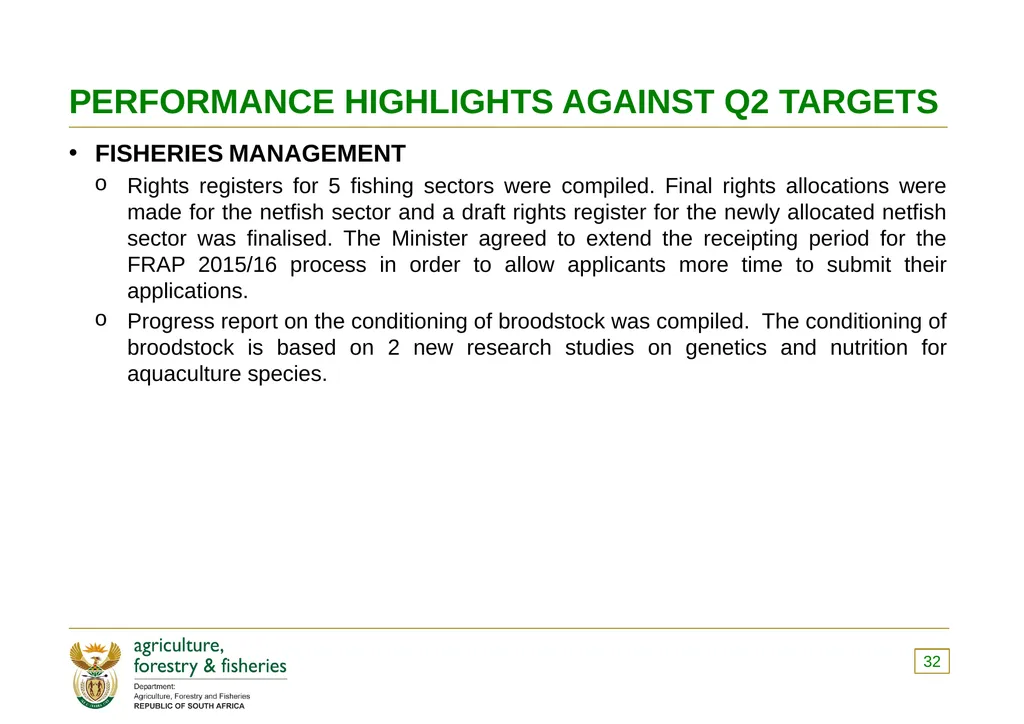
PERFORMANCE HIGHLIGHTS AGAINST Q2 TARGETS FISHERIES MANAGEMENT
Rights registers for 5 fishing sectors were compiled. Final rights allocations were made for the netfish sector and a draft rights register for the newly allocated netfish sector was finalised. The Minister agreed to extend the receipting period for the FRAP 2015/16 process in order to allow applicants more time to submit their applications.
Progress report on the conditioning of broodstock was compiled. The conditioning of broodstock is based on 2 new research studies on genetics and nutrition for aquaculture species. 32<br>
Rights registers for 5 fishing sectors were compiled. Final rights allocations were made for the netfish sector and a draft rights register for the newly allocated netfish sector was finalised. The Minister agreed to extend the receipting period for the FRAP 2015/16 process in order to allow applicants more time to submit their applications.
Progress report on the conditioning of broodstock was compiled. The conditioning of broodstock is based on 2 new research studies on genetics and nutrition for aquaculture species. 32<br>
32
DAFF MIDTERM PERFORMANCE 33<br>
33
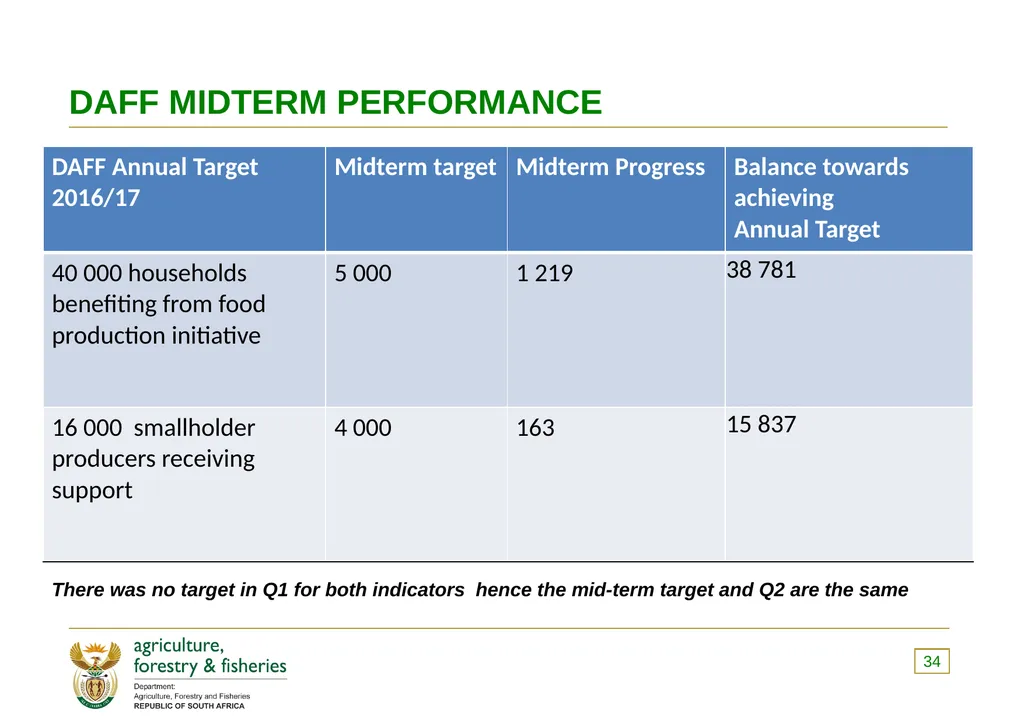
DAFF MIDTERM PERFORMANCE 34 There was no target in Q1 for both indicators hence the mid-term target and Q2 are the same<br>
34
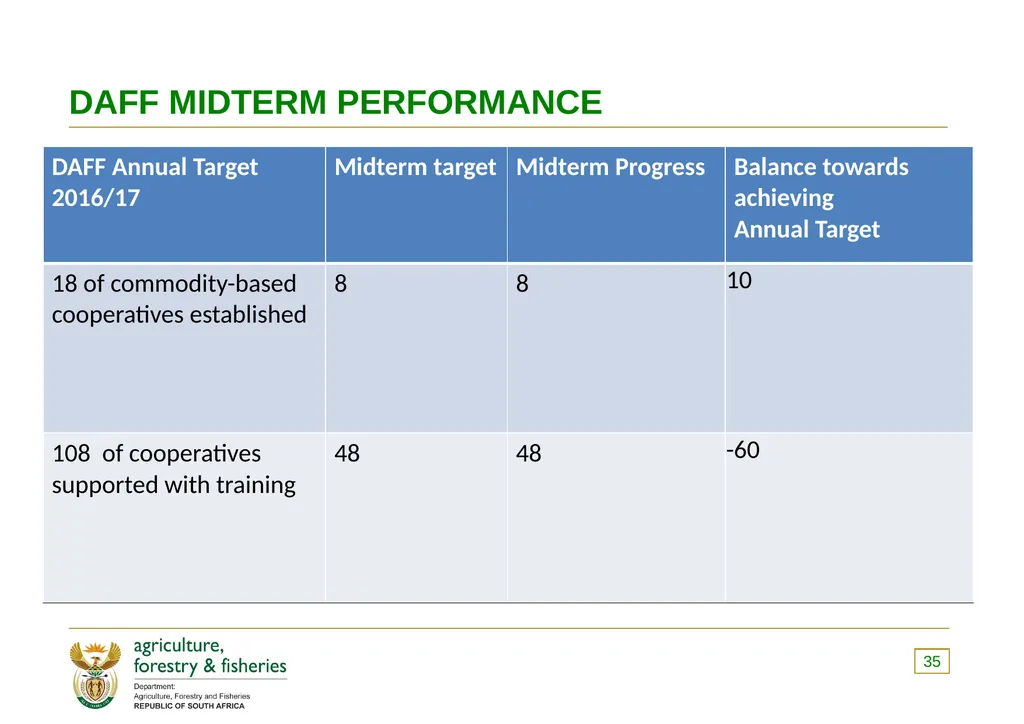
DAFF MIDTERM PERFORMANCE 35<br>
35
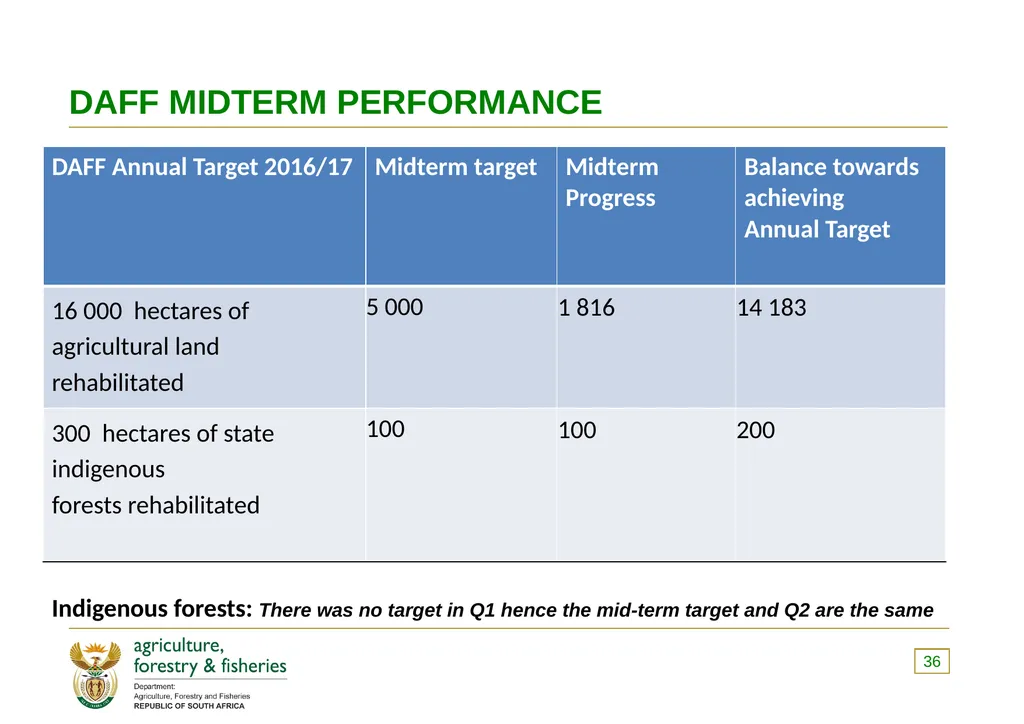
DAFF MIDTERM PERFORMANCE 36 Indigenous forests: There was no target in Q1 hence the mid-term target and Q2 are the same<br>
36
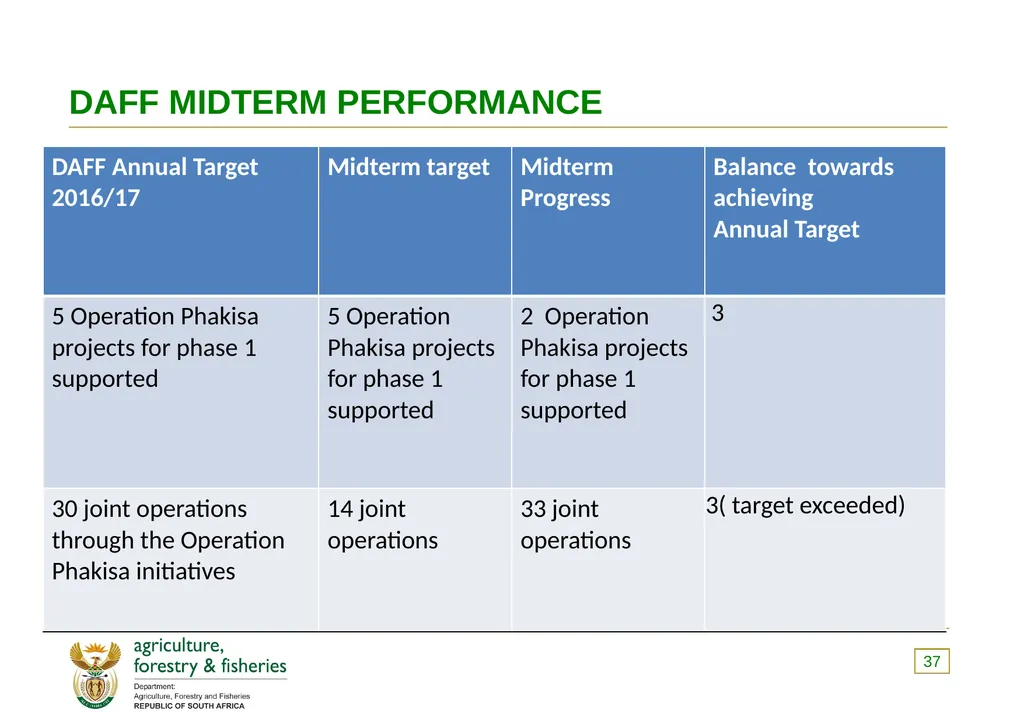
DAFF MIDTERM PERFORMANCE 37<br>
37
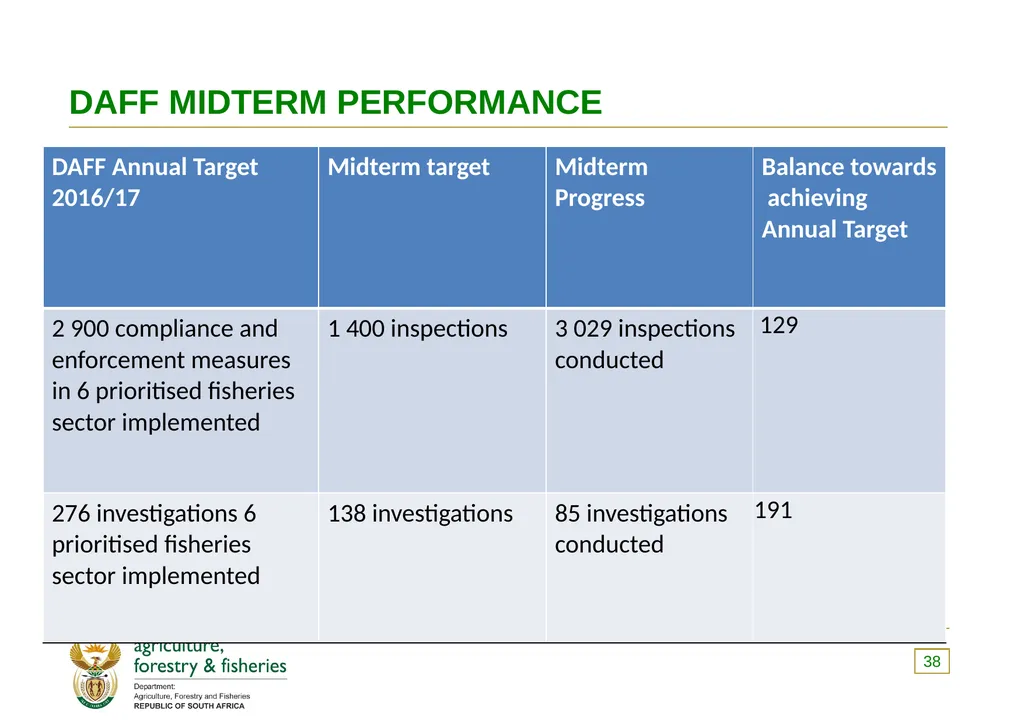
DAFF MIDTERM PERFORMANCE 38<br>
38
Q2 NON -ACHIEVEMENTS 39<br>
39
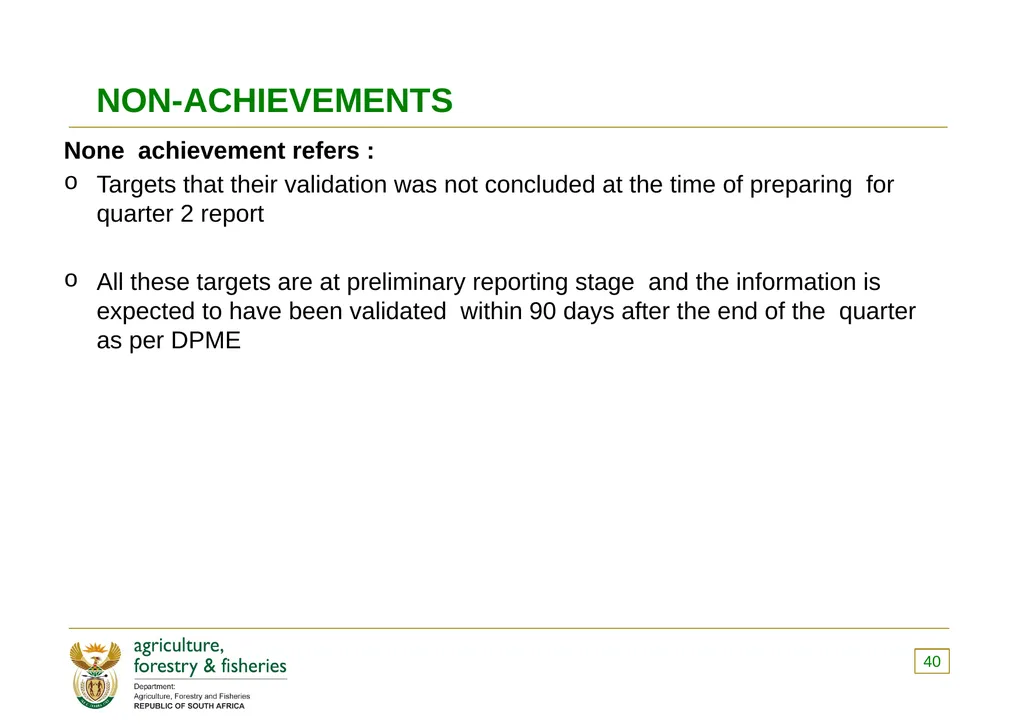
NON-ACHIEVEMENTS None achievement refers :
Targets that their validation was not concluded at the time of preparing for quarter 2 report
All these targets are at preliminary reporting stage and the information is expected to have been validated within 90 days after the end of the quarter as per DPME 40<br>
Targets that their validation was not concluded at the time of preparing for quarter 2 report
All these targets are at preliminary reporting stage and the information is expected to have been validated within 90 days after the end of the quarter as per DPME 40<br>
40
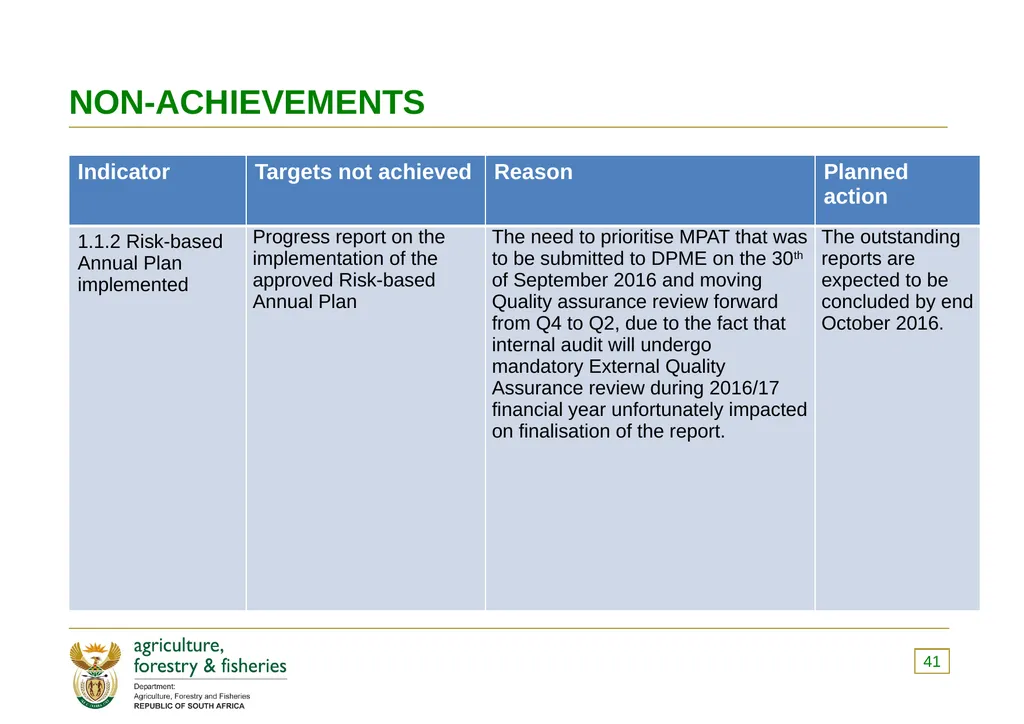
NON-ACHIEVEMENTS 41<br>
41
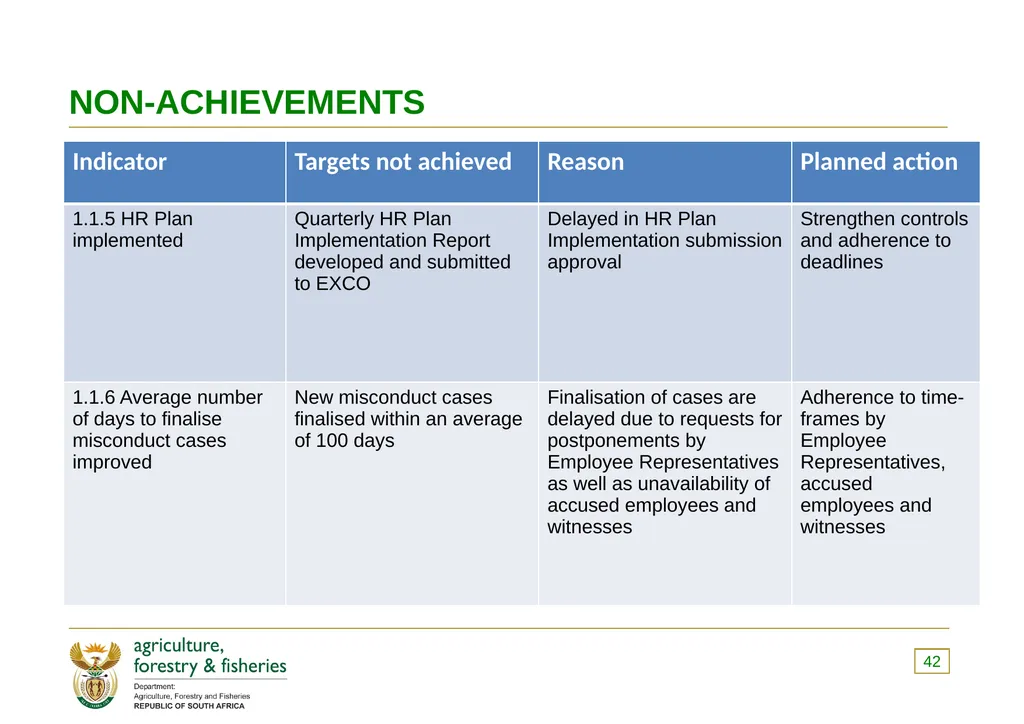
NON-ACHIEVEMENTS 42<br>
42
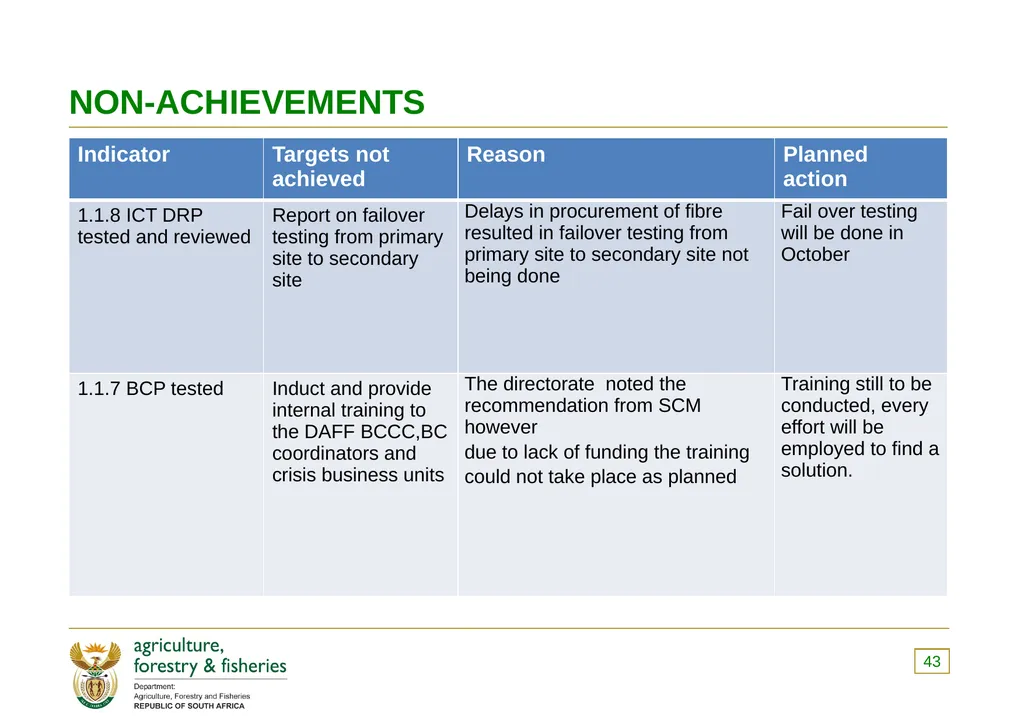
NON-ACHIEVEMENTS 43<br>
43
NON-ACHIEVEMENTS 44<br>
44
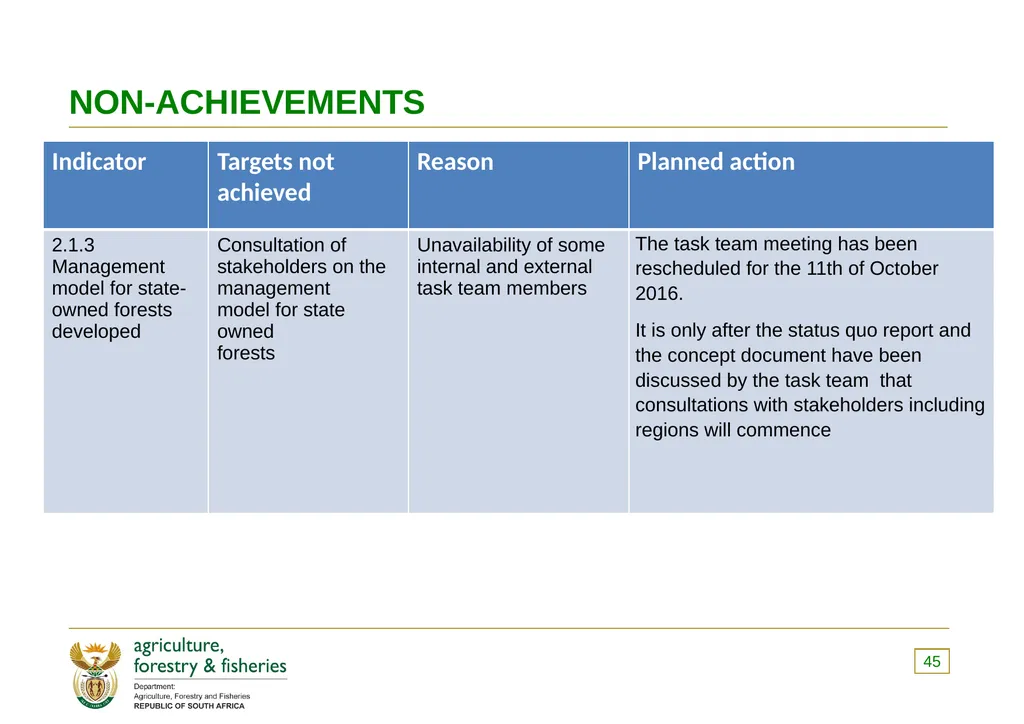
NON-ACHIEVEMENTS 45<br>
45
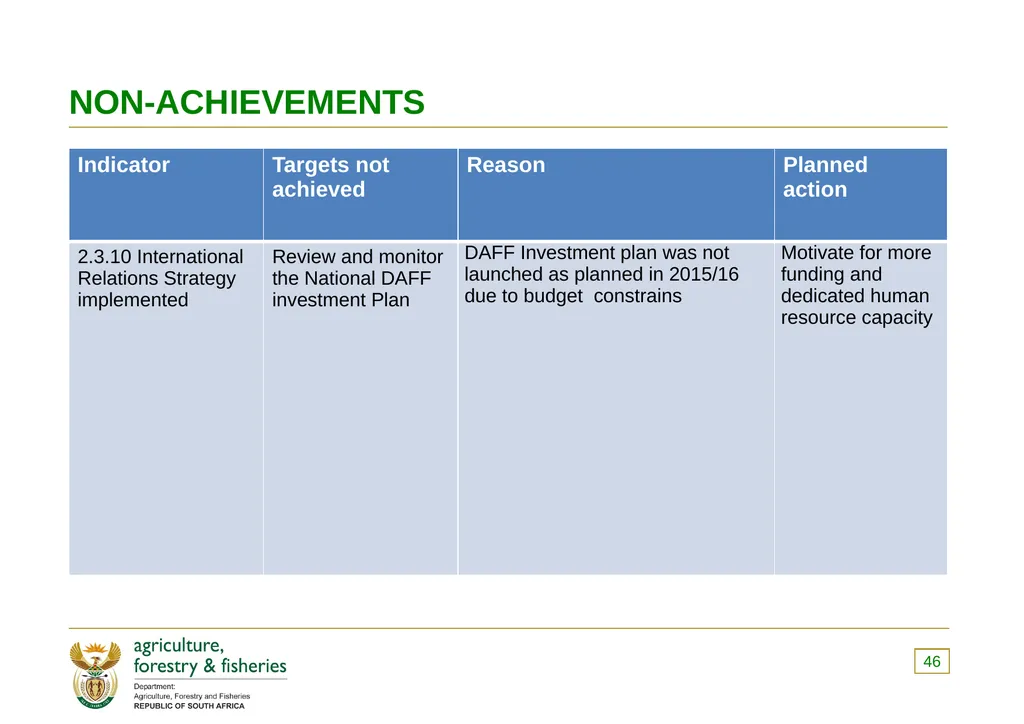
NON-ACHIEVEMENTS 46<br>
46
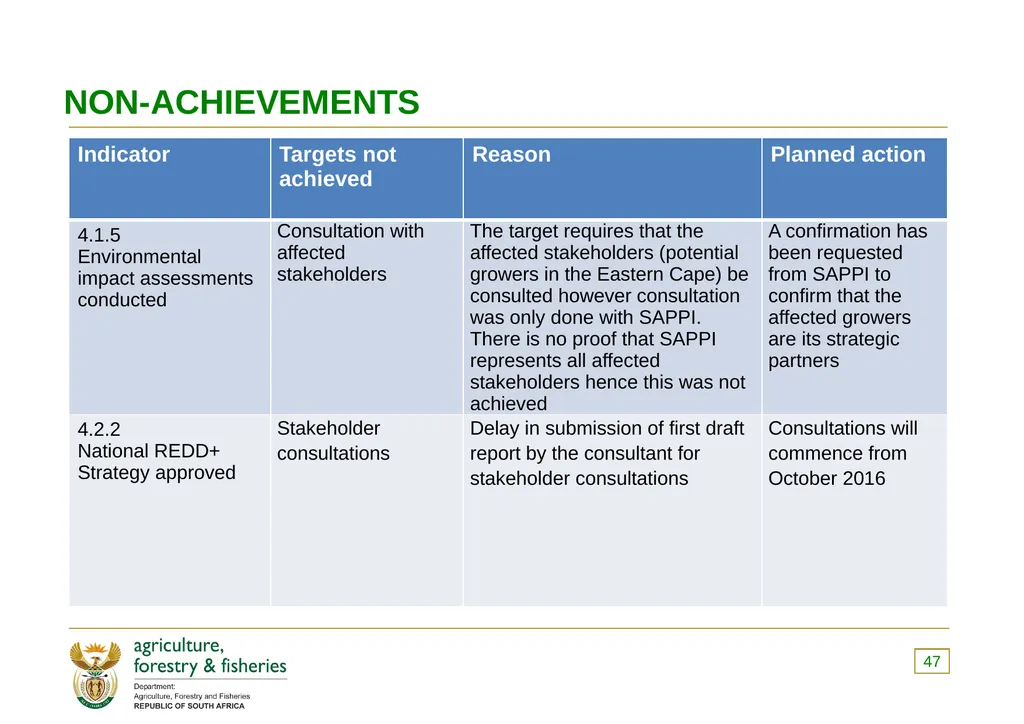
NON-ACHIEVEMENTS 47<br>
47
HUMAN
RESOURCES 48<br>
48
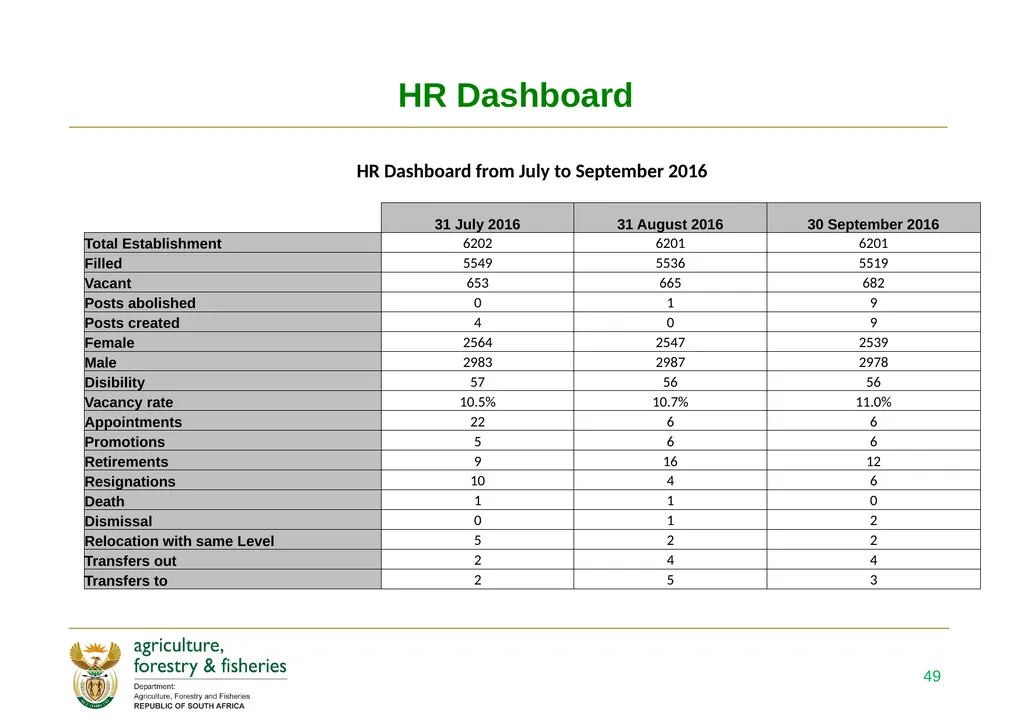
HR Dashboard 49<br>
49
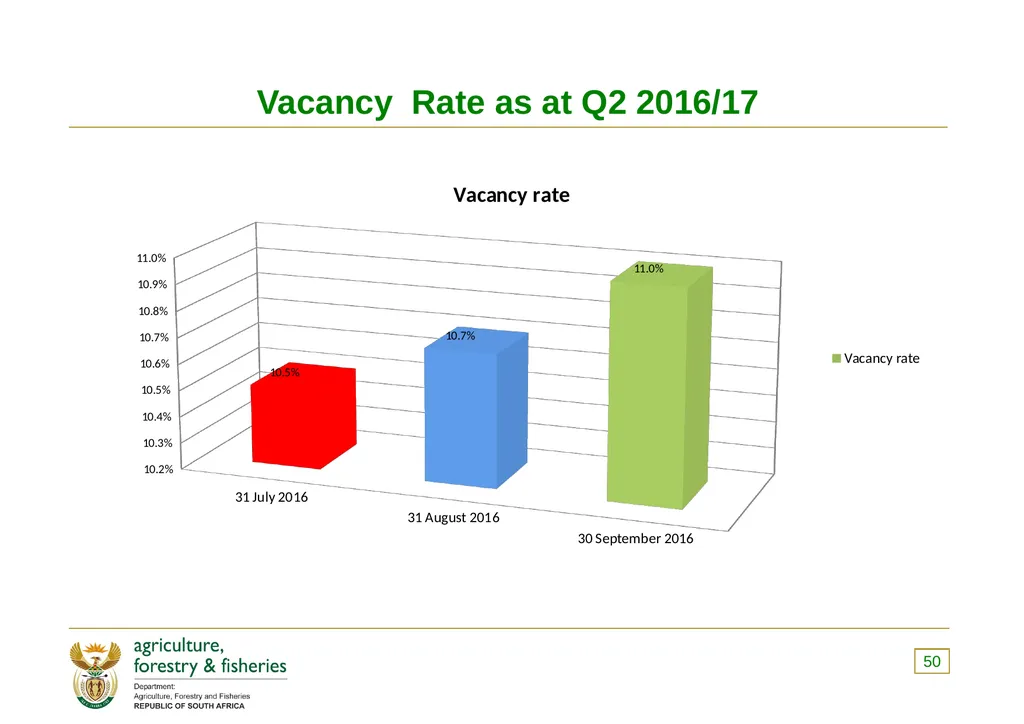
Vacancy Rate as at Q2 2016/17 50<br>
50
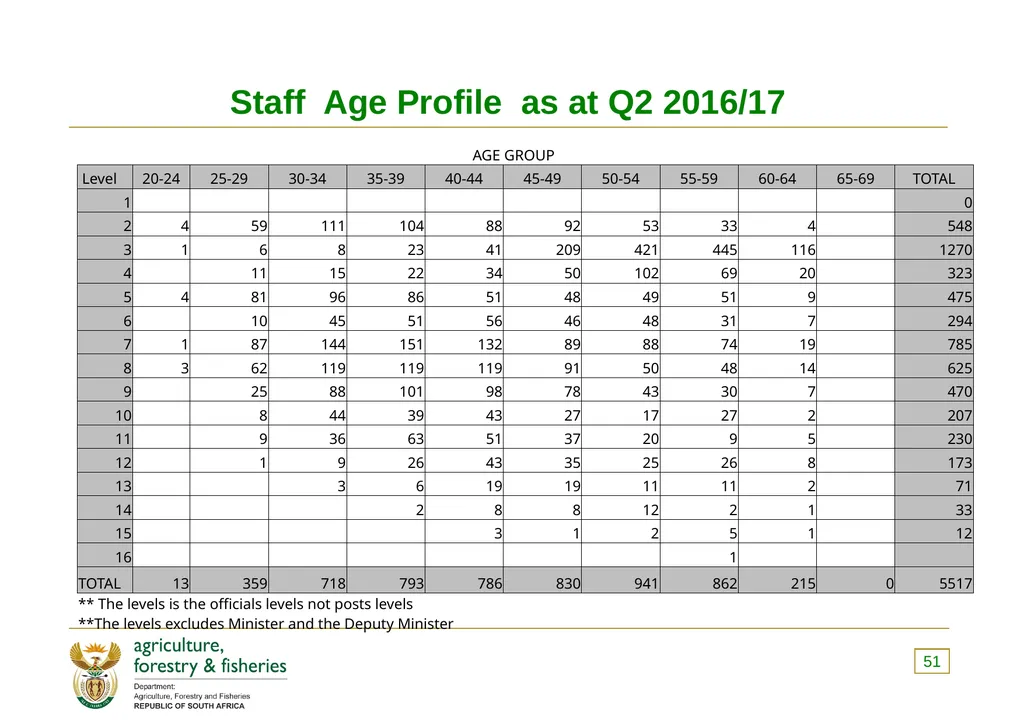
Staff Age Profile as at Q2 2016/17 51<br>
51
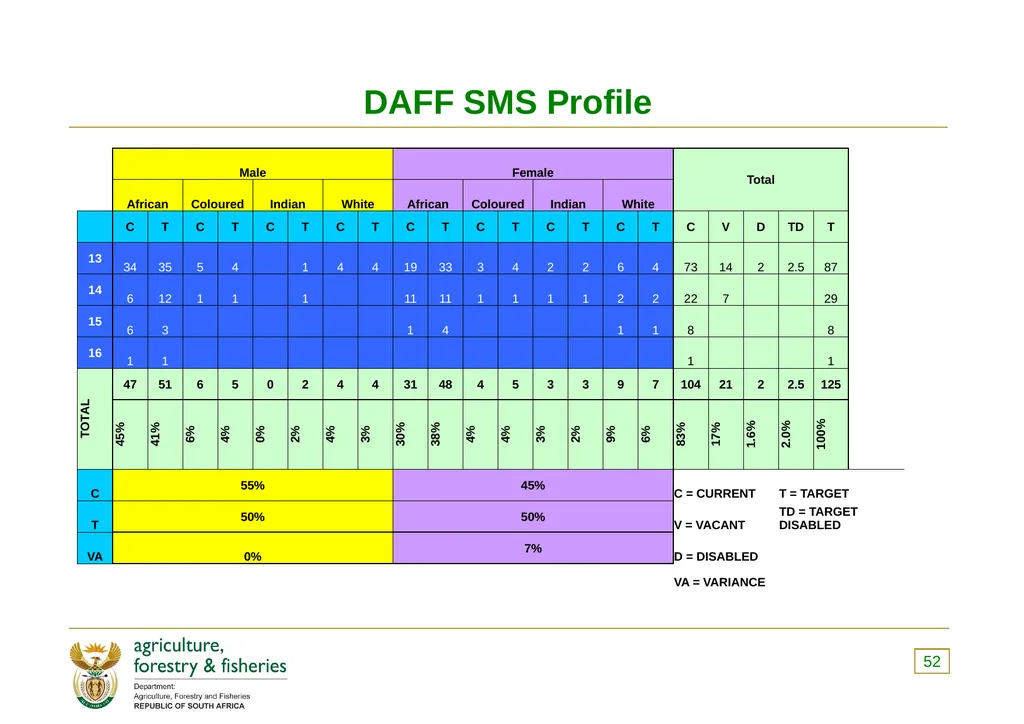
DAFF SMS Profile 52<br>
52
EXPENDITURE TRENDS: QUARTER 2 53<br>
53
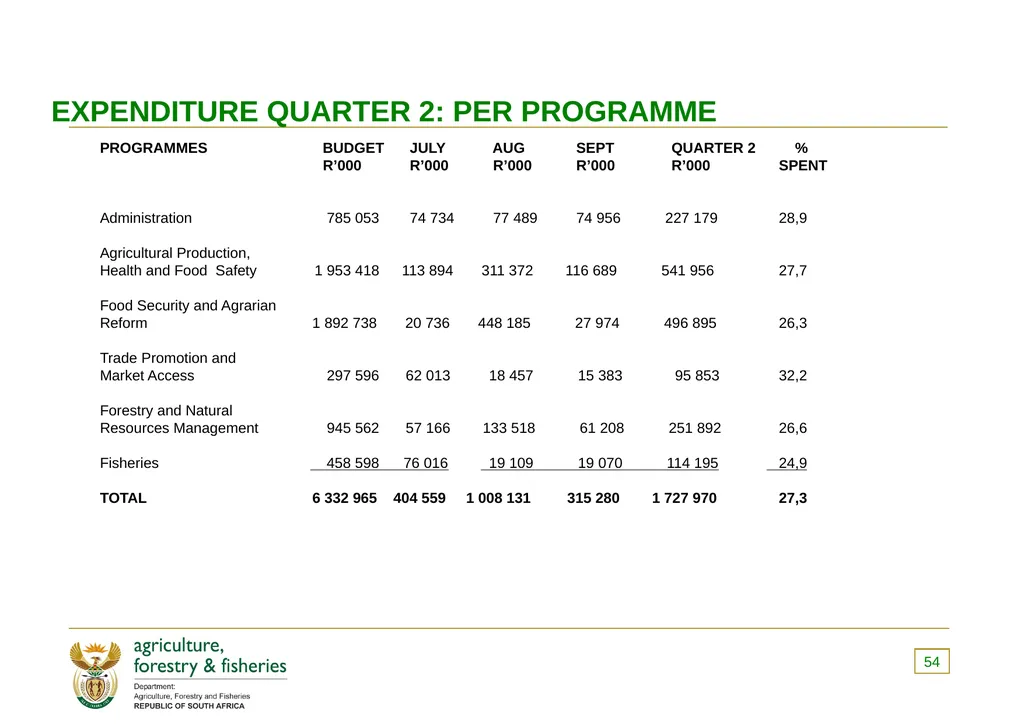
EXPENDITURE QUARTER 2: PER PROGRAMME 54 PROGRAMMES BUDGET JULY AUG SEPT QUARTER 2 %
R’000 R’000 R’000 R’000 R’000 SPENT
Administration 785 053 74 734 77 489 74 956 227 179 28,9
Agricultural Production,
Health and Food Safety 1 953 418 113 894 311 372 116 689 541 956 27,7
Food Security and Agrarian
Reform 1 892 738 20 736 448 185 27 974 496 895 26,3
Trade Promotion and
Market Access 297 596 62 013 18 457 15 383 95 853 32,2
Forestry and Natural
Resources Management 945 562 57 166 133 518 61 208 251 892 26,6
Fisheries 458 598 76 016 19 109 19 070 114 195 24,9
TOTAL 6 332 965 404 559 1 008 131 315 280 1 727 970 27,3<br>
R’000 R’000 R’000 R’000 R’000 SPENT
Administration 785 053 74 734 77 489 74 956 227 179 28,9
Agricultural Production,
Health and Food Safety 1 953 418 113 894 311 372 116 689 541 956 27,7
Food Security and Agrarian
Reform 1 892 738 20 736 448 185 27 974 496 895 26,3
Trade Promotion and
Market Access 297 596 62 013 18 457 15 383 95 853 32,2
Forestry and Natural
Resources Management 945 562 57 166 133 518 61 208 251 892 26,6
Fisheries 458 598 76 016 19 109 19 070 114 195 24,9
TOTAL 6 332 965 404 559 1 008 131 315 280 1 727 970 27,3<br>
54
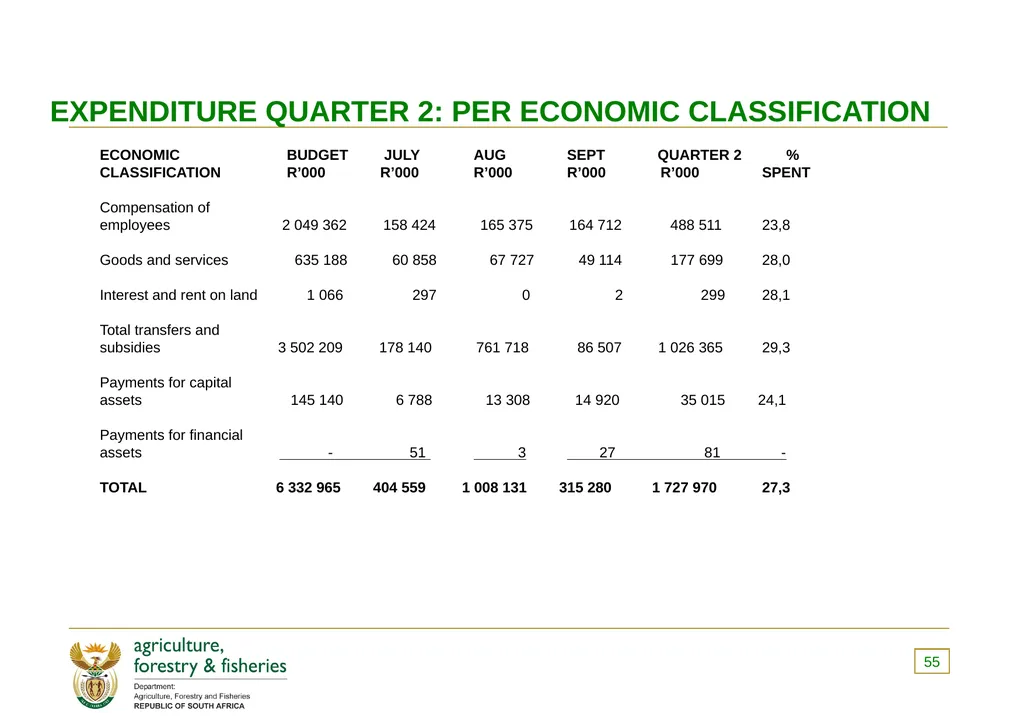
EXPENDITURE QUARTER 2: PER ECONOMIC CLASSIFICATION 55 ECONOMIC BUDGET JULY AUG SEPT QUARTER 2 %
CLASSIFICATION R’000 R’000 R’000 R’000 R’000 SPENT
Compensation of
employees 2 049 362 158 424 165 375 164 712 488 511 23,8
Goods and services 635 188 60 858 67 727 49 114 177 699 28,0
Interest and rent on land 1 066 297 0 2 299 28,1
Total transfers and
subsidies 3 502 209 178 140 761 718 86 507 1 026 365 29,3
Payments for capital
assets 145 140 6 788 13 308 14 920 35 015 24,1
Payments for financial
assets - 51 3 27 81 -
TOTAL 6 332 965 404 559 1 008 131 315 280 1 727 970 27,3<br>
CLASSIFICATION R’000 R’000 R’000 R’000 R’000 SPENT
Compensation of
employees 2 049 362 158 424 165 375 164 712 488 511 23,8
Goods and services 635 188 60 858 67 727 49 114 177 699 28,0
Interest and rent on land 1 066 297 0 2 299 28,1
Total transfers and
subsidies 3 502 209 178 140 761 718 86 507 1 026 365 29,3
Payments for capital
assets 145 140 6 788 13 308 14 920 35 015 24,1
Payments for financial
assets - 51 3 27 81 -
TOTAL 6 332 965 404 559 1 008 131 315 280 1 727 970 27,3<br>
55
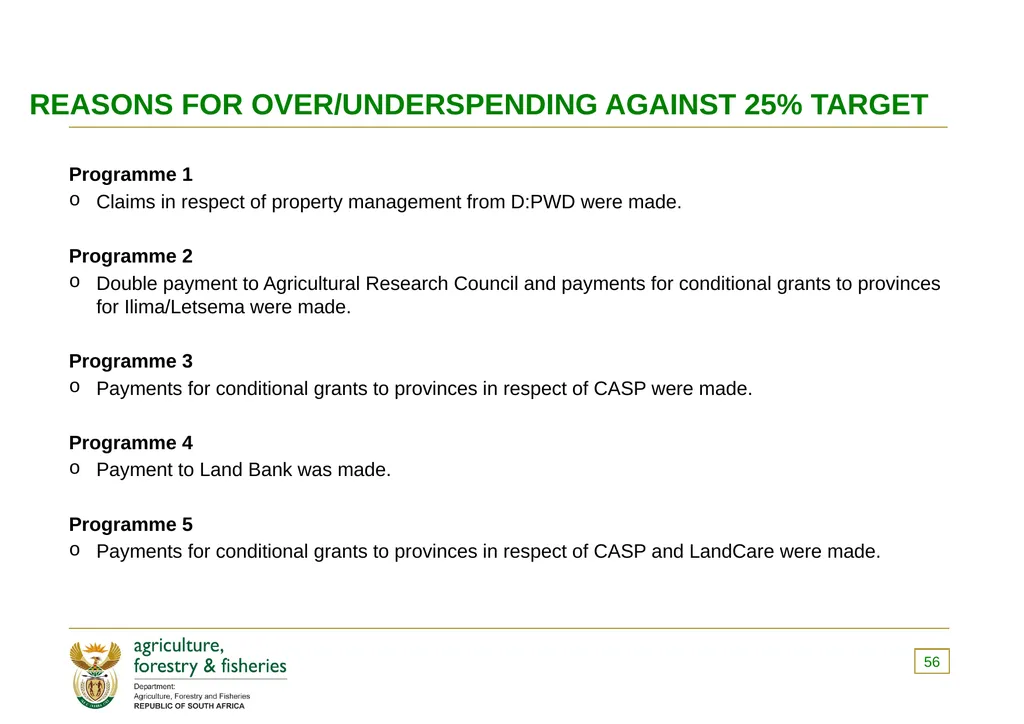
REASONS FOR OVER/UNDERSPENDING AGAINST 25% TARGET Programme 1
Claims in respect of property management from D:PWD were made.
Programme 2
Double payment to Agricultural Research Council and payments for conditional grants to provinces for Ilima/Letsema were made.
Programme 3
Payments for conditional grants to provinces in respect of CASP were made.
Programme 4
Payment to Land Bank was made.
Programme 5
Payments for conditional grants to provinces in respect of CASP and LandCare were made. 56<br>
Claims in respect of property management from D:PWD were made.
Programme 2
Double payment to Agricultural Research Council and payments for conditional grants to provinces for Ilima/Letsema were made.
Programme 3
Payments for conditional grants to provinces in respect of CASP were made.
Programme 4
Payment to Land Bank was made.
Programme 5
Payments for conditional grants to provinces in respect of CASP and LandCare were made. 56<br>
56
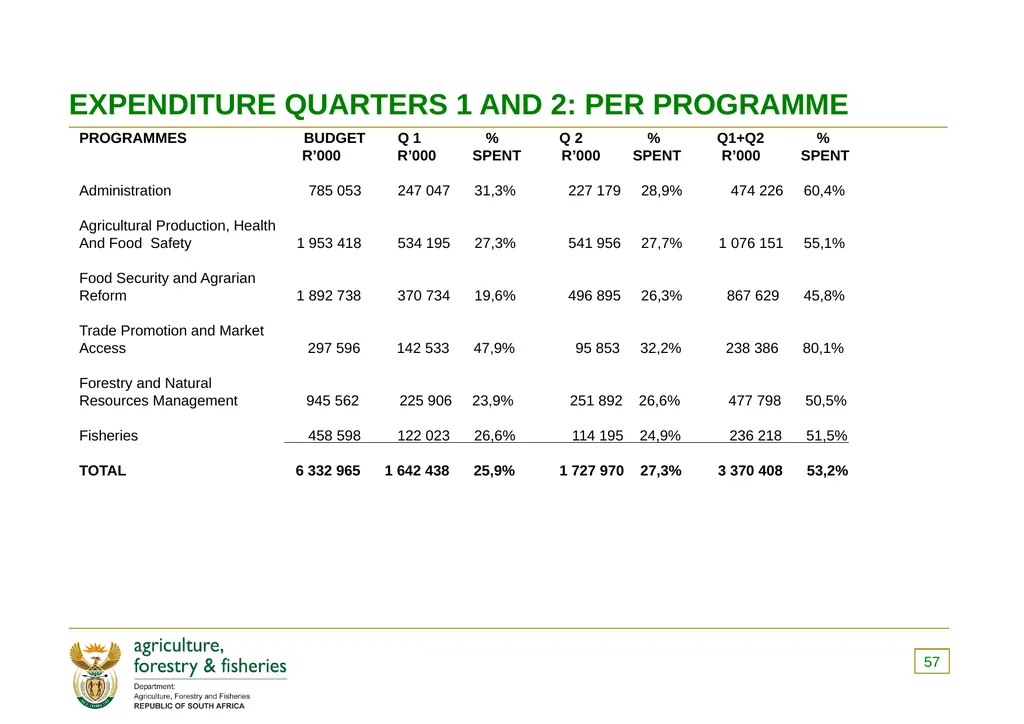
57 EXPENDITURE QUARTERS 1 AND 2: PER PROGRAMME PROGRAMMES BUDGET Q 1 % Q 2 % Q1+Q2 %
R’000 R’000 SPENT R’000 SPENT R’000 SPENT
Administration 785 053 247 047 31,3% 227 179 28,9% 474 226 60,4%
Agricultural Production, Health
And Food Safety 1 953 418 534 195 27,3% 541 956 27,7% 1 076 151 55,1%
Food Security and Agrarian
Reform 1 892 738 370 734 19,6% 496 895 26,3% 867 629 45,8%
Trade Promotion and Market
Access 297 596 142 533 47,9% 95 853 32,2% 238 386 80,1%
Forestry and Natural
Resources Management 945 562 225 906 23,9% 251 892 26,6% 477 798 50,5%
Fisheries 458 598 122 023 26,6% 114 195 24,9% 236 218 51,5%
TOTAL 6 332 965 1 642 438 25,9% 1 727 970 27,3% 3 370 408 53,2%<br>
R’000 R’000 SPENT R’000 SPENT R’000 SPENT
Administration 785 053 247 047 31,3% 227 179 28,9% 474 226 60,4%
Agricultural Production, Health
And Food Safety 1 953 418 534 195 27,3% 541 956 27,7% 1 076 151 55,1%
Food Security and Agrarian
Reform 1 892 738 370 734 19,6% 496 895 26,3% 867 629 45,8%
Trade Promotion and Market
Access 297 596 142 533 47,9% 95 853 32,2% 238 386 80,1%
Forestry and Natural
Resources Management 945 562 225 906 23,9% 251 892 26,6% 477 798 50,5%
Fisheries 458 598 122 023 26,6% 114 195 24,9% 236 218 51,5%
TOTAL 6 332 965 1 642 438 25,9% 1 727 970 27,3% 3 370 408 53,2%<br>
57
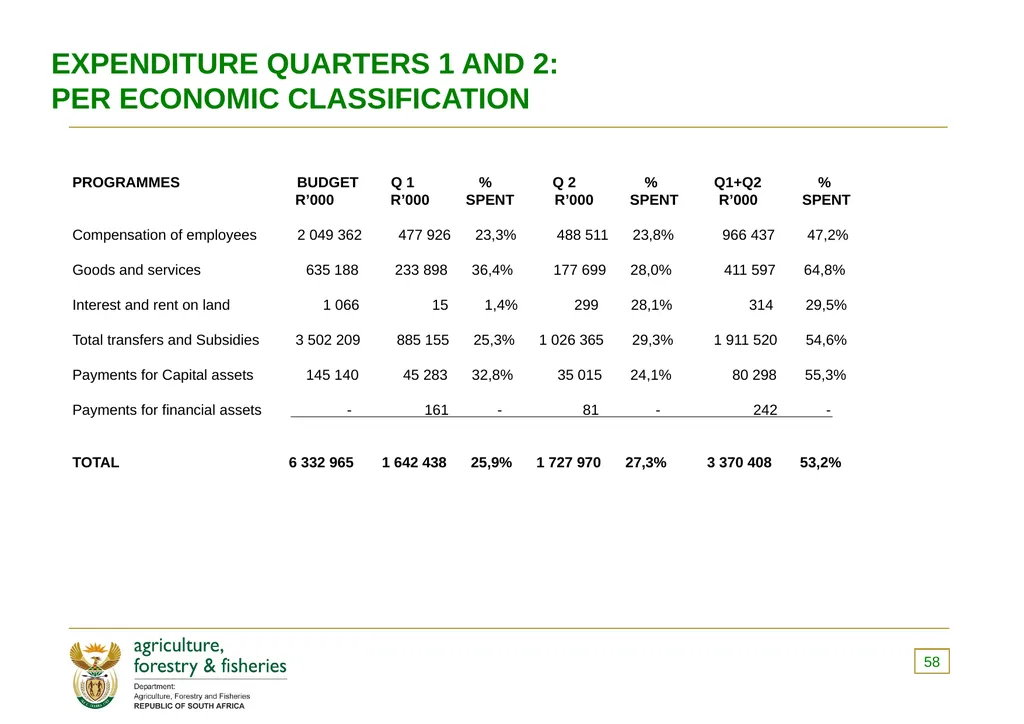
EXPENDITURE QUARTERS 1 AND 2:
PER ECONOMIC CLASSIFICATION 58 PROGRAMMES BUDGET Q 1 % Q 2 % Q1+Q2 %
R’000 R’000 SPENT R’000 SPENT R’000 SPENT
Compensation of employees 2 049 362 477 926 23,3% 488 511 23,8% 966 437 47,2%
Goods and services 635 188 233 898 36,4% 177 699 28,0% 411 597 64,8%
Interest and rent on land 1 066 15 1,4% 299 28,1% 314 29,5%
Total transfers and Subsidies 3 502 209 885 155 25,3% 1 026 365 29,3% 1 911 520 54,6%
Payments for Capital assets 145 140 45 283 32,8% 35 015 24,1% 80 298 55,3%
Payments for financial assets - 161 - 81 - 242 -
TOTAL 6 332 965 1 642 438 25,9% 1 727 970 27,3% 3 370 408 53,2%<br>
R’000 R’000 SPENT R’000 SPENT R’000 SPENT
Compensation of employees 2 049 362 477 926 23,3% 488 511 23,8% 966 437 47,2%
Goods and services 635 188 233 898 36,4% 177 699 28,0% 411 597 64,8%
Interest and rent on land 1 066 15 1,4% 299 28,1% 314 29,5%
Total transfers and Subsidies 3 502 209 885 155 25,3% 1 026 365 29,3% 1 911 520 54,6%
Payments for Capital assets 145 140 45 283 32,8% 35 015 24,1% 80 298 55,3%
Payments for financial assets - 161 - 81 - 242 -
TOTAL 6 332 965 1 642 438 25,9% 1 727 970 27,3% 3 370 408 53,2%<br>
58
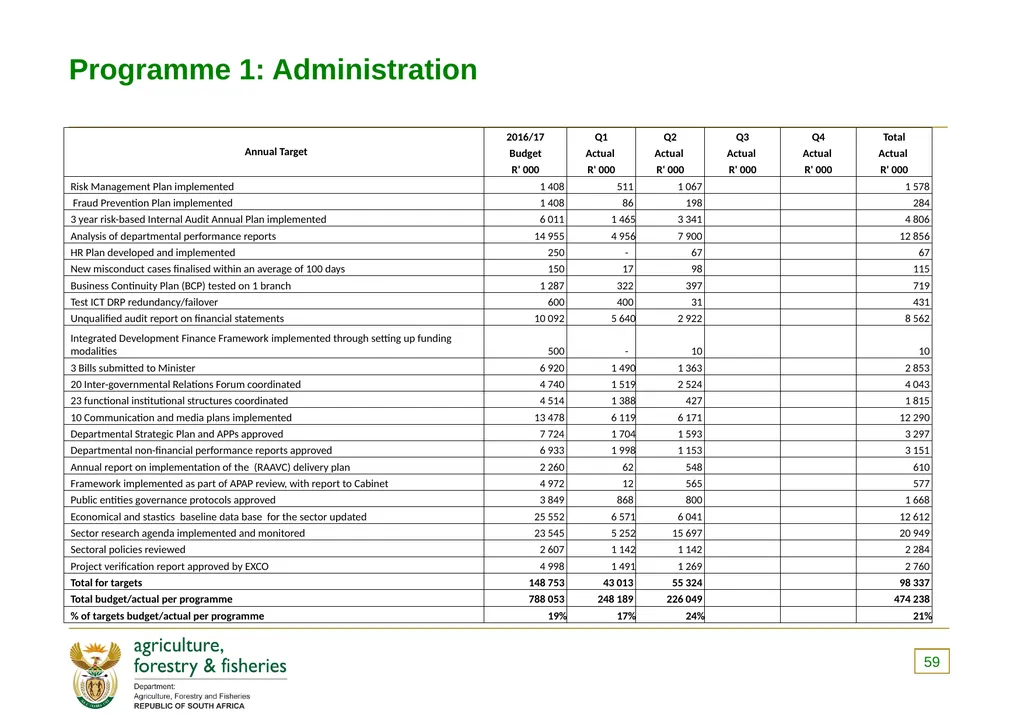
Programme 1: Administration 59<br>
59
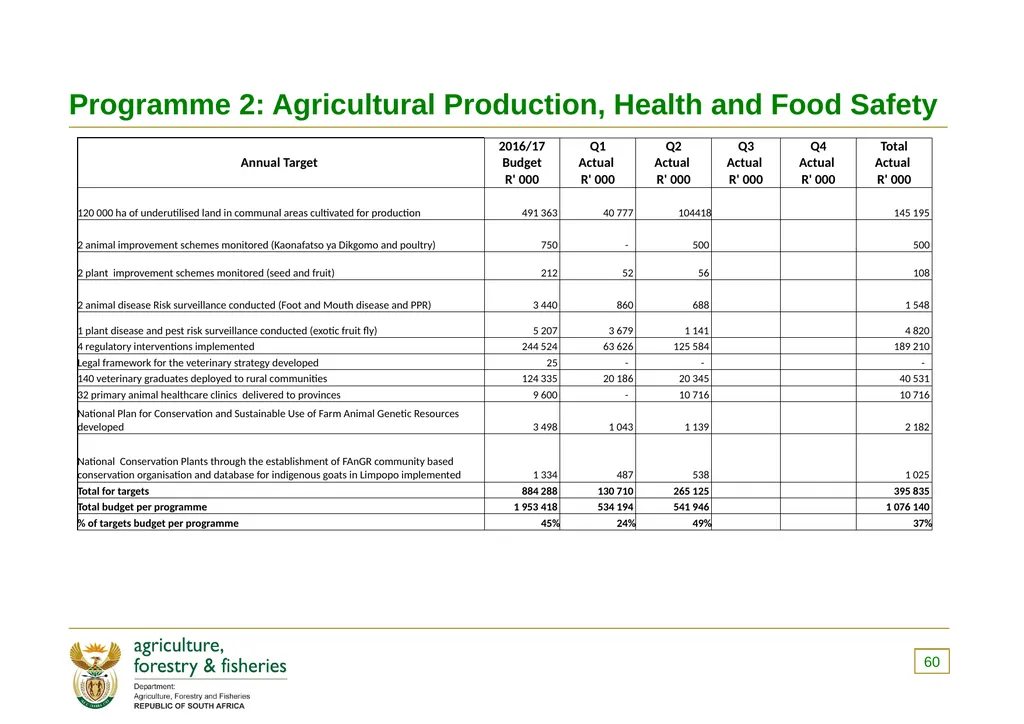
Programme 2: Agricultural Production, Health and Food Safety 60<br>
60
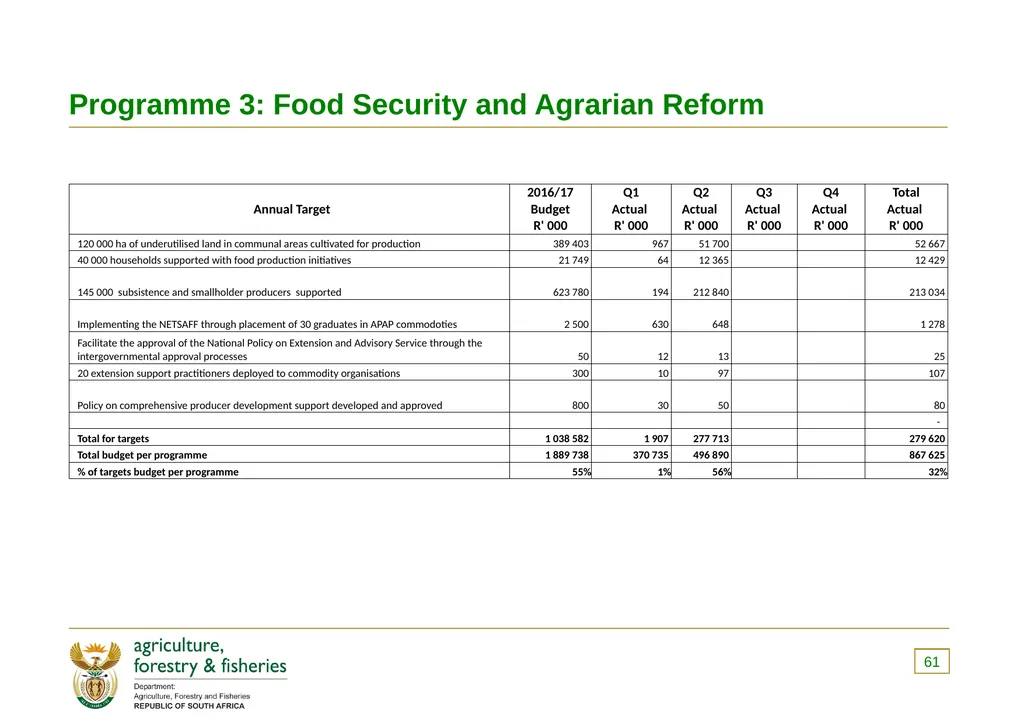
Programme 3: Food Security and Agrarian Reform 61<br>
61
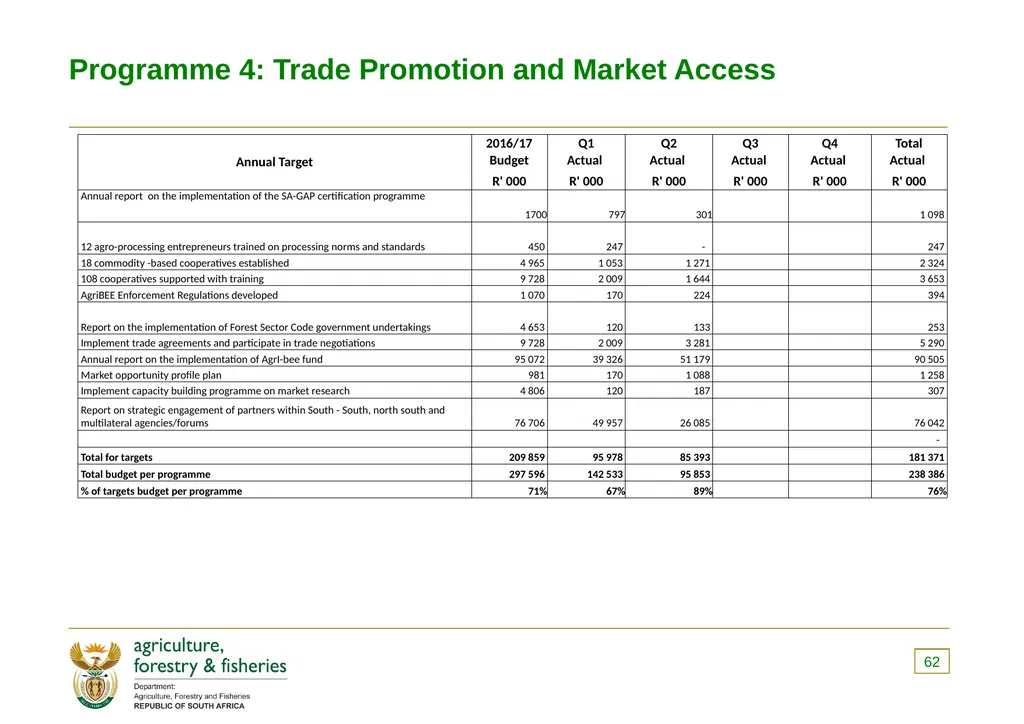
Programme 4: Trade Promotion and Market Access 62<br>
62
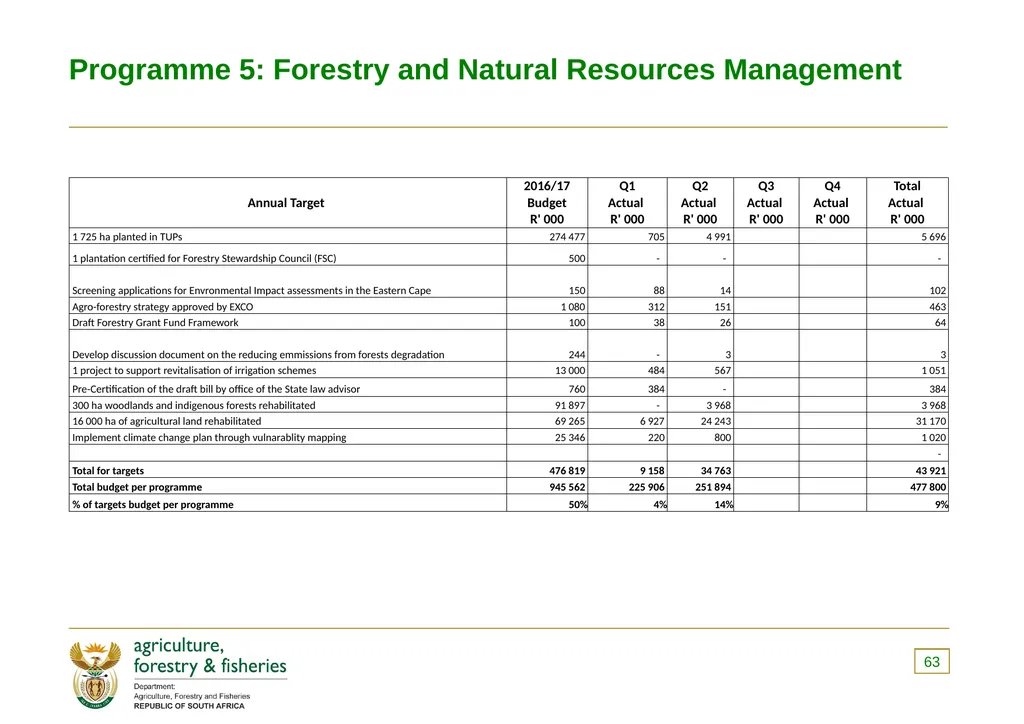
Programme 5: Forestry and Natural Resources Management 63<br>
63
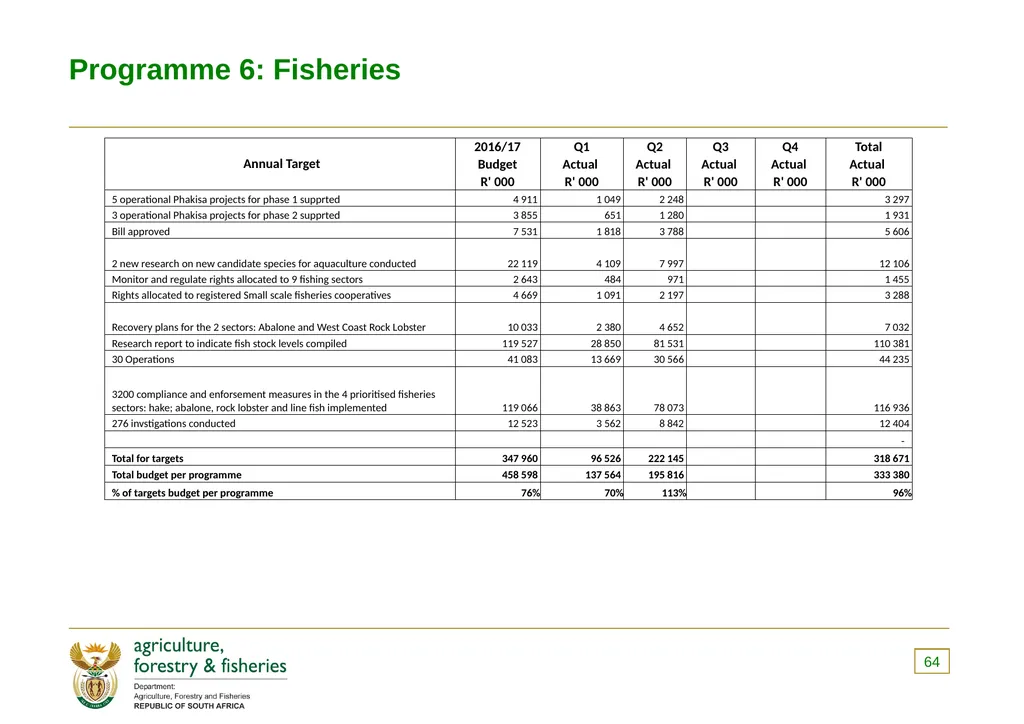
Programme 6: Fisheries 64<br>
64
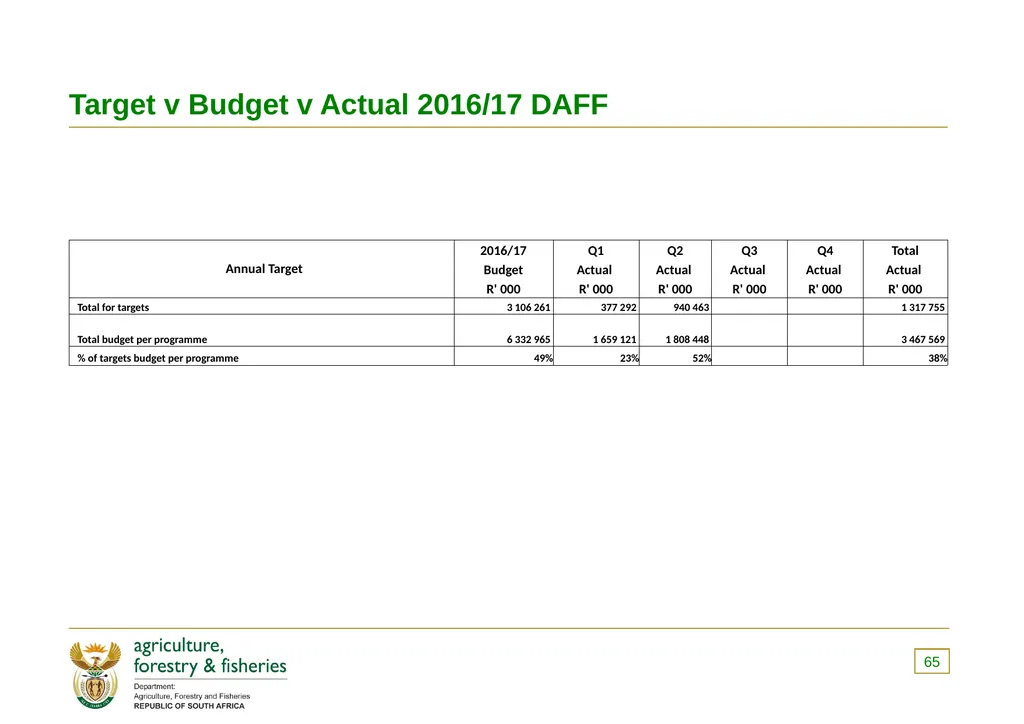
Target v Budget v Actual 2016/17 DAFF 65<br>
65
CONCLUSION<br>
66
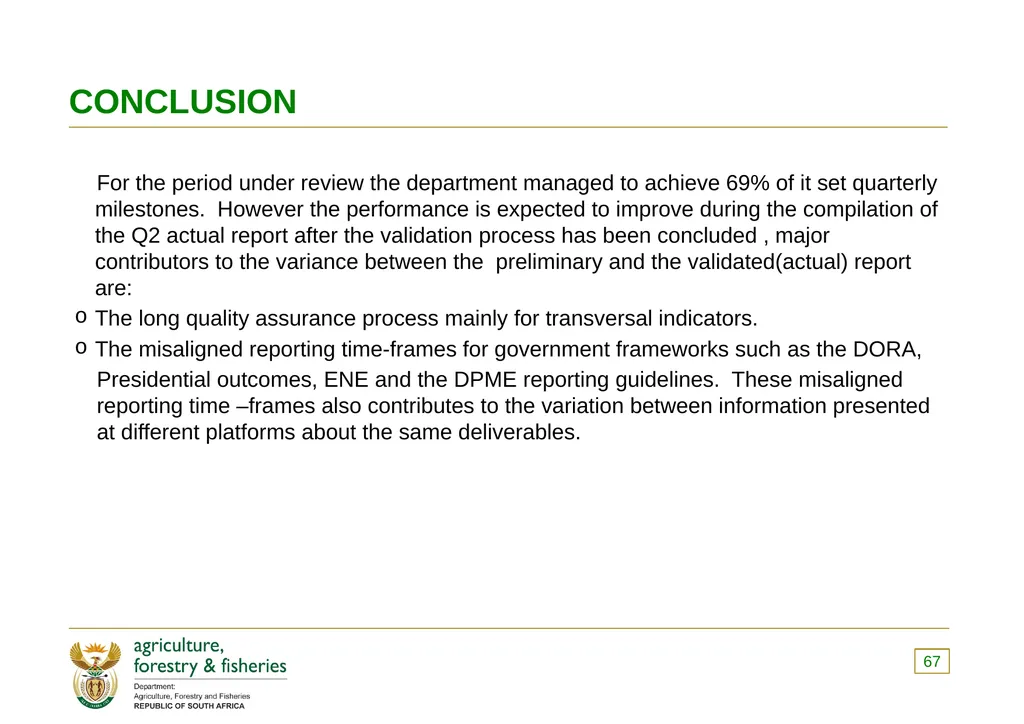
CONCLUSION For the period under review the department managed to achieve 69% of it set quarterly milestones. However the performance is expected to improve during the compilation of the Q2 actual report after the validation process has been concluded , major contributors to the variance between the preliminary and the validated(actual) report are:
The long quality assurance process mainly for transversal indicators.
The misaligned reporting time-frames for government frameworks such as the DORA,
Presidential outcomes, ENE and the DPME reporting guidelines. These misaligned reporting time –frames also contributes to the variation between information presented at different platforms about the same deliverables. 67<br>
The long quality assurance process mainly for transversal indicators.
The misaligned reporting time-frames for government frameworks such as the DORA,
Presidential outcomes, ENE and the DPME reporting guidelines. These misaligned reporting time –frames also contributes to the variation between information presented at different platforms about the same deliverables. 67<br>