
PRESENTATION TO THE STANDING COMMITTEE ON

Description: PRESENTATION TO THE STANDING COMMITTEE ON APPROPRIATIONS COMMENTS ON THE 2018 APPROPRIATION BILL 9 MAY 2018 OUTLINE OF THE PRESENTATION PSC Mandate Areas of Oversight Outputs of Oversight Function SCOA Requested Information Concluding
Related Topics
Download Presentation
"PRESENTATION TO THE STANDING COMMITTEE ON" is the property of its rightful owner. Permission is granted to download and print the materials on this website for personal, non-commercial use only, and to display it on your personal computer provided you do not modify the materials and that you retain all copyright notices contained in the materials. By downloading content from our website, you accept the terms of this agreement.
Presentation Transcript
slide1. PRESENTATION TO THE STANDING COMMITTEE ON APPROPRIATIONS COMMENTS ON THE 2018 APPROPRIATION BILL
9 MAY 2018<br>
slide2. OUTLINE OF THE PRESENTATION PSC Mandate
Areas of Oversight
Outputs of Oversight Function
SCOA Requested Information
Concluding Remarks
Annexures
A. Budget vs Performance for National Departments
B. Financial Misconduct
C. Performance Management
D. Precautionary Suspensions
E. Utilisation of Consultants 2<br>
slide3. PSC MANDATE 3 The Public Service Commission’s priorities are based on its Constitutional imperative of oversight, which is focused on performance and transformation of the Public Service.
In executing the PSC’s mandate the Commission takes cognizance of the Constitution, National Development Plan (NDP), Parliamentary resolutions, Cabinet mandates and the SONA.
The outcomes approach as developed by Government also provide a framework used by the PSC to assist in its prioritisation and strategic approach. In particular, the PSC contributes to Outcome 12: “An efficient, effective and development-oriented Public Service”.
Apart from its key priorities, the PSC continues to engage with Executive Authorities, HoDs, PC on Public Service and Administration as well as Planning, Monitoring and Evaluation, and other stakeholders on its reports so as to ensure the implementation of its recommendations.<br>
slide4. AREAS OF OVERSIGHT
(INVESTIGATION, MONITORING AND EVALUATION MANDATE) 4 The Constitutional oversight mandate of the PSC is wide and, in summary, covers the following areas:
Organisation of the public service (the structural arrangements of departments in the Public Service)
Administration of the public service (all the procedures, policy frameworks, accountability mechanisms, etc. that ensure the functioning of the Public Service)
Personnel practices of the public service (e.g. recruitment, transfers, promotions and dismissals)
Adherence to applicable procedures in the public service (compliance with the letter and spirit of prescribed rules / policies / procedures)
The extent to which the values and principles set out in section 195 of the Constitution are complied with 4<br>
slide5. OUTPUTS OF OVERSIGHT FUNCTION 5 Advise
On own accord or on receipt of any complaint, national and provincial organs of state regarding personnel practices in the public service, including those relating to the recruitment, appointment, transfer, discharge and other aspects of the careers of employees in the Public Service (S 196 (4)(f)).
Recommend
Appropriate remedies regarding the resolution of grievances of employees in the public service (S 196 (4)(f)).
That executive authorities act in terms of a particular provision(s) of the Public Service Act or any other law (PS Act S 35) in resolving a particular grievance.
Propose measures
To ensure effective and efficient performance within the Public Service (S 196(4)(c)).<br>
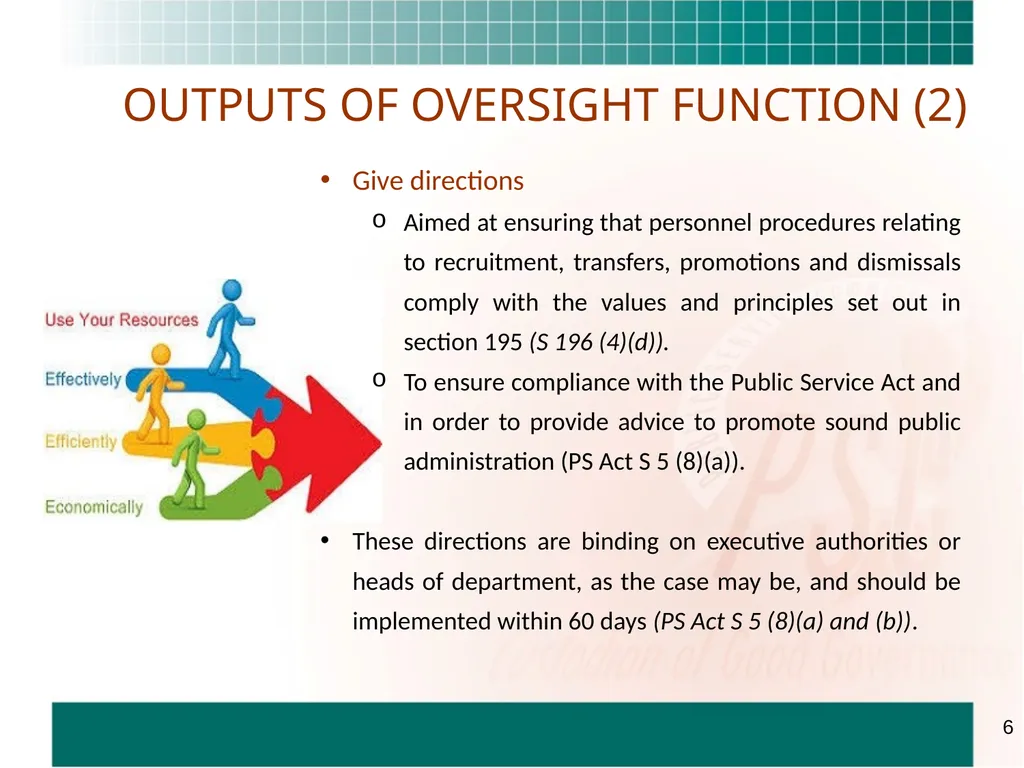
slide6. OUTPUTS OF OVERSIGHT FUNCTION (2) 6 Give directions
Aimed at ensuring that personnel procedures relating to recruitment, transfers, promotions and dismissals comply with the values and principles set out in section 195 (S 196 (4)(d)).
To ensure compliance with the Public Service Act and in order to provide advice to promote sound public administration (PS Act S 5 (8)(a)).
These directions are binding on executive authorities or heads of department, as the case may be, and should be implemented within 60 days (PS Act S 5 (8)(a) and (b)).<br>
slide7. PRESENTATION COVERS The PSC will present on the following –
Discuss the 2018 Appropriation Bill with regard to the issues pertaining to the mandate of the PSC.
Key Indicators Monitored by the PSC.
An assessment of strategies available to significantly improve administration practices in the public services especially in high education so as to ensure fee free education is effectively executed.
Budgets versus performance for national departments (Annexure A). 7<br>
slide8. PRESENTATION COVERS (2) Data used-
Annual Reports (2016/17) – still not available at the time of compilation of this presentation:
Environmental Affairs
PSC database, factsheets, in particular the following research reports:
Analytical Brief on the Utilisation of Consultants
Analytical Brief on the 30 Days Payment of Invoices
Assessment of the Effectiveness of Public and Private Partnerships in the delivery of Health Services
Evaluation of the role of Agencification in Public Service Delivery 8<br>
slide9. PRESENTATION COVERS (3) Annexures to the presentation reflects information presented to the SCOA on the 8th of November 2017, currently no updated information is available on the following areas:
Financial Misconduct – 2017/18 financial year information will be available in November 2018
Performance vs expenditure - new information will be available from September 2018 (release of the 2017/18 Annual Reports)
Precautionary suspensions - new information will be available from September 2018 (release of the 2017/18 Annual Reports)
Utilisation of Consultants - new information will be available from September 2018 (release of the 2017/18 Annual Reports) 9<br>
slide10. INTRODUCTION 10 The PSC does not have comprehensive research on all the areas requested. The comments should therefore be viewed with this limitation in mind.
Nevertheless, the PSC has built a data sourcing and analytical capability with the 9 values governing public administration as frame, and this enables the Commission to provide necessary comments.
Government’s spending plans aims to reignite growth and chart a course towards achieving the NDP objectives and fulfilling the constitutional obligations.
The 2018 Budget directs spending to the national priorities; educating the youth, protecting the vulnerable and investing in enablers of inclusive growth.
However, this presentation does not comment on this prioritisation.<br>
slide11. 11 As alluded to in the Budget Speech, to create a conducive environment for public governance, its essential that the political and administrative interface challenges be addressed, as they create instability within departments.
The contention between the political and administrative Heads has both policy and strategic direction implications, which in turn negatively impacts performance and service delivery. This means the ship is being steered in two different directions with huge costs implications.
This disjuncture creates an breeding ground for maladministration and mismanagement of funds.
Corruption undermines good governance, legitimacy and credibility of the state, sound and functional institutions as well as effective operation of government. It further hampers development efforts, economical growth and has far reaching financial implications on the available budget. GENERAL COMMENTS IN RELATION TO PSC MANDATE<br>
slide12. 12 The pledge to confront allegations of state capture through the Judicial Commission of Inquiry is clearly shown. Yet, the Bill is silent on the financial considerations for the investigation agencies such as the Hawks and the Asset Forfeiture Unit (AFU).
Furthermore, the Bill shows no consideration for the Anti-Corruption structures such as the National Anti-Corruption Forum led by the Minister of Public Service and Administration (MPSA) and the PSC.
With the expenditure cuts it is vital that the duplication of functions between departments be addressed, with the focus on how departments can minimise the inevitable negative impact of these cuts on performance and service delivery. GENERAL COMMENTS IN RELATION TO PSC MANDATE (2)<br>
slide13. 13 Better accountability of State Owned Enterprises (SoEs) is crucial for service delivery and the broader transformation of the state.
The PSC fully supports the Presidential Review Commission (PRC) that a greater degree of centralisation of the ownership function is required to ensure good governance.
There is a need to rationalise the number of SoEs against their mandates to determine the validity and return of investment made by Government.
Oversight departments should take their role and responsibilities seriously to ensure effective and efficient management of SoEs, as most of the entities are self-managing.
The PSC is in total agreement that the bail-outs are not a solution but rather an enabler, which only causes operational inefficiencies and financial burden on the state. GENERAL COMMENTS IN RELATION TO PSC MANDATE (3)<br>
slide14. 14 GENERAL COMMENTS IN RELATION TO PSC MANDATE (4) It is essential that Government reviews and assesses the impact of the establishment of the agencies (agencification) and Public and Private Partnerships (PPPs):
The impact on the fiscus (all related cost of agencies and partnerships). The costs of the specific PPP (e.g. Albert Luthuli) is modelled but not the financial implication for the budgets of all the other hospitals. We create a Rolls-Royce for one hospital to the detriment of all the others.
Agency mandates in relation to the departments’ mandates: are these agencies delivering the Constitutional mandate and functions of the departments (possible duplications)?
Measure the return on investment.
PSC inspected various border posts, aimed to assess the service delivery and infrastructural challenges. The Department of Home Affairs presented the establishment of the Border Management Agency (BMA), as a possible solution.
Parliament passed the Bill on 06 June 2017. This move has a potential pressure budget of R12 billion per year.<br>
slide15. 15 KEY INDICATORS MONITORED BY THE PSC Evidence presented focuses on:
Financial Disclosure Framework
Payment of Invoices
Utilisation of Consultants<br>
slide16. 16 Financial Disclosure Framework The Financial Disclosure Framework (FDF) was introduced (1999) to safeguard public confidence and manage public servants conflict of interest. This Framework facilitates public scrutiny.
All SMS members are required to disclose the particulars of all their registrable interests (e.g. companies and properties) to their respective Executive Authorities (EAs) by not later than 30 April each year.
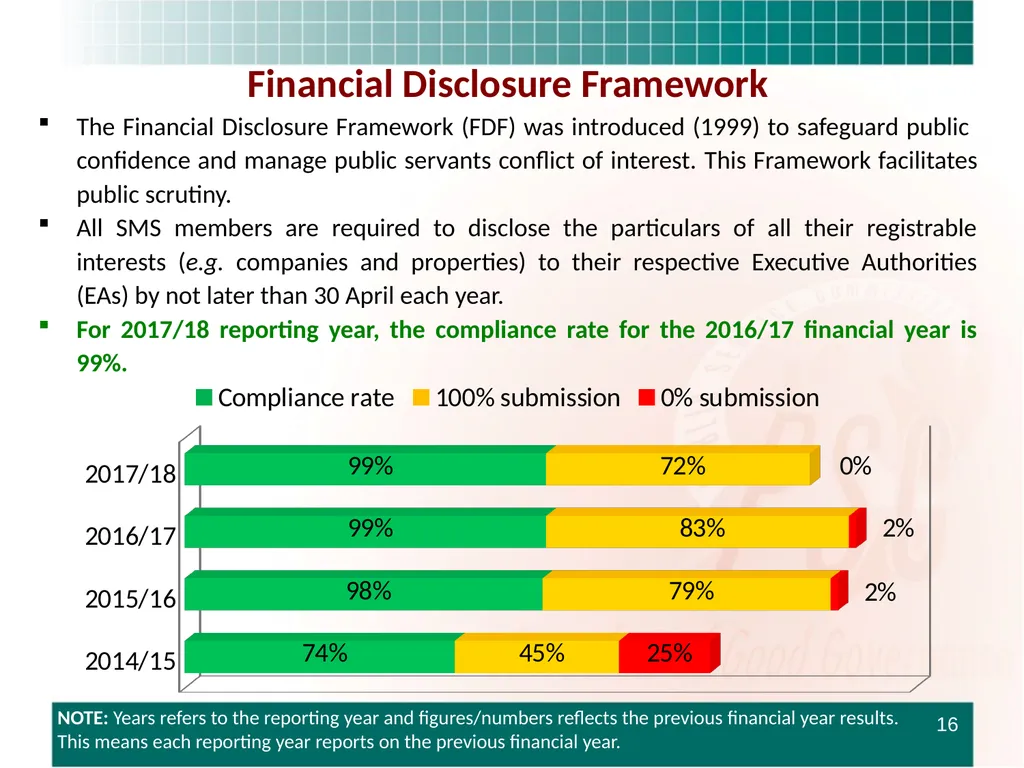
For 2017/18 reporting year, the compliance rate for the 2016/17 financial year is 99%. NOTE: Years refers to the reporting year and figures/numbers reflects the previous financial year results. This means each reporting year reports on the previous financial year.<br>
slide17. Non-Compliance with financial disclosure framework The number of forms received shows a 99% compliance rate.
Noteworthy is the decline in the number of departments that have achieved a 100% submission rate by the end of the respective reporting financial year (31 March) – from the 83% to a 72% (-11%). 17 The need for the identification of potential conflicts of interest is based on the likelihood that SMS members could use state resources to further private interests.
For instance, a direct clash between private interests of an individual and official responsibilities as public servants could influence them to improperly discharge their official duties and responsibilities.<br>
slide18. Procurement is central to government service delivery system and can therefore be used to achieve socio-economic objectives such as stimulating economic activity and alleviating national disparities.
Government is mindful of the importance of Small Medium and Micro Enterprises (SMMEs) and the role it plays in inclusive economic growth and job creation.
Cabinet has noted with concern non-compliance and its devastating impact of non-payment of suppliers within 30 days on SMMEs and its impact on service delivery.
The existing institutional arrangements are:
Office of Accountant General (OAG) at NT, Special Unit established within the DPME, the Office of the Chief Procurement Officer (OCPO) at NT, and Small Enterprise Development Agency (SEDA).
Despite these initiatives the non-payment of suppliers remain a challenge, stifling economic growth and job creation in the SMMEs sector. 18 Payment of Invoices<br>
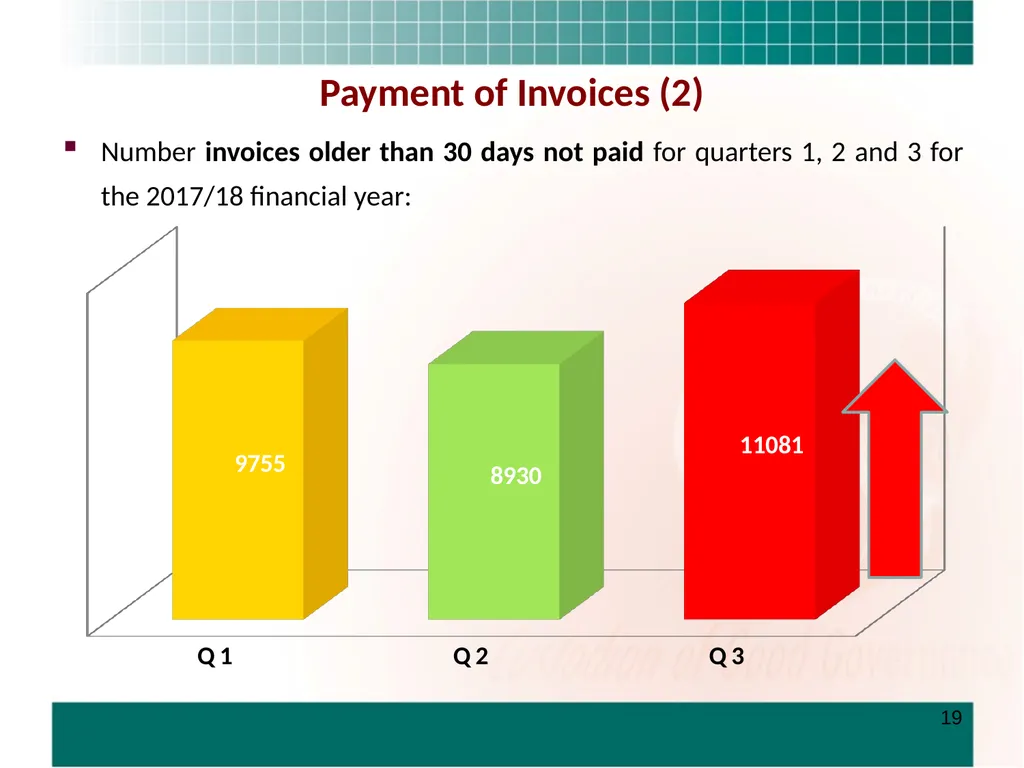
slide19. Payment of Invoices (2) Number invoices older than 30 days not paid for quarters 1, 2 and 3 for the 2017/18 financial year: 19<br>
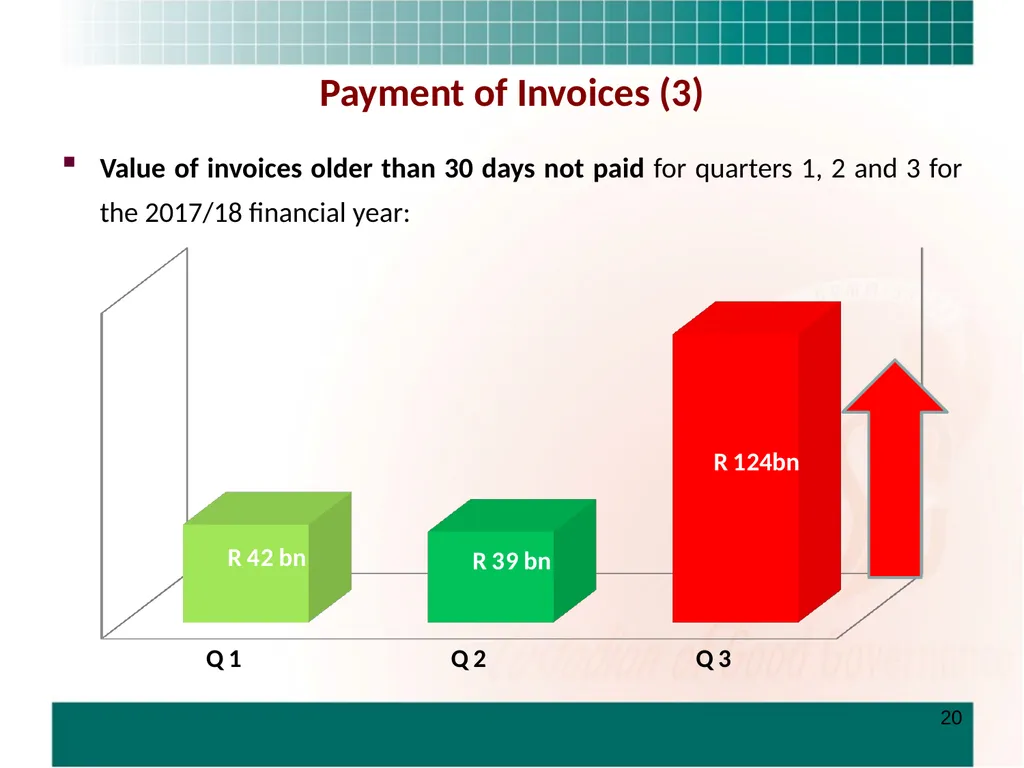
slide20. Payment of Invoices (3) Value of invoices older than 30 days not paid for quarters 1, 2 and 3 for the 2017/18 financial year: 20<br>
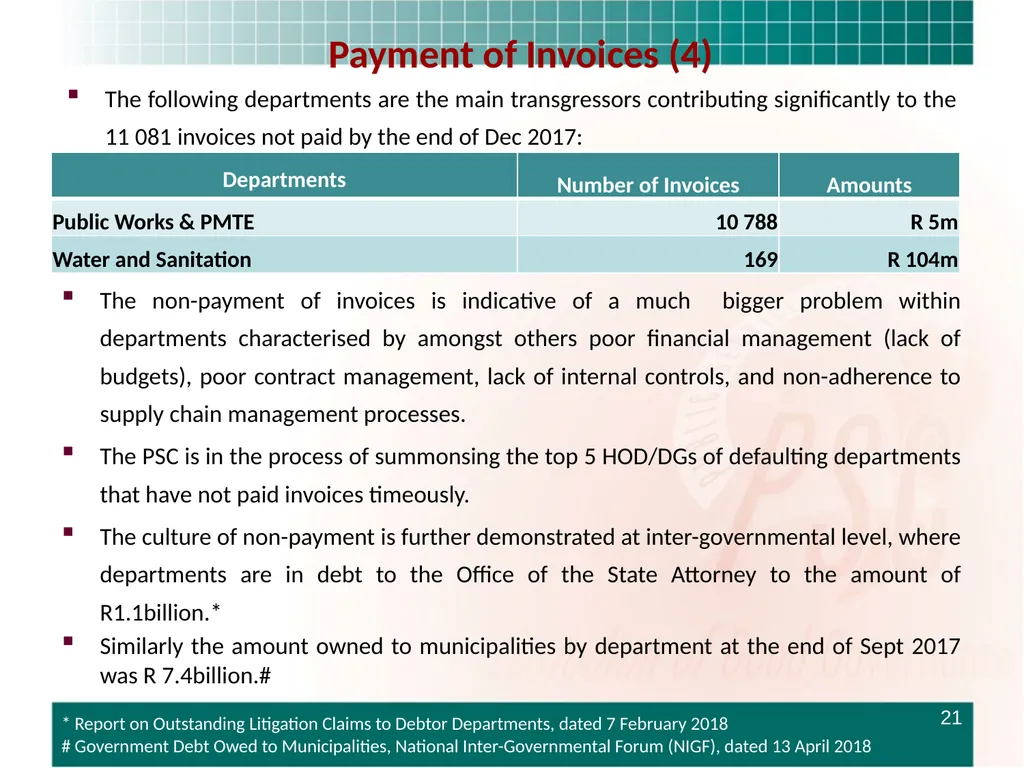
slide21. Payment of Invoices (4) The following departments are the main transgressors contributing significantly to the 11 081 invoices not paid by the end of Dec 2017: 21 The non-payment of invoices is indicative of a much bigger problem within departments characterised by amongst others poor financial management (lack of budgets), poor contract management, lack of internal controls, and non-adherence to supply chain management processes.
The PSC is in the process of summonsing the top 5 HOD/DGs of defaulting departments that have not paid invoices timeously.
The culture of non-payment is further demonstrated at inter-governmental level, where departments are in debt to the Office of the State Attorney to the amount of R1.1billion.*
Similarly the amount owned to municipalities by department at the end of Sept 2017 was R 7.4billion.# * Report on Outstanding Litigation Claims to Debtor Departments, dated 7 February 2018
# Government Debt Owed to Municipalities, National Inter-Governmental Forum (NIGF), dated 13 April 2018<br>
slide22. Utilisation of Consultants The use of consultants by Government was initially seen as an intervention to address the skills and capacity gap and fast track the implementation of priority programmes in departments.
However, this intervention has created a reliance on consultants to deliver on department’s mandates.
The reality is that with the utilisation of consultants, the PS has not yet seen the return of investment, in terms of skills and knowledge transfer to public servants.
Departments are still dealing with a lack of capacity or competencies to deliver on their mandates. 22<br>
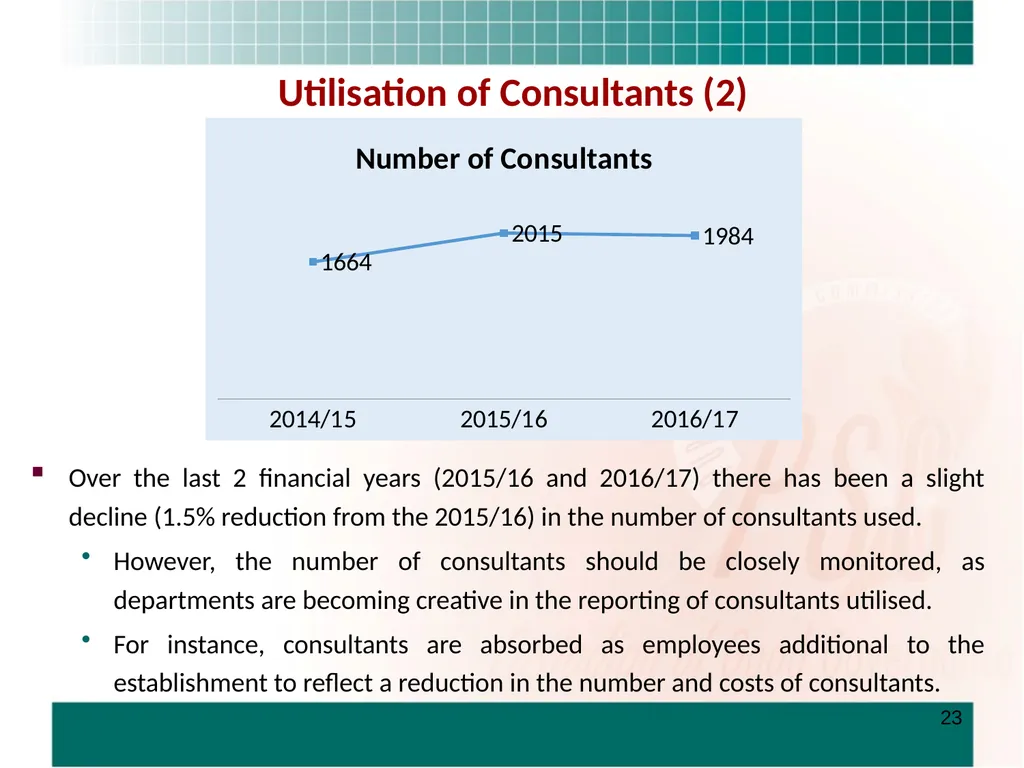
slide23. Utilisation of Consultants (2) Over the last 2 financial years (2015/16 and 2016/17) there has been a slight decline (1.5% reduction from the 2015/16) in the number of consultants used.
However, the number of consultants should be closely monitored, as departments are becoming creative in the reporting of consultants utilised.
For instance, consultants are absorbed as employees additional to the establishment to reflect a reduction in the number and costs of consultants. 23<br>
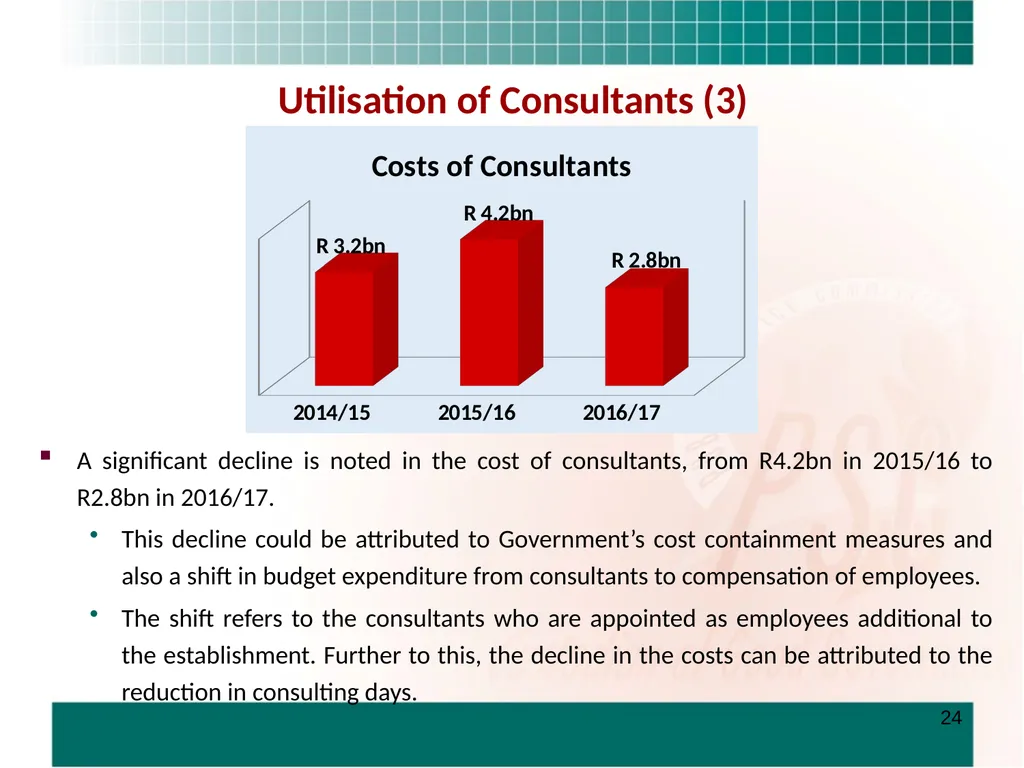
slide24. Utilisation of Consultants (3) A significant decline is noted in the cost of consultants, from R4.2bn in 2015/16 to R2.8bn in 2016/17.
This decline could be attributed to Government’s cost containment measures and also a shift in budget expenditure from consultants to compensation of employees.
The shift refers to the consultants who are appointed as employees additional to the establishment. Further to this, the decline in the costs can be attributed to the reduction in consulting days. 24<br>
slide25. Utilisation of Consultants (4) There is a noteworthy gap in the legislative framework, which provides reporting requirements and guidelines for departments, with particular reference to the management and use of consultants.
The Public Service Regulations (PSR) of 2001 defines the requirements for annual reporting for the utilisation of consultants. However, the amended 2016 PSR does not make any provision for reporting on the utilisation of consultants. 25 The limitation is that these sections of the PFMA do not explicitly state the reporting requirements regarding the utilisation of consultants.
This creates a loophole in terms of the enforceability with regard to how departments are expected to effectively and transparently report on this matter.
This loophole creates a gap in the overall financial management reporting of departments to ensure that budgets are appropriately spent, which in turn can lead to mismanagement of funds.<br>
slide26. 26 Planning and Reporting
Budgeting and costing should become an integral part of the departmental planning and reporting, for both the Medium Term Strategic Framework (MTSF) and annual performance plans (APPs) cycles.
All policies and integrated plans should be costed for, not just focused on annual implementation costs but the projected costs for the MTSF cycle.
For instance, the planned Joint Health Action Plan (per the Budget Speech) should provide a clear indication of the budget contributions from the National Department of Health and National Treasury including at provincial level.
Annual reporting requirements should include narrative sections for departments to report on spending priorities for period of review and in particular account for expenditure of above 90% when less then 60% of the pre-determined targets are achieved.
Budget-based planning and costing implementation could address the constant requests for additional funds by departments through the adjusted estimated national expenditure (AENE). STRATEGIES AVAILABLE TO SIGNIFICANTLY IMPROVE ADMINISTRATION PRACTICE IN THE PUBLIC SERVICE<br>
slide27. 27 Human Management:
Organisational Design – a review of all departmental organisational structures/establishments should be undertaken.
This review should focus on dealing with duplication of functions within and across departments, and the appointments against an unapproved organisational structure (unapproved organogram).
The reality is that the compensation budget of departments are allocated based on the approved organisational structure.
This gap creates an opportunity for irregular appointments and unnecessary increase to the compensation budget. STRATEGIES AVAILABLE TO SIGNIFICANTLY IMPROVE ADMINISTRATION PRACTICE IN THE PUBLIC SERVICE (2)<br>
slide28. 28 Financial Sector Transformation:
Capacitating the departments – based on the Auditor General findings over the last 3 to 4 financial years it is clear that department do not have the required financial management capacity.
It is essential that a skills audit be conducted in the departments to inform the development of a training programme to be led by the National School of Government (NSG). This undertaking will have costs implications and should be jointly led by the Department of Public Service and Administration (DPSA) and the NSG.
Training programme should include the executive authorities, accounting officers and SMS members, starting with financial officials and responsibility managers.
Financial Misconduct - a clear directive should be provided to all departments by the NT pertaining to actions to be taken by department for officials responsible for the non-payment of service provider within the stipulated timeframe (cases base on merit not blanket approach). STRATEGIES AVAILABLE TO SIGNIFICANTLY IMPROVE ADMINISTRATION PRACTICE IN THE PUBLIC SERVICE (3)<br>
slide29. 29 Fee Free Education
The ring-fencing of budget to deal with the fee-free higher education is a positive response to effectively and efficiently deal with this matter.
However, it can be seen as a potential risk, which should be monitored by the Committee in terms of the long-term sustainability of the budget cuts (across departments) vis-à-vis service delivery and performance, including the provisions for Basic Education.
Furthermore, the ring-fenced budget should be translated into a detailed and costed phased-in policy, to ensure close monitoring and management of implementation, with clear costing drivers. For instance, understanding the demand vs the supply – number of students that need assistance vs student that can be assisted. STRATEGIES AVAILABLE TO SIGNIFICANTLY IMPROVE ADMINISTRATION PRACTICE IN THE PUBLIC SERVICE (5)<br>
slide30. CONCLUDING REMARKS A fine balancing act will be required to manage performance and service delivery, against the expenditure cuts at all spheres of government and the 2016 compensation ceiling arrangement of R15bn to be cut in 2018/19.
Cuts in the national government expenditure, where impact will mostly be felt by large programmes and transfers to public entities will definitely mean initiative financial planning and management.
The issue of duplication of functions between departments is critical in the current budgeting cutting environment.
This starts with addressing the organisational design of departments with specific focus on the funded vs unfunded posts, appointments against unapproved organisation structures and duplication of functions across government. 30<br>
slide31. Annexures 31<br>
slide32. Annexure A
Budget vs Performance of National Departments 32<br>
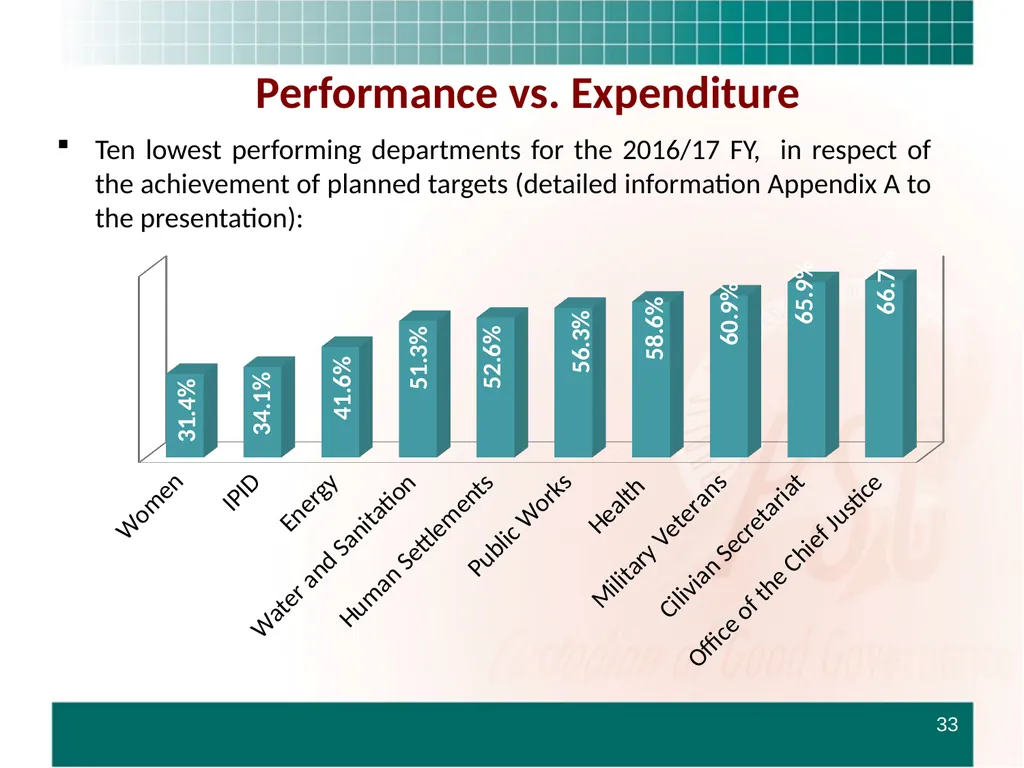
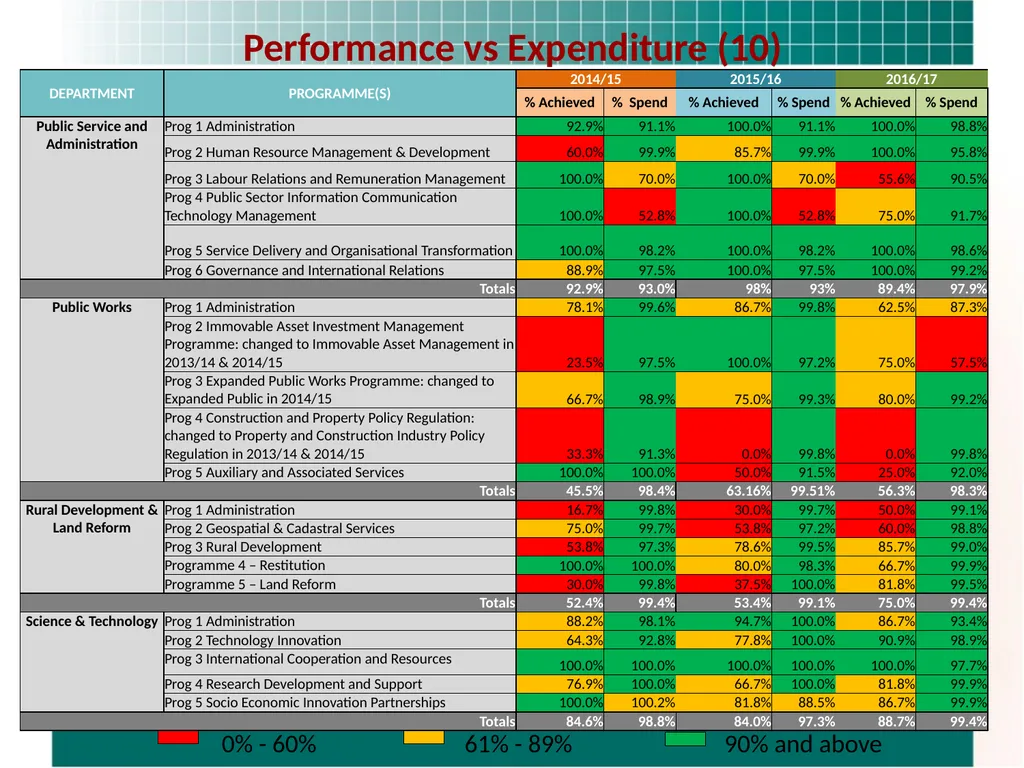
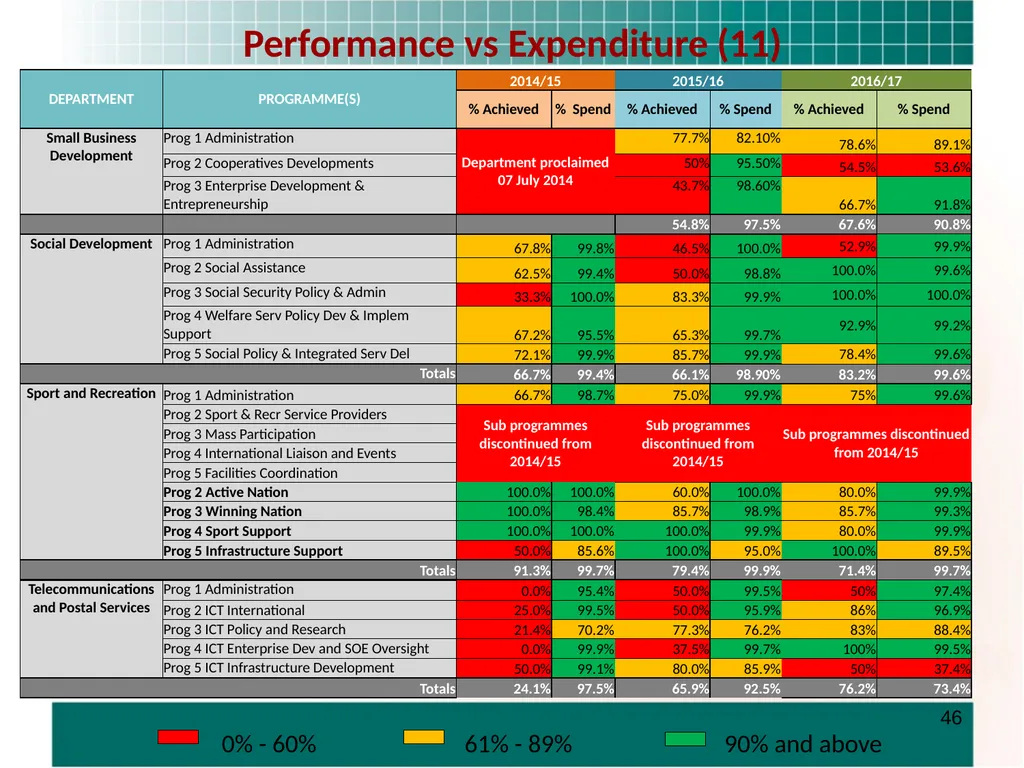
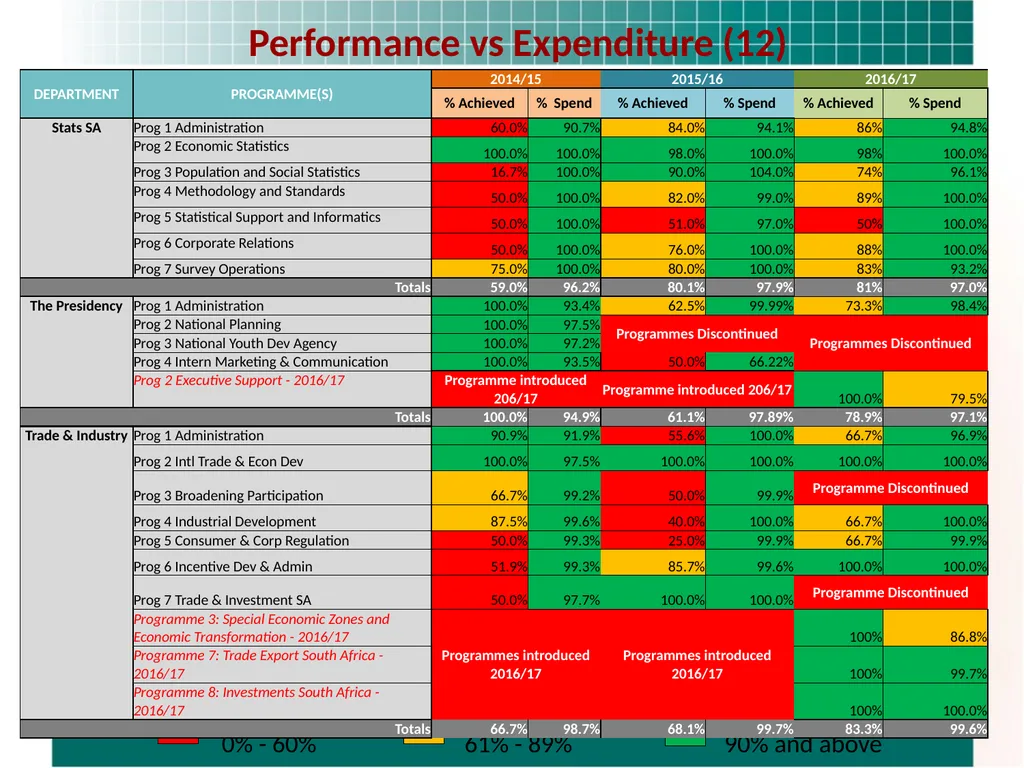
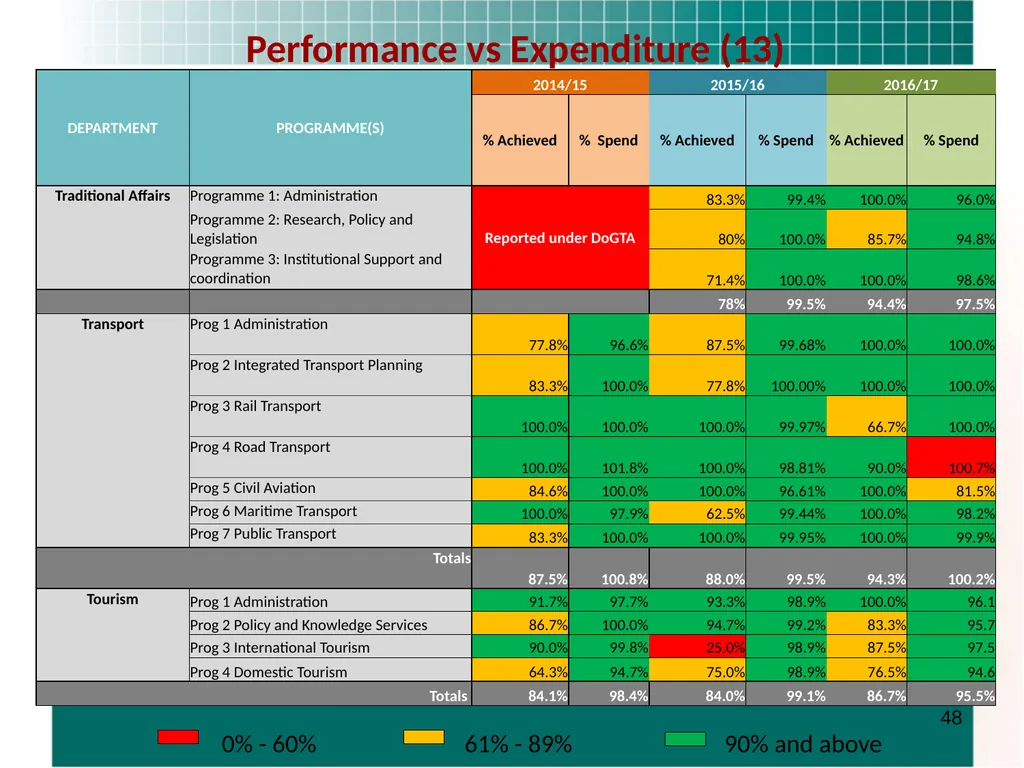
slide33. Performance vs. Expenditure Ten lowest performing departments for the 2016/17 FY, in respect of the achievement of planned targets (detailed information Appendix A to the presentation): 33<br>
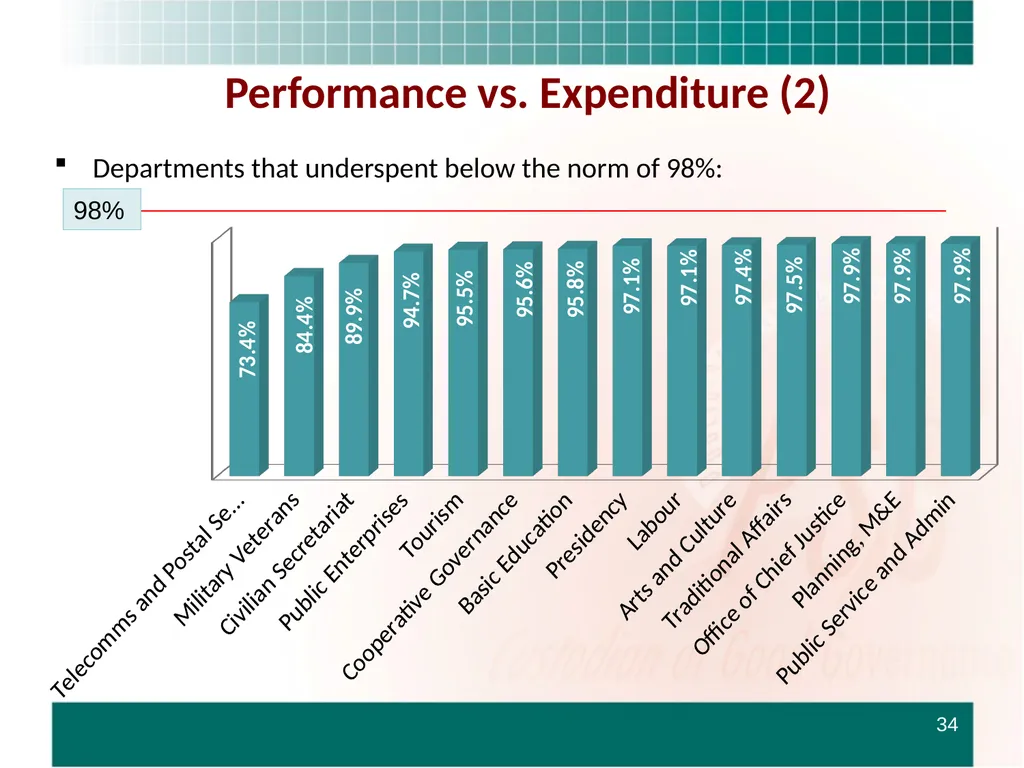
slide34. Performance vs. Expenditure (2) Departments that underspent below the norm of 98%: 34 98%<br>
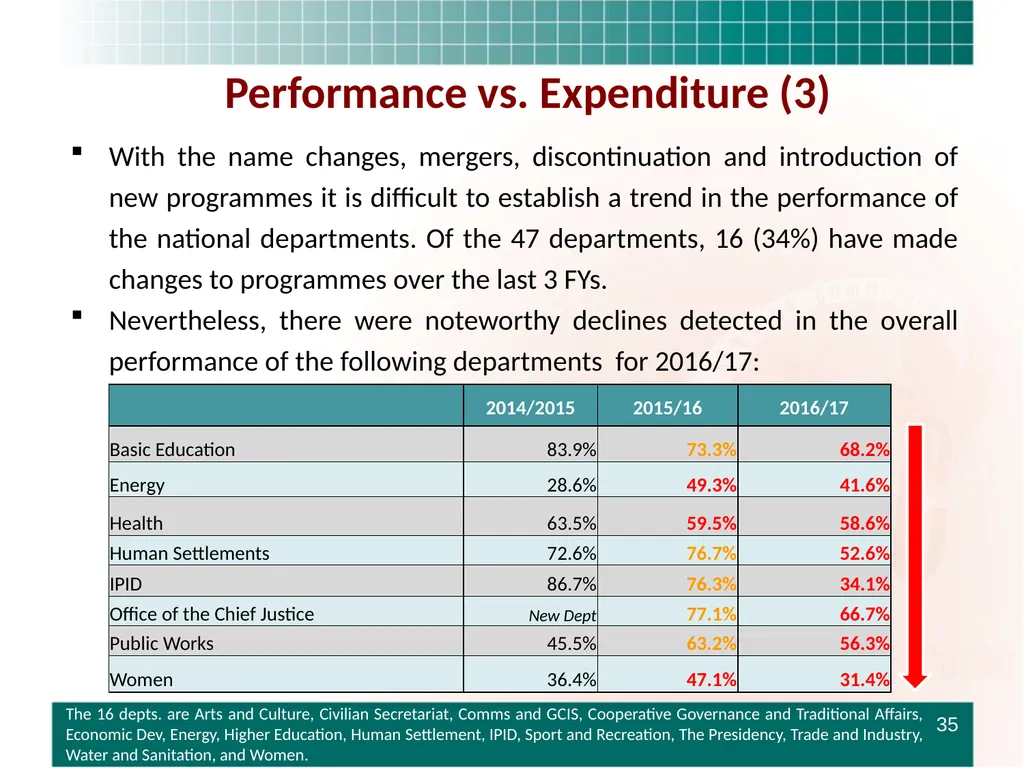
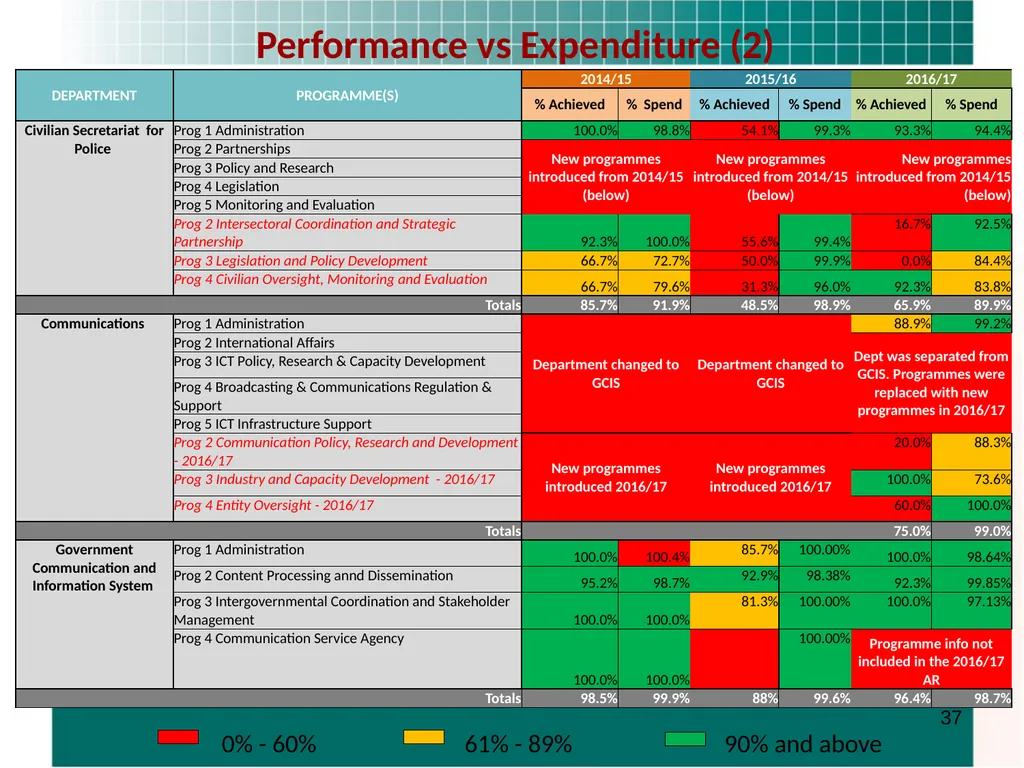
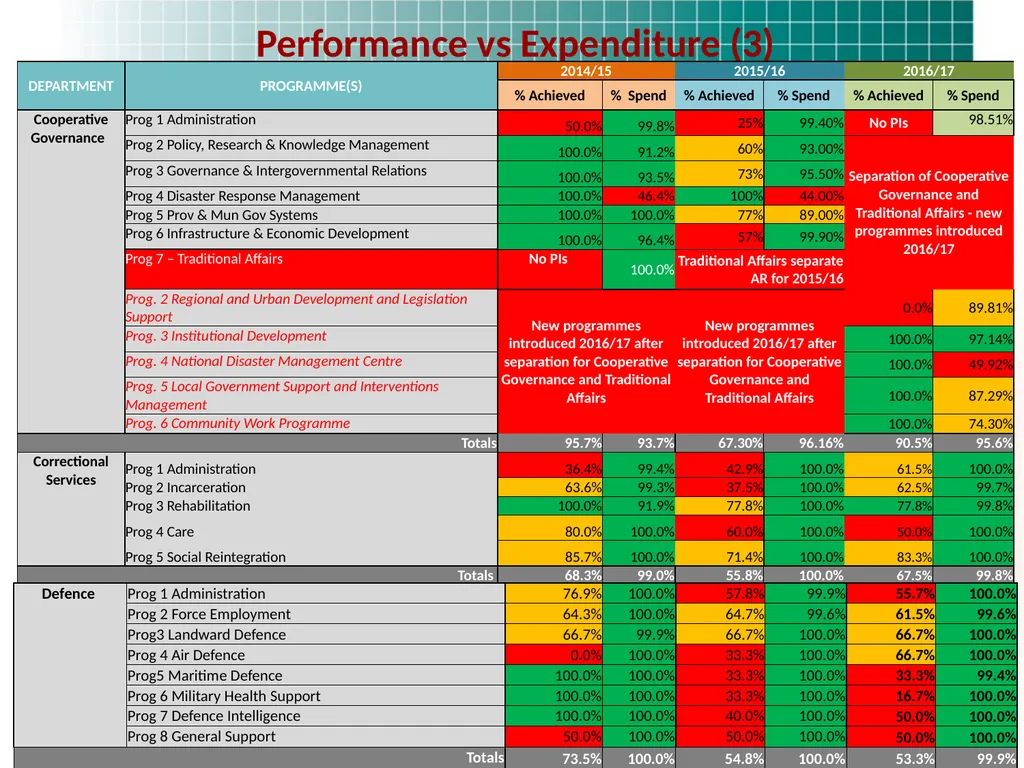
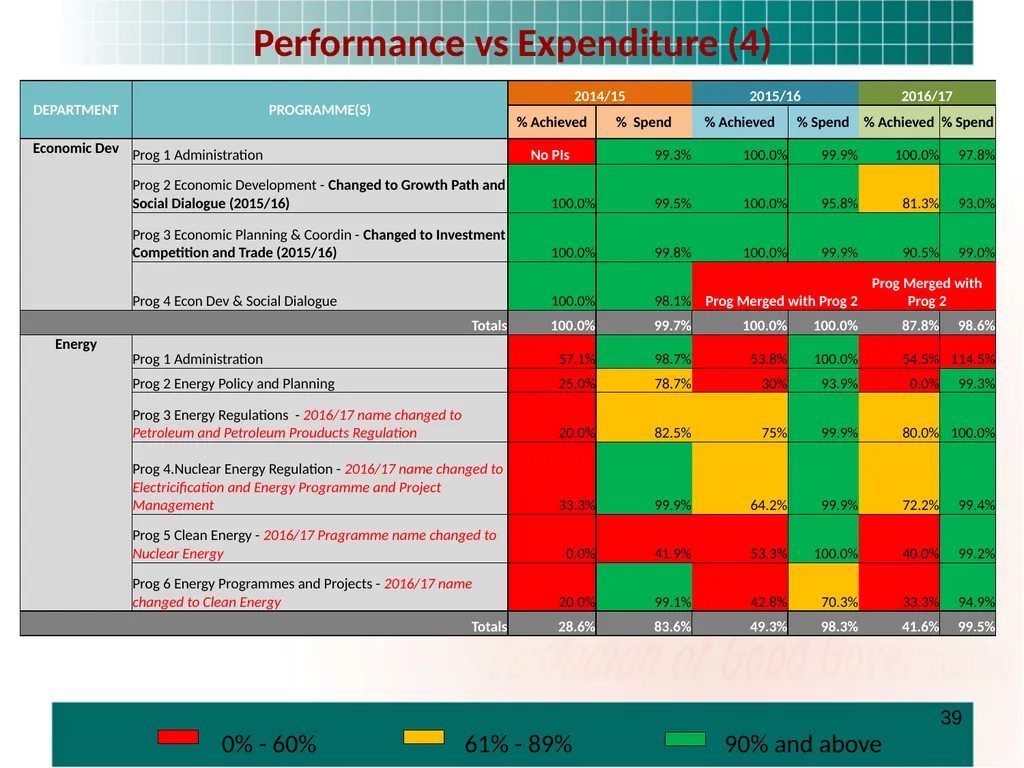
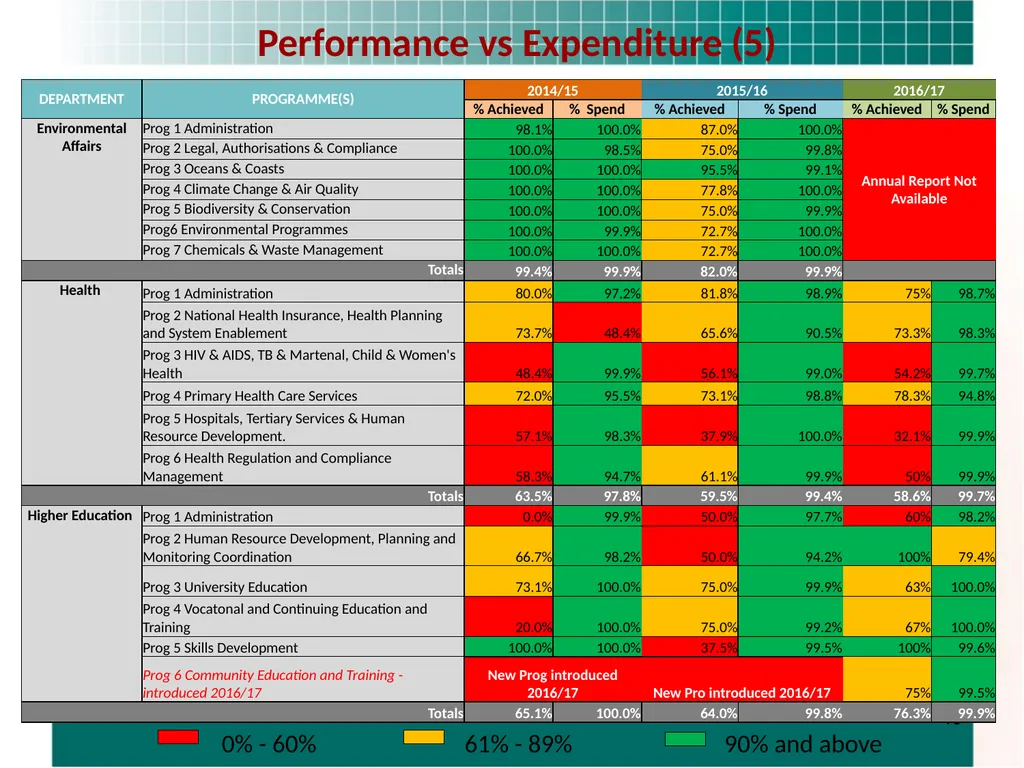
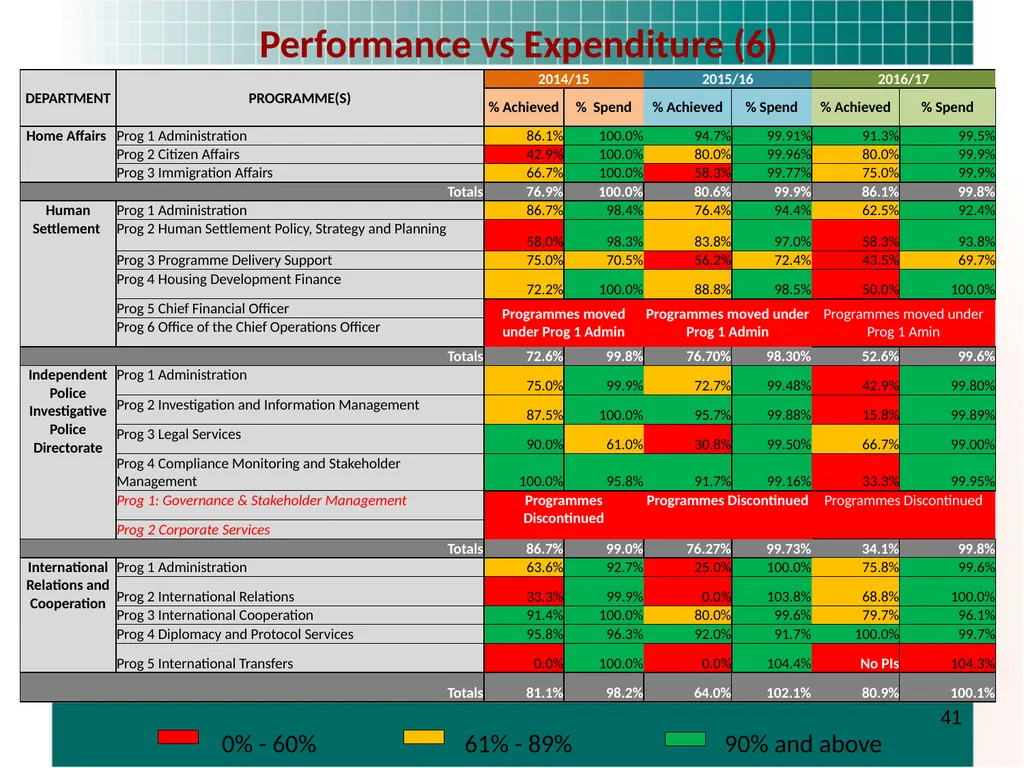
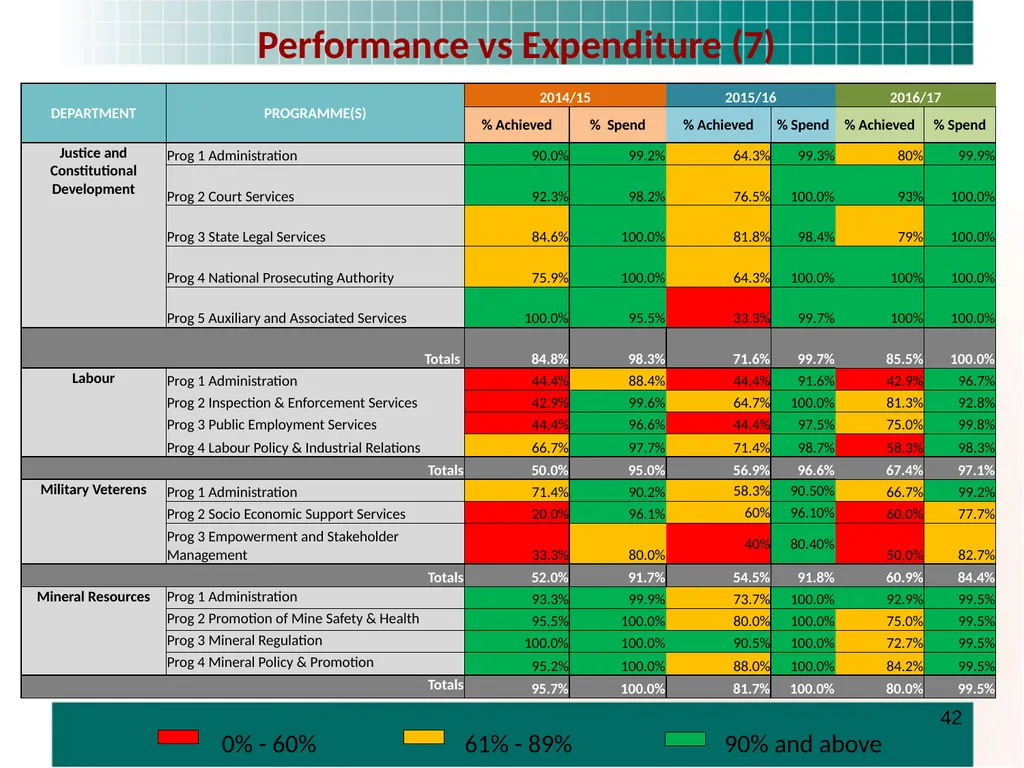
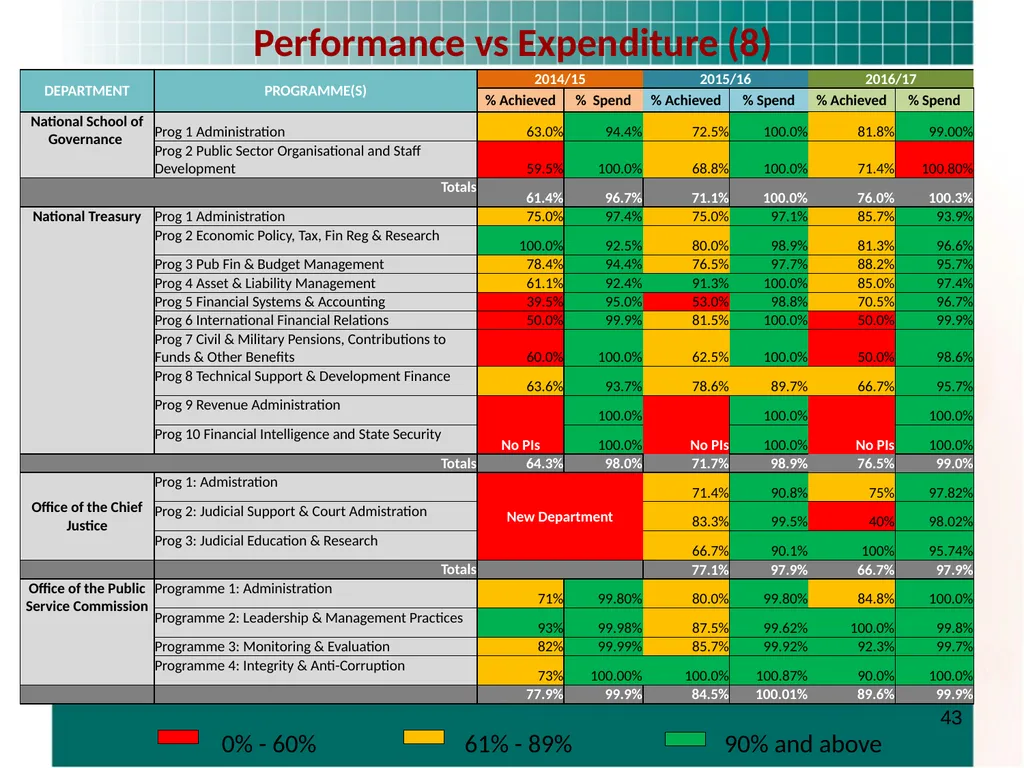
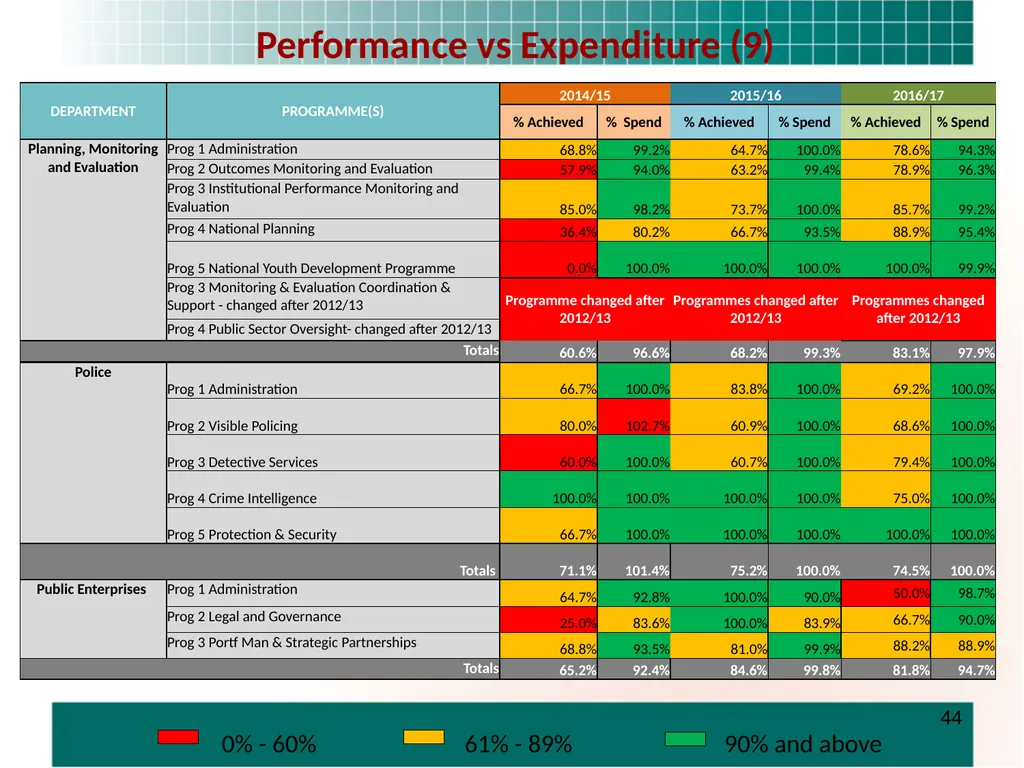
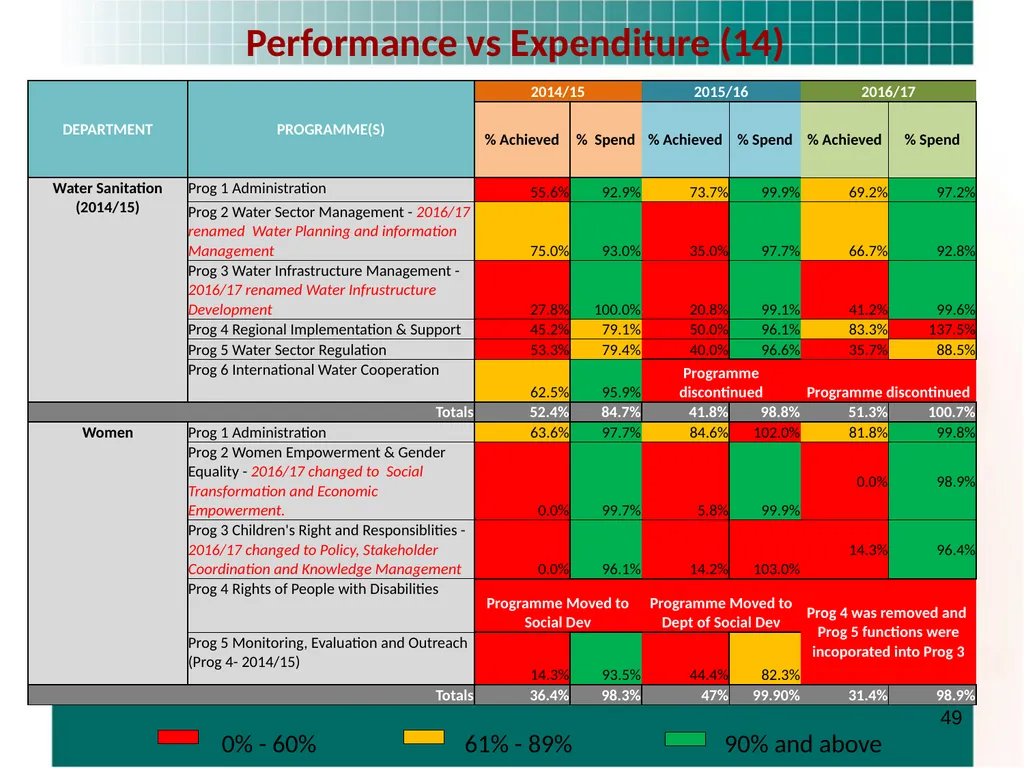
slide35. Performance vs. Expenditure (3) With the name changes, mergers, discontinuation and introduction of new programmes it is difficult to establish a trend in the performance of the national departments. Of the 47 departments, 16 (34%) have made changes to programmes over the last 3 FYs.
Nevertheless, there were noteworthy declines detected in the overall performance of the following departments for 2016/17: 35 The 16 depts. are Arts and Culture, Civilian Secretariat, Comms and GCIS, Cooperative Governance and Traditional Affairs, Economic Dev, Energy, Higher Education, Human Settlement, IPID, Sport and Recreation, The Presidency, Trade and Industry, Water and Sanitation, and Women.<br>
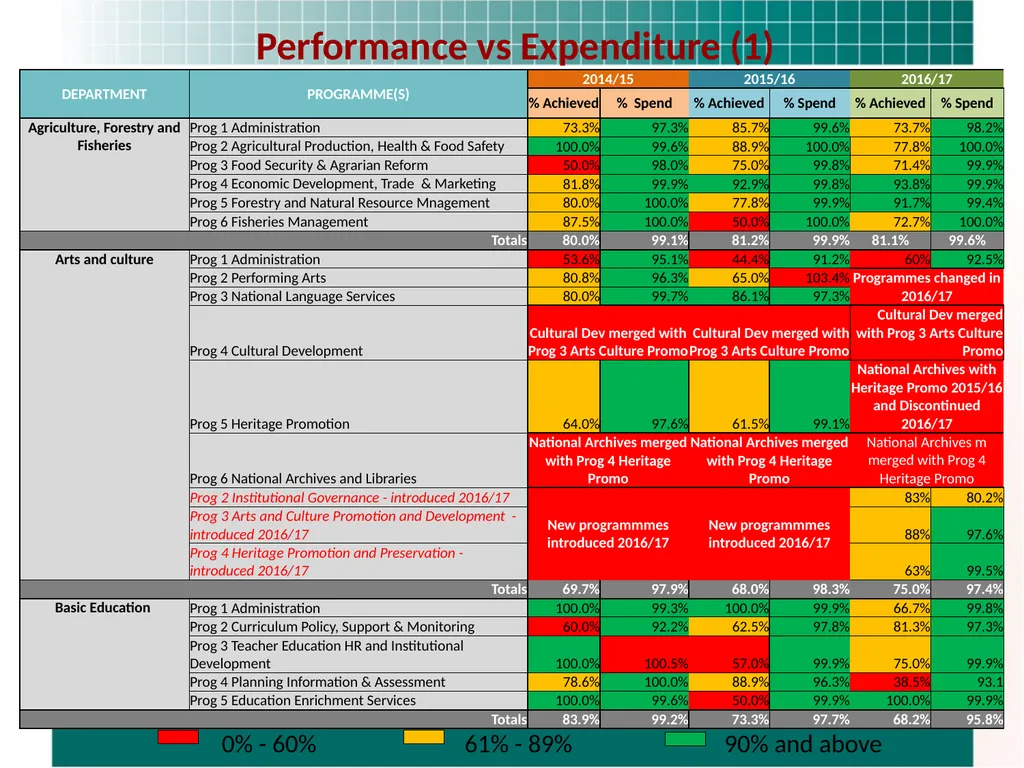
slide36. 36 Performance vs Expenditure (1)<br>
slide37. 37 Performance vs Expenditure (2)<br>
slide38. 38 Performance vs Expenditure (3)<br>
slide39. 39 Performance vs Expenditure (4)<br>
slide40. 40 Performance vs Expenditure (5)<br>
slide41. 41 Performance vs Expenditure (6)<br>
slide42. 42 Performance vs Expenditure (7)<br>
slide43. 43 Performance vs Expenditure (8)<br>
slide44. 44 Performance vs Expenditure (9)<br>
slide45. 45 Performance vs Expenditure (10)<br>
slide46. 46 Performance vs Expenditure (11)<br>
slide47. 47 Performance vs Expenditure (12)<br>
slide48. 48 Performance vs Expenditure (13)<br>
slide49. 49 Performance vs Expenditure (14)<br>
slide50. Annexure B
Financial Misconduct 50<br>
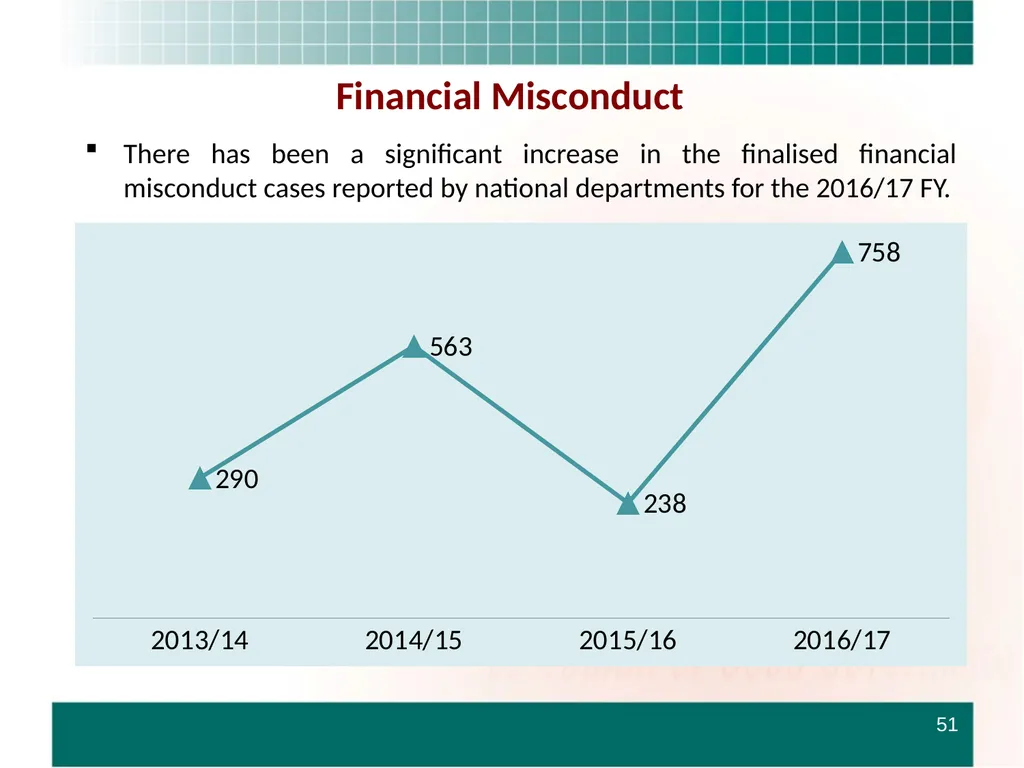
slide51. 51 Financial Misconduct There has been a significant increase in the finalised financial misconduct cases reported by national departments for the 2016/17 FY.<br>
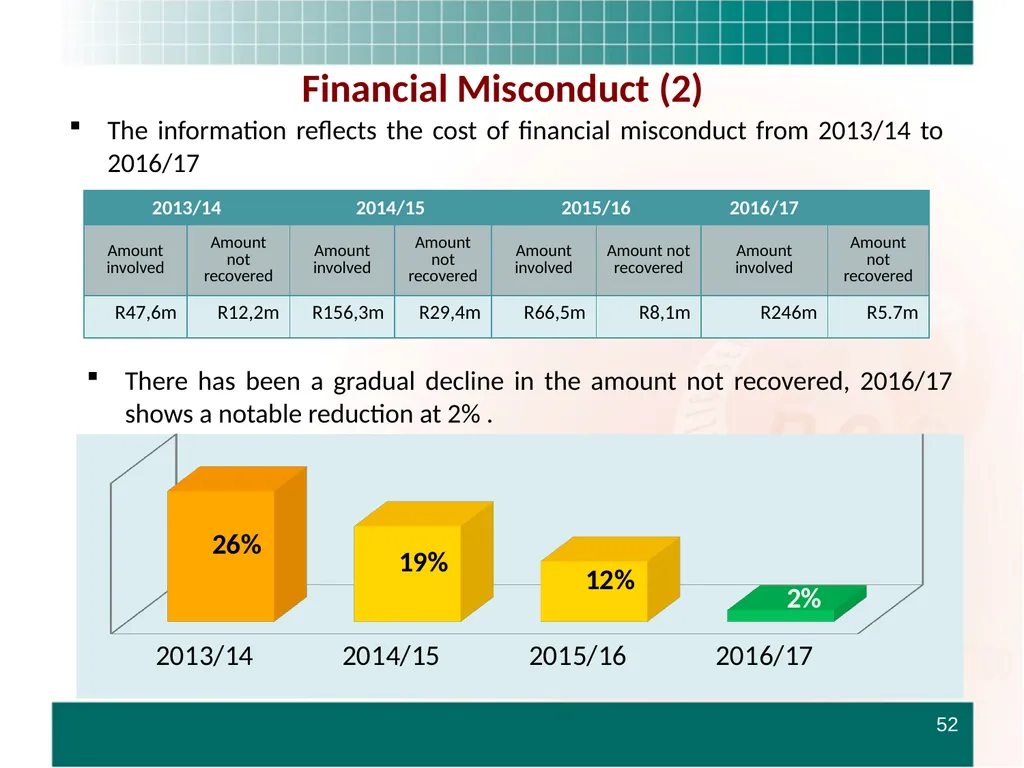
slide52. 52 Financial Misconduct (2) The information reflects the cost of financial misconduct from 2013/14 to 2016/17 There has been a gradual decline in the amount not recovered, 2016/17 shows a notable reduction at 2% .<br>
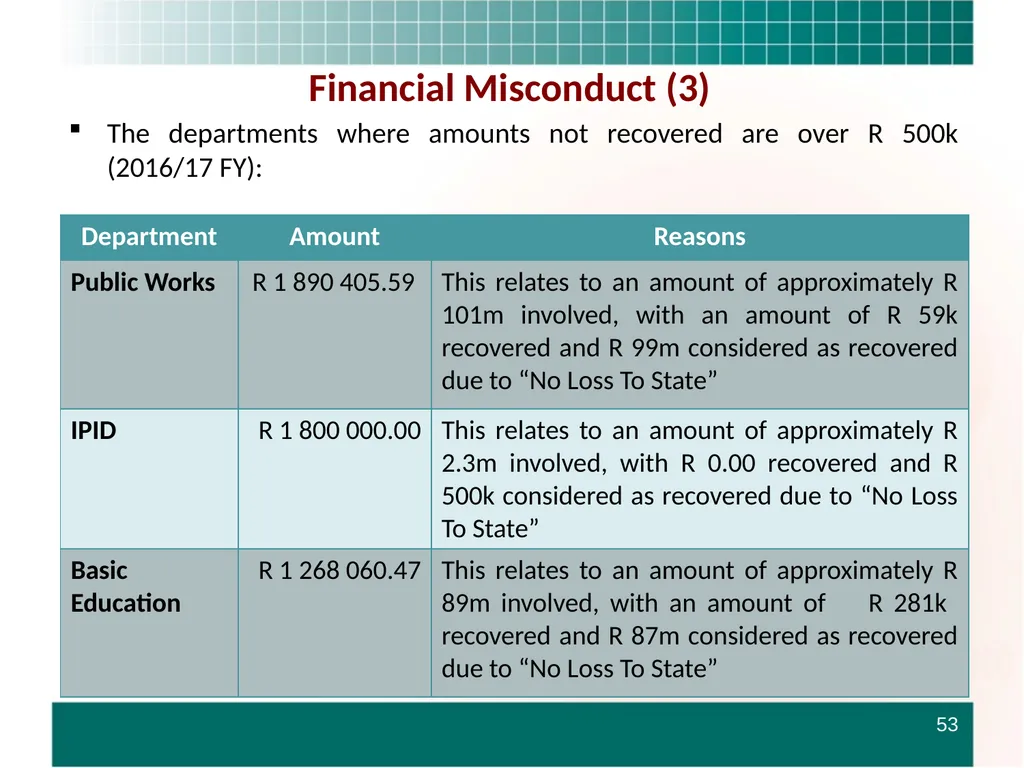
slide53. 53 Financial Misconduct (3) The departments where amounts not recovered are over R 500k (2016/17 FY):<br>
slide54. Annexure C
Performance Management 54<br>
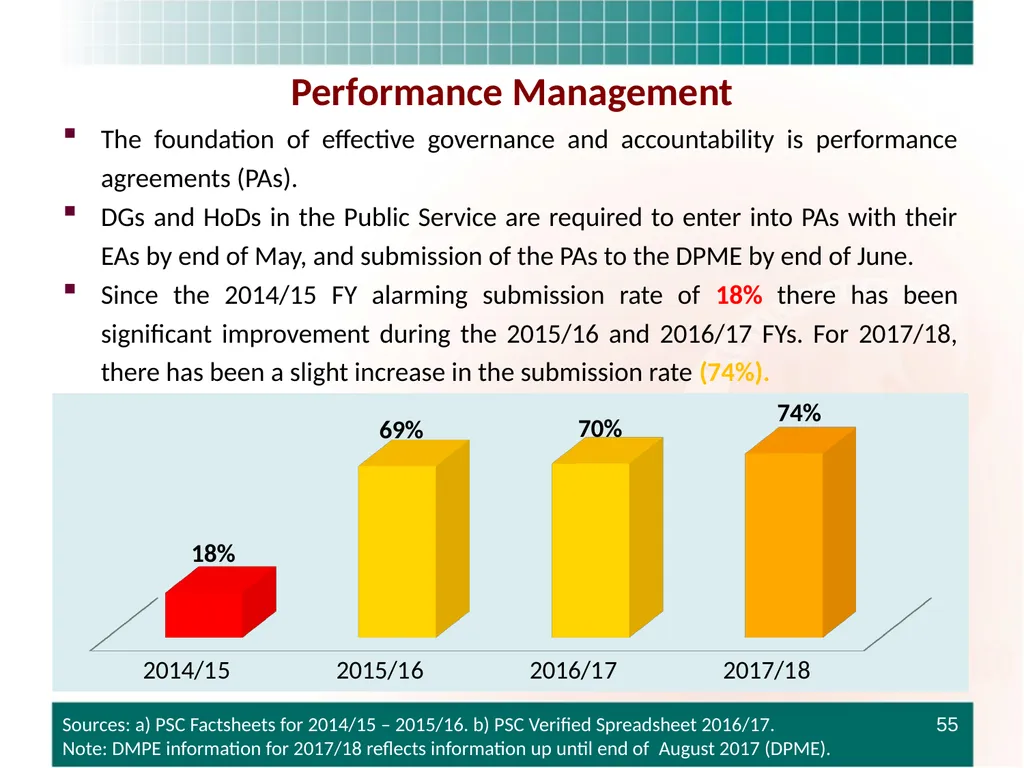
slide55. The foundation of effective governance and accountability is performance agreements (PAs).
DGs and HoDs in the Public Service are required to enter into PAs with their EAs by end of May, and submission of the PAs to the DPME by end of June.
Since the 2014/15 FY alarming submission rate of 18% there has been significant improvement during the 2015/16 and 2016/17 FYs. For 2017/18, there has been a slight increase in the submission rate (74%). 55 Performance Management Sources: a) PSC Factsheets for 2014/15 – 2015/16. b) PSC Verified Spreadsheet 2016/17.
Note: DMPE information for 2017/18 reflects information up until end of August 2017 (DPME).<br>
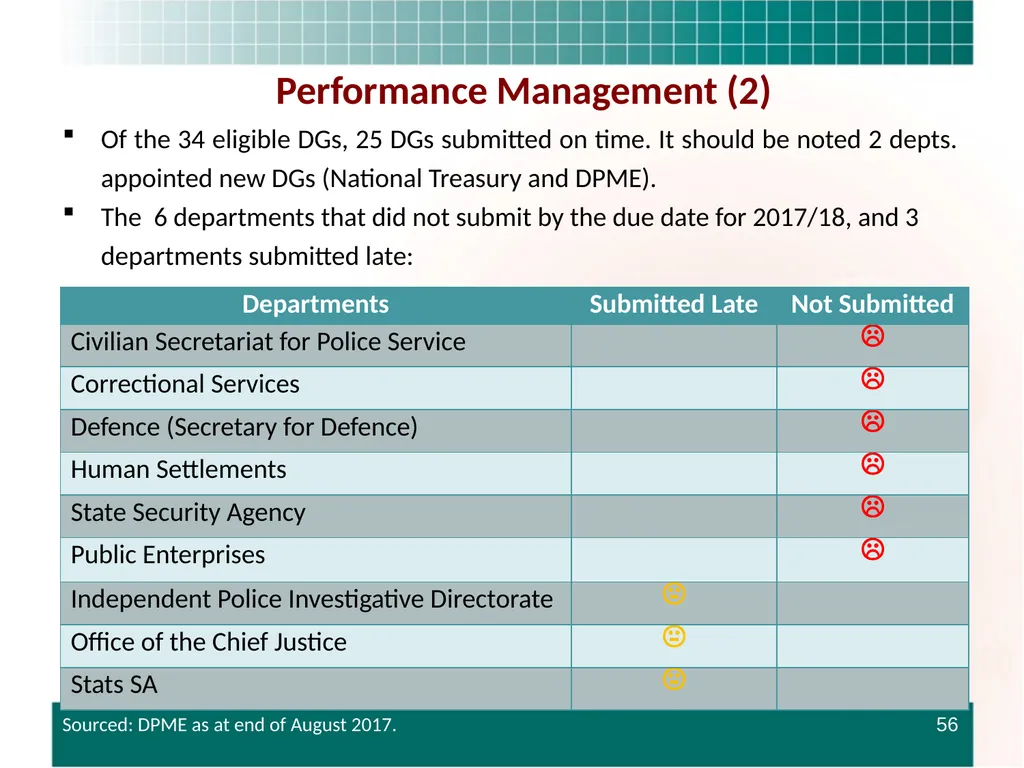
slide56. Of the 34 eligible DGs, 25 DGs submitted on time. It should be noted 2 depts. appointed new DGs (National Treasury and DPME).
The 6 departments that did not submit by the due date for 2017/18, and 3 departments submitted late: 56 Performance Management (2) Sourced: DPME as at end of August 2017.<br>
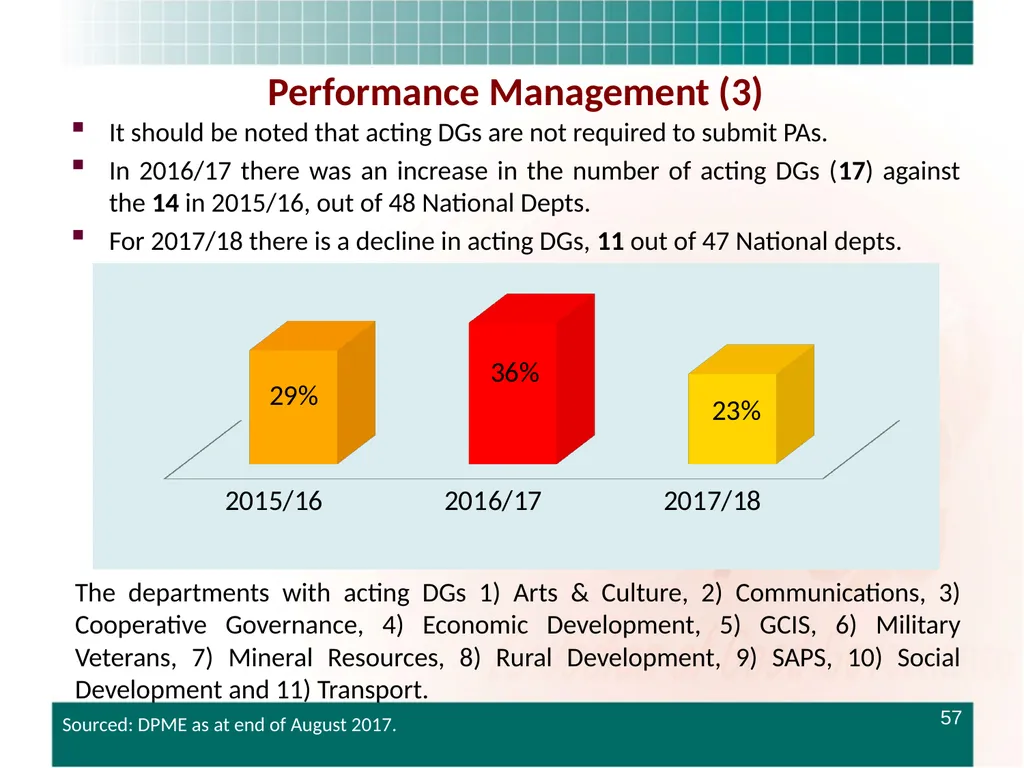
slide57. It should be noted that acting DGs are not required to submit PAs.
In 2016/17 there was an increase in the number of acting DGs (17) against the 14 in 2015/16, out of 48 National Depts.
For 2017/18 there is a decline in acting DGs, 11 out of 47 National depts. 57 Performance Management (3) The departments with acting DGs 1) Arts & Culture, 2) Communications, 3) Cooperative Governance, 4) Economic Development, 5) GCIS, 6) Military Veterans, 7) Mineral Resources, 8) Rural Development, 9) SAPS, 10) Social Development and 11) Transport. Sourced: DPME as at end of August 2017.<br>
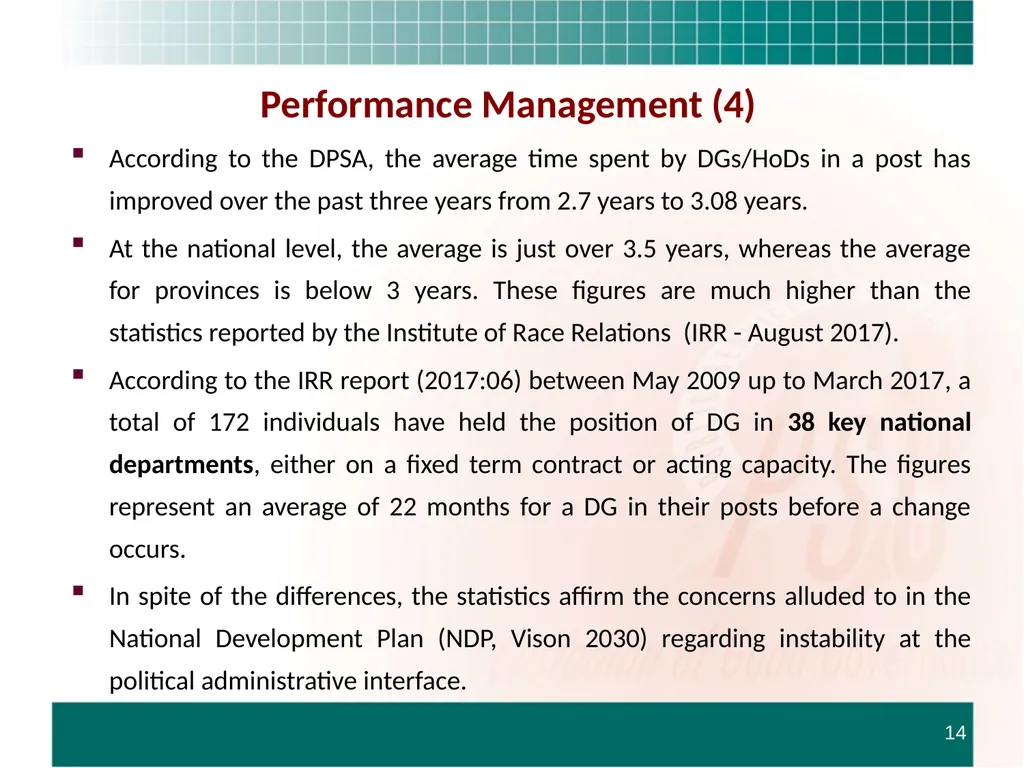
slide58. Performance Management (4) According to the DPSA, the average time spent by DGs/HoDs in a post has improved over the past three years from 2.7 years to 3.08 years.
At the national level, the average is just over 3.5 years, whereas the average for provinces is below 3 years. These figures are much higher than the statistics reported by the Institute of Race Relations (IRR - August 2017).
According to the IRR report (2017:06) between May 2009 up to March 2017, a total of 172 individuals have held the position of DG in 38 key national departments, either on a fixed term contract or acting capacity. The figures represent an average of 22 months for a DG in their posts before a change occurs.
In spite of the differences, the statistics affirm the concerns alluded to in the National Development Plan (NDP, Vison 2030) regarding instability at the political administrative interface. 14<br>
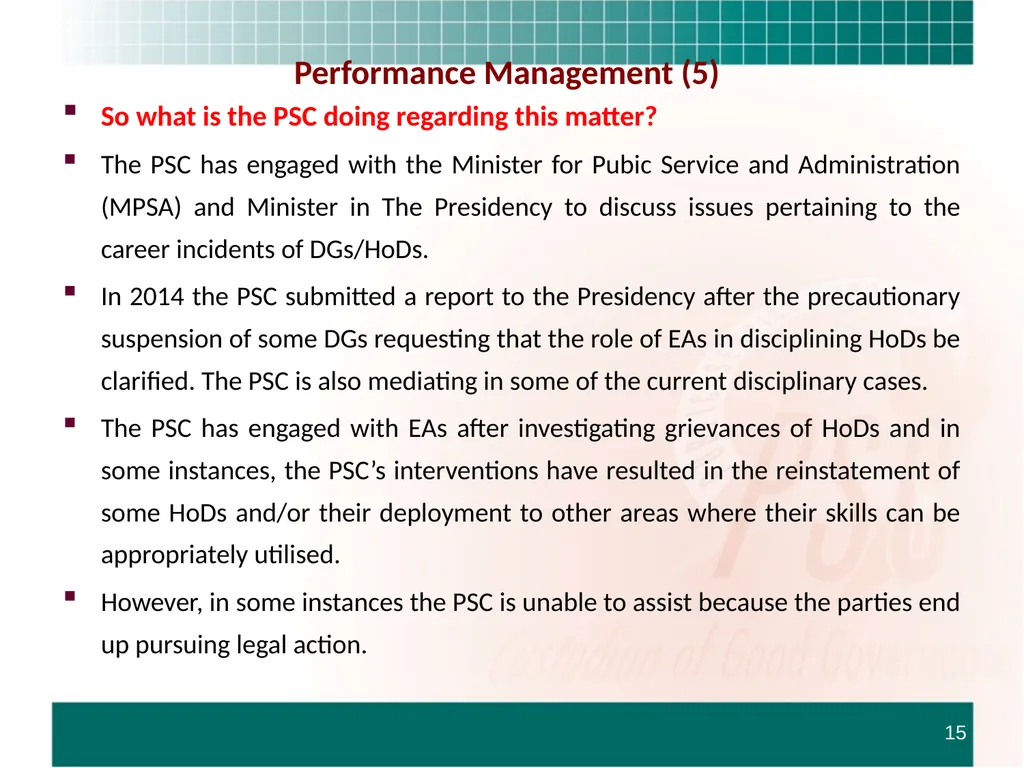
slide59. Performance Management (5) So what is the PSC doing regarding this matter?
The PSC has engaged with the Minister for Pubic Service and Administration (MPSA) and Minister in The Presidency to discuss issues pertaining to the career incidents of DGs/HoDs.
In 2014 the PSC submitted a report to the Presidency after the precautionary suspension of some DGs requesting that the role of EAs in disciplining HoDs be clarified. The PSC is also mediating in some of the current disciplinary cases.
The PSC has engaged with EAs after investigating grievances of HoDs and in some instances, the PSC’s interventions have resulted in the reinstatement of some HoDs and/or their deployment to other areas where their skills can be appropriately utilised.
However, in some instances the PSC is unable to assist because the parties end up pursuing legal action. 15<br>
slide60. Annexure D
Precautionary Suspensions 60<br>
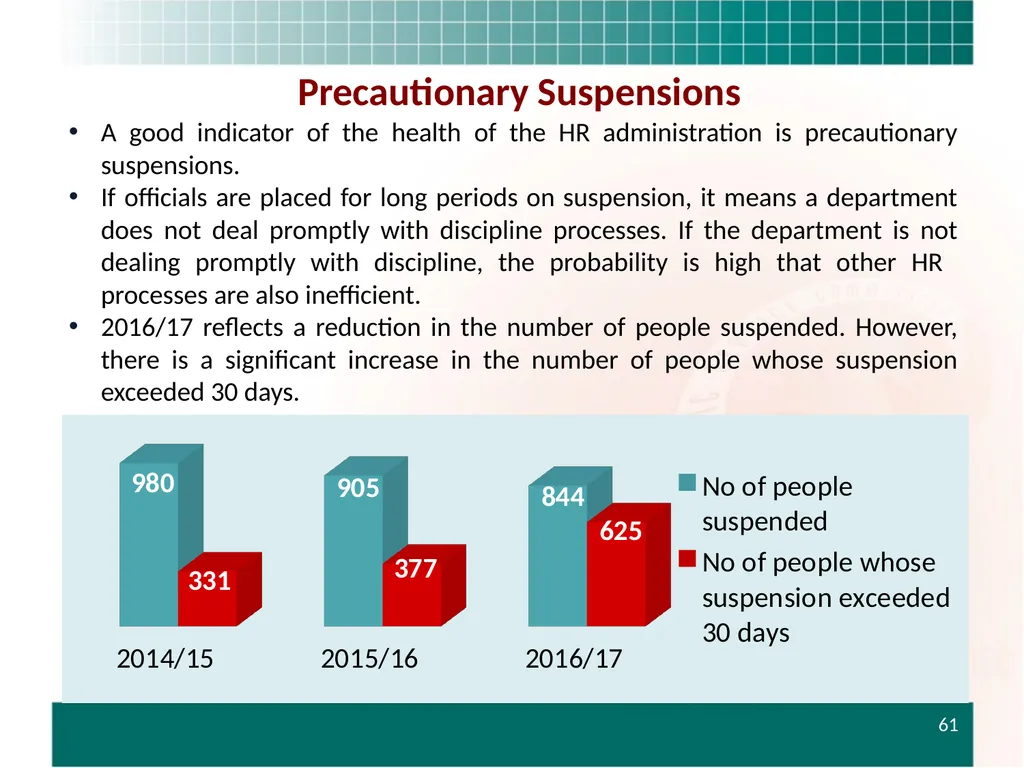
slide61. 61 A good indicator of the health of the HR administration is precautionary suspensions.
If officials are placed for long periods on suspension, it means a department does not deal promptly with discipline processes. If the department is not dealing promptly with discipline, the probability is high that other HR processes are also inefficient.
2016/17 reflects a reduction in the number of people suspended. However, there is a significant increase in the number of people whose suspension exceeded 30 days. Precautionary Suspensions<br>
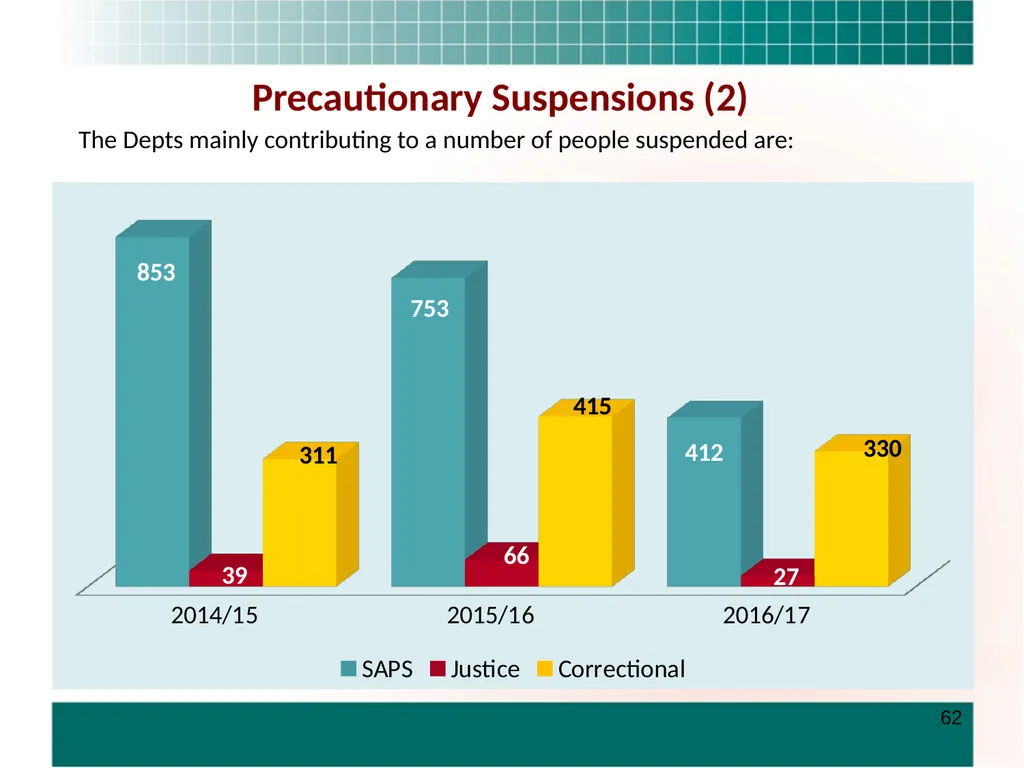
slide62. Precautionary Suspensions (2) 62 The Depts mainly contributing to a number of people suspended are:<br>
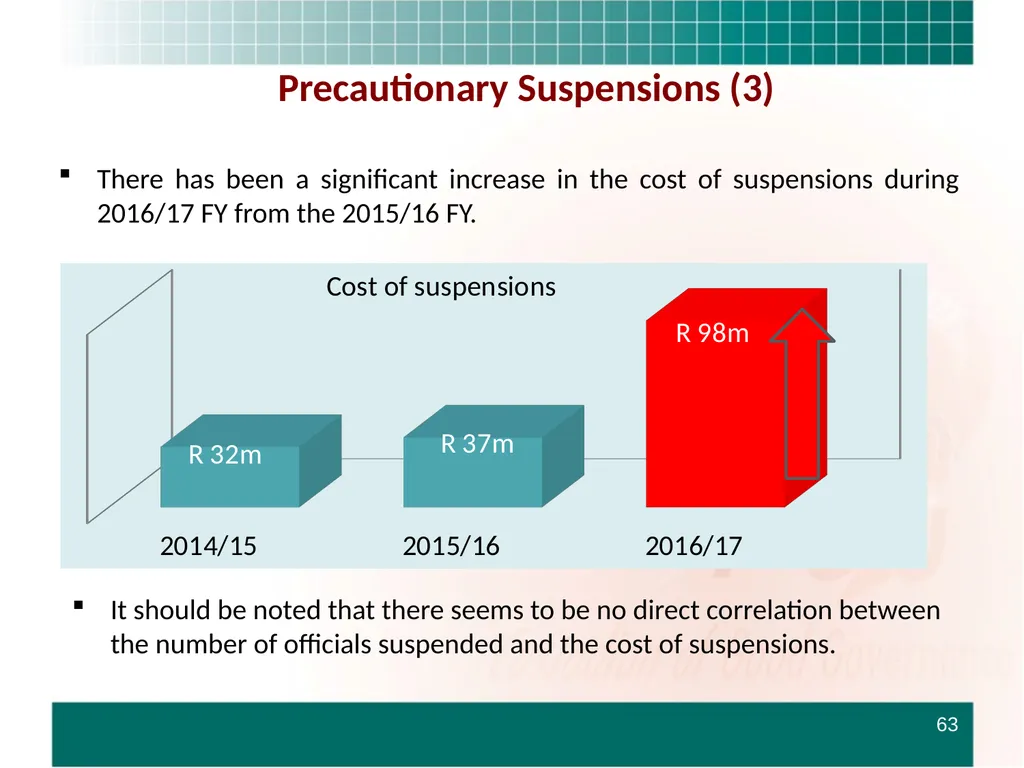
slide63. 63 Precautionary Suspensions (3) There has been a significant increase in the cost of suspensions during 2016/17 FY from the 2015/16 FY. It should be noted that there seems to be no direct correlation between the number of officials suspended and the cost of suspensions.<br>
slide64. Annexure E
Utilisation of Consultants 64<br>
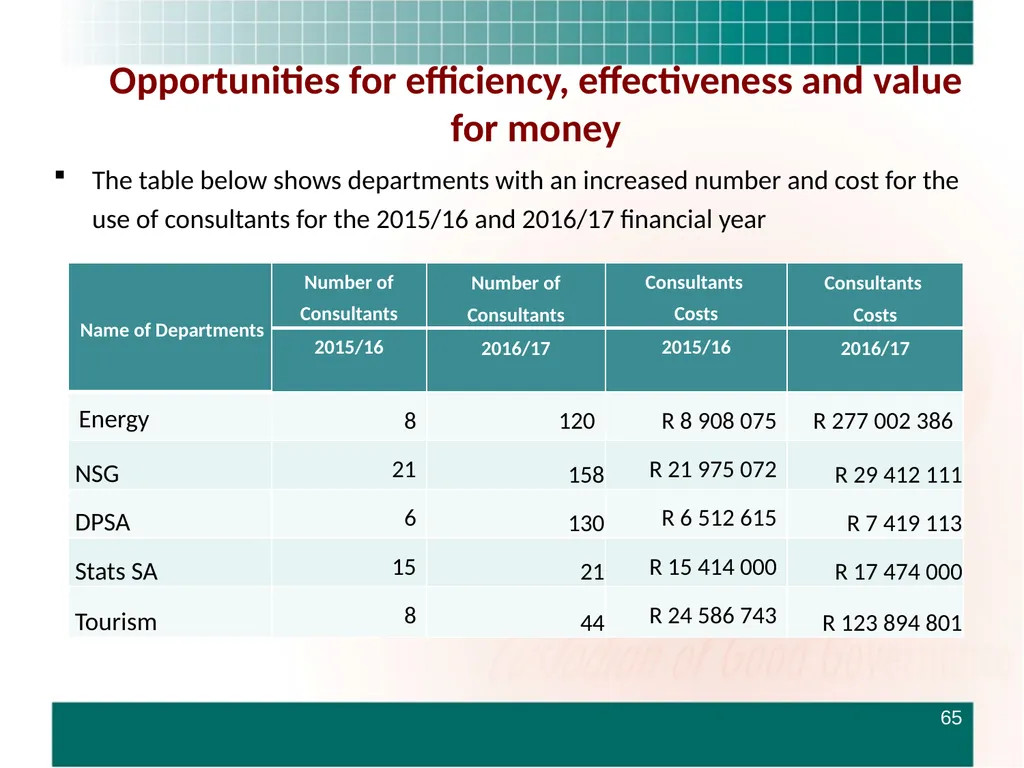
slide65. Opportunities for efficiency, effectiveness and value for money The table below shows departments with an increased number and cost for the use of consultants for the 2015/16 and 2016/17 financial year 65<br>
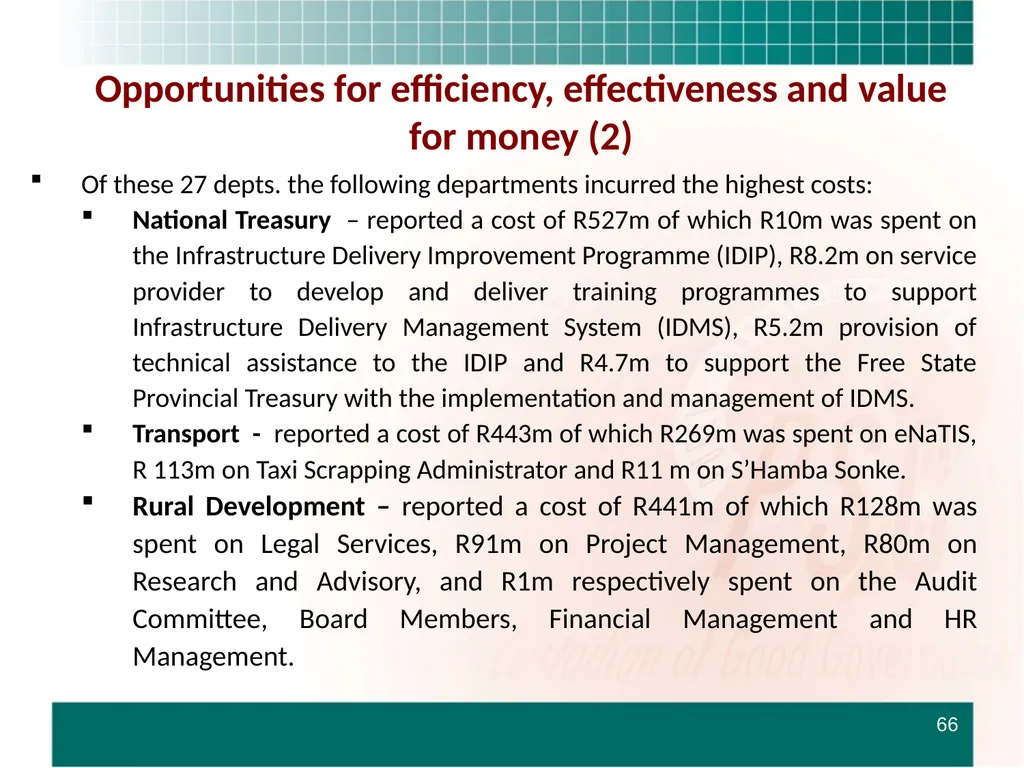
slide66. 66 Of these 27 depts. the following departments incurred the highest costs:
National Treasury – reported a cost of R527m of which R10m was spent on the Infrastructure Delivery Improvement Programme (IDIP), R8.2m on service provider to develop and deliver training programmes to support Infrastructure Delivery Management System (IDMS), R5.2m provision of technical assistance to the IDIP and R4.7m to support the Free State Provincial Treasury with the implementation and management of IDMS.
Transport - reported a cost of R443m of which R269m was spent on eNaTIS, R 113m on Taxi Scrapping Administrator and R11 m on S’Hamba Sonke.
Rural Development – reported a cost of R441m of which R128m was spent on Legal Services, R91m on Project Management, R80m on Research and Advisory, and R1m respectively spent on the Audit Committee, Board Members, Financial Management and HR Management. Opportunities for efficiency, effectiveness and value for money (2)<br>
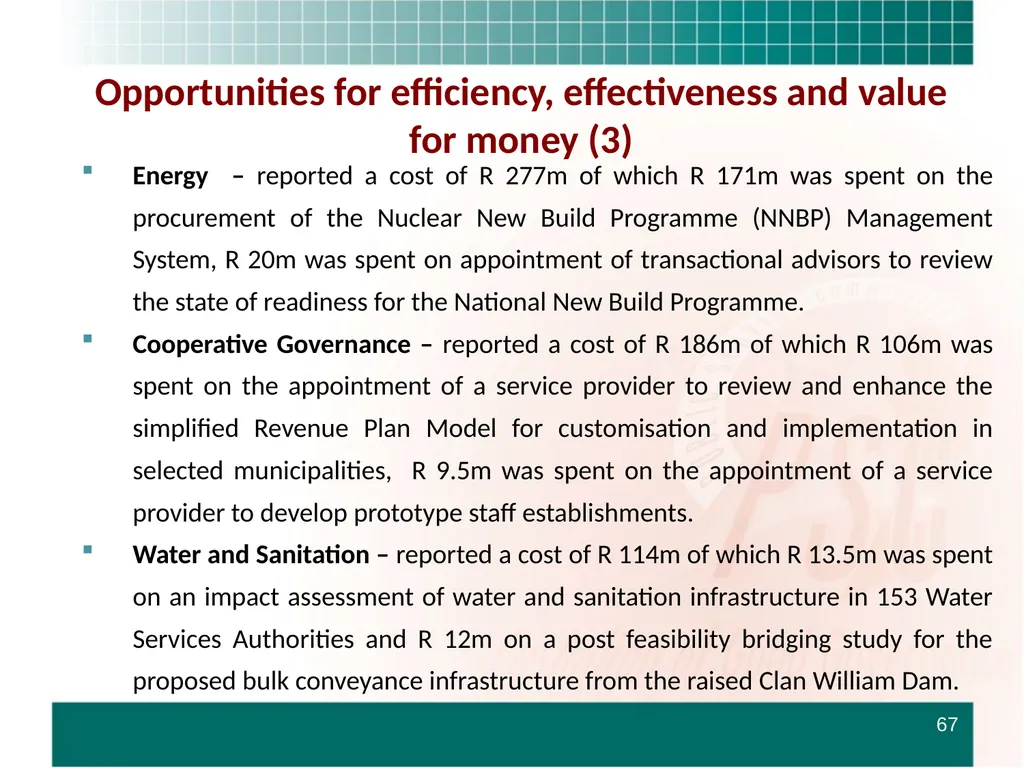
slide67. 67 Energy – reported a cost of R 277m of which R 171m was spent on the procurement of the Nuclear New Build Programme (NNBP) Management System, R 20m was spent on appointment of transactional advisors to review the state of readiness for the National New Build Programme.
Cooperative Governance – reported a cost of R 186m of which R 106m was spent on the appointment of a service provider to review and enhance the simplified Revenue Plan Model for customisation and implementation in selected municipalities, R 9.5m was spent on the appointment of a service provider to develop prototype staff establishments.
Water and Sanitation – reported a cost of R 114m of which R 13.5m was spent on an impact assessment of water and sanitation infrastructure in 153 Water Services Authorities and R 12m on a post feasibility bridging study for the proposed bulk conveyance infrastructure from the raised Clan William Dam. Opportunities for efficiency, effectiveness and value for money (3)<br>
slide68. 7 May 2018 68 Thank you
Siyabonga PSC Website: www.psc.gov.za
National Anti-Corruption Hotline for the Public Service:
0800 701 701<br>
slide2. OUTLINE OF THE PRESENTATION PSC Mandate
Areas of Oversight
Outputs of Oversight Function
SCOA Requested Information
Concluding Remarks
Annexures
A. Budget vs Performance for National Departments
B. Financial Misconduct
C. Performance Management
D. Precautionary Suspensions
E. Utilisation of Consultants 2<br>
slide3. PSC MANDATE 3 The Public Service Commission’s priorities are based on its Constitutional imperative of oversight, which is focused on performance and transformation of the Public Service.
In executing the PSC’s mandate the Commission takes cognizance of the Constitution, National Development Plan (NDP), Parliamentary resolutions, Cabinet mandates and the SONA.
The outcomes approach as developed by Government also provide a framework used by the PSC to assist in its prioritisation and strategic approach. In particular, the PSC contributes to Outcome 12: “An efficient, effective and development-oriented Public Service”.
Apart from its key priorities, the PSC continues to engage with Executive Authorities, HoDs, PC on Public Service and Administration as well as Planning, Monitoring and Evaluation, and other stakeholders on its reports so as to ensure the implementation of its recommendations.<br>
slide4. AREAS OF OVERSIGHT
(INVESTIGATION, MONITORING AND EVALUATION MANDATE) 4 The Constitutional oversight mandate of the PSC is wide and, in summary, covers the following areas:
Organisation of the public service (the structural arrangements of departments in the Public Service)
Administration of the public service (all the procedures, policy frameworks, accountability mechanisms, etc. that ensure the functioning of the Public Service)
Personnel practices of the public service (e.g. recruitment, transfers, promotions and dismissals)
Adherence to applicable procedures in the public service (compliance with the letter and spirit of prescribed rules / policies / procedures)
The extent to which the values and principles set out in section 195 of the Constitution are complied with 4<br>
slide5. OUTPUTS OF OVERSIGHT FUNCTION 5 Advise
On own accord or on receipt of any complaint, national and provincial organs of state regarding personnel practices in the public service, including those relating to the recruitment, appointment, transfer, discharge and other aspects of the careers of employees in the Public Service (S 196 (4)(f)).
Recommend
Appropriate remedies regarding the resolution of grievances of employees in the public service (S 196 (4)(f)).
That executive authorities act in terms of a particular provision(s) of the Public Service Act or any other law (PS Act S 35) in resolving a particular grievance.
Propose measures
To ensure effective and efficient performance within the Public Service (S 196(4)(c)).<br>
slide6. OUTPUTS OF OVERSIGHT FUNCTION (2) 6 Give directions
Aimed at ensuring that personnel procedures relating to recruitment, transfers, promotions and dismissals comply with the values and principles set out in section 195 (S 196 (4)(d)).
To ensure compliance with the Public Service Act and in order to provide advice to promote sound public administration (PS Act S 5 (8)(a)).
These directions are binding on executive authorities or heads of department, as the case may be, and should be implemented within 60 days (PS Act S 5 (8)(a) and (b)).<br>
slide7. PRESENTATION COVERS The PSC will present on the following –
Discuss the 2018 Appropriation Bill with regard to the issues pertaining to the mandate of the PSC.
Key Indicators Monitored by the PSC.
An assessment of strategies available to significantly improve administration practices in the public services especially in high education so as to ensure fee free education is effectively executed.
Budgets versus performance for national departments (Annexure A). 7<br>
slide8. PRESENTATION COVERS (2) Data used-
Annual Reports (2016/17) – still not available at the time of compilation of this presentation:
Environmental Affairs
PSC database, factsheets, in particular the following research reports:
Analytical Brief on the Utilisation of Consultants
Analytical Brief on the 30 Days Payment of Invoices
Assessment of the Effectiveness of Public and Private Partnerships in the delivery of Health Services
Evaluation of the role of Agencification in Public Service Delivery 8<br>
slide9. PRESENTATION COVERS (3) Annexures to the presentation reflects information presented to the SCOA on the 8th of November 2017, currently no updated information is available on the following areas:
Financial Misconduct – 2017/18 financial year information will be available in November 2018
Performance vs expenditure - new information will be available from September 2018 (release of the 2017/18 Annual Reports)
Precautionary suspensions - new information will be available from September 2018 (release of the 2017/18 Annual Reports)
Utilisation of Consultants - new information will be available from September 2018 (release of the 2017/18 Annual Reports) 9<br>
slide10. INTRODUCTION 10 The PSC does not have comprehensive research on all the areas requested. The comments should therefore be viewed with this limitation in mind.
Nevertheless, the PSC has built a data sourcing and analytical capability with the 9 values governing public administration as frame, and this enables the Commission to provide necessary comments.
Government’s spending plans aims to reignite growth and chart a course towards achieving the NDP objectives and fulfilling the constitutional obligations.
The 2018 Budget directs spending to the national priorities; educating the youth, protecting the vulnerable and investing in enablers of inclusive growth.
However, this presentation does not comment on this prioritisation.<br>
slide11. 11 As alluded to in the Budget Speech, to create a conducive environment for public governance, its essential that the political and administrative interface challenges be addressed, as they create instability within departments.
The contention between the political and administrative Heads has both policy and strategic direction implications, which in turn negatively impacts performance and service delivery. This means the ship is being steered in two different directions with huge costs implications.
This disjuncture creates an breeding ground for maladministration and mismanagement of funds.
Corruption undermines good governance, legitimacy and credibility of the state, sound and functional institutions as well as effective operation of government. It further hampers development efforts, economical growth and has far reaching financial implications on the available budget. GENERAL COMMENTS IN RELATION TO PSC MANDATE<br>
slide12. 12 The pledge to confront allegations of state capture through the Judicial Commission of Inquiry is clearly shown. Yet, the Bill is silent on the financial considerations for the investigation agencies such as the Hawks and the Asset Forfeiture Unit (AFU).
Furthermore, the Bill shows no consideration for the Anti-Corruption structures such as the National Anti-Corruption Forum led by the Minister of Public Service and Administration (MPSA) and the PSC.
With the expenditure cuts it is vital that the duplication of functions between departments be addressed, with the focus on how departments can minimise the inevitable negative impact of these cuts on performance and service delivery. GENERAL COMMENTS IN RELATION TO PSC MANDATE (2)<br>
slide13. 13 Better accountability of State Owned Enterprises (SoEs) is crucial for service delivery and the broader transformation of the state.
The PSC fully supports the Presidential Review Commission (PRC) that a greater degree of centralisation of the ownership function is required to ensure good governance.
There is a need to rationalise the number of SoEs against their mandates to determine the validity and return of investment made by Government.
Oversight departments should take their role and responsibilities seriously to ensure effective and efficient management of SoEs, as most of the entities are self-managing.
The PSC is in total agreement that the bail-outs are not a solution but rather an enabler, which only causes operational inefficiencies and financial burden on the state. GENERAL COMMENTS IN RELATION TO PSC MANDATE (3)<br>
slide14. 14 GENERAL COMMENTS IN RELATION TO PSC MANDATE (4) It is essential that Government reviews and assesses the impact of the establishment of the agencies (agencification) and Public and Private Partnerships (PPPs):
The impact on the fiscus (all related cost of agencies and partnerships). The costs of the specific PPP (e.g. Albert Luthuli) is modelled but not the financial implication for the budgets of all the other hospitals. We create a Rolls-Royce for one hospital to the detriment of all the others.
Agency mandates in relation to the departments’ mandates: are these agencies delivering the Constitutional mandate and functions of the departments (possible duplications)?
Measure the return on investment.
PSC inspected various border posts, aimed to assess the service delivery and infrastructural challenges. The Department of Home Affairs presented the establishment of the Border Management Agency (BMA), as a possible solution.
Parliament passed the Bill on 06 June 2017. This move has a potential pressure budget of R12 billion per year.<br>
slide15. 15 KEY INDICATORS MONITORED BY THE PSC Evidence presented focuses on:
Financial Disclosure Framework
Payment of Invoices
Utilisation of Consultants<br>
slide16. 16 Financial Disclosure Framework The Financial Disclosure Framework (FDF) was introduced (1999) to safeguard public confidence and manage public servants conflict of interest. This Framework facilitates public scrutiny.
All SMS members are required to disclose the particulars of all their registrable interests (e.g. companies and properties) to their respective Executive Authorities (EAs) by not later than 30 April each year.
For 2017/18 reporting year, the compliance rate for the 2016/17 financial year is 99%. NOTE: Years refers to the reporting year and figures/numbers reflects the previous financial year results. This means each reporting year reports on the previous financial year.<br>
slide17. Non-Compliance with financial disclosure framework The number of forms received shows a 99% compliance rate.
Noteworthy is the decline in the number of departments that have achieved a 100% submission rate by the end of the respective reporting financial year (31 March) – from the 83% to a 72% (-11%). 17 The need for the identification of potential conflicts of interest is based on the likelihood that SMS members could use state resources to further private interests.
For instance, a direct clash between private interests of an individual and official responsibilities as public servants could influence them to improperly discharge their official duties and responsibilities.<br>
slide18. Procurement is central to government service delivery system and can therefore be used to achieve socio-economic objectives such as stimulating economic activity and alleviating national disparities.
Government is mindful of the importance of Small Medium and Micro Enterprises (SMMEs) and the role it plays in inclusive economic growth and job creation.
Cabinet has noted with concern non-compliance and its devastating impact of non-payment of suppliers within 30 days on SMMEs and its impact on service delivery.
The existing institutional arrangements are:
Office of Accountant General (OAG) at NT, Special Unit established within the DPME, the Office of the Chief Procurement Officer (OCPO) at NT, and Small Enterprise Development Agency (SEDA).
Despite these initiatives the non-payment of suppliers remain a challenge, stifling economic growth and job creation in the SMMEs sector. 18 Payment of Invoices<br>
slide19. Payment of Invoices (2) Number invoices older than 30 days not paid for quarters 1, 2 and 3 for the 2017/18 financial year: 19<br>
slide20. Payment of Invoices (3) Value of invoices older than 30 days not paid for quarters 1, 2 and 3 for the 2017/18 financial year: 20<br>
slide21. Payment of Invoices (4) The following departments are the main transgressors contributing significantly to the 11 081 invoices not paid by the end of Dec 2017: 21 The non-payment of invoices is indicative of a much bigger problem within departments characterised by amongst others poor financial management (lack of budgets), poor contract management, lack of internal controls, and non-adherence to supply chain management processes.
The PSC is in the process of summonsing the top 5 HOD/DGs of defaulting departments that have not paid invoices timeously.
The culture of non-payment is further demonstrated at inter-governmental level, where departments are in debt to the Office of the State Attorney to the amount of R1.1billion.*
Similarly the amount owned to municipalities by department at the end of Sept 2017 was R 7.4billion.# * Report on Outstanding Litigation Claims to Debtor Departments, dated 7 February 2018
# Government Debt Owed to Municipalities, National Inter-Governmental Forum (NIGF), dated 13 April 2018<br>
slide22. Utilisation of Consultants The use of consultants by Government was initially seen as an intervention to address the skills and capacity gap and fast track the implementation of priority programmes in departments.
However, this intervention has created a reliance on consultants to deliver on department’s mandates.
The reality is that with the utilisation of consultants, the PS has not yet seen the return of investment, in terms of skills and knowledge transfer to public servants.
Departments are still dealing with a lack of capacity or competencies to deliver on their mandates. 22<br>
slide23. Utilisation of Consultants (2) Over the last 2 financial years (2015/16 and 2016/17) there has been a slight decline (1.5% reduction from the 2015/16) in the number of consultants used.
However, the number of consultants should be closely monitored, as departments are becoming creative in the reporting of consultants utilised.
For instance, consultants are absorbed as employees additional to the establishment to reflect a reduction in the number and costs of consultants. 23<br>
slide24. Utilisation of Consultants (3) A significant decline is noted in the cost of consultants, from R4.2bn in 2015/16 to R2.8bn in 2016/17.
This decline could be attributed to Government’s cost containment measures and also a shift in budget expenditure from consultants to compensation of employees.
The shift refers to the consultants who are appointed as employees additional to the establishment. Further to this, the decline in the costs can be attributed to the reduction in consulting days. 24<br>
slide25. Utilisation of Consultants (4) There is a noteworthy gap in the legislative framework, which provides reporting requirements and guidelines for departments, with particular reference to the management and use of consultants.
The Public Service Regulations (PSR) of 2001 defines the requirements for annual reporting for the utilisation of consultants. However, the amended 2016 PSR does not make any provision for reporting on the utilisation of consultants. 25 The limitation is that these sections of the PFMA do not explicitly state the reporting requirements regarding the utilisation of consultants.
This creates a loophole in terms of the enforceability with regard to how departments are expected to effectively and transparently report on this matter.
This loophole creates a gap in the overall financial management reporting of departments to ensure that budgets are appropriately spent, which in turn can lead to mismanagement of funds.<br>
slide26. 26 Planning and Reporting
Budgeting and costing should become an integral part of the departmental planning and reporting, for both the Medium Term Strategic Framework (MTSF) and annual performance plans (APPs) cycles.
All policies and integrated plans should be costed for, not just focused on annual implementation costs but the projected costs for the MTSF cycle.
For instance, the planned Joint Health Action Plan (per the Budget Speech) should provide a clear indication of the budget contributions from the National Department of Health and National Treasury including at provincial level.
Annual reporting requirements should include narrative sections for departments to report on spending priorities for period of review and in particular account for expenditure of above 90% when less then 60% of the pre-determined targets are achieved.
Budget-based planning and costing implementation could address the constant requests for additional funds by departments through the adjusted estimated national expenditure (AENE). STRATEGIES AVAILABLE TO SIGNIFICANTLY IMPROVE ADMINISTRATION PRACTICE IN THE PUBLIC SERVICE<br>
slide27. 27 Human Management:
Organisational Design – a review of all departmental organisational structures/establishments should be undertaken.
This review should focus on dealing with duplication of functions within and across departments, and the appointments against an unapproved organisational structure (unapproved organogram).
The reality is that the compensation budget of departments are allocated based on the approved organisational structure.
This gap creates an opportunity for irregular appointments and unnecessary increase to the compensation budget. STRATEGIES AVAILABLE TO SIGNIFICANTLY IMPROVE ADMINISTRATION PRACTICE IN THE PUBLIC SERVICE (2)<br>
slide28. 28 Financial Sector Transformation:
Capacitating the departments – based on the Auditor General findings over the last 3 to 4 financial years it is clear that department do not have the required financial management capacity.
It is essential that a skills audit be conducted in the departments to inform the development of a training programme to be led by the National School of Government (NSG). This undertaking will have costs implications and should be jointly led by the Department of Public Service and Administration (DPSA) and the NSG.
Training programme should include the executive authorities, accounting officers and SMS members, starting with financial officials and responsibility managers.
Financial Misconduct - a clear directive should be provided to all departments by the NT pertaining to actions to be taken by department for officials responsible for the non-payment of service provider within the stipulated timeframe (cases base on merit not blanket approach). STRATEGIES AVAILABLE TO SIGNIFICANTLY IMPROVE ADMINISTRATION PRACTICE IN THE PUBLIC SERVICE (3)<br>
slide29. 29 Fee Free Education
The ring-fencing of budget to deal with the fee-free higher education is a positive response to effectively and efficiently deal with this matter.
However, it can be seen as a potential risk, which should be monitored by the Committee in terms of the long-term sustainability of the budget cuts (across departments) vis-à-vis service delivery and performance, including the provisions for Basic Education.
Furthermore, the ring-fenced budget should be translated into a detailed and costed phased-in policy, to ensure close monitoring and management of implementation, with clear costing drivers. For instance, understanding the demand vs the supply – number of students that need assistance vs student that can be assisted. STRATEGIES AVAILABLE TO SIGNIFICANTLY IMPROVE ADMINISTRATION PRACTICE IN THE PUBLIC SERVICE (5)<br>
slide30. CONCLUDING REMARKS A fine balancing act will be required to manage performance and service delivery, against the expenditure cuts at all spheres of government and the 2016 compensation ceiling arrangement of R15bn to be cut in 2018/19.
Cuts in the national government expenditure, where impact will mostly be felt by large programmes and transfers to public entities will definitely mean initiative financial planning and management.
The issue of duplication of functions between departments is critical in the current budgeting cutting environment.
This starts with addressing the organisational design of departments with specific focus on the funded vs unfunded posts, appointments against unapproved organisation structures and duplication of functions across government. 30<br>
slide31. Annexures 31<br>
slide32. Annexure A
Budget vs Performance of National Departments 32<br>
slide33. Performance vs. Expenditure Ten lowest performing departments for the 2016/17 FY, in respect of the achievement of planned targets (detailed information Appendix A to the presentation): 33<br>
slide34. Performance vs. Expenditure (2) Departments that underspent below the norm of 98%: 34 98%<br>
slide35. Performance vs. Expenditure (3) With the name changes, mergers, discontinuation and introduction of new programmes it is difficult to establish a trend in the performance of the national departments. Of the 47 departments, 16 (34%) have made changes to programmes over the last 3 FYs.
Nevertheless, there were noteworthy declines detected in the overall performance of the following departments for 2016/17: 35 The 16 depts. are Arts and Culture, Civilian Secretariat, Comms and GCIS, Cooperative Governance and Traditional Affairs, Economic Dev, Energy, Higher Education, Human Settlement, IPID, Sport and Recreation, The Presidency, Trade and Industry, Water and Sanitation, and Women.<br>
slide36. 36 Performance vs Expenditure (1)<br>
slide37. 37 Performance vs Expenditure (2)<br>
slide38. 38 Performance vs Expenditure (3)<br>
slide39. 39 Performance vs Expenditure (4)<br>
slide40. 40 Performance vs Expenditure (5)<br>
slide41. 41 Performance vs Expenditure (6)<br>
slide42. 42 Performance vs Expenditure (7)<br>
slide43. 43 Performance vs Expenditure (8)<br>
slide44. 44 Performance vs Expenditure (9)<br>
slide45. 45 Performance vs Expenditure (10)<br>
slide46. 46 Performance vs Expenditure (11)<br>
slide47. 47 Performance vs Expenditure (12)<br>
slide48. 48 Performance vs Expenditure (13)<br>
slide49. 49 Performance vs Expenditure (14)<br>
slide50. Annexure B
Financial Misconduct 50<br>
slide51. 51 Financial Misconduct There has been a significant increase in the finalised financial misconduct cases reported by national departments for the 2016/17 FY.<br>
slide52. 52 Financial Misconduct (2) The information reflects the cost of financial misconduct from 2013/14 to 2016/17 There has been a gradual decline in the amount not recovered, 2016/17 shows a notable reduction at 2% .<br>
slide53. 53 Financial Misconduct (3) The departments where amounts not recovered are over R 500k (2016/17 FY):<br>
slide54. Annexure C
Performance Management 54<br>
slide55. The foundation of effective governance and accountability is performance agreements (PAs).
DGs and HoDs in the Public Service are required to enter into PAs with their EAs by end of May, and submission of the PAs to the DPME by end of June.
Since the 2014/15 FY alarming submission rate of 18% there has been significant improvement during the 2015/16 and 2016/17 FYs. For 2017/18, there has been a slight increase in the submission rate (74%). 55 Performance Management Sources: a) PSC Factsheets for 2014/15 – 2015/16. b) PSC Verified Spreadsheet 2016/17.
Note: DMPE information for 2017/18 reflects information up until end of August 2017 (DPME).<br>
slide56. Of the 34 eligible DGs, 25 DGs submitted on time. It should be noted 2 depts. appointed new DGs (National Treasury and DPME).
The 6 departments that did not submit by the due date for 2017/18, and 3 departments submitted late: 56 Performance Management (2) Sourced: DPME as at end of August 2017.<br>
slide57. It should be noted that acting DGs are not required to submit PAs.
In 2016/17 there was an increase in the number of acting DGs (17) against the 14 in 2015/16, out of 48 National Depts.
For 2017/18 there is a decline in acting DGs, 11 out of 47 National depts. 57 Performance Management (3) The departments with acting DGs 1) Arts & Culture, 2) Communications, 3) Cooperative Governance, 4) Economic Development, 5) GCIS, 6) Military Veterans, 7) Mineral Resources, 8) Rural Development, 9) SAPS, 10) Social Development and 11) Transport. Sourced: DPME as at end of August 2017.<br>
slide58. Performance Management (4) According to the DPSA, the average time spent by DGs/HoDs in a post has improved over the past three years from 2.7 years to 3.08 years.
At the national level, the average is just over 3.5 years, whereas the average for provinces is below 3 years. These figures are much higher than the statistics reported by the Institute of Race Relations (IRR - August 2017).
According to the IRR report (2017:06) between May 2009 up to March 2017, a total of 172 individuals have held the position of DG in 38 key national departments, either on a fixed term contract or acting capacity. The figures represent an average of 22 months for a DG in their posts before a change occurs.
In spite of the differences, the statistics affirm the concerns alluded to in the National Development Plan (NDP, Vison 2030) regarding instability at the political administrative interface. 14<br>
slide59. Performance Management (5) So what is the PSC doing regarding this matter?
The PSC has engaged with the Minister for Pubic Service and Administration (MPSA) and Minister in The Presidency to discuss issues pertaining to the career incidents of DGs/HoDs.
In 2014 the PSC submitted a report to the Presidency after the precautionary suspension of some DGs requesting that the role of EAs in disciplining HoDs be clarified. The PSC is also mediating in some of the current disciplinary cases.
The PSC has engaged with EAs after investigating grievances of HoDs and in some instances, the PSC’s interventions have resulted in the reinstatement of some HoDs and/or their deployment to other areas where their skills can be appropriately utilised.
However, in some instances the PSC is unable to assist because the parties end up pursuing legal action. 15<br>
slide60. Annexure D
Precautionary Suspensions 60<br>
slide61. 61 A good indicator of the health of the HR administration is precautionary suspensions.
If officials are placed for long periods on suspension, it means a department does not deal promptly with discipline processes. If the department is not dealing promptly with discipline, the probability is high that other HR processes are also inefficient.
2016/17 reflects a reduction in the number of people suspended. However, there is a significant increase in the number of people whose suspension exceeded 30 days. Precautionary Suspensions<br>
slide62. Precautionary Suspensions (2) 62 The Depts mainly contributing to a number of people suspended are:<br>
slide63. 63 Precautionary Suspensions (3) There has been a significant increase in the cost of suspensions during 2016/17 FY from the 2015/16 FY. It should be noted that there seems to be no direct correlation between the number of officials suspended and the cost of suspensions.<br>
slide64. Annexure E
Utilisation of Consultants 64<br>
slide65. Opportunities for efficiency, effectiveness and value for money The table below shows departments with an increased number and cost for the use of consultants for the 2015/16 and 2016/17 financial year 65<br>
slide66. 66 Of these 27 depts. the following departments incurred the highest costs:
National Treasury – reported a cost of R527m of which R10m was spent on the Infrastructure Delivery Improvement Programme (IDIP), R8.2m on service provider to develop and deliver training programmes to support Infrastructure Delivery Management System (IDMS), R5.2m provision of technical assistance to the IDIP and R4.7m to support the Free State Provincial Treasury with the implementation and management of IDMS.
Transport - reported a cost of R443m of which R269m was spent on eNaTIS, R 113m on Taxi Scrapping Administrator and R11 m on S’Hamba Sonke.
Rural Development – reported a cost of R441m of which R128m was spent on Legal Services, R91m on Project Management, R80m on Research and Advisory, and R1m respectively spent on the Audit Committee, Board Members, Financial Management and HR Management. Opportunities for efficiency, effectiveness and value for money (2)<br>
slide67. 67 Energy – reported a cost of R 277m of which R 171m was spent on the procurement of the Nuclear New Build Programme (NNBP) Management System, R 20m was spent on appointment of transactional advisors to review the state of readiness for the National New Build Programme.
Cooperative Governance – reported a cost of R 186m of which R 106m was spent on the appointment of a service provider to review and enhance the simplified Revenue Plan Model for customisation and implementation in selected municipalities, R 9.5m was spent on the appointment of a service provider to develop prototype staff establishments.
Water and Sanitation – reported a cost of R 114m of which R 13.5m was spent on an impact assessment of water and sanitation infrastructure in 153 Water Services Authorities and R 12m on a post feasibility bridging study for the proposed bulk conveyance infrastructure from the raised Clan William Dam. Opportunities for efficiency, effectiveness and value for money (3)<br>
slide68. 7 May 2018 68 Thank you
Siyabonga PSC Website: www.psc.gov.za
National Anti-Corruption Hotline for the Public Service:
0800 701 701<br>