Probability Probability from data tables and frequency trees Probability from data tables In GCSE Statistics you will be asked to give estimates of probability and expected frequencies from a data set. The data set on the previous slide
"Probability Probability from data tables and" is the property of its rightful owner. Permission is granted to
download and print the materials on this website for personal, non-commercial use only, and to display it
on your personal computer provided you do not modify the materials and that you retain all copyright
notices contained in the materials. By downloading content from our website, you accept the terms of this
agreement.
Presentation Transcript
01
Probability Probability from data tables and frequency trees<br>
02
Probability from data tables In GCSE Statistics you will be asked to give estimates of probability and expected frequencies from a data set.<br>
03
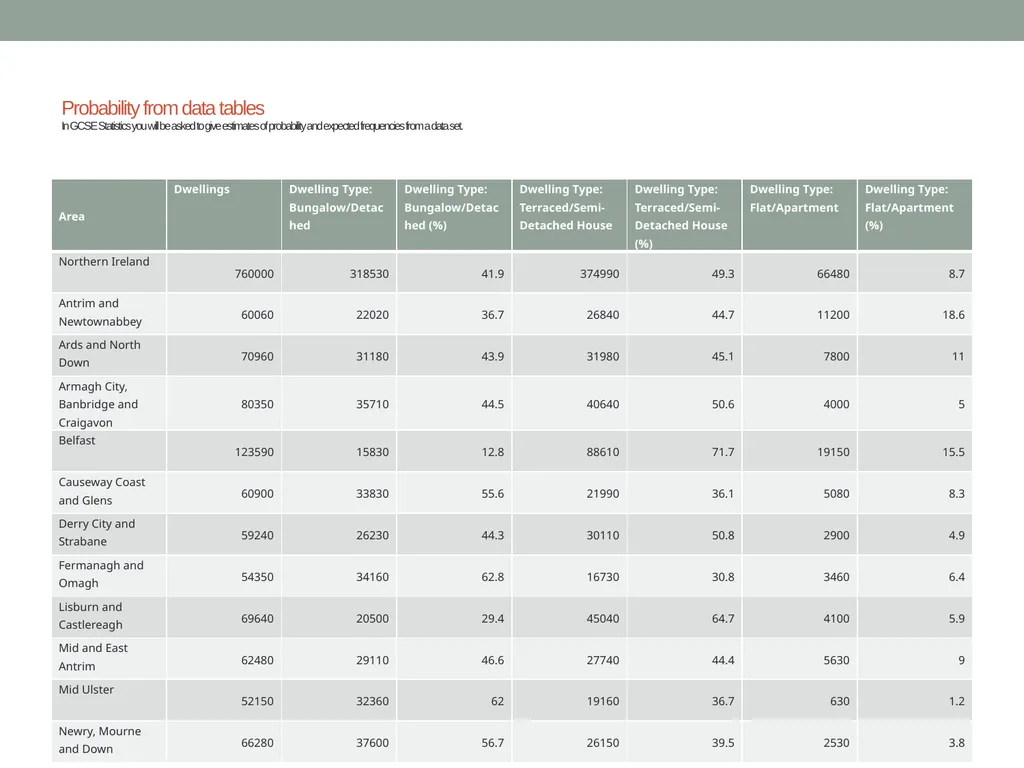
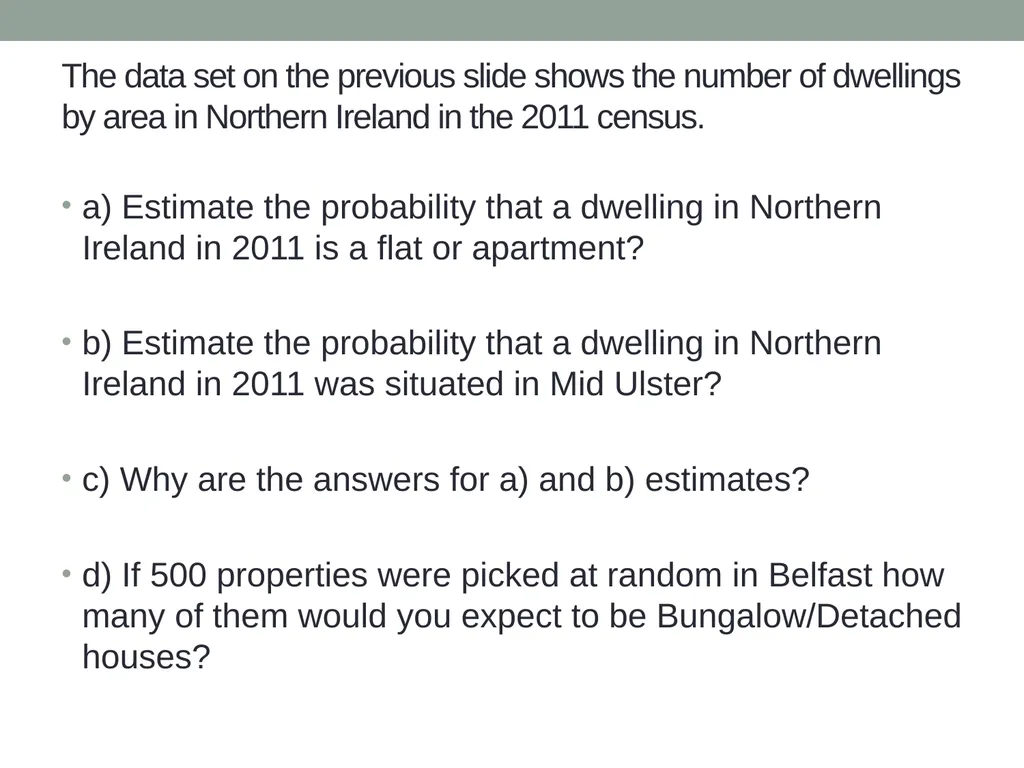
The data set on the previous slide shows the number of dwellings by area in Northern Ireland in the 2011 census. a) Estimate the probability that a dwelling in Northern Ireland in 2011 is a flat or apartment?
b) Estimate the probability that a dwelling in Northern Ireland in 2011 was situated in Mid Ulster?
c) Why are the answers for a) and b) estimates?
d) If 500 properties were picked at random in Belfast how many of them would you expect to be Bungalow/Detached houses?<br>
04
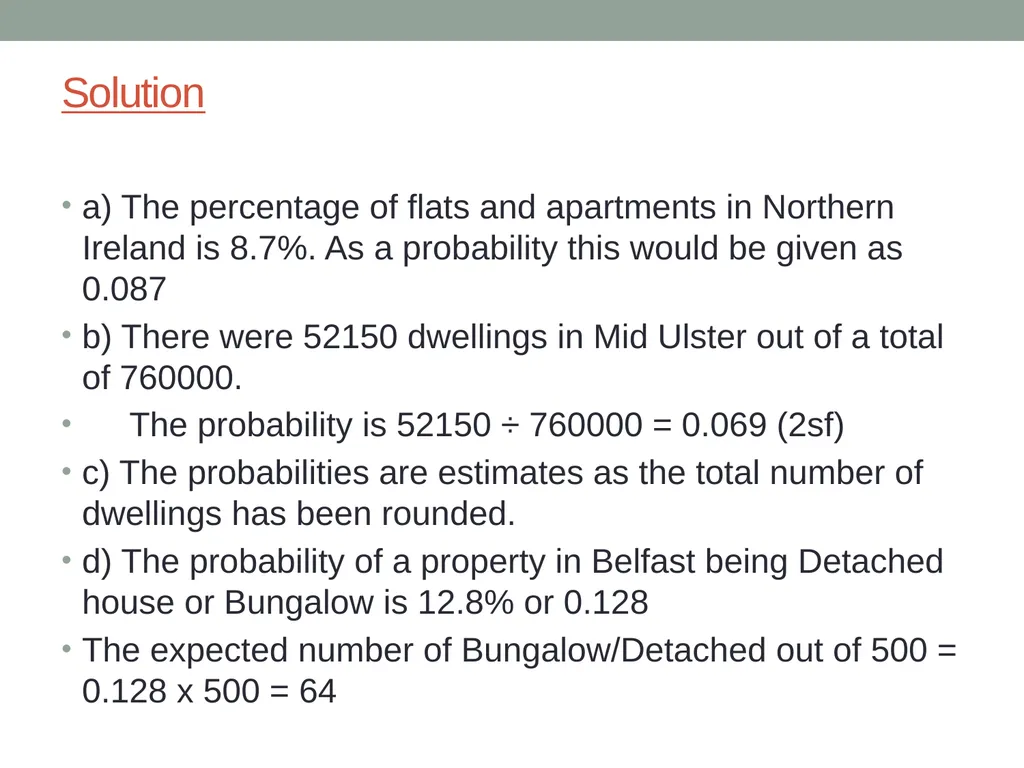
Solution a) The percentage of flats and apartments in Northern Ireland is 8.7%. As a probability this would be given as 0.087
b) There were 52150 dwellings in Mid Ulster out of a total of 760000.
The probability is 52150 ÷ 760000 = 0.069 (2sf)
c) The probabilities are estimates as the total number of dwellings has been rounded.
d) The probability of a property in Belfast being Detached house or Bungalow is 12.8% or 0.128
The expected number of Bungalow/Detached out of 500 = 0.128 x 500 = 64<br>
05
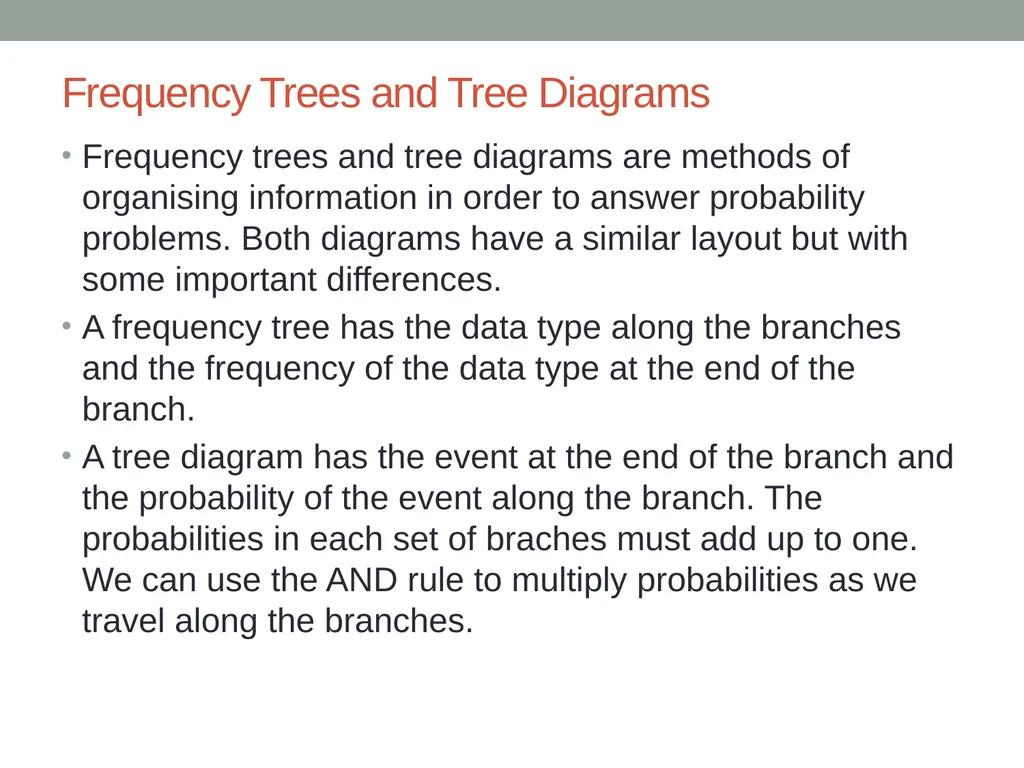
Frequency Trees and Tree Diagrams Frequency trees and tree diagrams are methods of organising information in order to answer probability problems. Both diagrams have a similar layout but with some important differences.
A frequency tree has the data type along the branches and the frequency of the data type at the end of the branch.
A tree diagram has the event at the end of the branch and the probability of the event along the branch. The probabilities in each set of braches must add up to one. We can use the AND rule to multiply probabilities as we travel along the branches.<br>
06
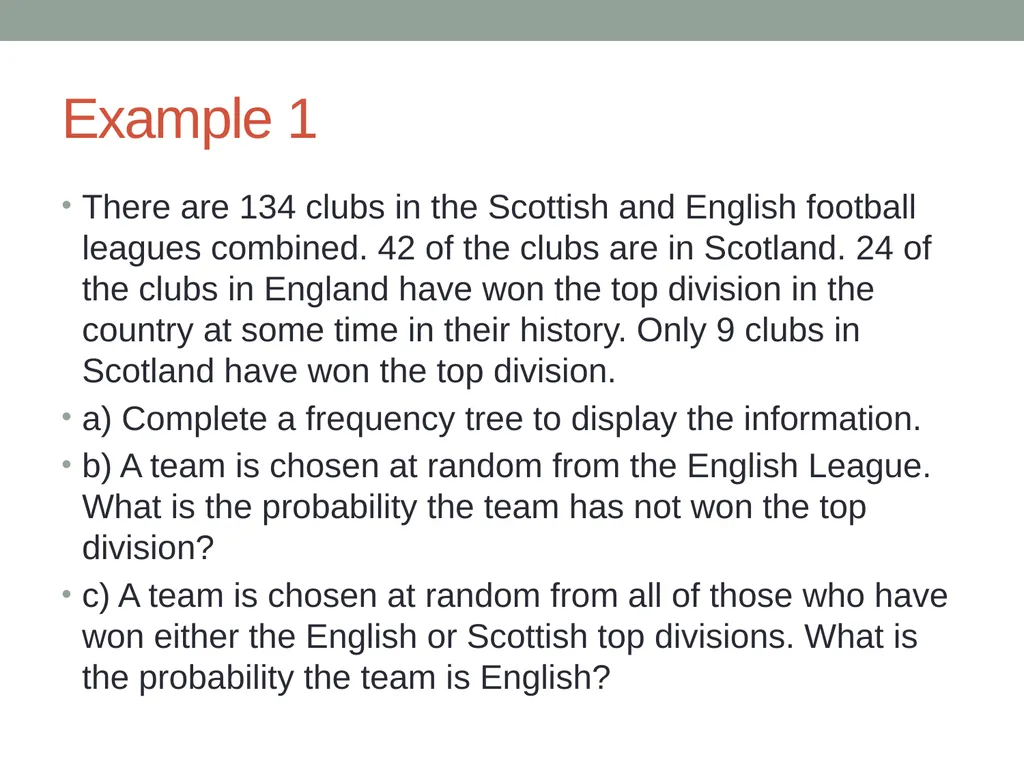
Example 1 There are 134 clubs in the Scottish and English football leagues combined. 42 of the clubs are in Scotland. 24 of the clubs in England have won the top division in the country at some time in their history. Only 9 clubs in Scotland have won the top division.
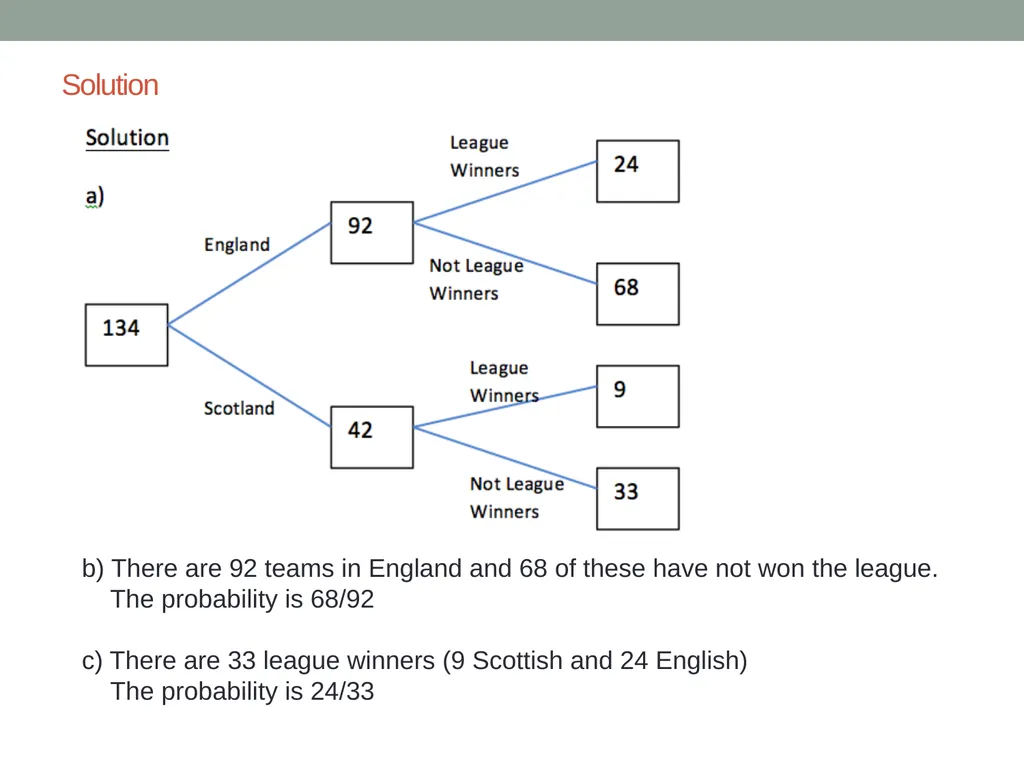
a) Complete a frequency tree to display the information.
b) A team is chosen at random from the English League. What is the probability the team has not won the top division?
c) A team is chosen at random from all of those who have won either the English or Scottish top divisions. What is the probability the team is English?<br>
07
Solution b) There are 92 teams in England and 68 of these have not won the league.
The probability is 68/92
c) There are 33 league winners (9 Scottish and 24 English)
The probability is 24/33<br>