Prof. Ramin Zabih (CS) Prof. Ashish Raj (Radiology) CS5540: Computational Techniques for Analyzing Clinical Data Todays topic How do we decide that an ECG is shockable or not? Key to project 1 (out next week) Simple versions first There
"Prof. Ramin Zabih (CS) Prof. Ashish Raj" is the property of its rightful owner. Permission is granted to
download and print the materials on this website for personal, non-commercial use only, and to display it
on your personal computer provided you do not modify the materials and that you retain all copyright
notices contained in the materials. By downloading content from our website, you accept the terms of this
agreement.
Presentation Transcript
01
Prof. Ramin Zabih (CS)
Prof. Ashish Raj (Radiology) CS5540: Computational Techniques for Analyzing Clinical Data<br>
02
Today’s topic How do we decide that an ECG is shockable or not?
Key to project 1 (out next week)
Simple versions first
There are whole courses on this area
Machine learning
We’re going to do it correctly but informally 2<br>
03
Simple example Suppose you have a single number that summarizes an ECG
Examples: beats per minute; “normalcy”
How can you make a decision on whether to shock or not?
Depending on number, might be impossible
More subtlely, you’d like to figure this out…
We’ll assume that the number has a reasonable amount of useful information
A real-valued “feature” of the ECG 3<br>
04
Problem setup We’ll give you some ECG’s that are labeled as shockable and not (“training set”)
Assume 1 = shock, 0 = don’t shock
Presumably your shockable examples will tend to have a value around 1, and your non-shockable ones a value around 0
Your job: get the right answer on a new set of ECG’s (“test set”)
Q1: how can we do this?
Q2: how can we be confident we’re right? 4<br>
05
Procedural approaches There are some very simple techniques to solve these problems, which even scale up to long feature vectors
I.e., several numbers per ECG
Main example: nearest-neighbor
Algorithm: find the test data point with the most similar value to the input
Variant: majority from k nearest neighbors,
Advantage: simple, fast
Disadvantages? 5<br>
06
Validation How can we tell we have a good answer?
In the limit, we can’t, since the training data might be very different from the testing data
In practice, it is usually similar
Too little training data is a problem
Estimate confidence via leave-one-out cross validations 6<br>
07
Sparsity Especially in high dimensions, we will never have very dense data
Suppose you have 100 numbers to summarize your ECG
Why is this bad for k-NN classification?
Sometimes you have some idea about the overall shape of the solution
For example, shockable and non-shockable points should form blobs in “feature space”
This isn’t really what k-NN does 7<br>
08
Statistical classification Most work on such problems relies on statistical methods
These tend to produce clean, general and well-motivated solutions
Cost: intellectual and practical complexity
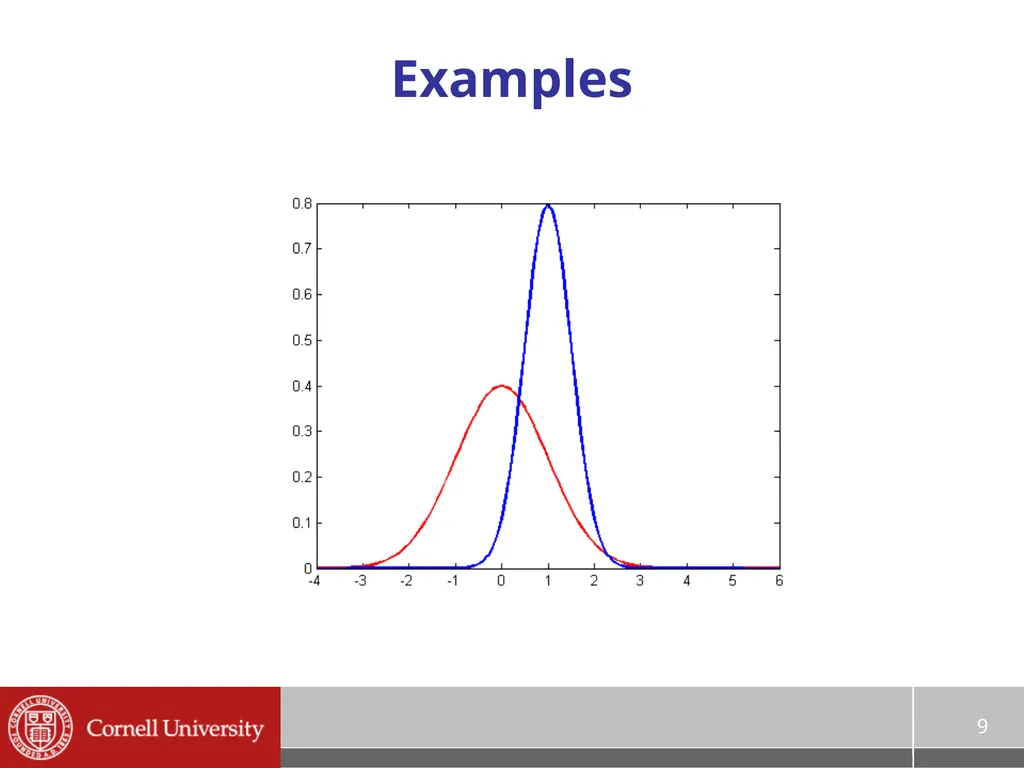
Simplest example: suppose that for shockable ECG’s we get a value around 0 and for non-shockable a value around 1
With an infinite amount of data we’d get Gaussians centered at 1 or 0 8<br>
09
Examples 9<br>
10
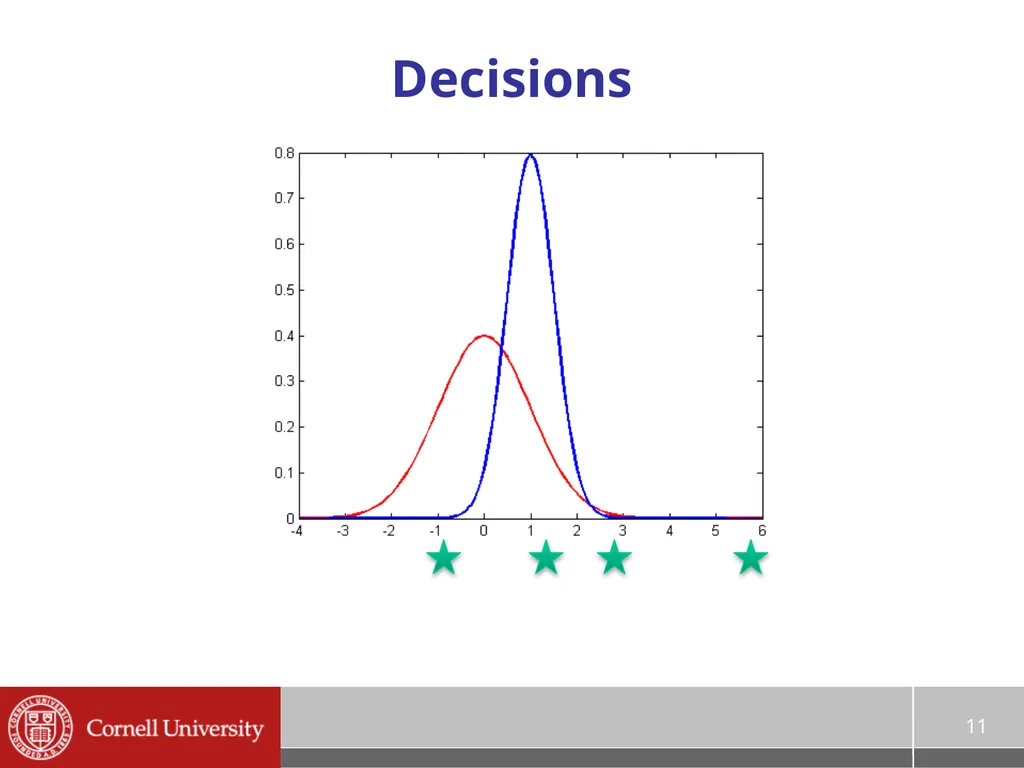
Estimate, then query Strategy: figure out the gaussians from the data, then use this to decide
Let’s look at the decision part first
Pretend we know the gaussians
Then decide what to do 10<br>