
Proposed Guidance for Fixed Objects in the
AS
Published · 22 slides · 0 views

1 / 1





Description
Proposed Guidance for Fixed Objects in the Roadside Design Guide NCHRP Project 17-82 This slide presentation was developed by MRIGlobal under NCHRP Project 17-82. More information about this topic can be found in NCHRP Research Report 1016:
Related Topics
Share
Embed code
Download this presentation From Below
"Proposed Guidance for Fixed Objects in the" is the property of its rightful owner. Permission is granted to download and print the materials on this website for personal, non-commercial use only, and to display it on your personal computer provided you do not modify the materials and that you retain all copyright notices contained in the materials. By downloading content from our website, you accept the terms of this agreement.
Presentation Transcript
01
Proposed Guidance for Fixed Objects
in the Roadside Design Guide
NCHRP Project 17-82<br>
02
This slide presentation was developed by MRIGlobal under NCHRP Project 17-82. More information about this topic can be found in NCHRP Research Report 1016: Design Guidelines for Mitigating Collisions with Trees and Utility Poles on the National Academies Press website (www.nap.edu).
NCHRP is sponsored by the individual state departments of transportation of the American Association of State Highway and Transportation Officials. NCHRP is administered by the Transportation Research Board (TRB), part of the National Academies of Sciences, Engineering, and Medicine, under a cooperative agreement with the Federal Highway Administration (FHWA). Any opinions and conclusions expressed or implied in resulting research products are those of the individuals and organizations who performed the research and are not necessarily those of TRB; the National Academies of Sciences, Engineering, and Medicine; FHWA; or NCHRP sponsors.<br>
NCHRP is sponsored by the individual state departments of transportation of the American Association of State Highway and Transportation Officials. NCHRP is administered by the Transportation Research Board (TRB), part of the National Academies of Sciences, Engineering, and Medicine, under a cooperative agreement with the Federal Highway Administration (FHWA). Any opinions and conclusions expressed or implied in resulting research products are those of the individuals and organizations who performed the research and are not necessarily those of TRB; the National Academies of Sciences, Engineering, and Medicine; FHWA; or NCHRP sponsors.<br>
03
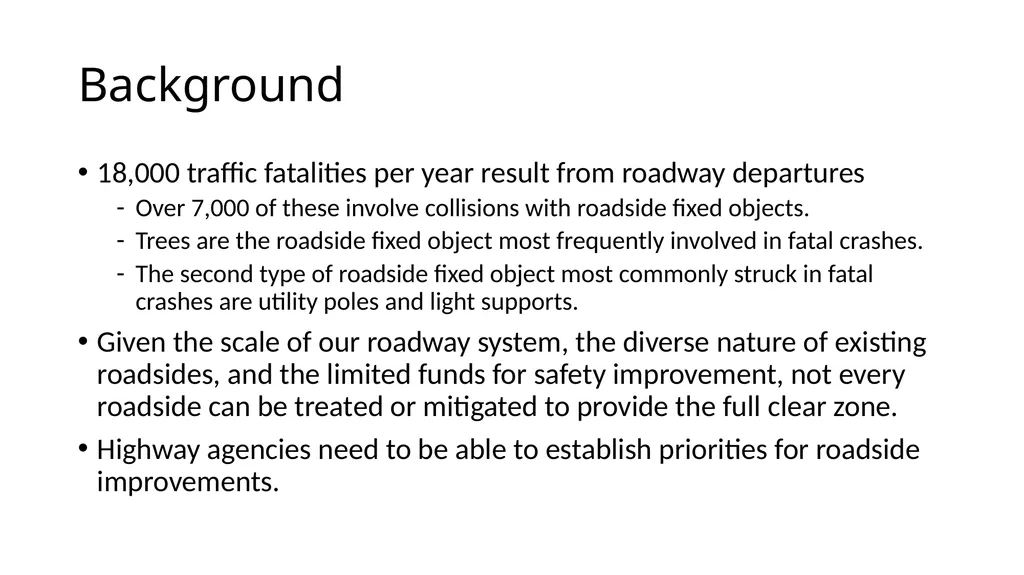
Background 18,000 traffic fatalities per year result from roadway departures
Over 7,000 of these involve collisions with roadside fixed objects.
Trees are the roadside fixed object most frequently involved in fatal crashes.
The second type of roadside fixed object most commonly struck in fatal crashes are utility poles and light supports.
Given the scale of our roadway system, the diverse nature of existing roadsides, and the limited funds for safety improvement, not every roadside can be treated or mitigated to provide the full clear zone.
Highway agencies need to be able to establish priorities for roadside improvements.<br>
04
Research Objective To develop design guidance for use by engineering practitioners to quantify the relative risk of collisions with roadside fixed objects.<br>
05
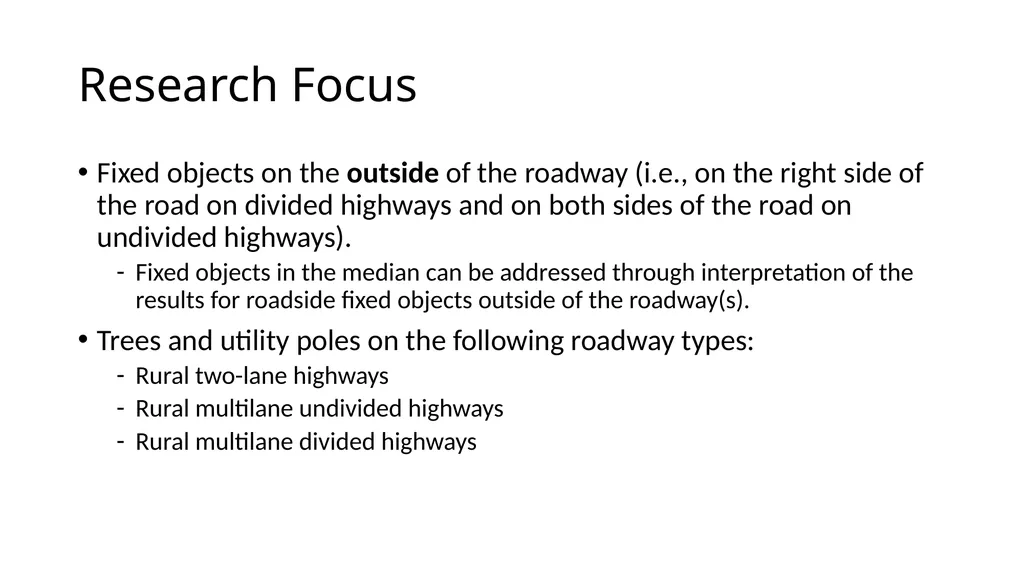
Research Focus Fixed objects on the outside of the roadway (i.e., on the right side of the road on divided highways and on both sides of the road on undivided highways).
Fixed objects in the median can be addressed through interpretation of the results for roadside fixed objects outside of the roadway(s).
Trees and utility poles on the following roadway types:
Rural two-lane highways
Rural multilane undivided highways
Rural multilane divided highways<br>
Fixed objects in the median can be addressed through interpretation of the results for roadside fixed objects outside of the roadway(s).
Trees and utility poles on the following roadway types:
Rural two-lane highways
Rural multilane undivided highways
Rural multilane divided highways<br>
06
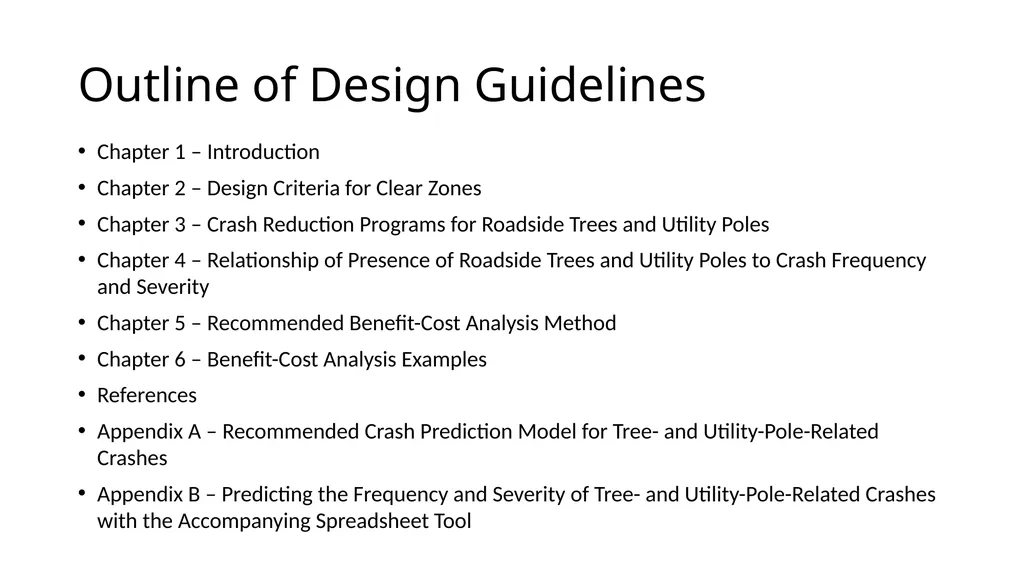
Outline of Design Guidelines Chapter 1 – Introduction
Chapter 2 – Design Criteria for Clear Zones
Chapter 3 – Crash Reduction Programs for Roadside Trees and Utility Poles
Chapter 4 – Relationship of Presence of Roadside Trees and Utility Poles to Crash Frequency and Severity
Chapter 5 – Recommended Benefit-Cost Analysis Method
Chapter 6 – Benefit-Cost Analysis Examples
References
Appendix A – Recommended Crash Prediction Model for Tree- and Utility-Pole-Related Crashes
Appendix B – Predicting the Frequency and Severity of Tree- and Utility-Pole-Related Crashes with the Accompanying Spreadsheet Tool<br>
07
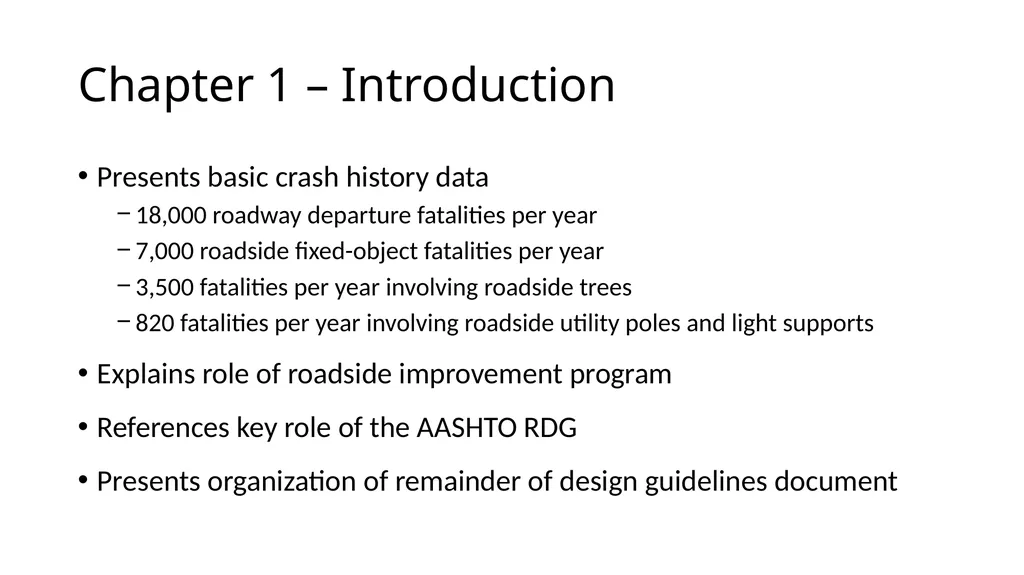
Chapter 1 – Introduction Presents basic crash history data
18,000 roadway departure fatalities per year
7,000 roadside fixed-object fatalities per year
3,500 fatalities per year involving roadside trees
820 fatalities per year involving roadside utility poles and light supports
Explains role of roadside improvement program
References key role of the AASHTO RDG
Presents organization of remainder of design guidelines document<br>
08
Chapter 2 – Design Criteria for Clear Zones Summarizes AASHTO RDG guidance on clear zones including suggested clear-zone distance and horizontal curve adjustment factors<br>
09
Chapter 3 – Crash Reduction Programs for Roadside Trees and Utility Poles Roadside trees
includes existing material about trees from RDG Section 4.9
includes new material about trees from benefit-cost analysis examples (Chapter 5 of design guidelines)
Utility poles
includes existing material about utility poles from RDG Section 4.8
includes new material about utility poles from benefit-cost analysis examples (Chapter 5 of design guidelines)<br>
10
Chapter 4 – Relationship of Presence of Roadside Trees and Utility Poles to Crash Frequency and Severity Presents brief review of literature/existing models
Presents a new recommended crash prediction model developed in the research – a modified version of the Road Assessment Program (RAP) model:
predicts annual frequency of fatality and injury (FI) crashes related to trees or utility poles
applicable to rural two-lane undivided highways, rural four-lane undivided highways, rural four-lane divided highways (nonfreeways)<br>
11
Chapter 4 – Relationship of Presence of Roadside Trees and Utility Poles to Crash Frequency and Severity Safety Performance Functions (SPFs) consider:
motor-vehicle traffic volume (AADT)
number of objects on left and right sides of the road
number of individual objects (trees or utility poles)
length of continuous tree groups (converted to an equivalent number of individual trees)
calibration factors for trees and utility poles (based on data collected and analyzed in this research)
Adjustment Factors (AFs):
roadway design speed
traffic flow influence factor
median traversability factor
crash likelihood factors
crash severity factors<br>
12
Chapter 4 – Relationship of Presence of Roadside Trees and Utility Poles to Crash Frequency and Severity Crash Likelihood Factors:
lane width
horizontal curvature
advance visibility of curve
percent grade
presence of shoulder rumble strips
presence of delineation
road surface condition
pavement skid resistance Crash Severity Factors:
type of roadside object
distance from traveled way to roadside object
paved shoulder width<br>
lane width
horizontal curvature
advance visibility of curve
percent grade
presence of shoulder rumble strips
presence of delineation
road surface condition
pavement skid resistance Crash Severity Factors:
type of roadside object
distance from traveled way to roadside object
paved shoulder width<br>
13
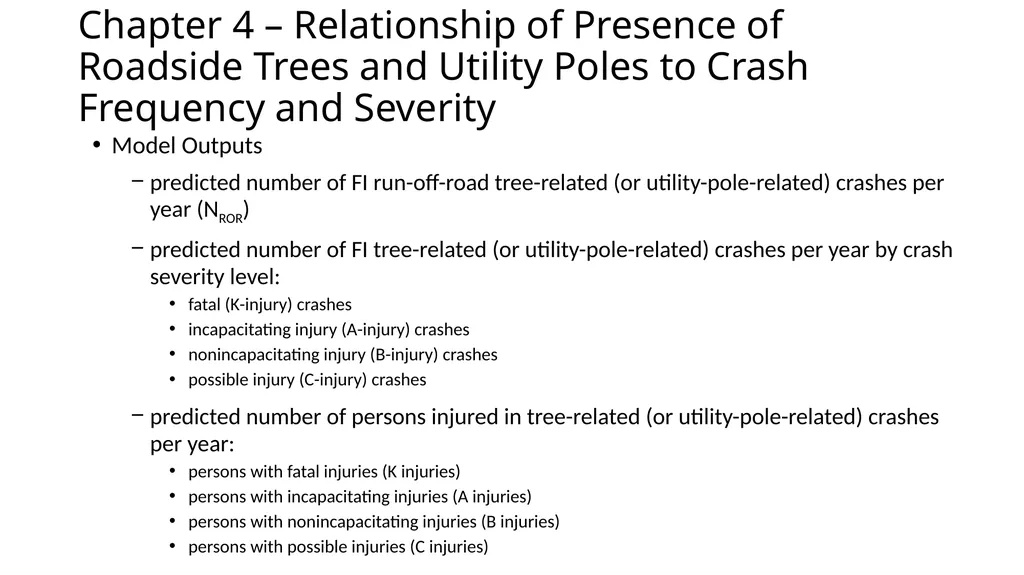
Chapter 4 – Relationship of Presence of Roadside Trees and Utility Poles to Crash Frequency and Severity Model Outputs
predicted number of FI run-off-road tree-related (or utility-pole-related) crashes per year (NROR)
predicted number of FI tree-related (or utility-pole-related) crashes per year by crash severity level:
fatal (K-injury) crashes
incapacitating injury (A-injury) crashes
nonincapacitating injury (B-injury) crashes
possible injury (C-injury) crashes
predicted number of persons injured in tree-related (or utility-pole-related) crashes per year:
persons with fatal injuries (K injuries)
persons with incapacitating injuries (A injuries)
persons with nonincapacitating injuries (B injuries)
persons with possible injuries (C injuries)<br>
14
Chapter 4 – Relationship of Presence of Roadside Trees and Utility Poles to Crash Frequency and Severity Model predictions can be expressed as a crash modification factor (CMF):
CMF = NROR for potential improved design / NROR for existing or planned design<br>
CMF = NROR for potential improved design / NROR for existing or planned design<br>
15
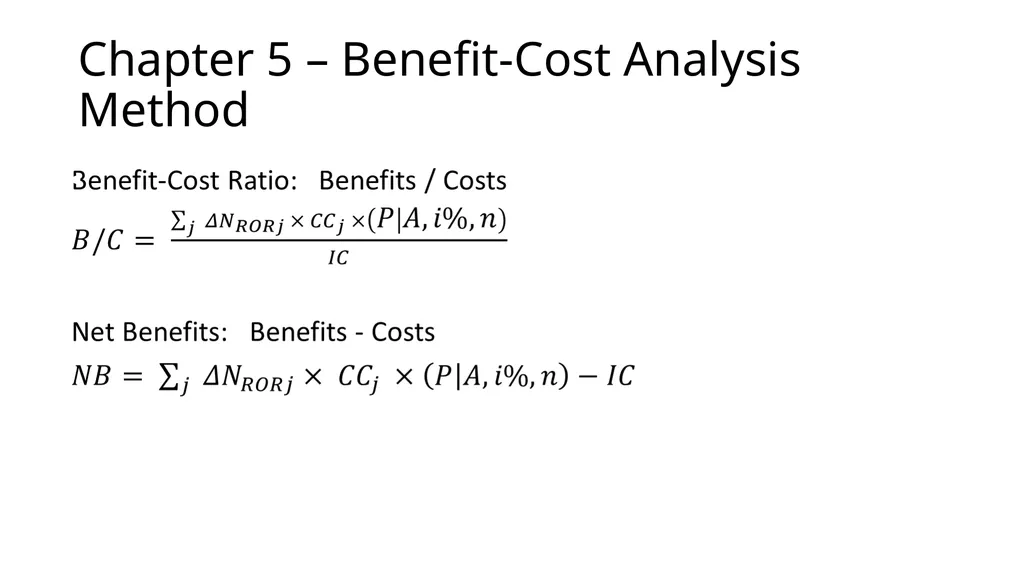
Chapter 5 – Benefit-Cost Analysis Method<br>
16
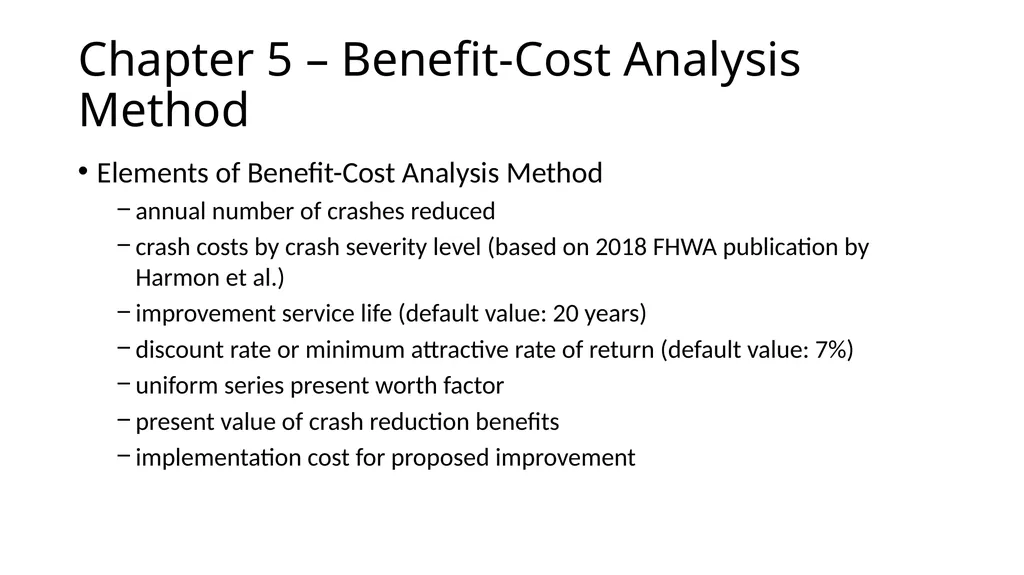
Chapter 5 – Benefit-Cost Analysis Method Elements of Benefit-Cost Analysis Method
annual number of crashes reduced
crash costs by crash severity level (based on 2018 FHWA publication by Harmon et al.)
improvement service life (default value: 20 years)
discount rate or minimum attractive rate of return (default value: 7%)
uniform series present worth factor
present value of crash reduction benefits
implementation cost for proposed improvement<br>
17
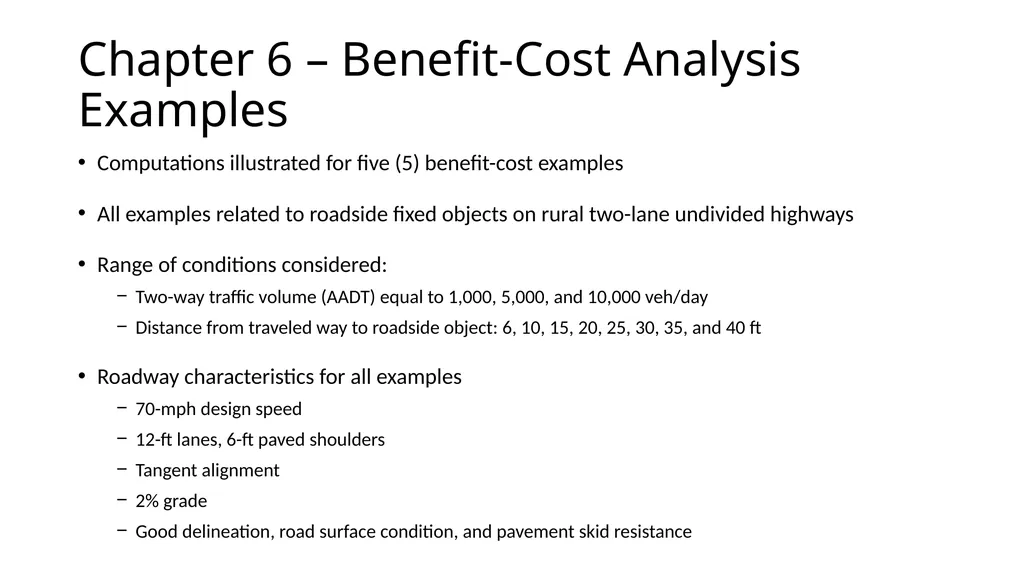
Chapter 6 – Benefit-Cost Analysis Examples Computations illustrated for five (5) benefit-cost examples
All examples related to roadside fixed objects on rural two-lane undivided highways
Range of conditions considered:
Two-way traffic volume (AADT) equal to 1,000, 5,000, and 10,000 veh/day
Distance from traveled way to roadside object: 6, 10, 15, 20, 25, 30, 35, and 40 ft
Roadway characteristics for all examples
70-mph design speed
12-ft lanes, 6-ft paved shoulders
Tangent alignment
2% grade
Good delineation, road surface condition, and pavement skid resistance<br>
18
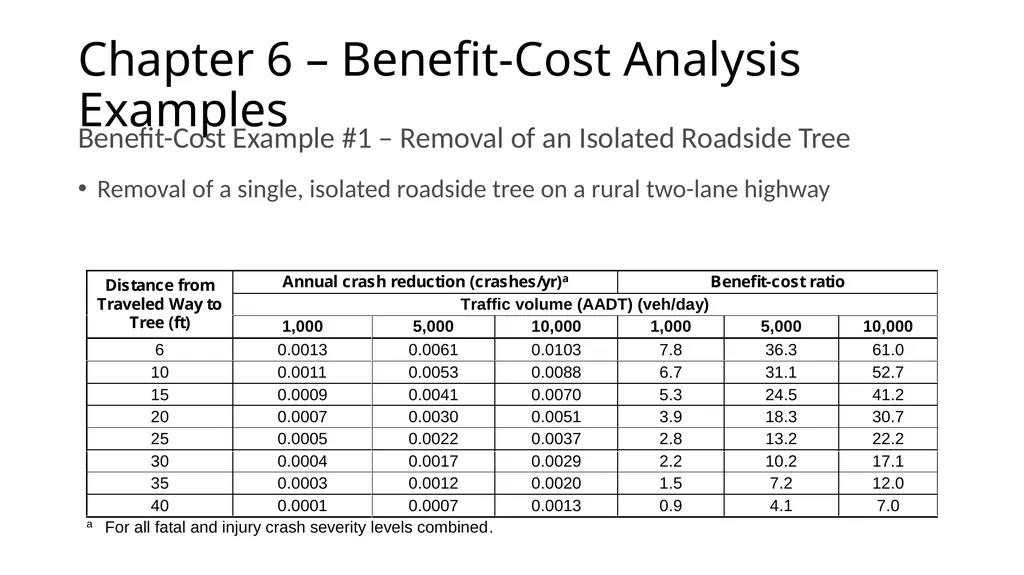
Chapter 6 – Benefit-Cost Analysis Examples Benefit-Cost Example #1 – Removal of an Isolated Roadside Tree
Removal of a single, isolated roadside tree on a rural two-lane highway<br>
Removal of a single, isolated roadside tree on a rural two-lane highway<br>
19
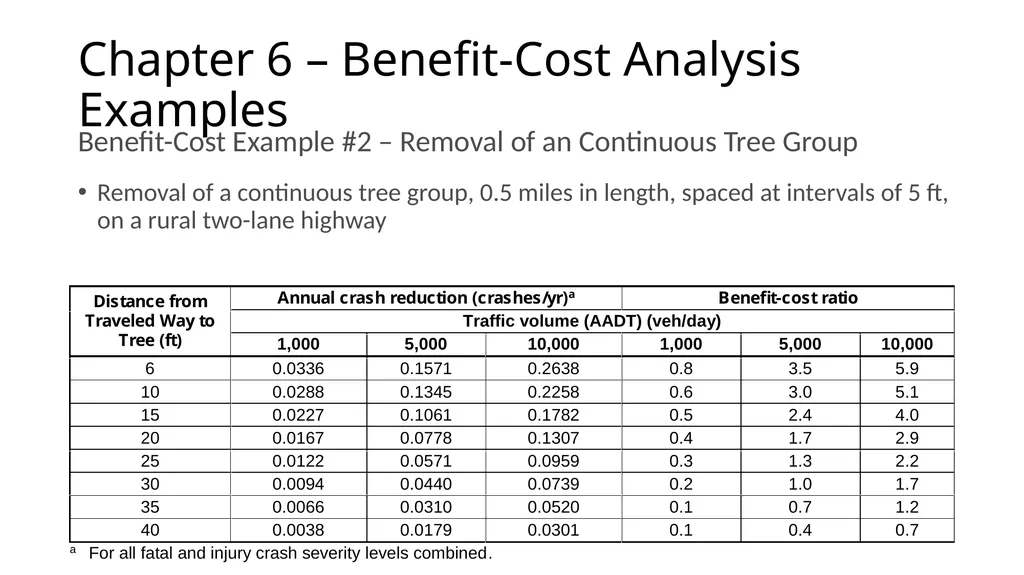
Chapter 6 – Benefit-Cost Analysis Examples Benefit-Cost Example #2 – Removal of an Continuous Tree Group
Removal of a continuous tree group, 0.5 miles in length, spaced at intervals of 5 ft, on a rural two-lane highway<br>
Removal of a continuous tree group, 0.5 miles in length, spaced at intervals of 5 ft, on a rural two-lane highway<br>
20
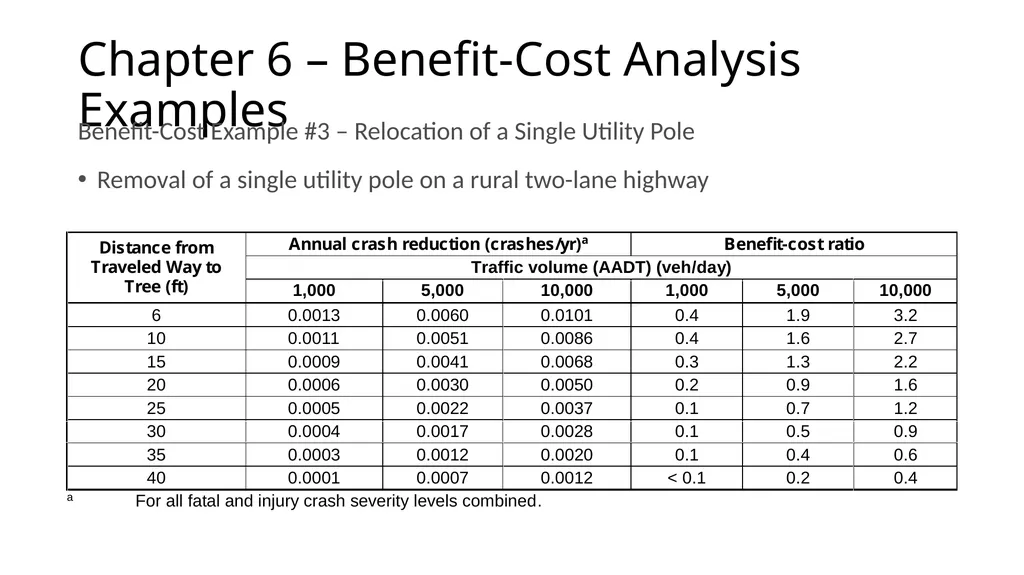
Chapter 6 – Benefit-Cost Analysis Examples Benefit-Cost Example #3 – Relocation of a Single Utility Pole
Removal of a single utility pole on a rural two-lane highway<br>
Removal of a single utility pole on a rural two-lane highway<br>
21
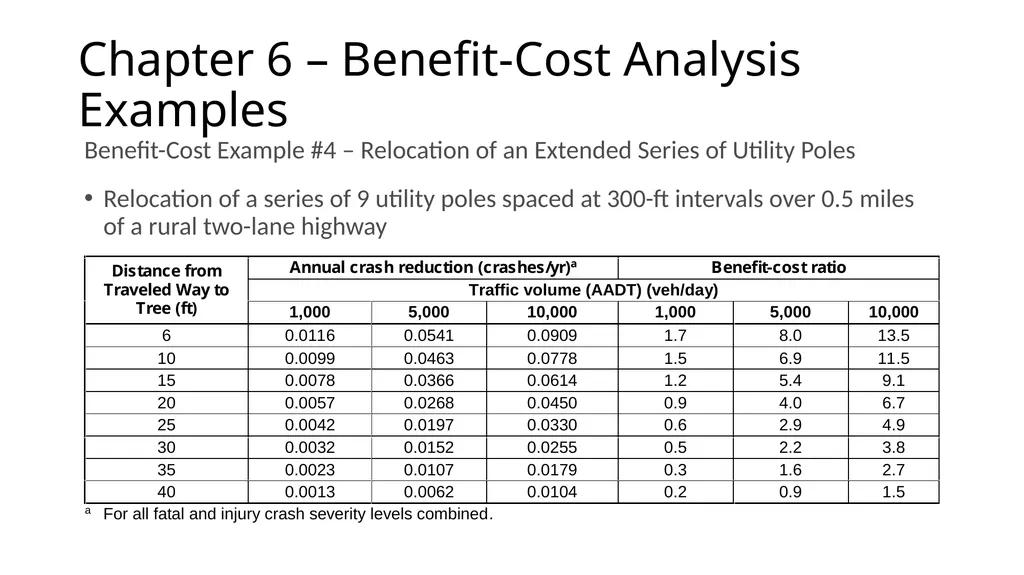
Chapter 6 – Benefit-Cost Analysis Examples Benefit-Cost Example #4 – Relocation of an Extended Series of Utility Poles
Relocation of a series of 9 utility poles spaced at 300-ft intervals over 0.5 miles of a rural two-lane highway<br>
Relocation of a series of 9 utility poles spaced at 300-ft intervals over 0.5 miles of a rural two-lane highway<br>
22
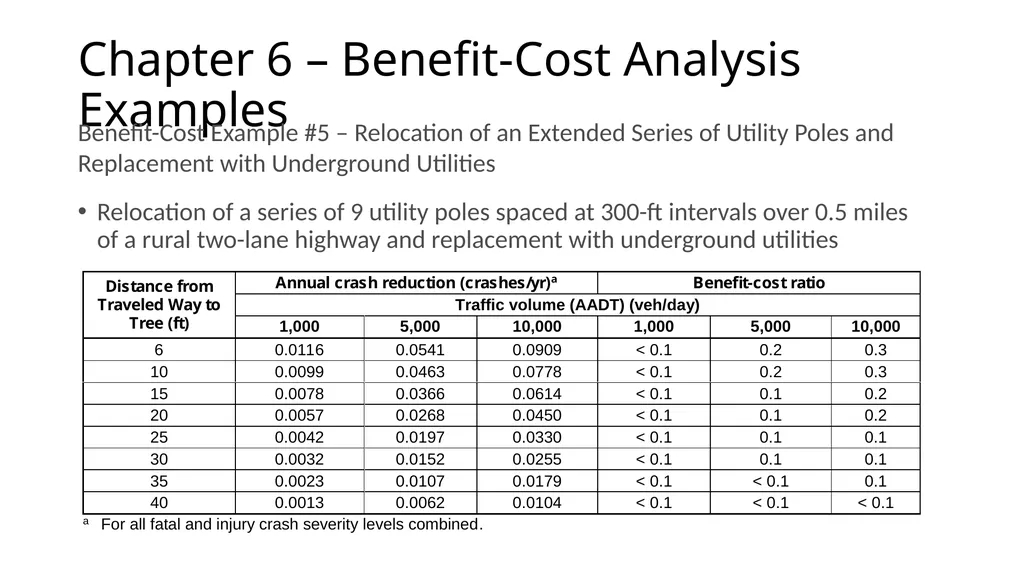
Chapter 6 – Benefit-Cost Analysis Examples Benefit-Cost Example #5 – Relocation of an Extended Series of Utility Poles and Replacement with Underground Utilities
Relocation of a series of 9 utility poles spaced at 300-ft intervals over 0.5 miles of a rural two-lane highway and replacement with underground utilities<br>
Relocation of a series of 9 utility poles spaced at 300-ft intervals over 0.5 miles of a rural two-lane highway and replacement with underground utilities<br>