
Research Impact report (bibliometrics) 2023-2025
BR
Published · 16 slides · 0 views

1 / 1

Description
Research Impact report (bibliometrics) 2023-2025 for Department of Regional Health Research (IRS) Produced by The University Library Section for Research Data ra-supportbib.sdu.dk March 2026 10-04-2026 Contents Summary Number of
Related Topics
Share
Embed code
Download this presentation From Below
"Research Impact report (bibliometrics) 2023-2025" is the property of its rightful owner. Permission is granted to download and print the materials on this website for personal, non-commercial use only, and to display it on your personal computer provided you do not modify the materials and that you retain all copyright notices contained in the materials. By downloading content from our website, you accept the terms of this agreement.
Presentation Transcript
01
Research Impact report (bibliometrics) 2023-2025
for Department of Regional Health Research (IRS) Produced by The University Library
Section for Research Data
ra-support@bib.sdu.dk
March 2026 10-04-2026<br>
March 2026 10-04-2026<br>
02
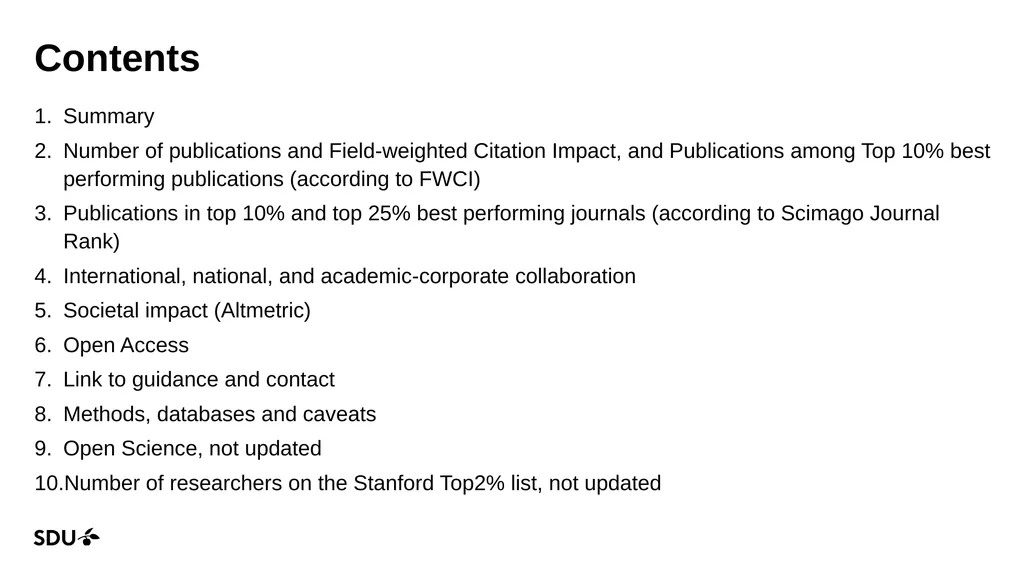
Contents Summary
Number of publications and Field-weighted Citation Impact, and Publications among Top 10% best performing publications (according to FWCI)
Publications in top 10% and top 25% best performing journals (according to Scimago Journal Rank)
International, national, and academic-corporate collaboration
Societal impact (Altmetric)
Open Access
Link to guidance and contact
Methods, databases and caveats
Open Science, not updated
Number of researchers on the Stanford Top2% list, not updated 10-04-2026 2<br>
Number of publications and Field-weighted Citation Impact, and Publications among Top 10% best performing publications (according to FWCI)
Publications in top 10% and top 25% best performing journals (according to Scimago Journal Rank)
International, national, and academic-corporate collaboration
Societal impact (Altmetric)
Open Access
Link to guidance and contact
Methods, databases and caveats
Open Science, not updated
Number of researchers on the Stanford Top2% list, not updated 10-04-2026 2<br>
03
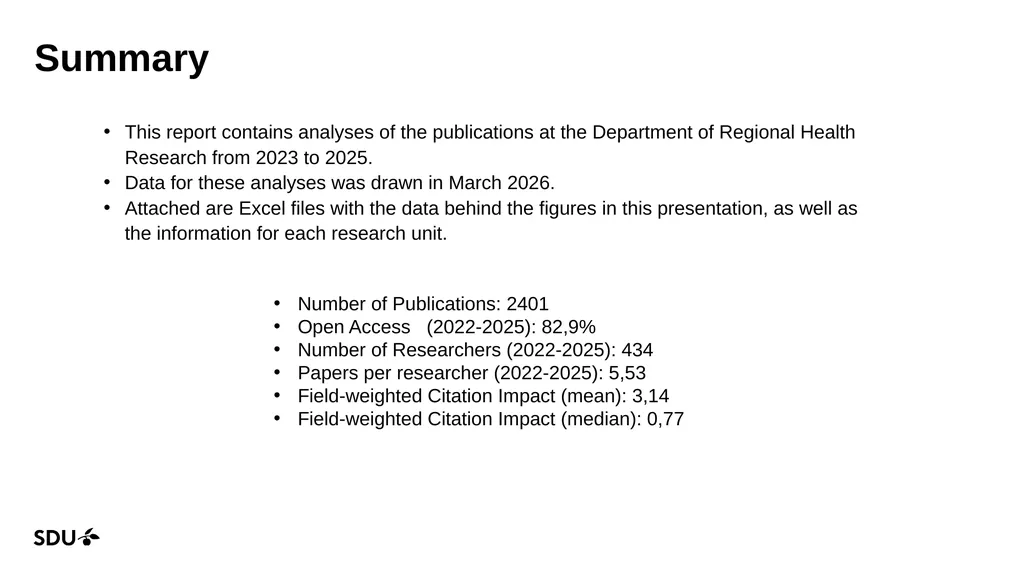
Summary This report contains analyses of the publications at the Department of Regional Health Research from 2023 to 2025.
Data for these analyses was drawn in March 2026.
Attached are Excel files with the data behind the figures in this presentation, as well as the information for each research unit. Number of Publications: 2401
Open Access (2022-2025): 82,9%
Number of Researchers (2022-2025): 434
Papers per researcher (2022-2025): 5,53
Field-weighted Citation Impact (mean): 3,14
Field-weighted Citation Impact (median): 0,77 10-04-2026 3<br>
Data for these analyses was drawn in March 2026.
Attached are Excel files with the data behind the figures in this presentation, as well as the information for each research unit. Number of Publications: 2401
Open Access (2022-2025): 82,9%
Number of Researchers (2022-2025): 434
Papers per researcher (2022-2025): 5,53
Field-weighted Citation Impact (mean): 3,14
Field-weighted Citation Impact (median): 0,77 10-04-2026 3<br>
04
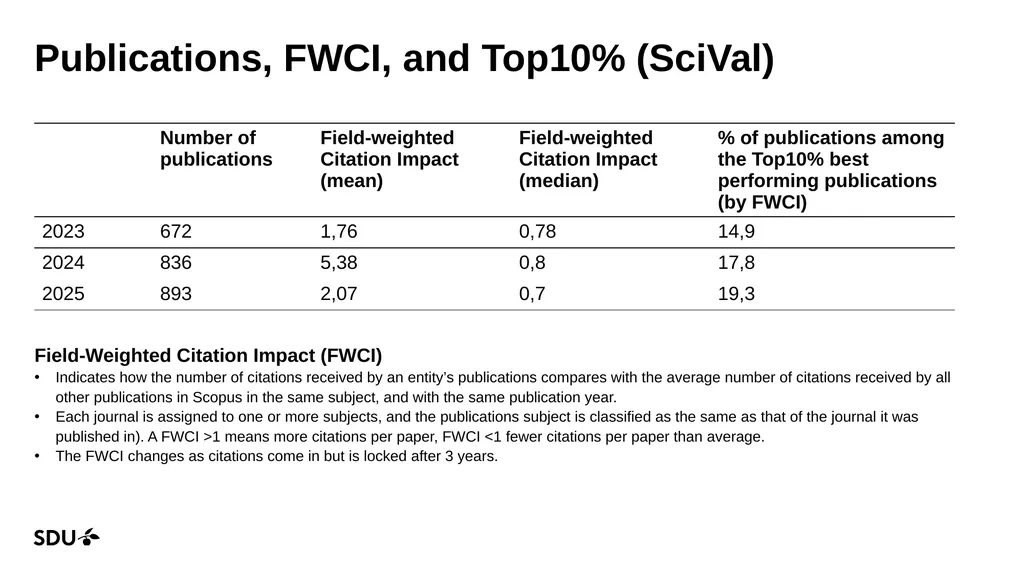
Publications, FWCI, and Top10% (SciVal) Field-Weighted Citation Impact (FWCI)
Indicates how the number of citations received by an entity’s publications compares with the average number of citations received by all other publications in Scopus in the same subject, and with the same publication year.
Each journal is assigned to one or more subjects, and the publications subject is classified as the same as that of the journal it was published in). A FWCI >1 means more citations per paper, FWCI <1 fewer citations per paper than average.
The FWCI changes as citations come in but is locked after 3 years. 10-04-2026 4<br>
Indicates how the number of citations received by an entity’s publications compares with the average number of citations received by all other publications in Scopus in the same subject, and with the same publication year.
Each journal is assigned to one or more subjects, and the publications subject is classified as the same as that of the journal it was published in). A FWCI >1 means more citations per paper, FWCI <1 fewer citations per paper than average.
The FWCI changes as citations come in but is locked after 3 years. 10-04-2026 4<br>
05
Publications in top 10% and top 25% best performing journals (according to Scimago Journal Rank) This metric looks at the amount of publications that was published in well performing journals. i.e. the performance of the journal the publication was published in rather than the performance of the publication itself.
Scimago Journal Rank (https://www.scimagojr.com/). 10-04-2026 5<br>
Scimago Journal Rank (https://www.scimagojr.com/). 10-04-2026 5<br>
06
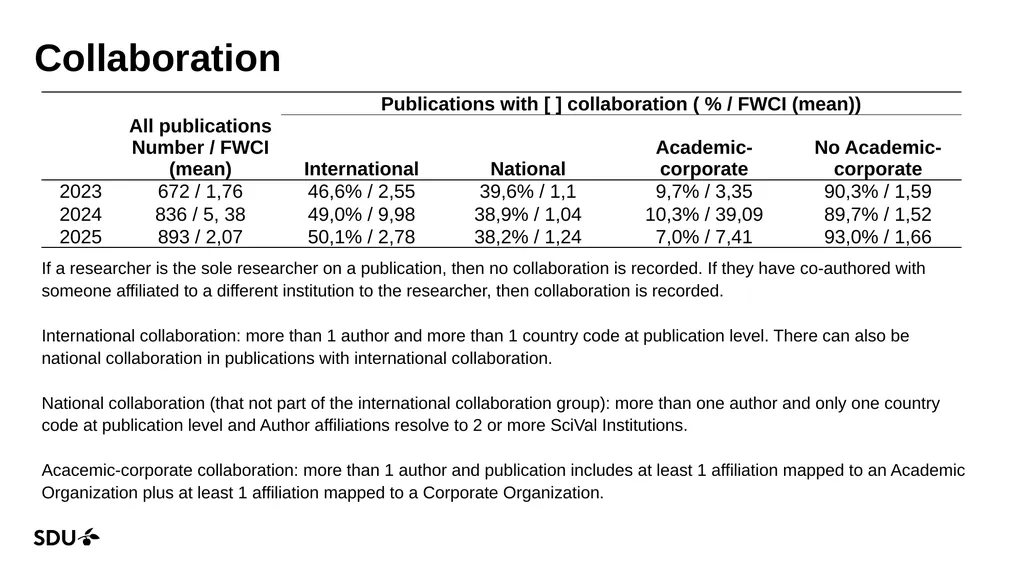
10-04-2026 6 Collaboration If a researcher is the sole researcher on a publication, then no collaboration is recorded. If they have co-authored with someone affiliated to a different institution to the researcher, then collaboration is recorded.
International collaboration: more than 1 author and more than 1 country code at publication level. There can also be national collaboration in publications with international collaboration.
National collaboration (that not part of the international collaboration group): more than one author and only one country code at publication level and Author affiliations resolve to 2 or more SciVal Institutions.
Acacemic-corporate collaboration: more than 1 author and publication includes at least 1 affiliation mapped to an Academic Organization plus at least 1 affiliation mapped to a Corporate Organization.<br>
International collaboration: more than 1 author and more than 1 country code at publication level. There can also be national collaboration in publications with international collaboration.
National collaboration (that not part of the international collaboration group): more than one author and only one country code at publication level and Author affiliations resolve to 2 or more SciVal Institutions.
Acacemic-corporate collaboration: more than 1 author and publication includes at least 1 affiliation mapped to an Academic Organization plus at least 1 affiliation mapped to a Corporate Organization.<br>
07
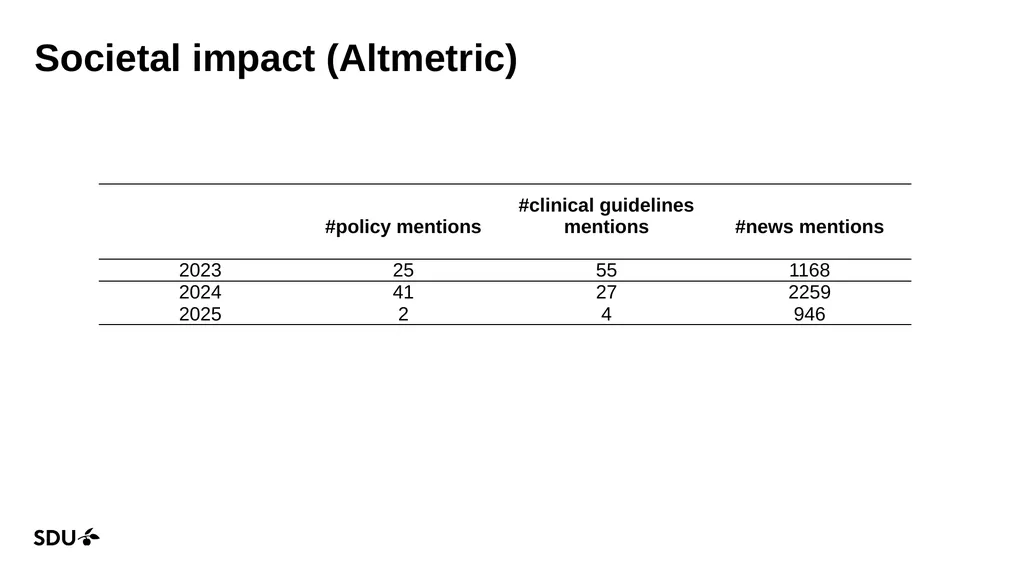
10-04-2026 7 Societal impact (Altmetric)<br>
08
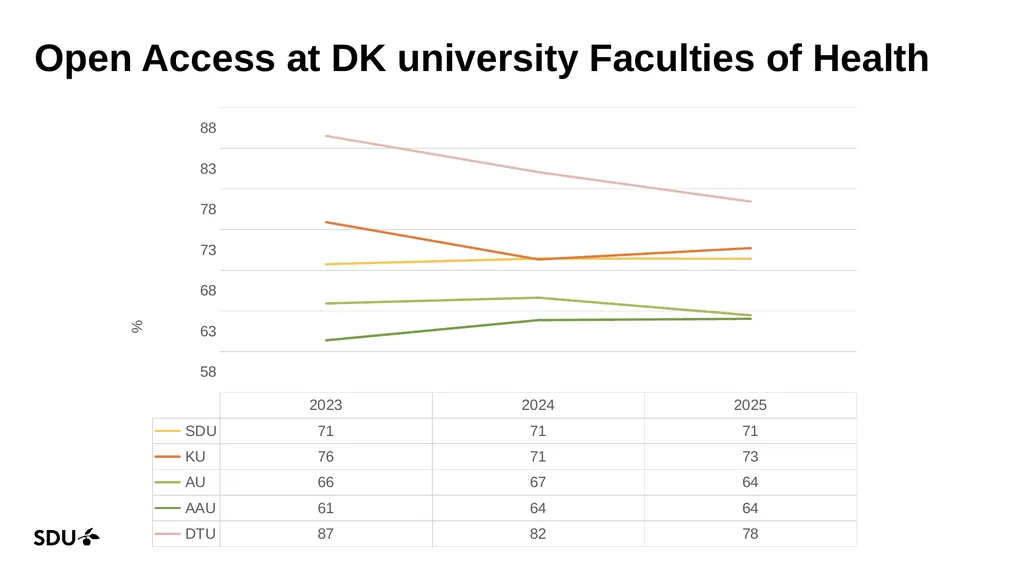
10-04-2026 8 Open Access at DK university Faculties of Health<br>
09
Contact reg. bibliometrics
RA-support@bib.sdu.dk
Contact reg. Pure
puresupport@bib.sdu.dk
Guidance
https://libguides.sdu.dk/researchimpact 10-04-2026 9 Links to guidance and contact<br>
RA-support@bib.sdu.dk
Contact reg. Pure
puresupport@bib.sdu.dk
Guidance
https://libguides.sdu.dk/researchimpact 10-04-2026 9 Links to guidance and contact<br>
10
Methods, databases and caveats Pure is the research information management system at University of Southern Denmark. One must be affiliated to or employed at SDU to have an active Pure profile. Researchers at OUH should be registered at SDU HCM, which then updates hierarchy of people and research units to Pure.
SciVal is the analysis interface to the publications indexed in Scopus. This database indexes about 80% of publications in medicine, but this is highly sub-field specific, for instance psychiatry and nursing are only indexed with about 65% (rough estimates from 2019 Elsevier report). Hierarchy of people and research units is pushed from Pure to SciVal.
SciVal analyses are based on the publications indexed in Scopus authored by one of the people registered in HCM and thereby Pure to the department and who also has their author ScopusID registered to their Pure-profile. The Pure teams estimates that about 90% of researchers that have a ScopusID have their Scopus ID registered in Pure. You can only have an author ScopusID if you have authored a publication indexed in Scopus.
To these analyses the analysed publications are filtered to only include publications with SDU/OUH and underlying units in the affiliation. This is to remove the surplus publications that would be registered particularly in conjunction with visiting professors.
Altmetric harvests social media and news mentions along with clinical guideline and some policy mentions. The focus in this report is on the clinical guidelines, policy and news mentions. Hierarchy of people and research units is pushed from Pure to Altmetric. 10-04-2026 10<br>
SciVal is the analysis interface to the publications indexed in Scopus. This database indexes about 80% of publications in medicine, but this is highly sub-field specific, for instance psychiatry and nursing are only indexed with about 65% (rough estimates from 2019 Elsevier report). Hierarchy of people and research units is pushed from Pure to SciVal.
SciVal analyses are based on the publications indexed in Scopus authored by one of the people registered in HCM and thereby Pure to the department and who also has their author ScopusID registered to their Pure-profile. The Pure teams estimates that about 90% of researchers that have a ScopusID have their Scopus ID registered in Pure. You can only have an author ScopusID if you have authored a publication indexed in Scopus.
To these analyses the analysed publications are filtered to only include publications with SDU/OUH and underlying units in the affiliation. This is to remove the surplus publications that would be registered particularly in conjunction with visiting professors.
Altmetric harvests social media and news mentions along with clinical guideline and some policy mentions. The focus in this report is on the clinical guidelines, policy and news mentions. Hierarchy of people and research units is pushed from Pure to Altmetric. 10-04-2026 10<br>
11
Methods, databases and caveats Below is a shortened list of caveats to keep in mind when assessing the precision of a bibliometric number as a proxy for quality of the research:
A citation counts equally for a negative mention as for a positive one.
A citation is only counted if the publication doing the citing and the publication cited are both indexed in the same bibliometric database.
Most research fields are not completely indexed in the various databases, meaning that only a subset of the publications is counted and measured. Generally, Scopus/SciVal have good coverage of the health science fields, though less good for e.g. psychology and nursing than for medicine.
Different fields of health science have different citation practices. It is therefore meaningless to compare different fields of research. Citation practices include but are not limited to:
number of co-authors typically associated with a publication and how the citation count is divided or not;
number of references typically given in a publication;
the amount of research time going into each publication regardless of publication type.
These have tangible effects on the raw citation numbers such as citations per paper.
Bibliometric counts favour English language publications.
Bibliometric analyses do not count community involvement, engagement and outreach, medical work and teaching in various forms. 10-04-2026 11<br>
A citation counts equally for a negative mention as for a positive one.
A citation is only counted if the publication doing the citing and the publication cited are both indexed in the same bibliometric database.
Most research fields are not completely indexed in the various databases, meaning that only a subset of the publications is counted and measured. Generally, Scopus/SciVal have good coverage of the health science fields, though less good for e.g. psychology and nursing than for medicine.
Different fields of health science have different citation practices. It is therefore meaningless to compare different fields of research. Citation practices include but are not limited to:
number of co-authors typically associated with a publication and how the citation count is divided or not;
number of references typically given in a publication;
the amount of research time going into each publication regardless of publication type.
These have tangible effects on the raw citation numbers such as citations per paper.
Bibliometric counts favour English language publications.
Bibliometric analyses do not count community involvement, engagement and outreach, medical work and teaching in various forms. 10-04-2026 11<br>
12
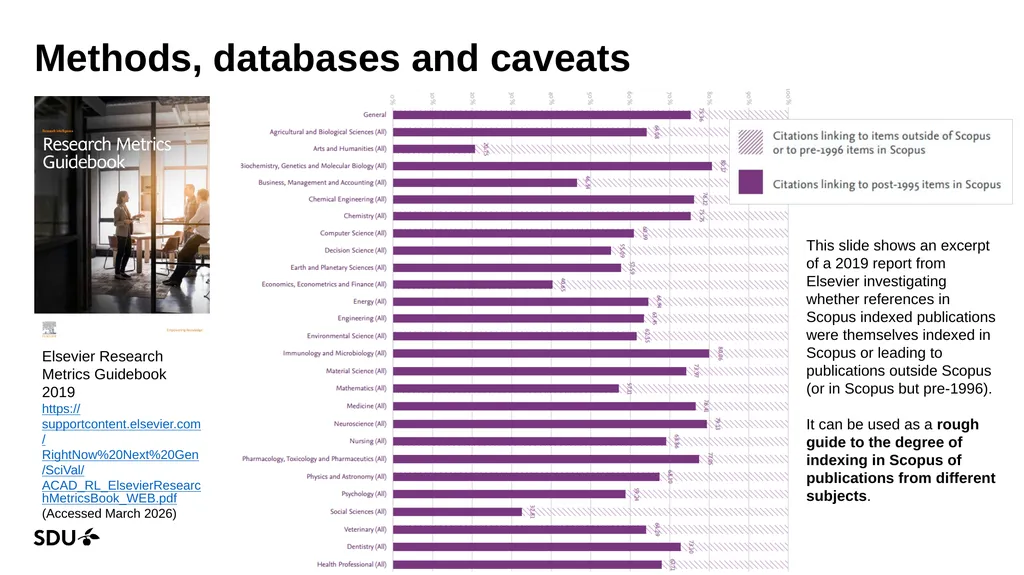
10-04-2026 Elsevier Research Metrics Guidebook 2019
https://supportcontent.elsevier.com/RightNow%20Next%20Gen/SciVal/ACAD_RL_ElsevierResearchMetricsBook_WEB.pdf
(Accessed March 2026) Methods, databases and caveats This slide shows an excerpt of a 2019 report from Elsevier investigating whether references in Scopus indexed publications were themselves indexed in Scopus or leading to publications outside Scopus (or in Scopus but pre-1996).
It can be used as a rough guide to the degree of indexing in Scopus of publications from different subjects.<br>
https://supportcontent.elsevier.com/RightNow%20Next%20Gen/SciVal/ACAD_RL_ElsevierResearchMetricsBook_WEB.pdf
(Accessed March 2026) Methods, databases and caveats This slide shows an excerpt of a 2019 report from Elsevier investigating whether references in Scopus indexed publications were themselves indexed in Scopus or leading to publications outside Scopus (or in Scopus but pre-1996).
It can be used as a rough guide to the degree of indexing in Scopus of publications from different subjects.<br>
13
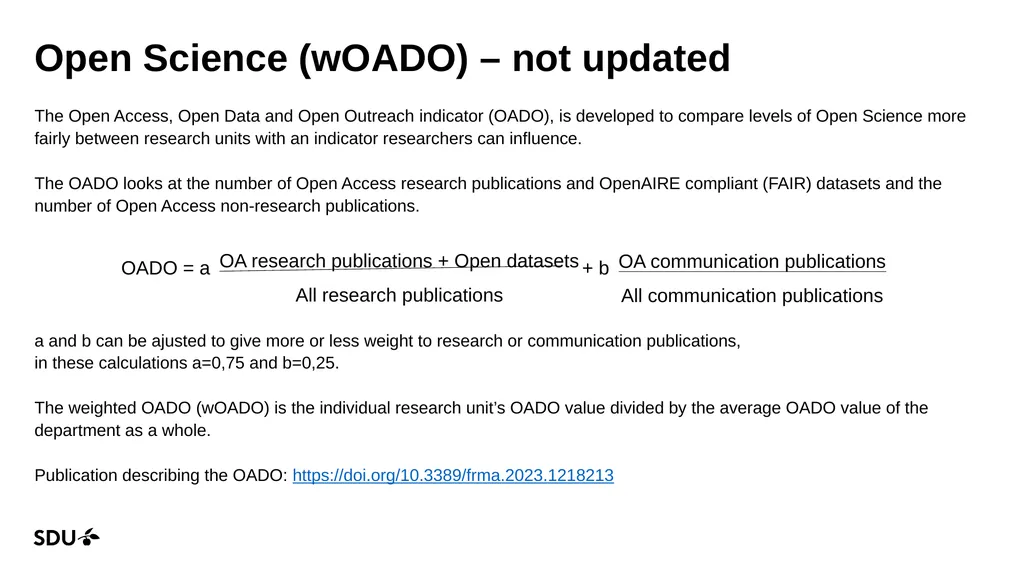
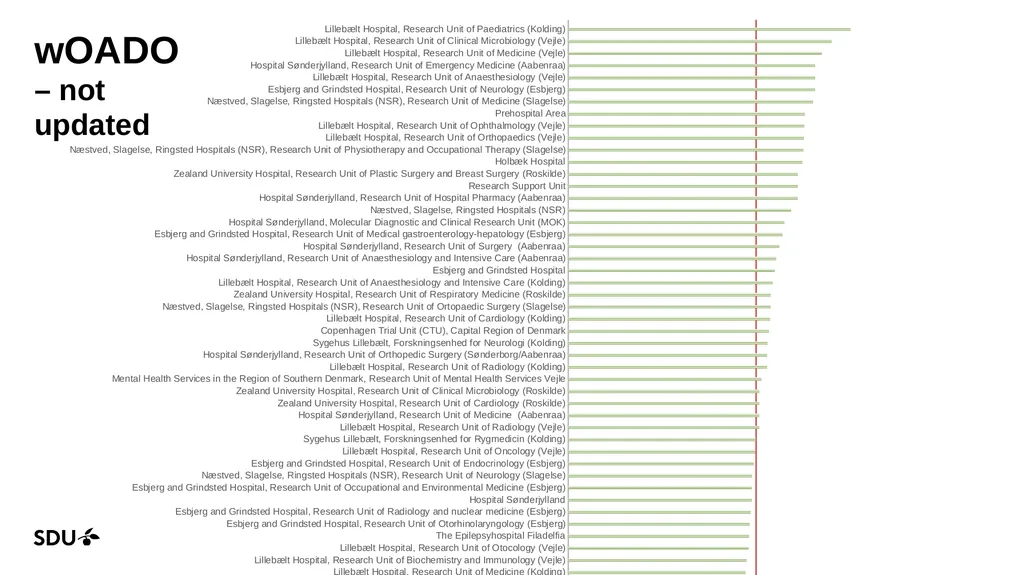
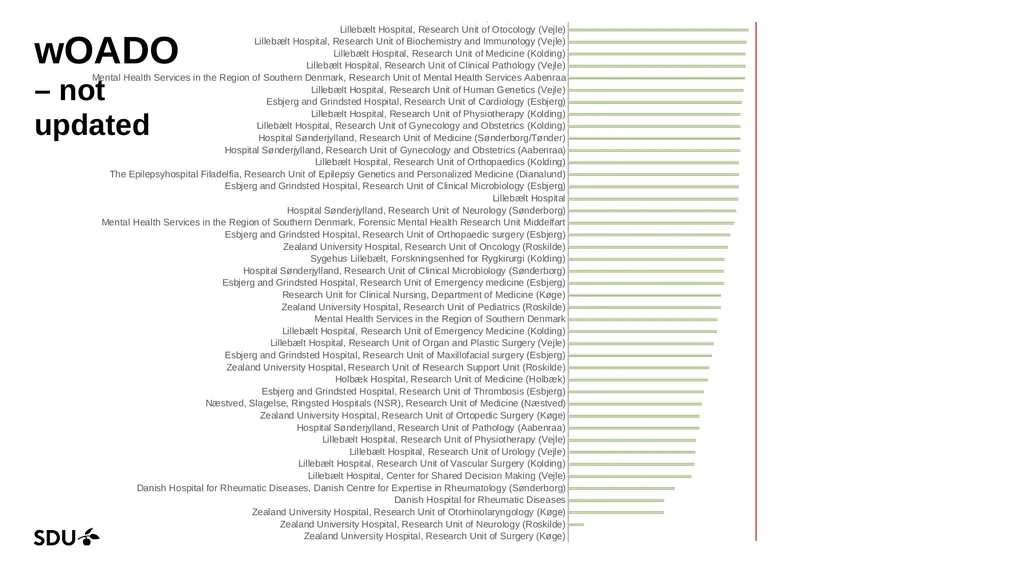
10-04-2026 13 Open Science (wOADO) – not updated The Open Access, Open Data and Open Outreach indicator (OADO), is developed to compare levels of Open Science more fairly between research units with an indicator researchers can influence.
The OADO looks at the number of Open Access research publications and OpenAIRE compliant (FAIR) datasets and the number of Open Access non-research publications.
a and b can be ajusted to give more or less weight to research or communication publications,
in these calculations a=0,75 and b=0,25.
The weighted OADO (wOADO) is the individual research unit’s OADO value divided by the average OADO value of the department as a whole.
Publication describing the OADO: https://doi.org/10.3389/frma.2023.1218213<br>
The OADO looks at the number of Open Access research publications and OpenAIRE compliant (FAIR) datasets and the number of Open Access non-research publications.
a and b can be ajusted to give more or less weight to research or communication publications,
in these calculations a=0,75 and b=0,25.
The weighted OADO (wOADO) is the individual research unit’s OADO value divided by the average OADO value of the department as a whole.
Publication describing the OADO: https://doi.org/10.3389/frma.2023.1218213<br>
14
10-04-2026 14 wOADO – not updated<br>
15
10-04-2026 15 wOADO – not updated<br>
16
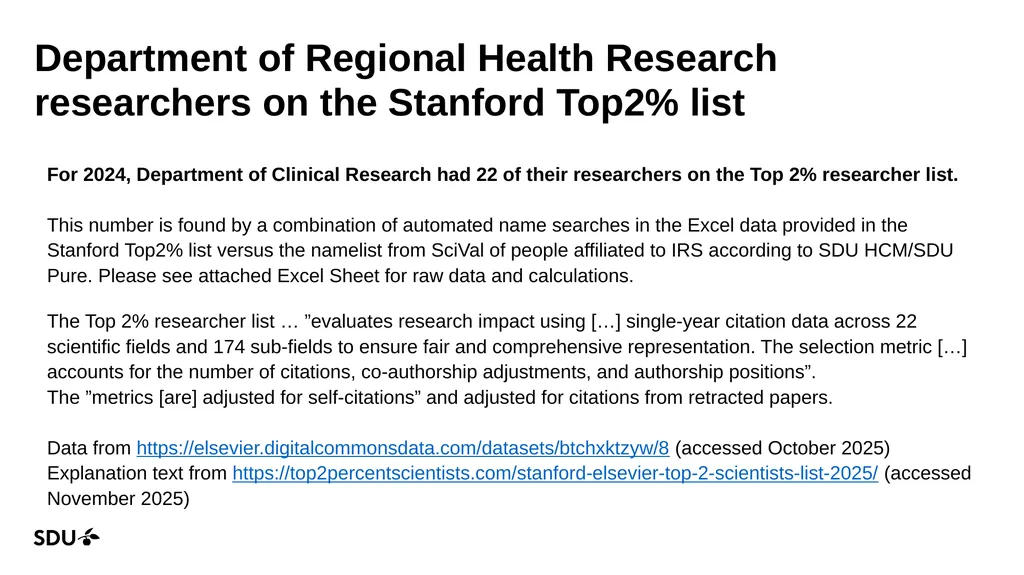
10-04-2026 16 Department of Regional Health Research researchers on the Stanford Top2% list The Top 2% researcher list … ”evaluates research impact using […] single-year citation data across 22 scientific fields and 174 sub-fields to ensure fair and comprehensive representation. The selection metric […] accounts for the number of citations, co-authorship adjustments, and authorship positions”.
The ”metrics [are] adjusted for self-citations” and adjusted for citations from retracted papers.
Data from https://elsevier.digitalcommonsdata.com/datasets/btchxktzyw/8 (accessed October 2025)
Explanation text from https://top2percentscientists.com/stanford-elsevier-top-2-scientists-list-2025/ (accessed November 2025) For 2024, Department of Clinical Research had 22 of their researchers on the Top 2% researcher list.
This number is found by a combination of automated name searches in the Excel data provided in the Stanford Top2% list versus the namelist from SciVal of people affiliated to IRS according to SDU HCM/SDU Pure. Please see attached Excel Sheet for raw data and calculations.<br>
The ”metrics [are] adjusted for self-citations” and adjusted for citations from retracted papers.
Data from https://elsevier.digitalcommonsdata.com/datasets/btchxktzyw/8 (accessed October 2025)
Explanation text from https://top2percentscientists.com/stanford-elsevier-top-2-scientists-list-2025/ (accessed November 2025) For 2024, Department of Clinical Research had 22 of their researchers on the Top 2% researcher list.
This number is found by a combination of automated name searches in the Excel data provided in the Stanford Top2% list versus the namelist from SciVal of people affiliated to IRS according to SDU HCM/SDU Pure. Please see attached Excel Sheet for raw data and calculations.<br>