04
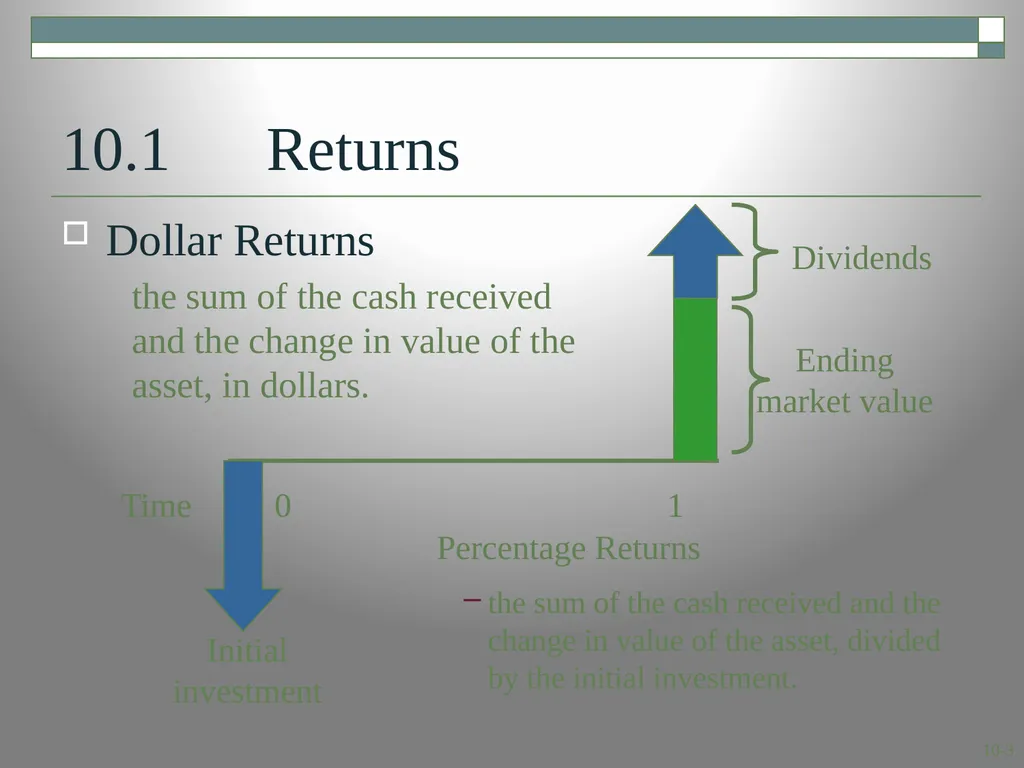
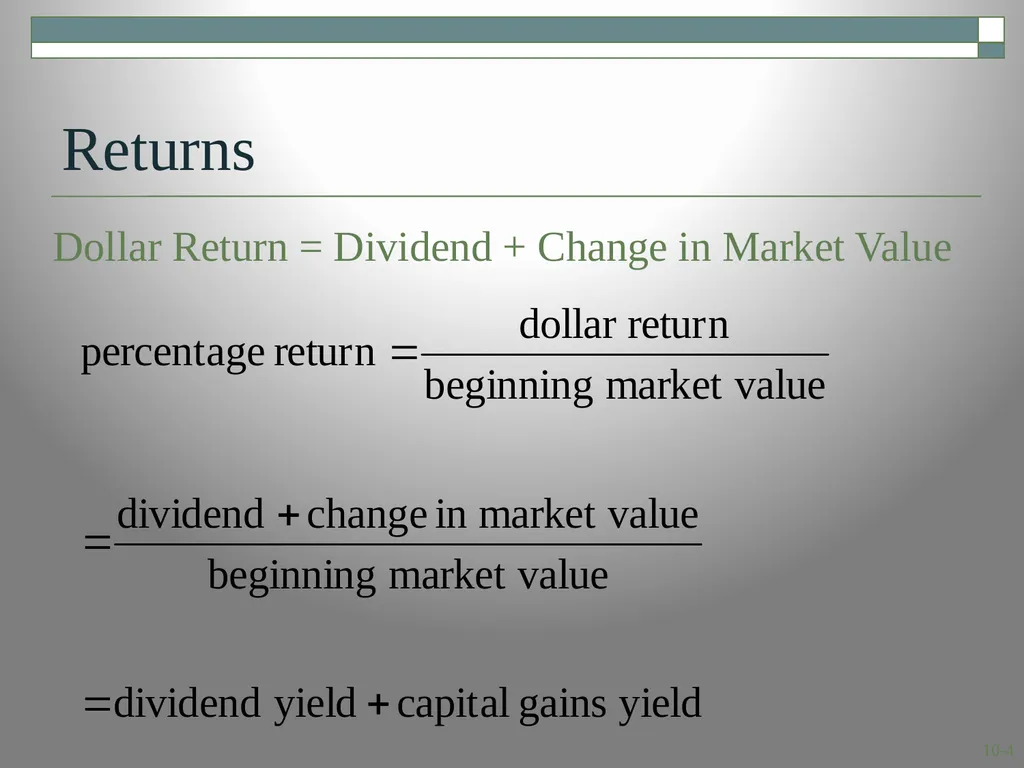
Dollar Return = Dividend + Change in Market Value Returns<br>
05
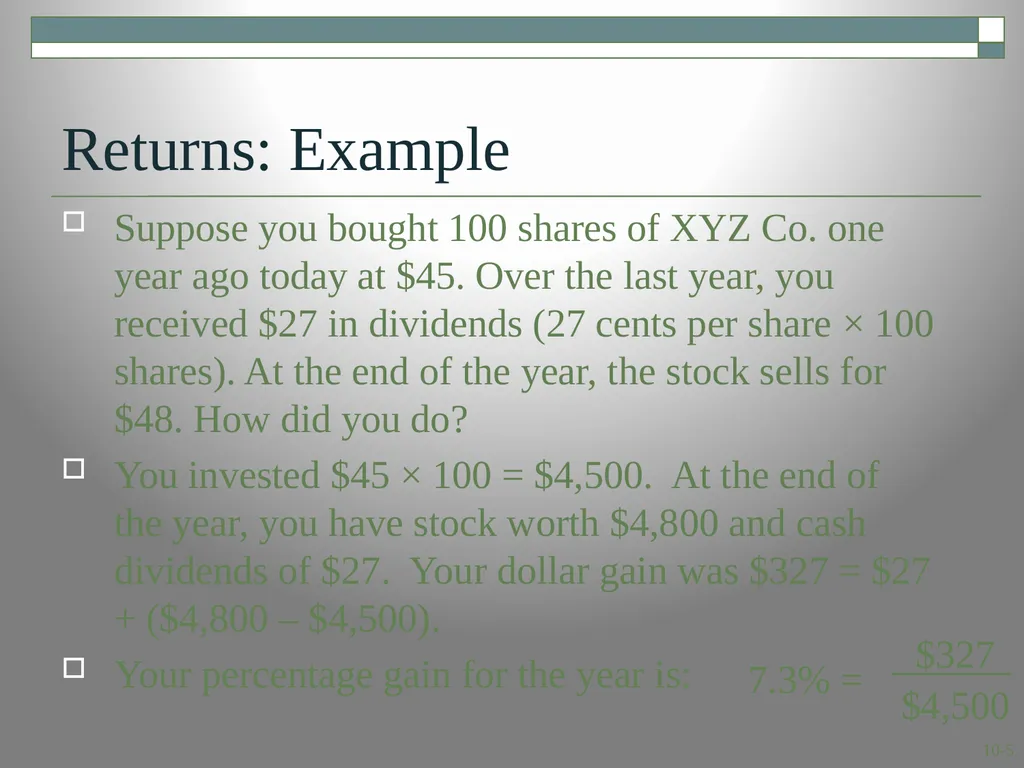
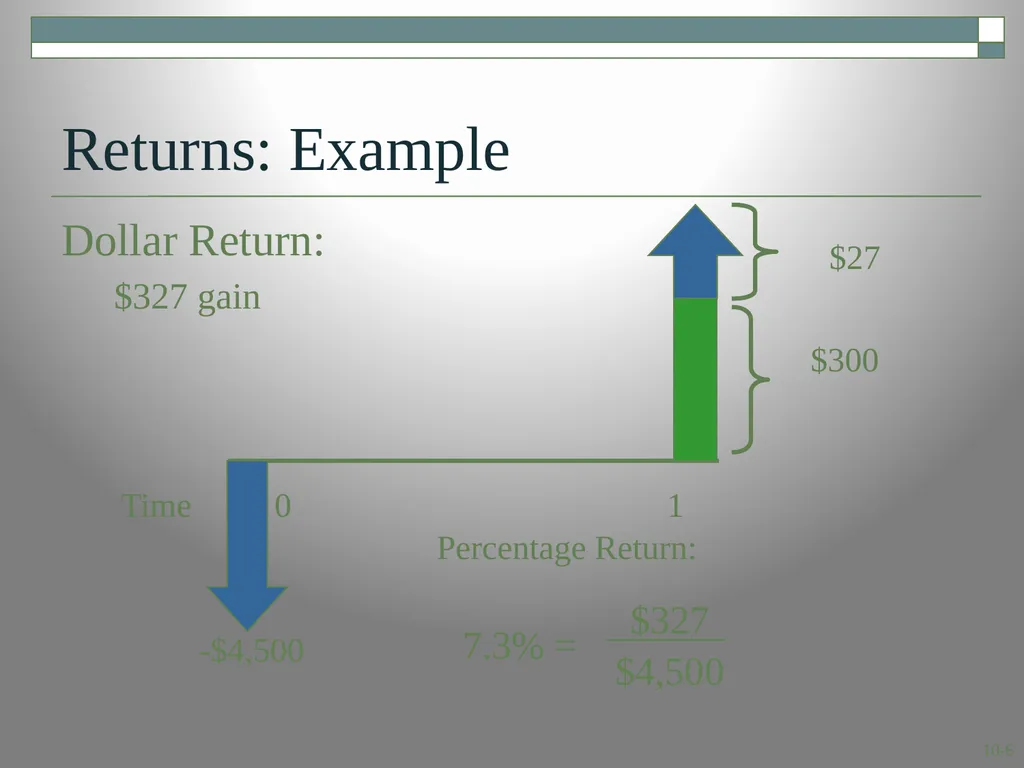
Returns: Example Suppose you bought 100 shares of XYZ Co. one year ago today at $45. Over the last year, you received $27 in dividends (27 cents per share × 100 shares). At the end of the year, the stock sells for $48. How did you do?
You invested $45 × 100 = $4,500. At the end of the year, you have stock worth $4,800 and cash dividends of $27. Your dollar gain was $327 = $27 + ($4,800 – $4,500).
Your percentage gain for the year is:<br>
06
Returns: Example Dollar Return:
$327 gain Percentage Return:<br>
07
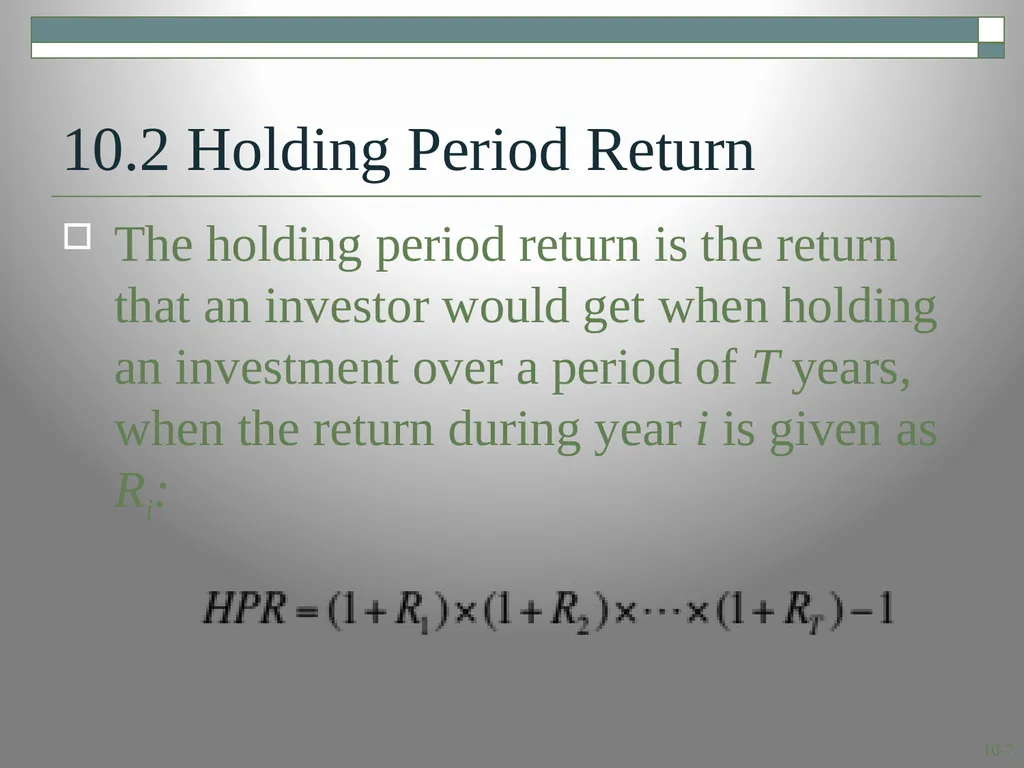
10.2 Holding Period Return The holding period return is the return that an investor would get when holding an investment over a period of T years, when the return during year i is given as Ri:<br>
08
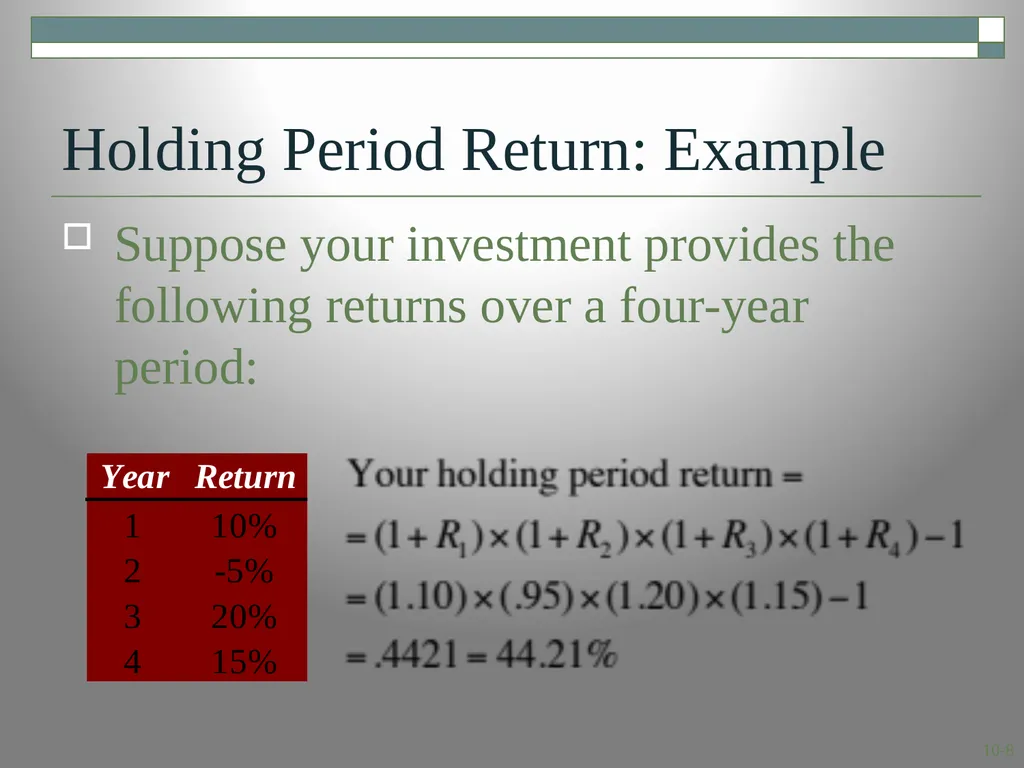
Holding Period Return: Example Suppose your investment provides the following returns over a four-year period:<br>
09
Historical Returns A famous set of studies dealing with rates of returns on common stocks, bonds, and Treasury bills was conducted by Roger Ibbotson and Rex Sinquefield.
They present year-by-year historical rates of return starting in 1926 for the following five important types of financial instruments in the United States:
Large-company Common Stocks
Small-company Common Stocks
Long-term Corporate Bonds
Long-term U.S. Government Bonds
U.S. Treasury Bills<br>
10
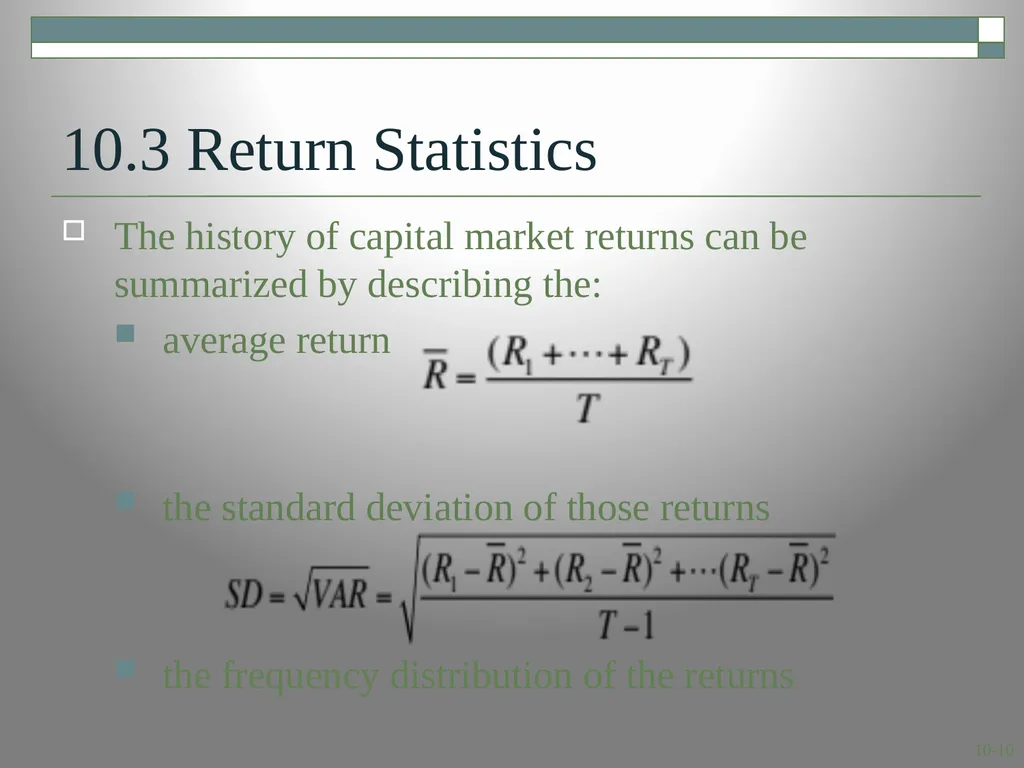
10.3 Return Statistics The history of capital market returns can be summarized by describing the:
average return
the standard deviation of those returns
the frequency distribution of the returns<br>
11
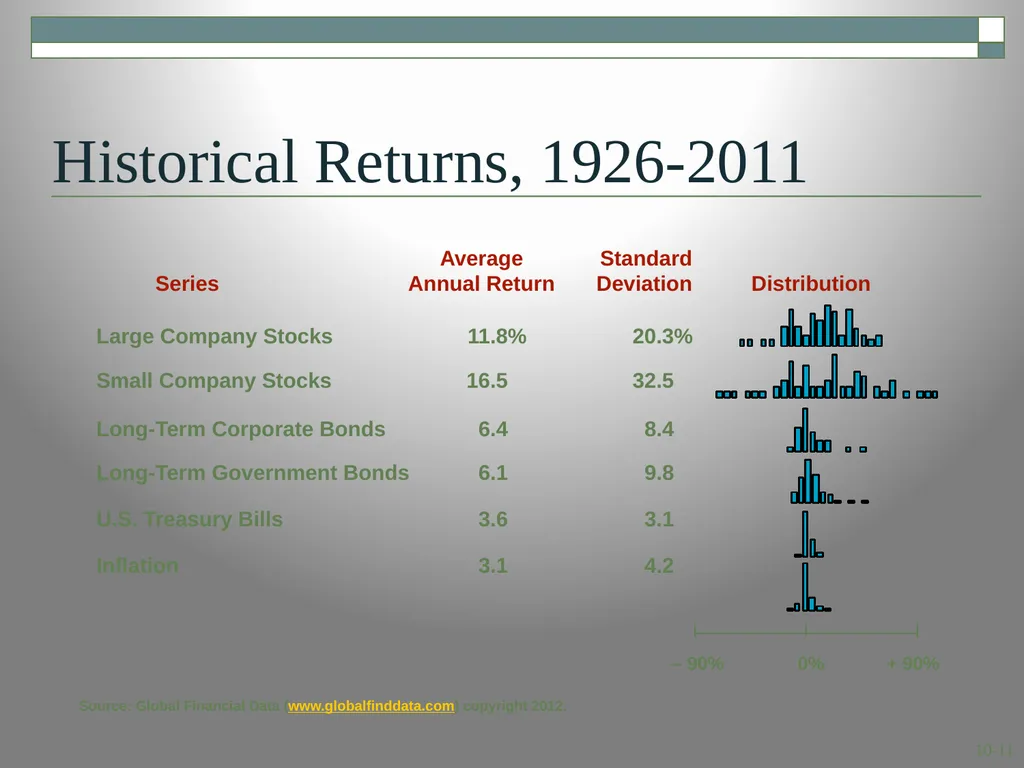
Historical Returns, 1926-2011 Source: Global Financial Data (www.globalfinddata.com) copyright 2012. – 90% + 90% 0% Average Standard� Series Annual Return Deviation Distribution
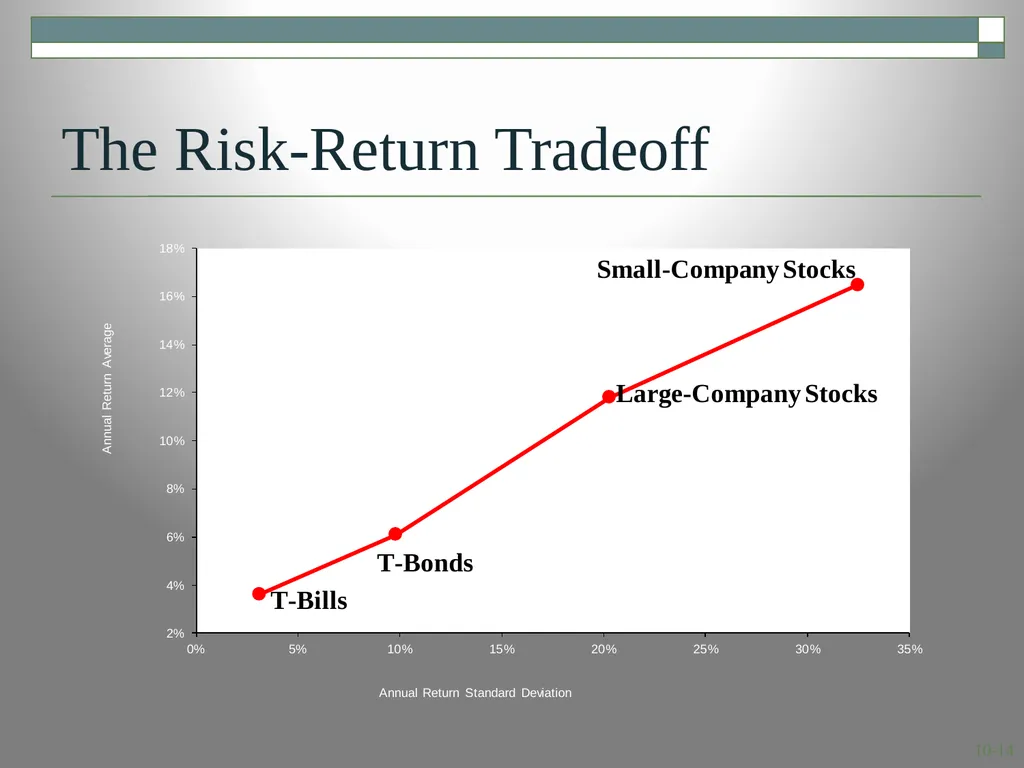
Large Company Stocks 11.8% 20.3%
Small Company Stocks 16.5 32.5
Long-Term Corporate Bonds 6.4 8.4
Long-Term Government Bonds 6.1 9.8
U.S. Treasury Bills 3.6 3.1
Inflation 3.1 4.2<br>
12
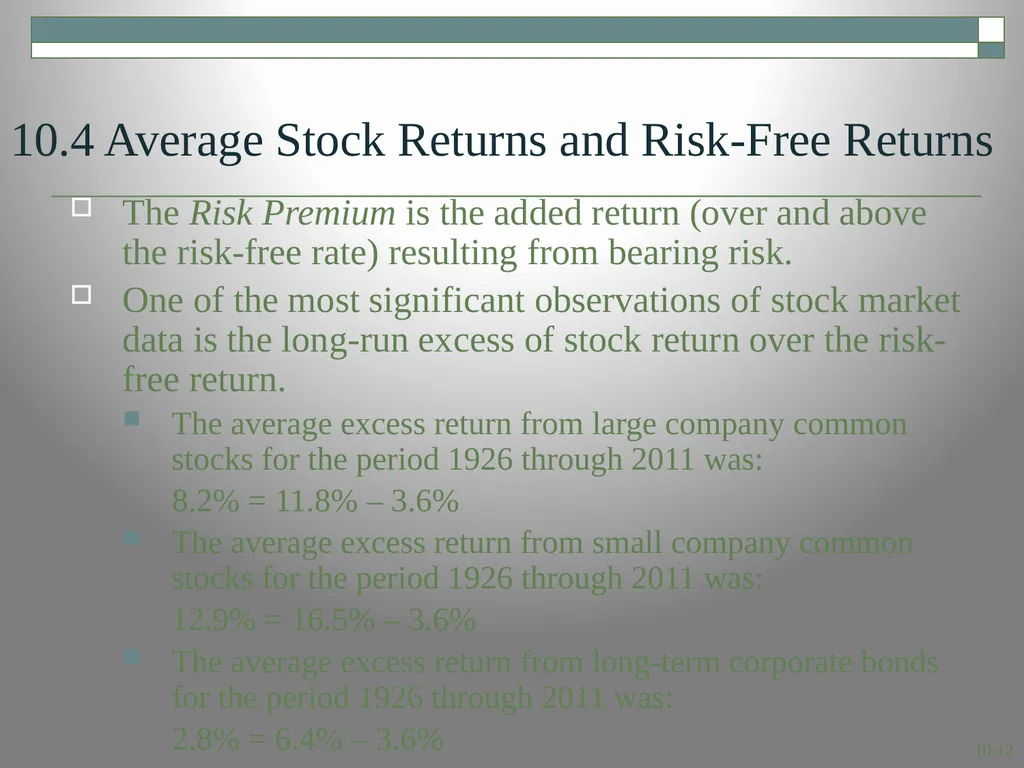
10.4 Average Stock Returns and Risk-Free Returns The Risk Premium is the added return (over and above the risk-free rate) resulting from bearing risk.
One of the most significant observations of stock market data is the long-run excess of stock return over the risk-free return.
The average excess return from large company common stocks for the period 1926 through 2011 was:
8.2% = 11.8% – 3.6%
The average excess return from small company common stocks for the period 1926 through 2011 was:
12.9% = 16.5% – 3.6%
The average excess return from long-term corporate bonds for the period 1926 through 2011 was:
2.8% = 6.4% – 3.6%<br>
13
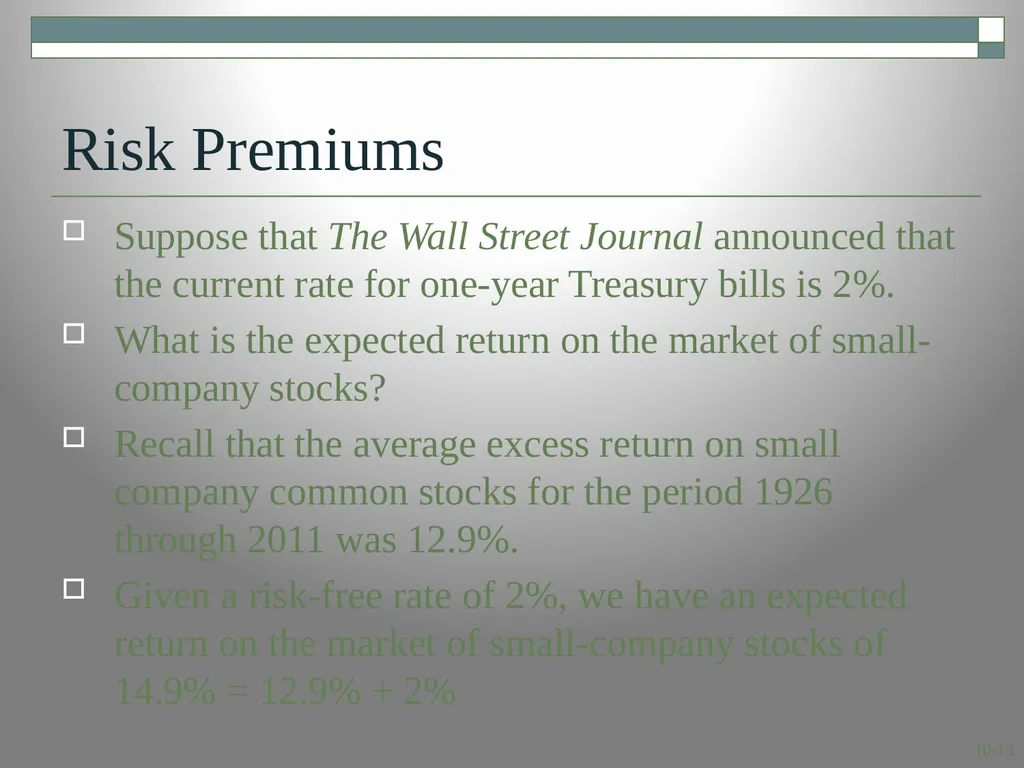
Risk Premiums Suppose that The Wall Street Journal announced that the current rate for one-year Treasury bills is 2%.
What is the expected return on the market of small-company stocks?
Recall that the average excess return on small company common stocks for the period 1926 through 2011 was 12.9%.
Given a risk-free rate of 2%, we have an expected return on the market of small-company stocks of 14.9% = 12.9% + 2%<br>
14
The Risk-Return Tradeoff<br>
15
10.5 Risk Statistics There is no universally agreed-upon definition of risk.
The measures of risk that we discuss are variance and standard deviation.
The standard deviation is the standard statistical measure of the spread of a sample.
Its interpretation is facilitated by a discussion of the normal distribution.<br>
16
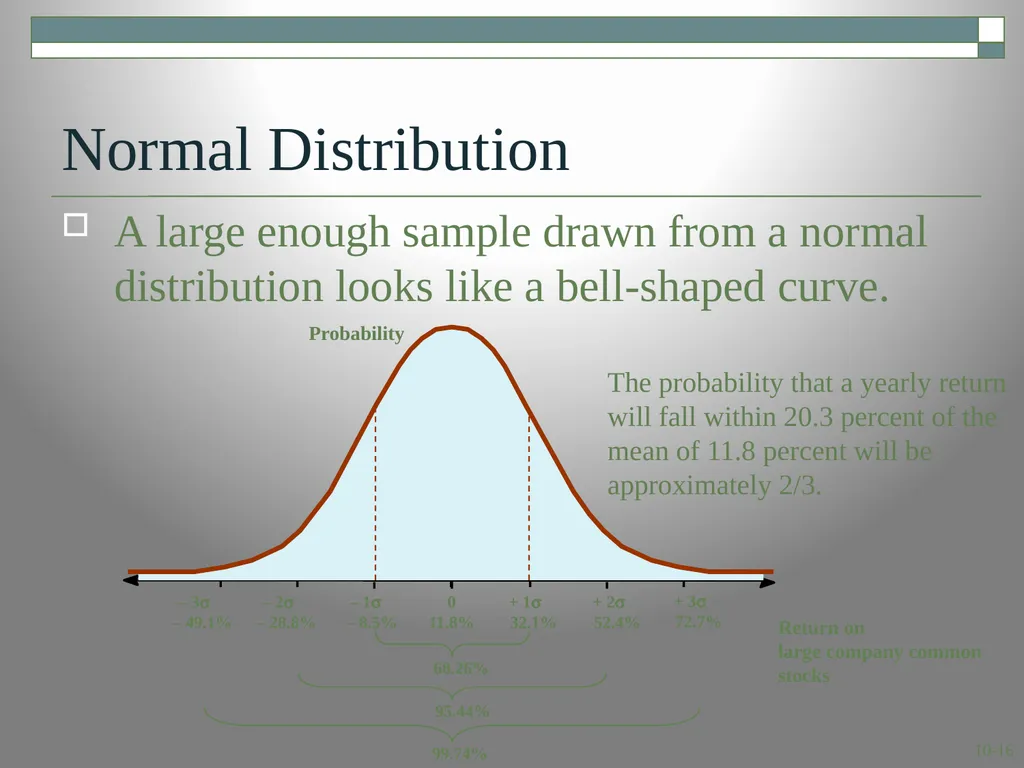
Normal Distribution A large enough sample drawn from a normal distribution looks like a bell-shaped curve. Probability Return on�large company common�stocks 99.74% – 3s �– 49.1% – 2s �– 28.8% – 1s �– 8.5% 0�11.8% + 1s �32.1% + 2s �52.4% + 3s �72.7% The probability that a yearly return will fall within 20.3 percent of the mean of 11.8 percent will be approximately 2/3. 68.26% 95.44%<br>
17
Normal Distribution The 20.3% standard deviation we found for large stock returns from 1926 through 2011 can now be interpreted in the following way:
If stock returns are approximately normally distributed, the probability that a yearly return will fall within 20.3 percent of the mean of 11.8% will be approximately 2/3.<br>
18
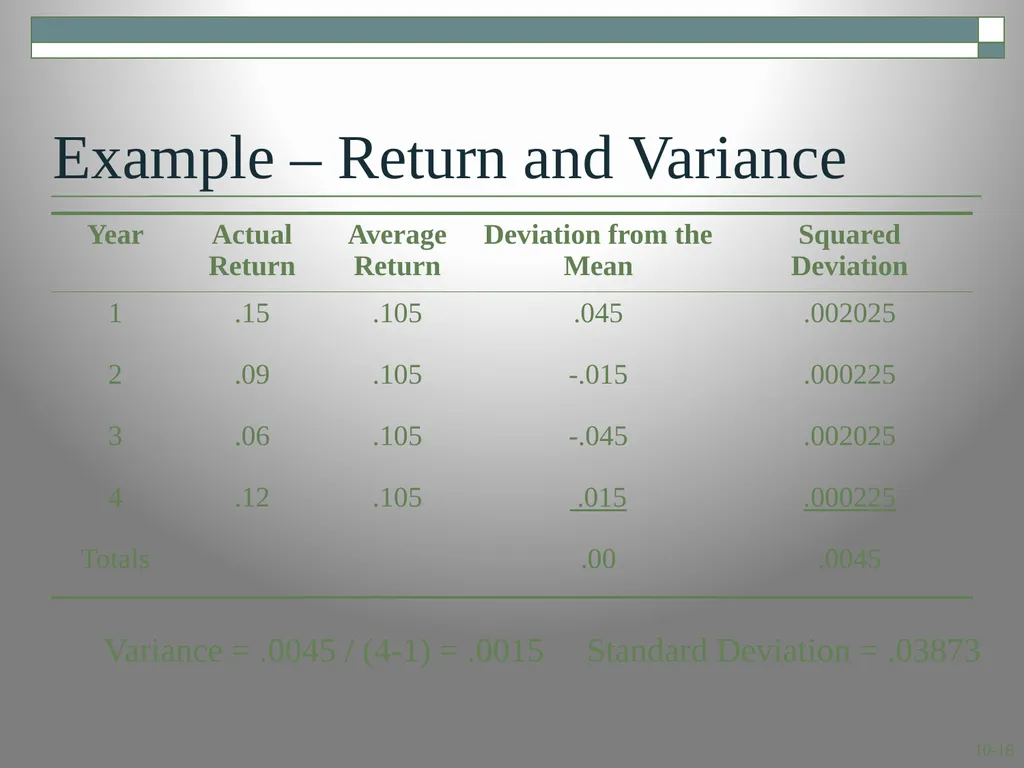
Example – Return and Variance Variance = .0045 / (4-1) = .0015 Standard Deviation = .03873<br>
19
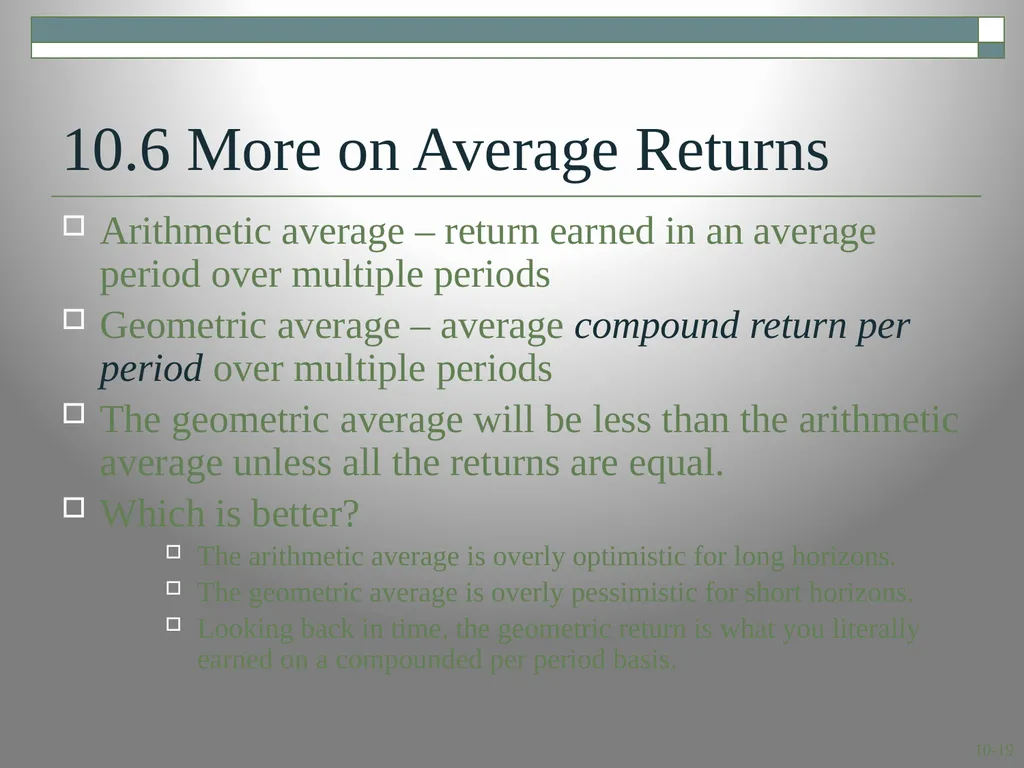
10.6 More on Average Returns Arithmetic average – return earned in an average period over multiple periods
Geometric average – average compound return per period over multiple periods
The geometric average will be less than the arithmetic average unless all the returns are equal.
Which is better?
The arithmetic average is overly optimistic for long horizons.
The geometric average is overly pessimistic for short horizons.
Looking back in time, the geometric return is what you literally earned on a compounded per period basis.<br>
20
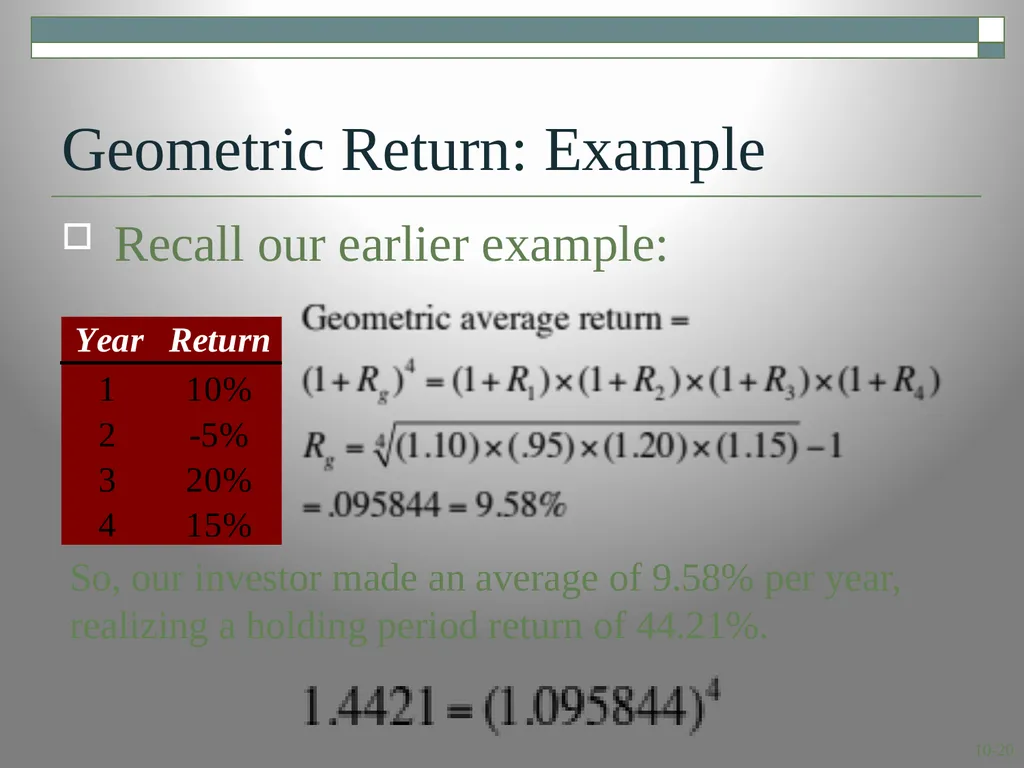
Geometric Return: Example Recall our earlier example: So, our investor made an average of 9.58% per year, realizing a holding period return of 44.21%.<br>
21
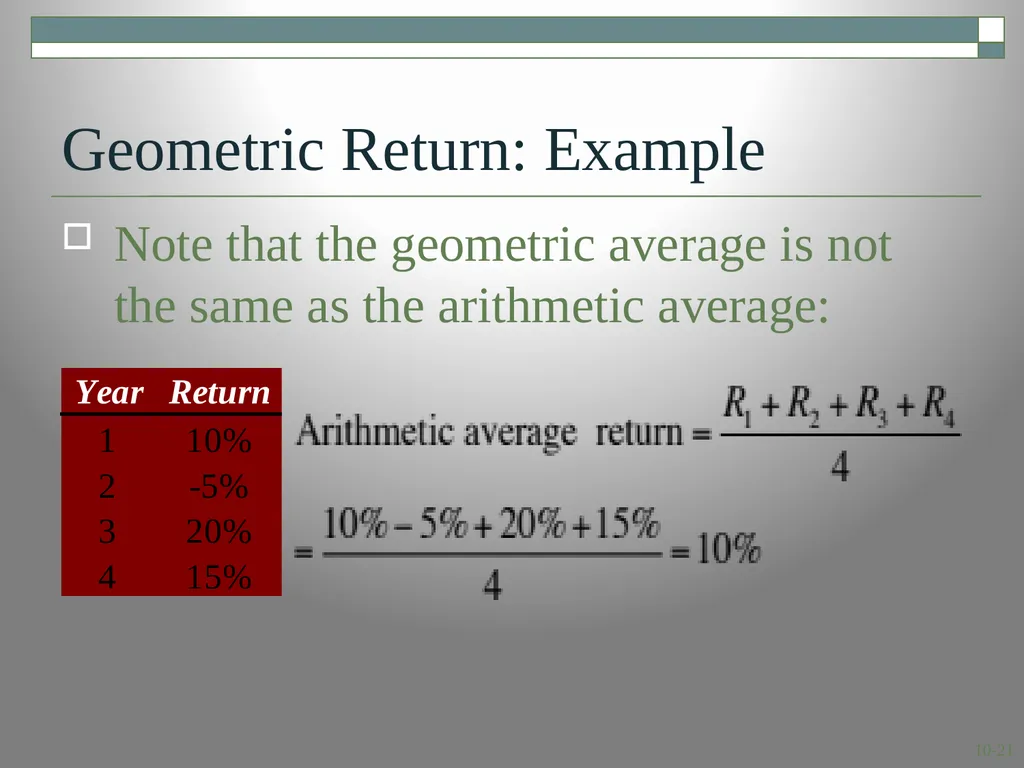
Geometric Return: Example Note that the geometric average is not the same as the arithmetic average:<br>
22
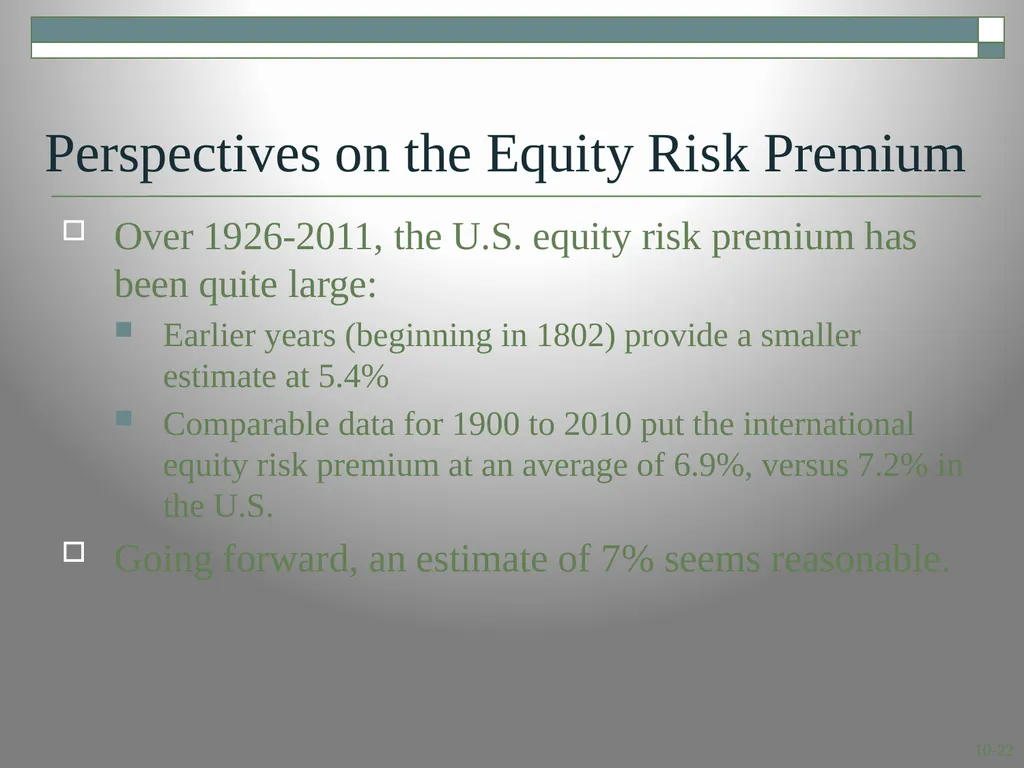
Perspectives on the Equity Risk Premium Over 1926-2011, the U.S. equity risk premium has been quite large:
Earlier years (beginning in 1802) provide a smaller estimate at 5.4%
Comparable data for 1900 to 2010 put the international equity risk premium at an average of 6.9%, versus 7.2% in the U.S.
Going forward, an estimate of 7% seems reasonable.<br>
23
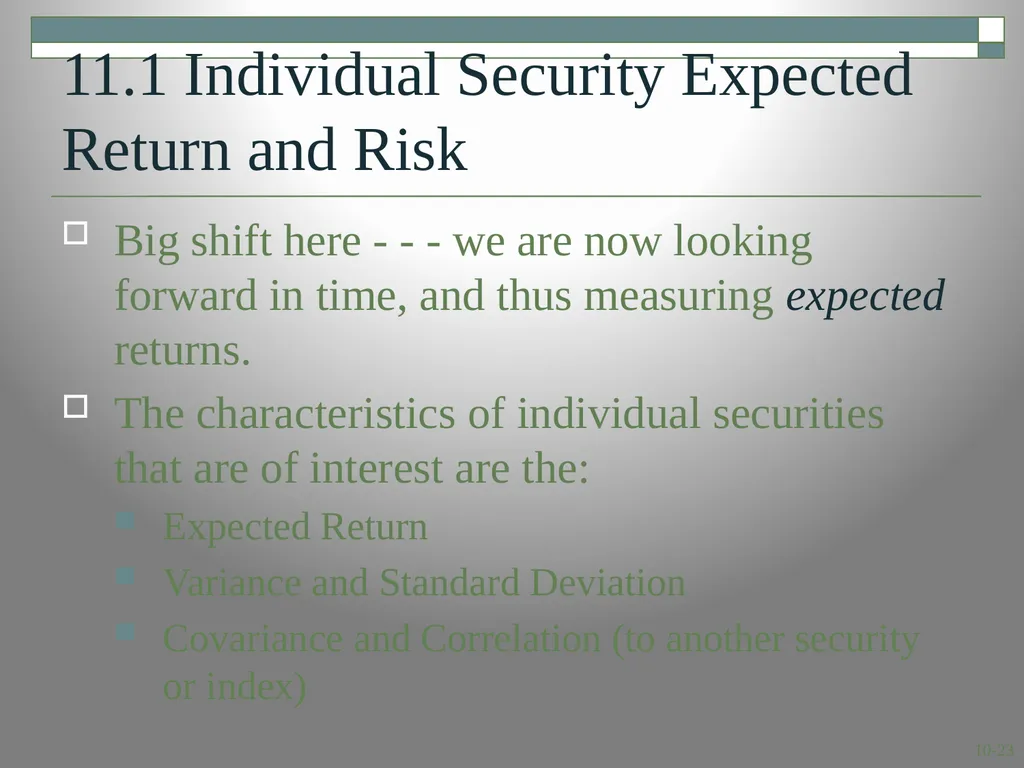
11.1 Individual Security Expected Return and Risk Big shift here - - - we are now looking forward in time, and thus measuring expected returns.
The characteristics of individual securities that are of interest are the:
Expected Return
Variance and Standard Deviation
Covariance and Correlation (to another security or index)<br>
24
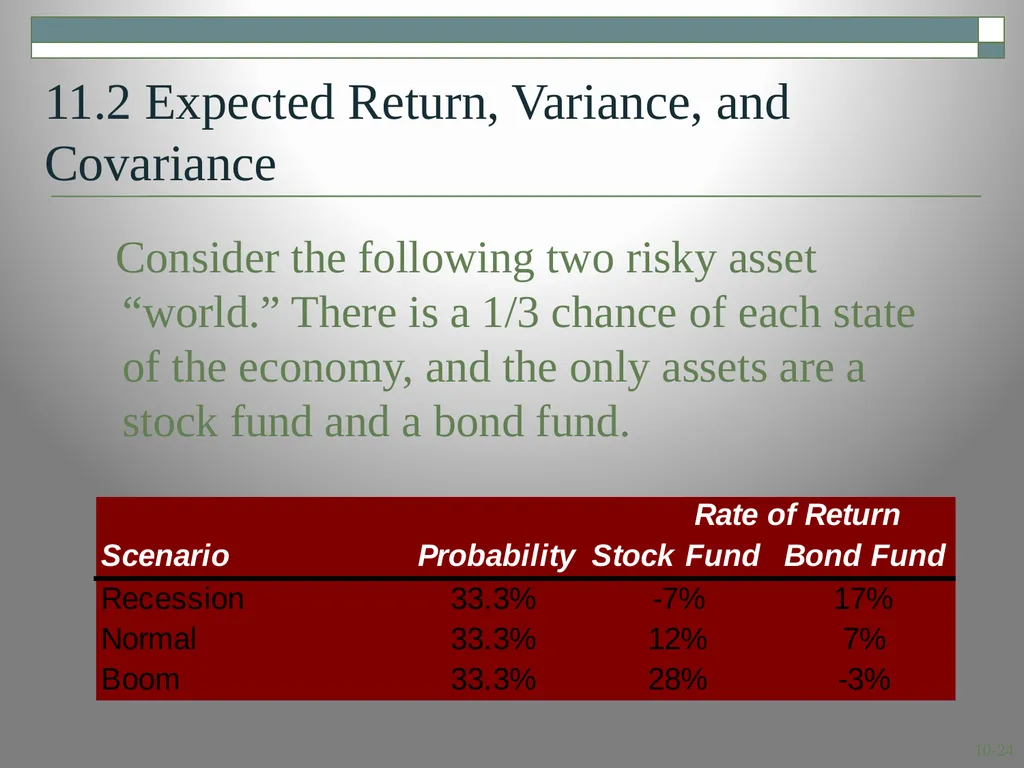
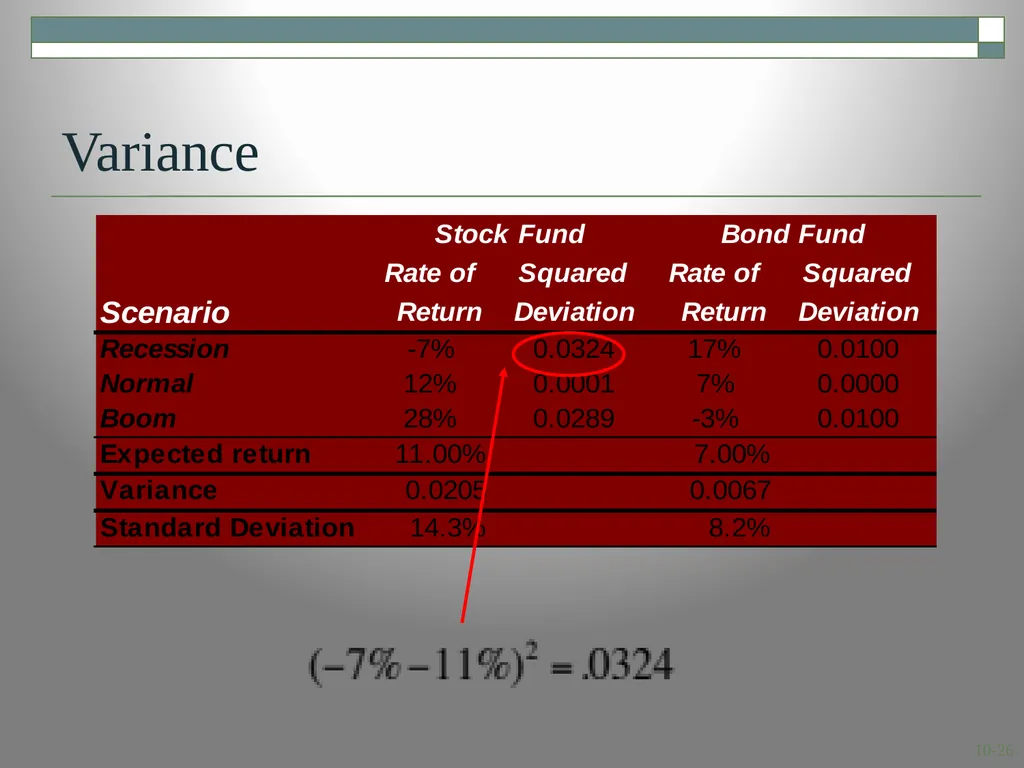
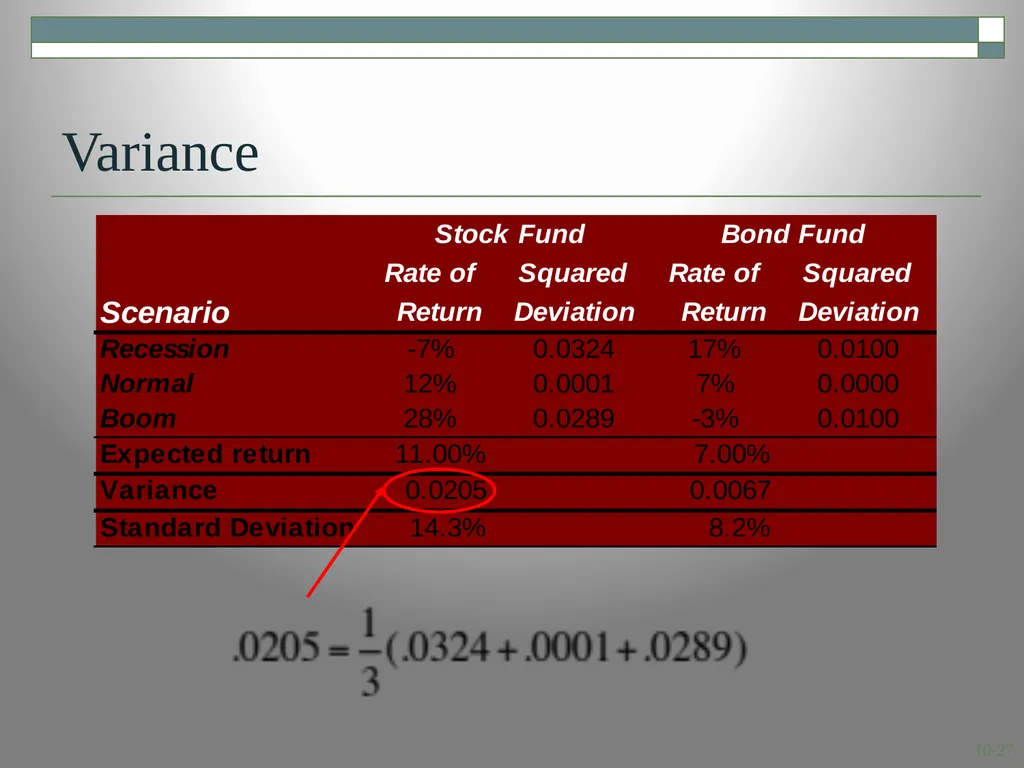
11.2 Expected Return, Variance, and Covariance Consider the following two risky asset “world.” There is a 1/3 chance of each state of the economy, and the only assets are a stock fund and a bond fund.<br>
28
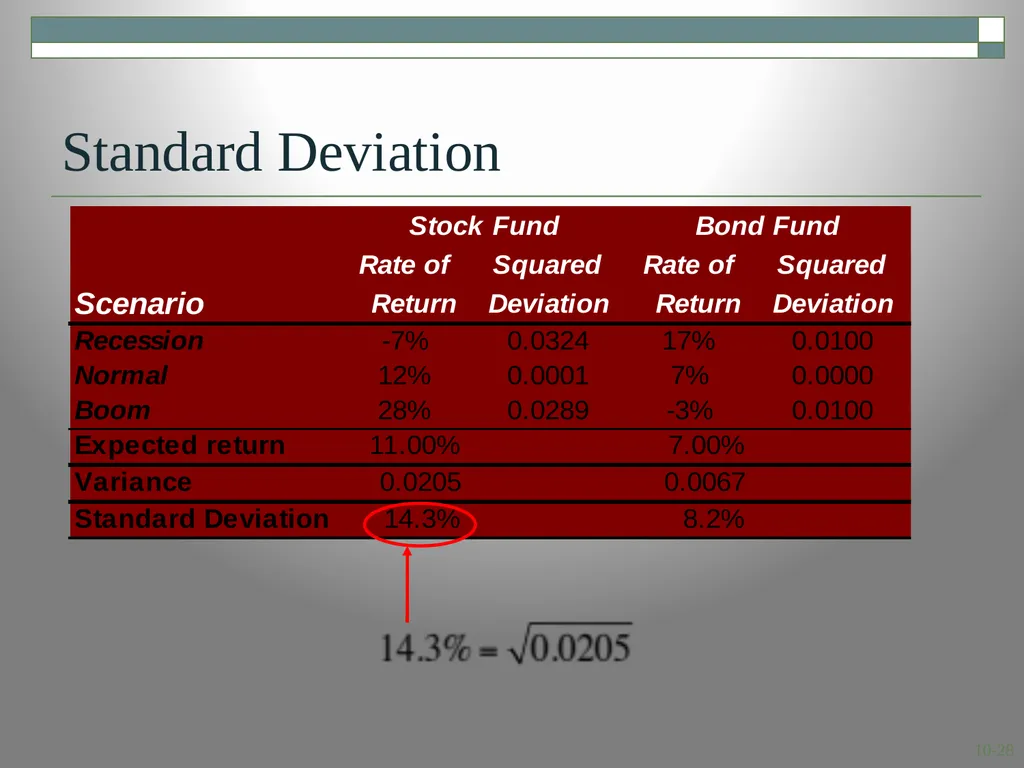
Standard Deviation<br>
29
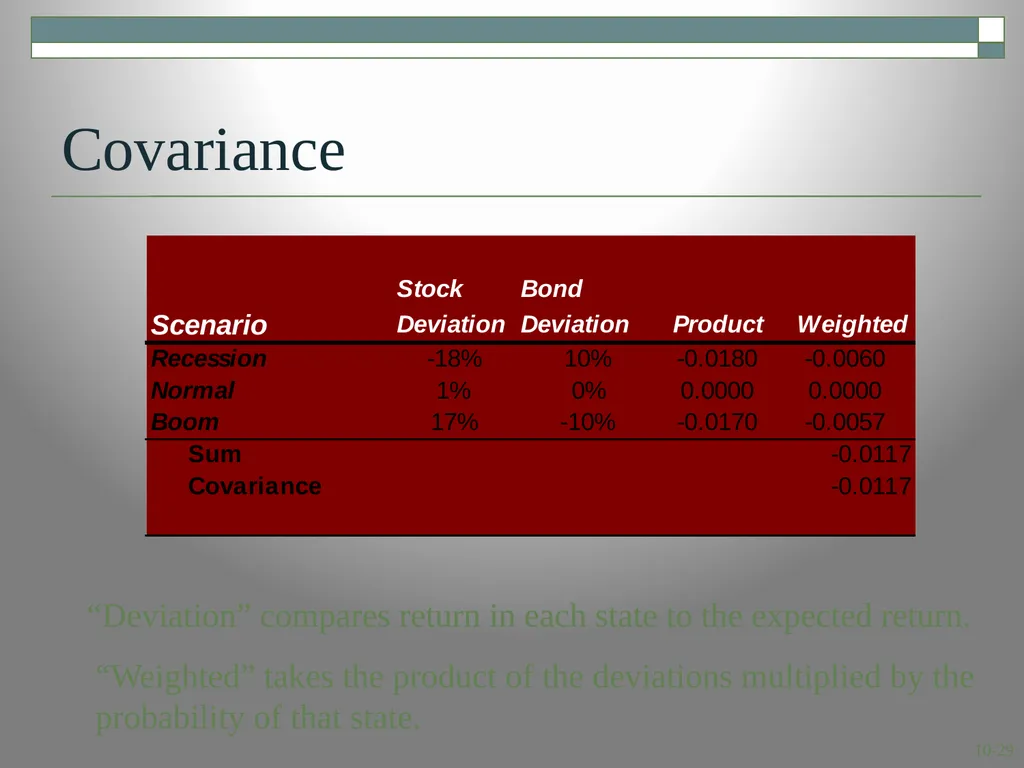
Covariance “Deviation” compares return in each state to the expected return. “Weighted” takes the product of the deviations multiplied by the probability of that state.<br>
30
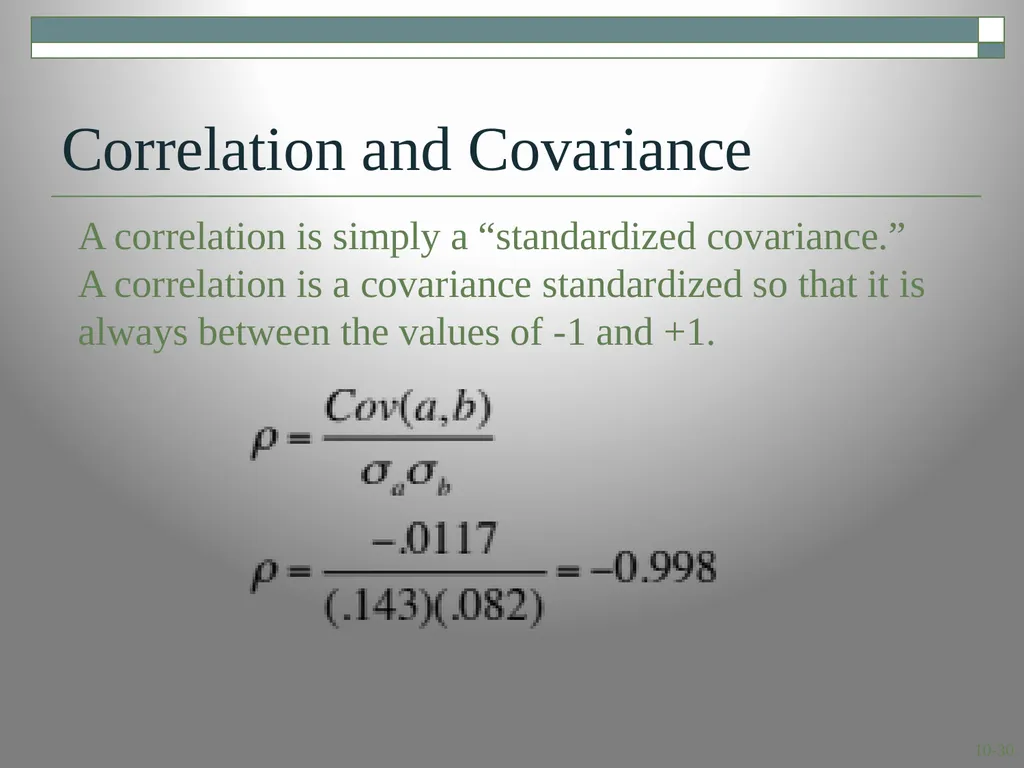
Correlation and Covariance A correlation is simply a “standardized covariance.” A correlation is a covariance standardized so that it is always between the values of -1 and +1.<br>