Russia-Ukraine War and the Global Crisis Impacts

Published  . 0 views
↓ Download
Russia-Ukraine War and the Global Crisis Impacts
1 / 1
Russia-Ukraine War and the Global Crisis Impacts - slide 1 of 9 Russia-Ukraine War and the Global Crisis Impacts - slide 2 of 9 Russia-Ukraine War and the Global Crisis Impacts - slide 3 of 9 Russia-Ukraine War and the Global Crisis Impacts - slide 4 of 9 Russia-Ukraine War and the Global Crisis Impacts - slide 5 of 9 Russia-Ukraine War and the Global Crisis Impacts - slide 6 of 9 Russia-Ukraine War and the Global Crisis Impacts - slide 7 of 9 Russia-Ukraine War and the Global Crisis Impacts - slide 8 of 9 Russia-Ukraine War and the Global Crisis Impacts - slide 9 of 9
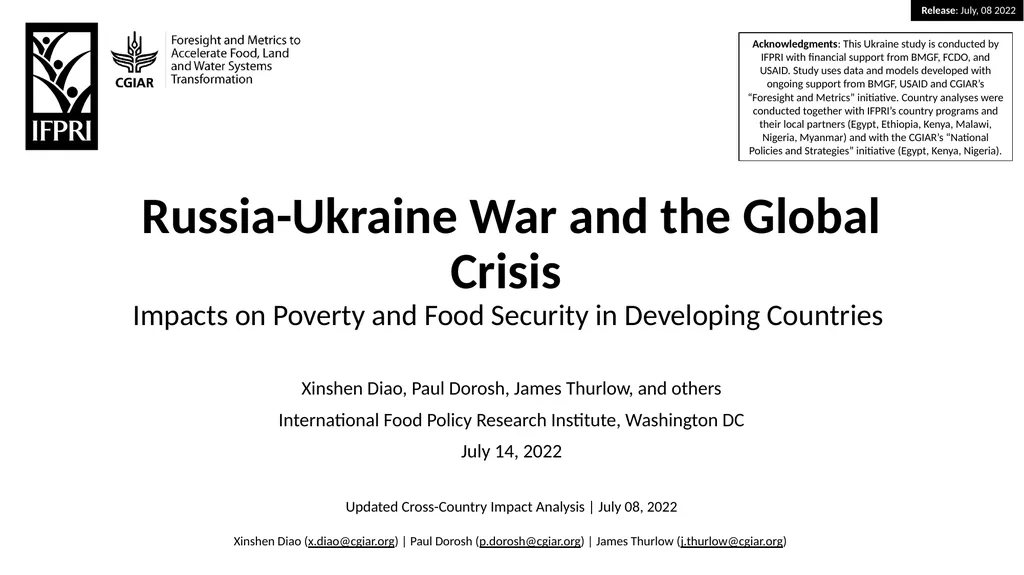
Description: Russia-Ukraine War and the Global Crisis Impacts on Poverty and Food Security in Developing Countries Xinshen Diao, Paul Dorosh, James Thurlow, and others International Food Policy Research Institute, Washington DC July 14, 2022 Updated

Related Topics

Download Presentation

"Russia-Ukraine War and the Global Crisis Impacts" is the property of its rightful owner. Permission is granted to download and print the materials on this website for personal, non-commercial use only, and to display it on your personal computer provided you do not modify the materials and that you retain all copyright notices contained in the materials. By downloading content from our website, you accept the terms of this agreement.

Presentation Transcript

slide1. Russia-Ukraine War and the Global Crisis Impacts on Poverty and Food Security in Developing Countries Xinshen Diao, Paul Dorosh, James Thurlow, and others
International Food Policy Research Institute, Washington DC
July 14, 2022

Updated Cross-Country Impact Analysis | July 08, 2022 Acknowledgments: This Ukraine study is conducted by IFPRI with financial support from BMGF, FCDO, and USAID. Study uses data and models developed with ongoing support from BMGF, USAID and CGIAR’s “Foresight and Metrics” initiative. Country analyses were conducted together with IFPRI’s country programs and their local partners (Egypt, Ethiopia, Kenya, Malawi, Nigeria, Myanmar) and with the CGIAR’s “National Policies and Strategies” initiative (Egypt, Kenya, Nigeria). Xinshen Diao (x.diao@cgiar.org) | Paul Dorosh (p.dorosh@cgiar.org) | James Thurlow (j.thurlow@cgiar.org)<br>
slide2. Overview Phase 1: Impact analysis
Use country models to assess the impacts of global shocks on economies and populations

Phase 2: Policy response analysis
Compare the effectiveness of broad policy responses by governments and their development partners

Phase 3: In-depth analysis with partners
Tailor scenarios to policy and investment options Bangladesh Cambodia DRC Egypt Ethiopia Ghana Kenya Mali Malawi Myanmar
Niger Nigeria Nepal Philippines Rwanda Senegal Tanzania Uganda Zambia Burkina Faso Guatemala Mozambique Tunisia Yemen Included Underway<br>
slide3. Shocks, Impacts and Outcomes Economy: National and agri-food system GDP

Population: Household incomes, poverty, and food security (i.e., hunger and diet quality) What is the share of the affected commodities in total trade?

How important are imports in local markets and across supply chains?

Are commodities a large part of consumer baskets?

How much fertilizer was used before the crisis, and how sensitive is fertilizer demand to rising prices? Changes in world prices for food, fuels and fertilizers

Effect of higher fertilizer prices on fertilizer use in the current cropping season (≈ 1-year time horizon)<br>
slide4. Economy | Agri-Food Systems Adversely Affected Size of economic impacts vary widely
Total GDP falls in most countries, but remains largely unchanged in some cases (e.g., Nigeria)
Agri-food system GDP falls in most countries, and usually by more than total GDP

Drivers of economic losses differ across sectors:

Rising world fuel prices are (typically) the main contributor to falling national GDP
Fuel imports are often countries’ largest import
Increase trade and transport costs for all products

Higher fertilizer prices and falling fertilizer demand drive most agri-food system GDP losses
Raises production costs and reduces productivity

World food price changes also have larger implications for agri-food system GDP Impact of world price changes on national and agri-food GDP (%)<br>
slide5. Incomes | Large Impacts on Households Household consumption (proxy for income) falls by more than GDP
Households are hit twice: rising consumer prices and falling incomes
Economies also reorient towards producing exports in order to pay for more expensive imports, reducing availability for local consumers

Consumption falls for both rural and urban households
Higher fertilizer prices affect rural households more, by reducing agricultural production/incomes
Fuel prices affect nonagricultural sectors and urban households more Impact of world price changes on household consumption (%) Contribution of world price changes to average changes in household consumption (%) Note: Unweighted average across countries<br>
slide6. Poverty | Poor Population Expands Poverty increases in all countries ($1.90 a day poverty line)
Additional 25.4 million poor people across the 19 countries

Most people falling into poverty are in rural areas (i.e., 74%)
Rural populations are larger than urban populations
Larger increase in rural poverty headcount rate (i.e., average 2.4 vs. 1.6 %-points)

Higher fertilizer prices drive most of the increase in rural poverty, whereas rising fuel prices drive urban poverty Impact of world price changes on national poverty headcount rate (%-point) Contribution of world price changes to increase in rural or urban poor population (1000s people) Urban Increase in poor population Note: Unweighted average across countries Rural<br>
slide7. Food Security | Hunger Becomes More Pervasive Number of undernourished people rises in all countries
Additional 19.2 million undernourished people across the 19 countries

Rising food prices are far more important in driving undernourishment than for poverty
Fertilizer prices are equally important for poverty and hunger Impact of world price changes on prevalence of undernourishment (%-point) Note: Unweighted average across countries Contribution of world price changes to increase in rural or urban undernourished population (1000s people) Urban Increase in undernourished population Rural Note: Calibrated to FAO’s 2019 PoU indicator<br>
slide8. Food Security | Diet Quality Deteriorates “Diet quality” is based on whether a household’s consumption meets the recommended levels for six major food groups (i.e., EAT-Lancet)

World price shocks cause diet quality to worsen for many households (i.e., individuals become deprived in at least one additional food group)
105.7 million people across the 19 countries

Higher food prices drive most of the deterioration in diets
Higher edible oil and cereal prices increase the cost of a recommended diet Population with worsening diets - deprived in at least one more food group (%) Note: Unweighted average across countries Contribution of world price changes to increase in rural or urban diet deprivation (1000s people) Urban Increase in population with deteriorating diets Rural<br>
slide9. Moving to Policy Response Phase 1
A few more developing countries being added
Validating/revising with IFPRI country programs and partners

Phase 2
Engaging governments and other partners on potential policy responses (e.g., food tax relief, fertilizer subsidies, fertilizer use efficiency, fertilizer supply chain development, social protection, etc.)

Learning so far

Focus work on policy responses in countries that are most vulnerable (e.g., large increases in poor population, higher fertilizer use, dependence on wheat and edible oil imports, etc.)

Food and fertilizer shocks are most important for poverty and food security, but their relative importance varies and, thus, so should country policy responses

Need to better identify the most affected populations, to ensure they are covered by policy responses (e.g., fertilizer use was already low amongst the poorest farmers) Poor population increases by 25 million people Undernourished population increases by 19 million people Diet quality deteriorates for 106 million people<br>