Scaling Up Graphical Model Inference View observed data and unobserved properties as random variables Graphical Models: compact graph-based encoding of probability distributions (high dimensional, with complex dependencies)
"Scaling Up Graphical Model Inference View observed" is the property of its rightful owner. Permission is granted to
download and print the materials on this website for personal, non-commercial use only, and to display it
on your personal computer provided you do not modify the materials and that you retain all copyright
notices contained in the materials. By downloading content from our website, you accept the terms of this
agreement.
Presentation Transcript
01
Scaling Up Graphical Model Inference<br>
02
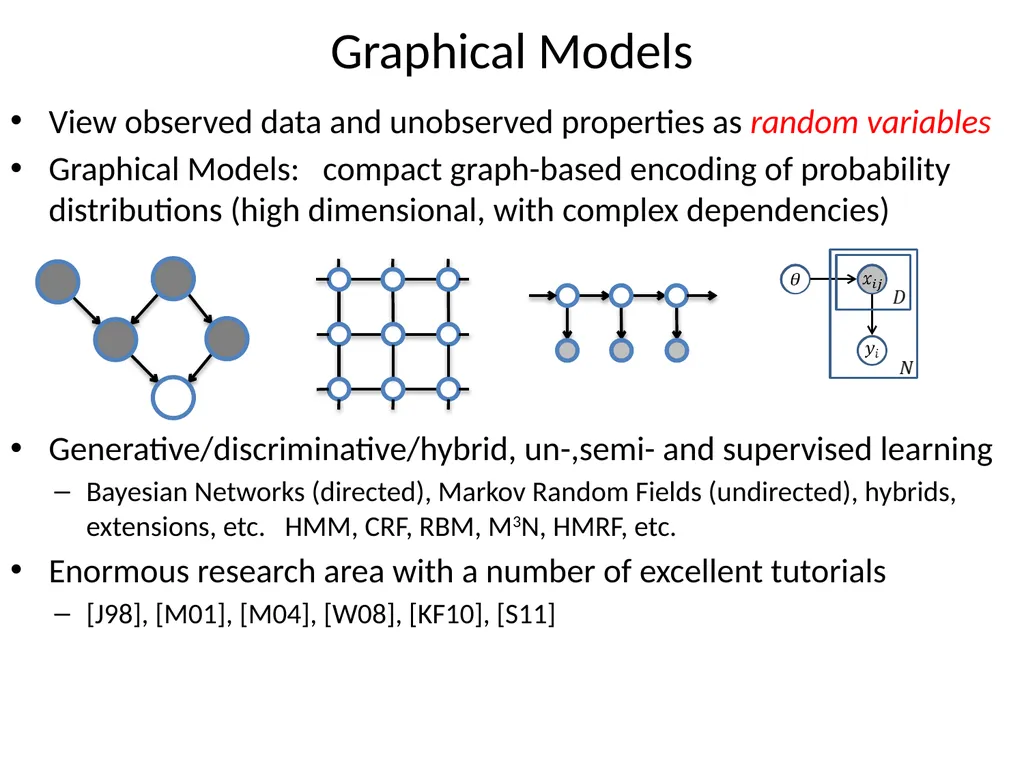
View observed data and unobserved properties as random variables
Graphical Models: compact graph-based encoding of probability distributions (high dimensional, with complex dependencies)
Generative/discriminative/hybrid, un-,semi- and supervised learning
Bayesian Networks (directed), Markov Random Fields (undirected), hybrids, extensions, etc. HMM, CRF, RBM, M3N, HMRF, etc.
Enormous research area with a number of excellent tutorials
[J98], [M01], [M04], [W08], [KF10], [S11] Graphical Models<br>
03
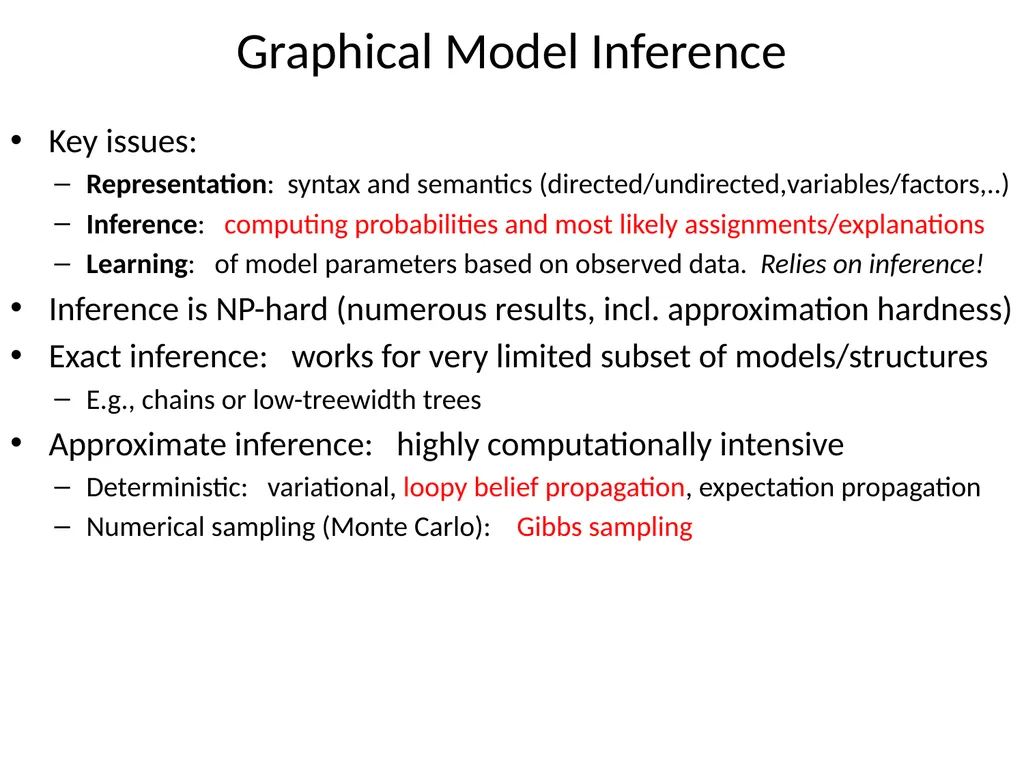
Graphical Model Inference Key issues:
Representation: syntax and semantics (directed/undirected,variables/factors,..)
Inference: computing probabilities and most likely assignments/explanations
Learning: of model parameters based on observed data. Relies on inference!
Inference is NP-hard (numerous results, incl. approximation hardness)
Exact inference: works for very limited subset of models/structures
E.g., chains or low-treewidth trees
Approximate inference: highly computationally intensive
Deterministic: variational, loopy belief propagation, expectation propagation
Numerical sampling (Monte Carlo): Gibbs sampling<br>
04
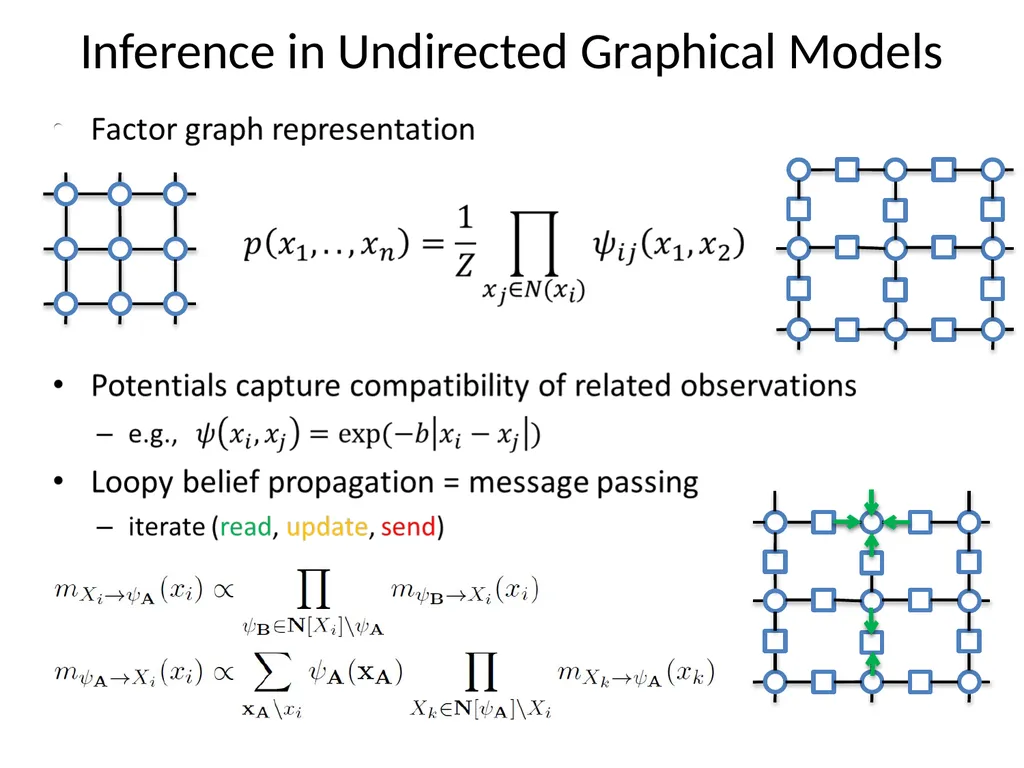
Inference in Undirected Graphical Models<br>
05
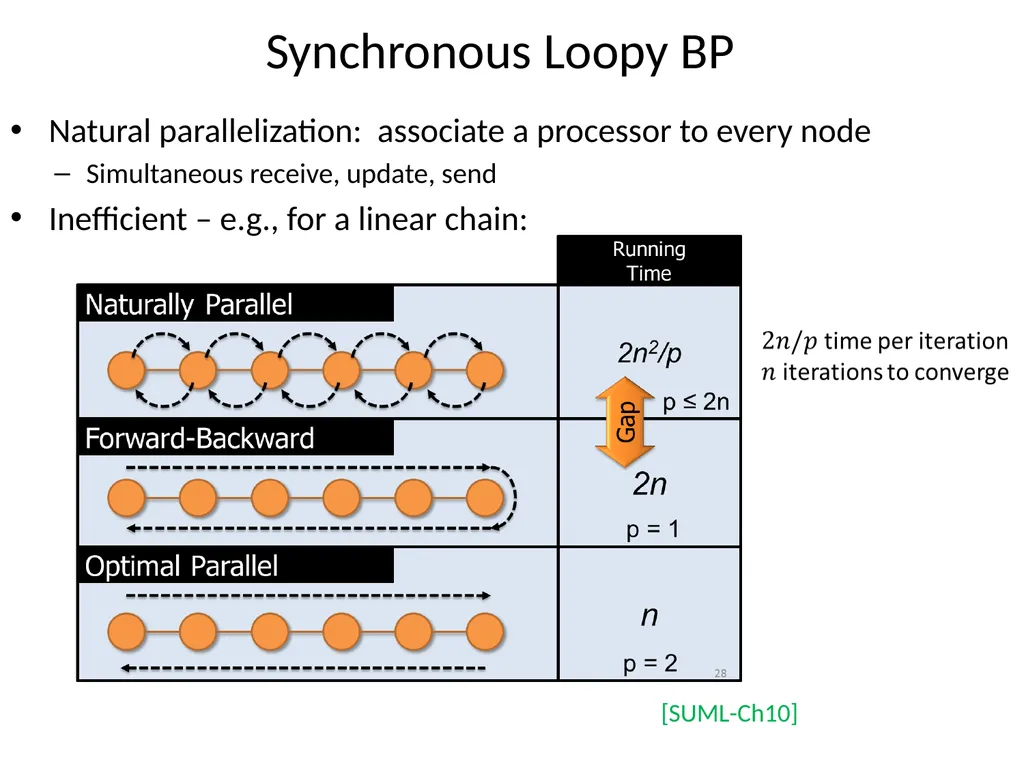
Synchronous Loopy BP Natural parallelization: associate a processor to every node
Simultaneous receive, update, send
Inefficient – e.g., for a linear chain: [SUML-Ch10]<br>
06
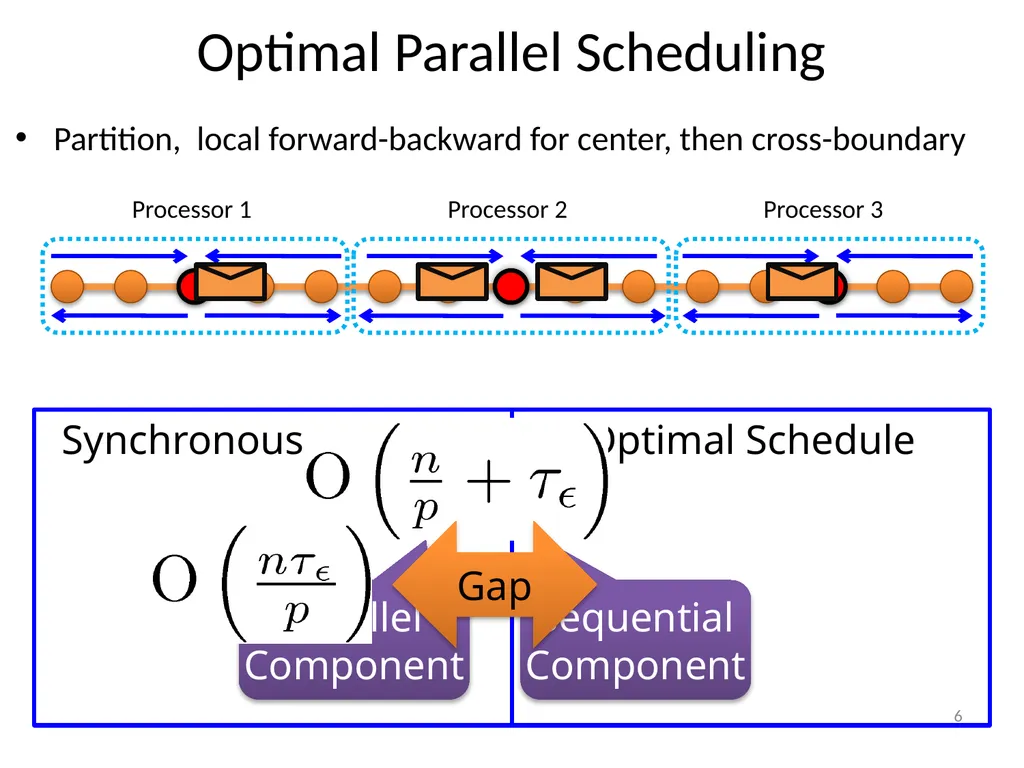
Optimal Parallel Scheduling Partition, local forward-backward for center, then cross-boundary Processor 1 Processor 2 Processor 3 Parallel
Component Sequential
Component 6 Gap<br>
07
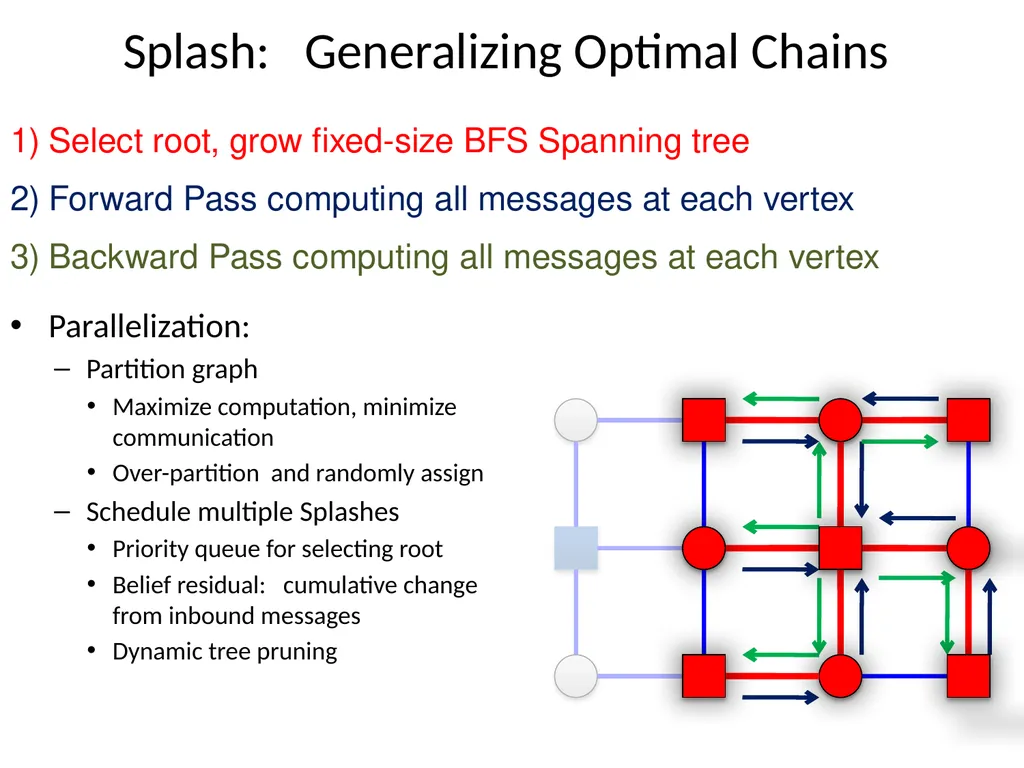
Splash: Generalizing Optimal Chains Select root, grow fixed-size BFS Spanning tree
Forward Pass computing all messages at each vertex
Backward Pass computing all messages at each vertex Parallelization:
Partition graph
Maximize computation, minimize communication
Over-partition and randomly assign
Schedule multiple Splashes
Priority queue for selecting root
Belief residual: cumulative change from inbound messages
Dynamic tree pruning<br>
08
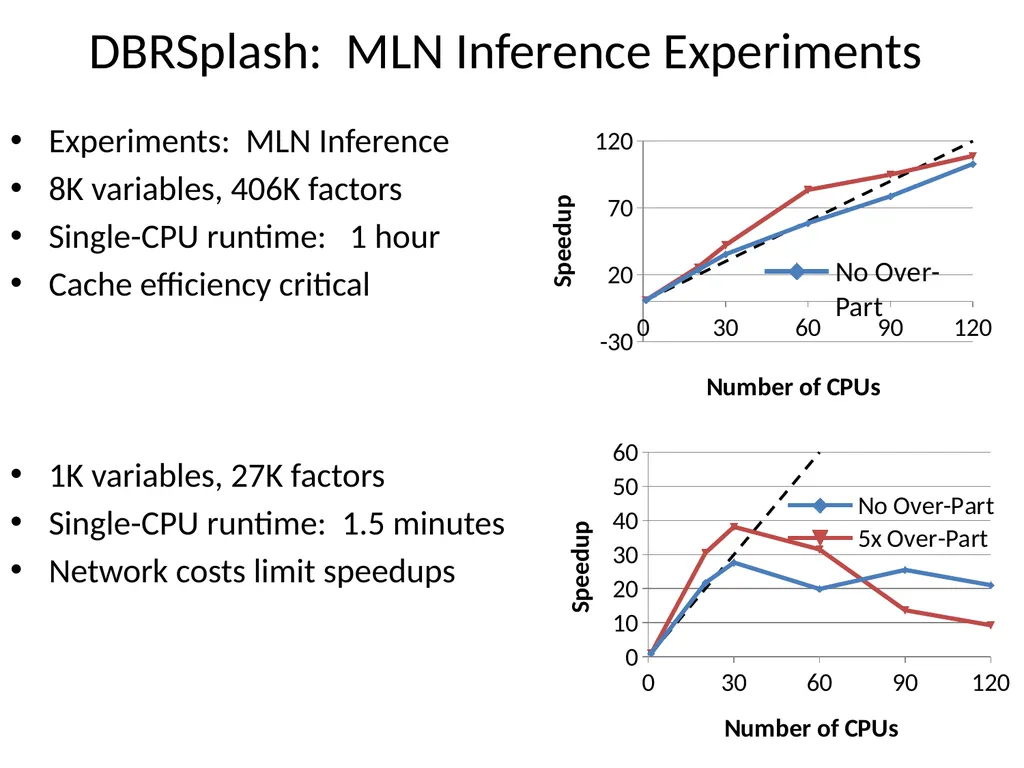
DBRSplash: MLN Inference Experiments Experiments: MLN Inference
8K variables, 406K factors
Single-CPU runtime: 1 hour
Cache efficiency critical
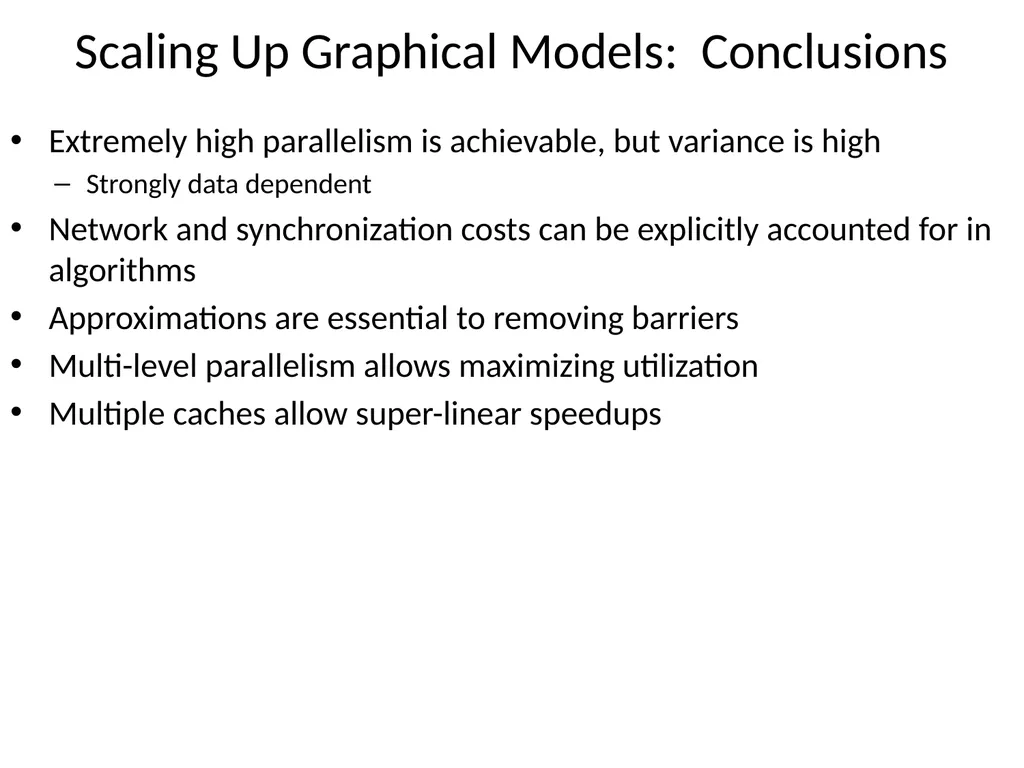
Scaling Up Graphical Models: Conclusions Extremely high parallelism is achievable, but variance is high
Strongly data dependent
Network and synchronization costs can be explicitly accounted for in algorithms
Approximations are essential to removing barriers
Multi-level parallelism allows maximizing utilization
Multiple caches allow super-linear speedups<br>
15
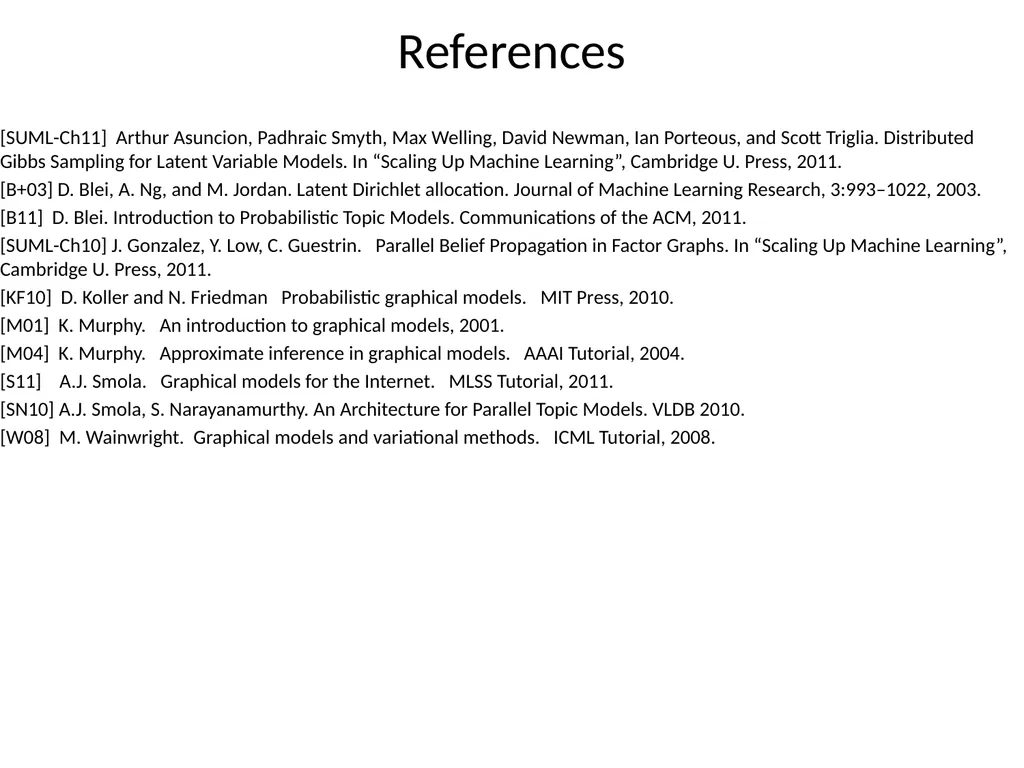
References [SUML-Ch11] Arthur Asuncion, Padhraic Smyth, Max Welling, David Newman, Ian Porteous, and Scott Triglia. Distributed Gibbs Sampling for Latent Variable Models. In “Scaling Up Machine Learning”, Cambridge U. Press, 2011.
[B+03] D. Blei, A. Ng, and M. Jordan. Latent Dirichlet allocation. Journal of Machine Learning Research, 3:993–1022, 2003.
[B11] D. Blei. Introduction to Probabilistic Topic Models. Communications of the ACM, 2011.
[SUML-Ch10] J. Gonzalez, Y. Low, C. Guestrin. Parallel Belief Propagation in Factor Graphs. In “Scaling Up Machine Learning”, Cambridge U. Press, 2011.
[KF10] D. Koller and N. Friedman Probabilistic graphical models. MIT Press, 2010.
[M01] K. Murphy. An introduction to graphical models, 2001.
[M04] K. Murphy. Approximate inference in graphical models. AAAI Tutorial, 2004.
[S11] A.J. Smola. Graphical models for the Internet. MLSS Tutorial, 2011.
[SN10] A.J. Smola, S. Narayanamurthy. An Architecture for Parallel Topic Models. VLDB 2010.
[W08] M. Wainwright. Graphical models and variational methods. ICML Tutorial, 2008.<br>